NAOJ GW Elog Logbook 3.2

What I did
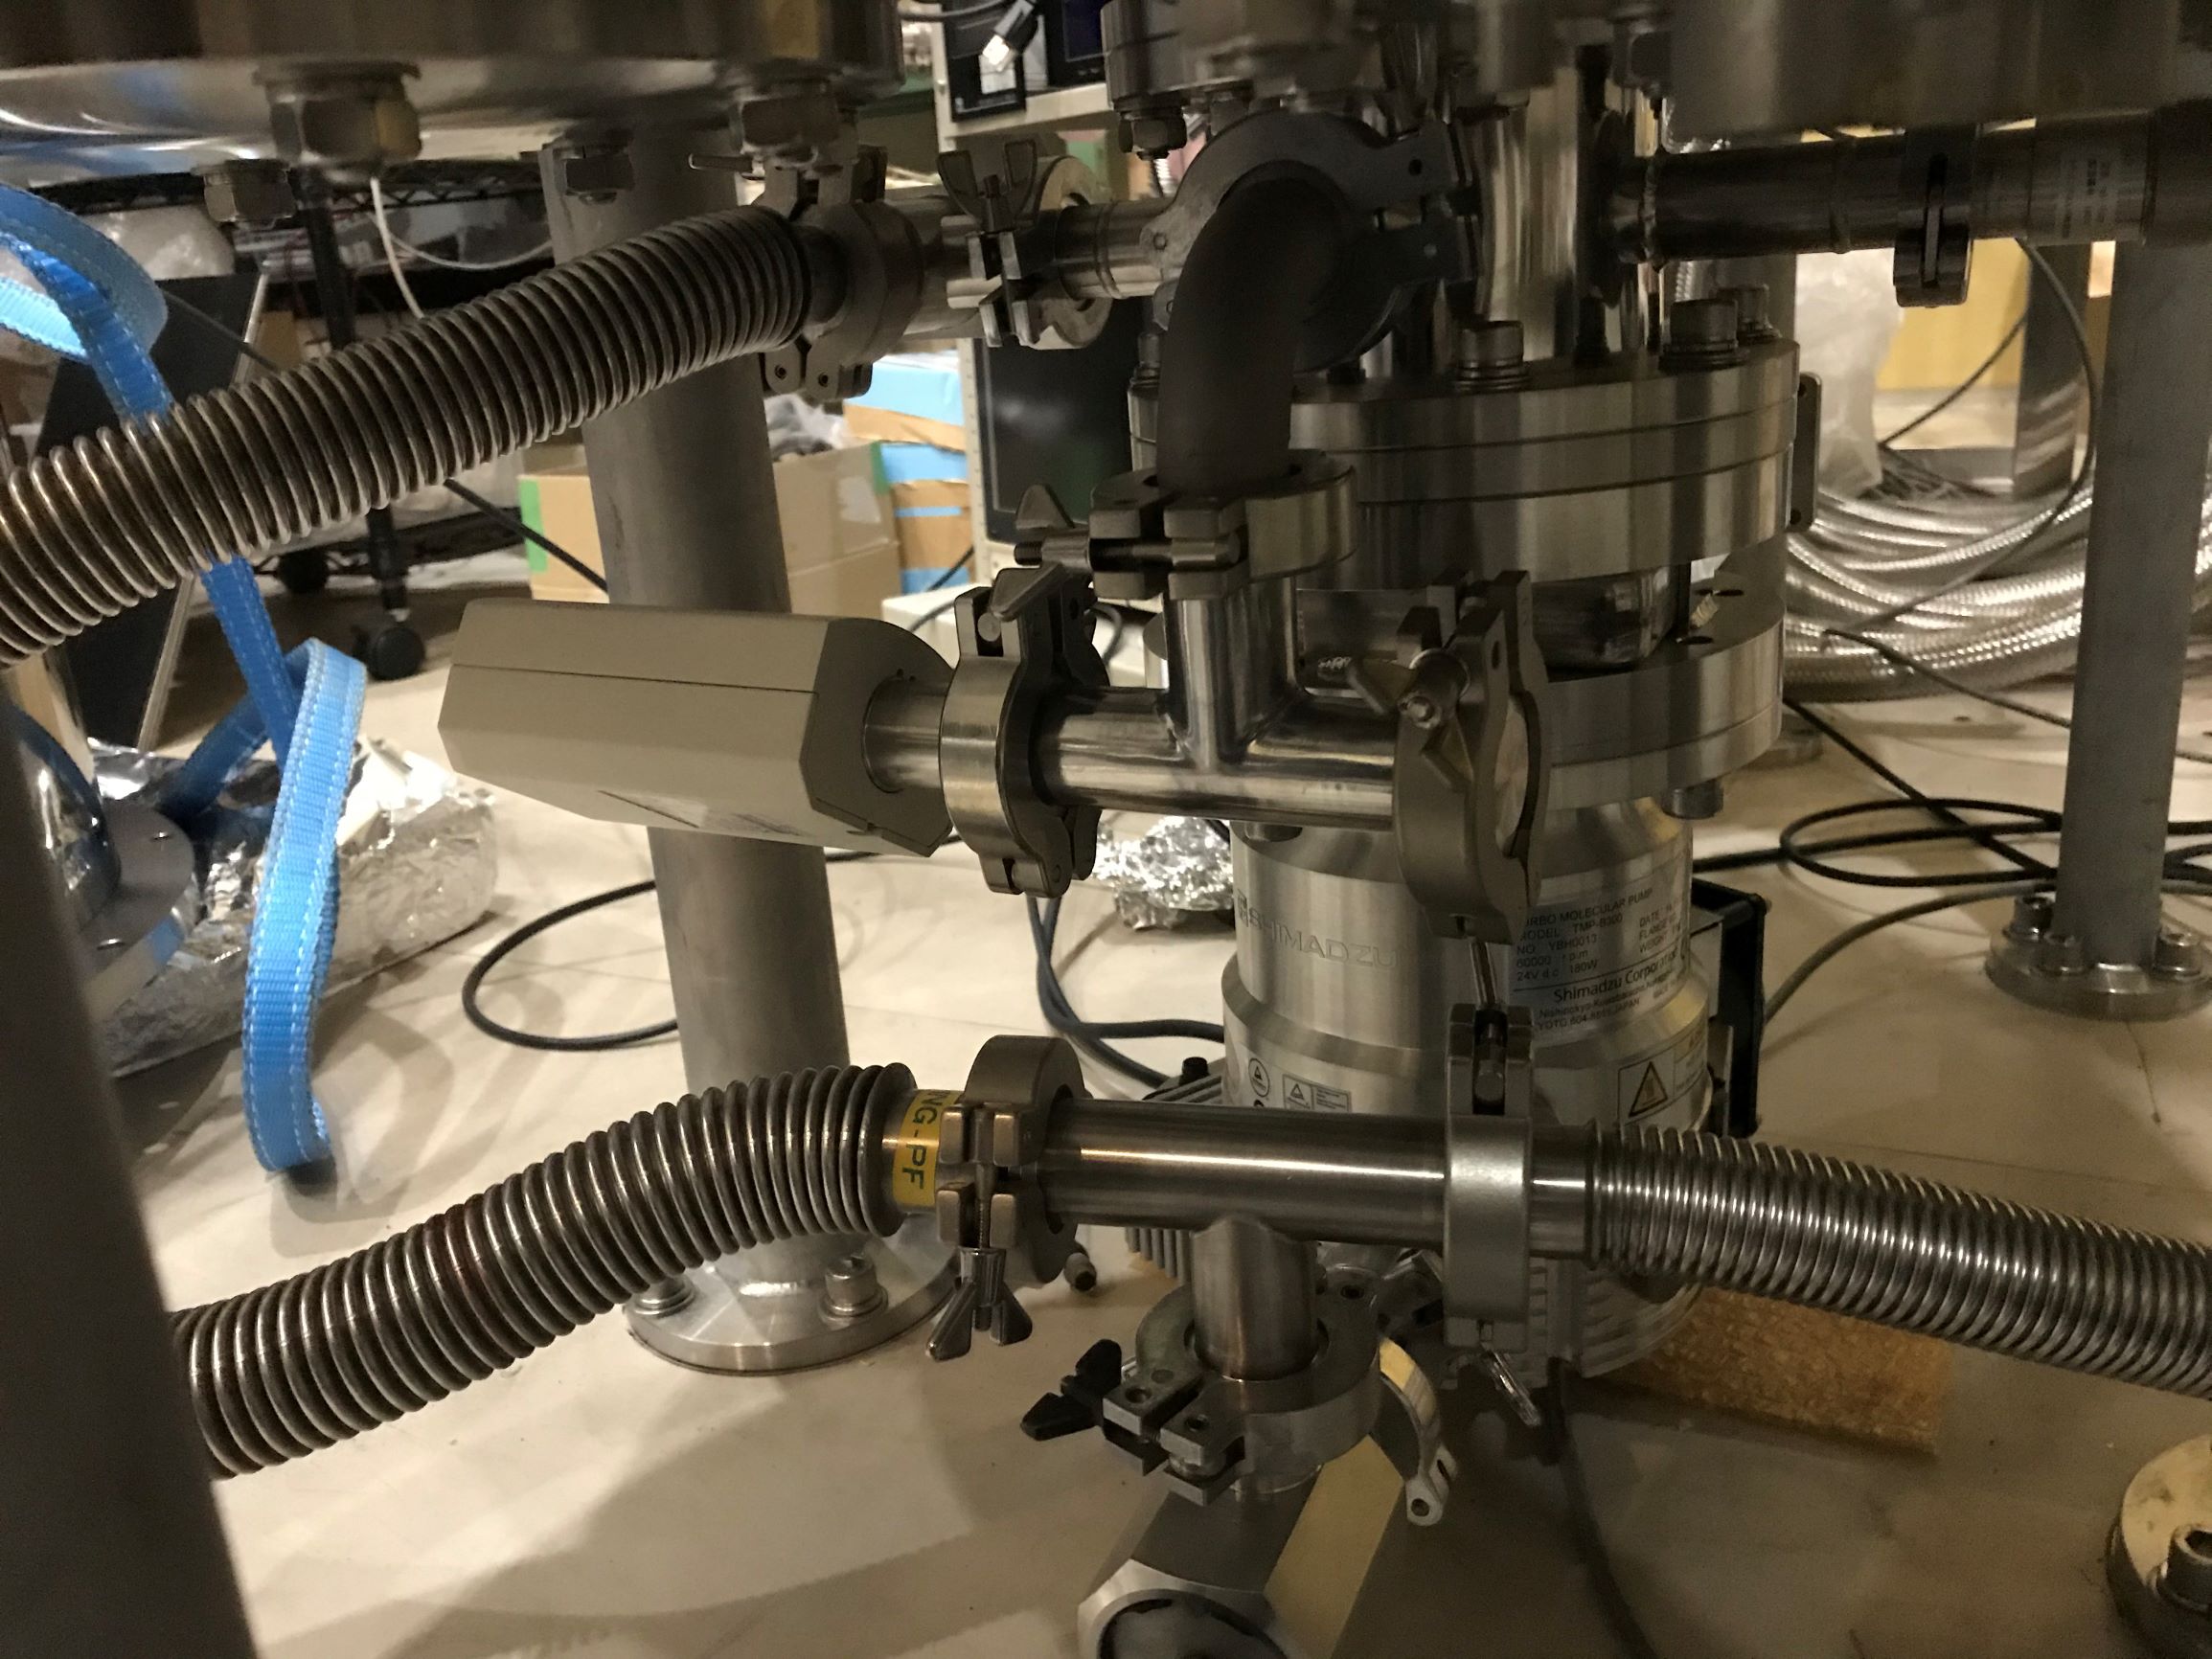
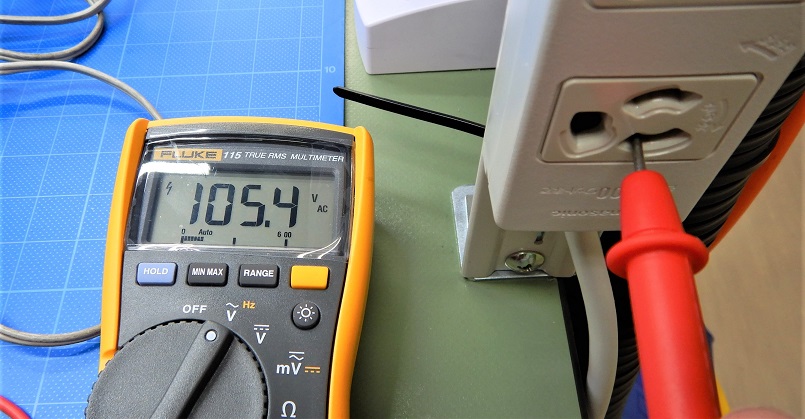
I replaced the vacuum gauge which was repaired by the company as attached picture.
Then I installed a temperature sensor.
First, soldered the connector to the controller.
Then I soldered a sensor to the cable inside the cryostat.
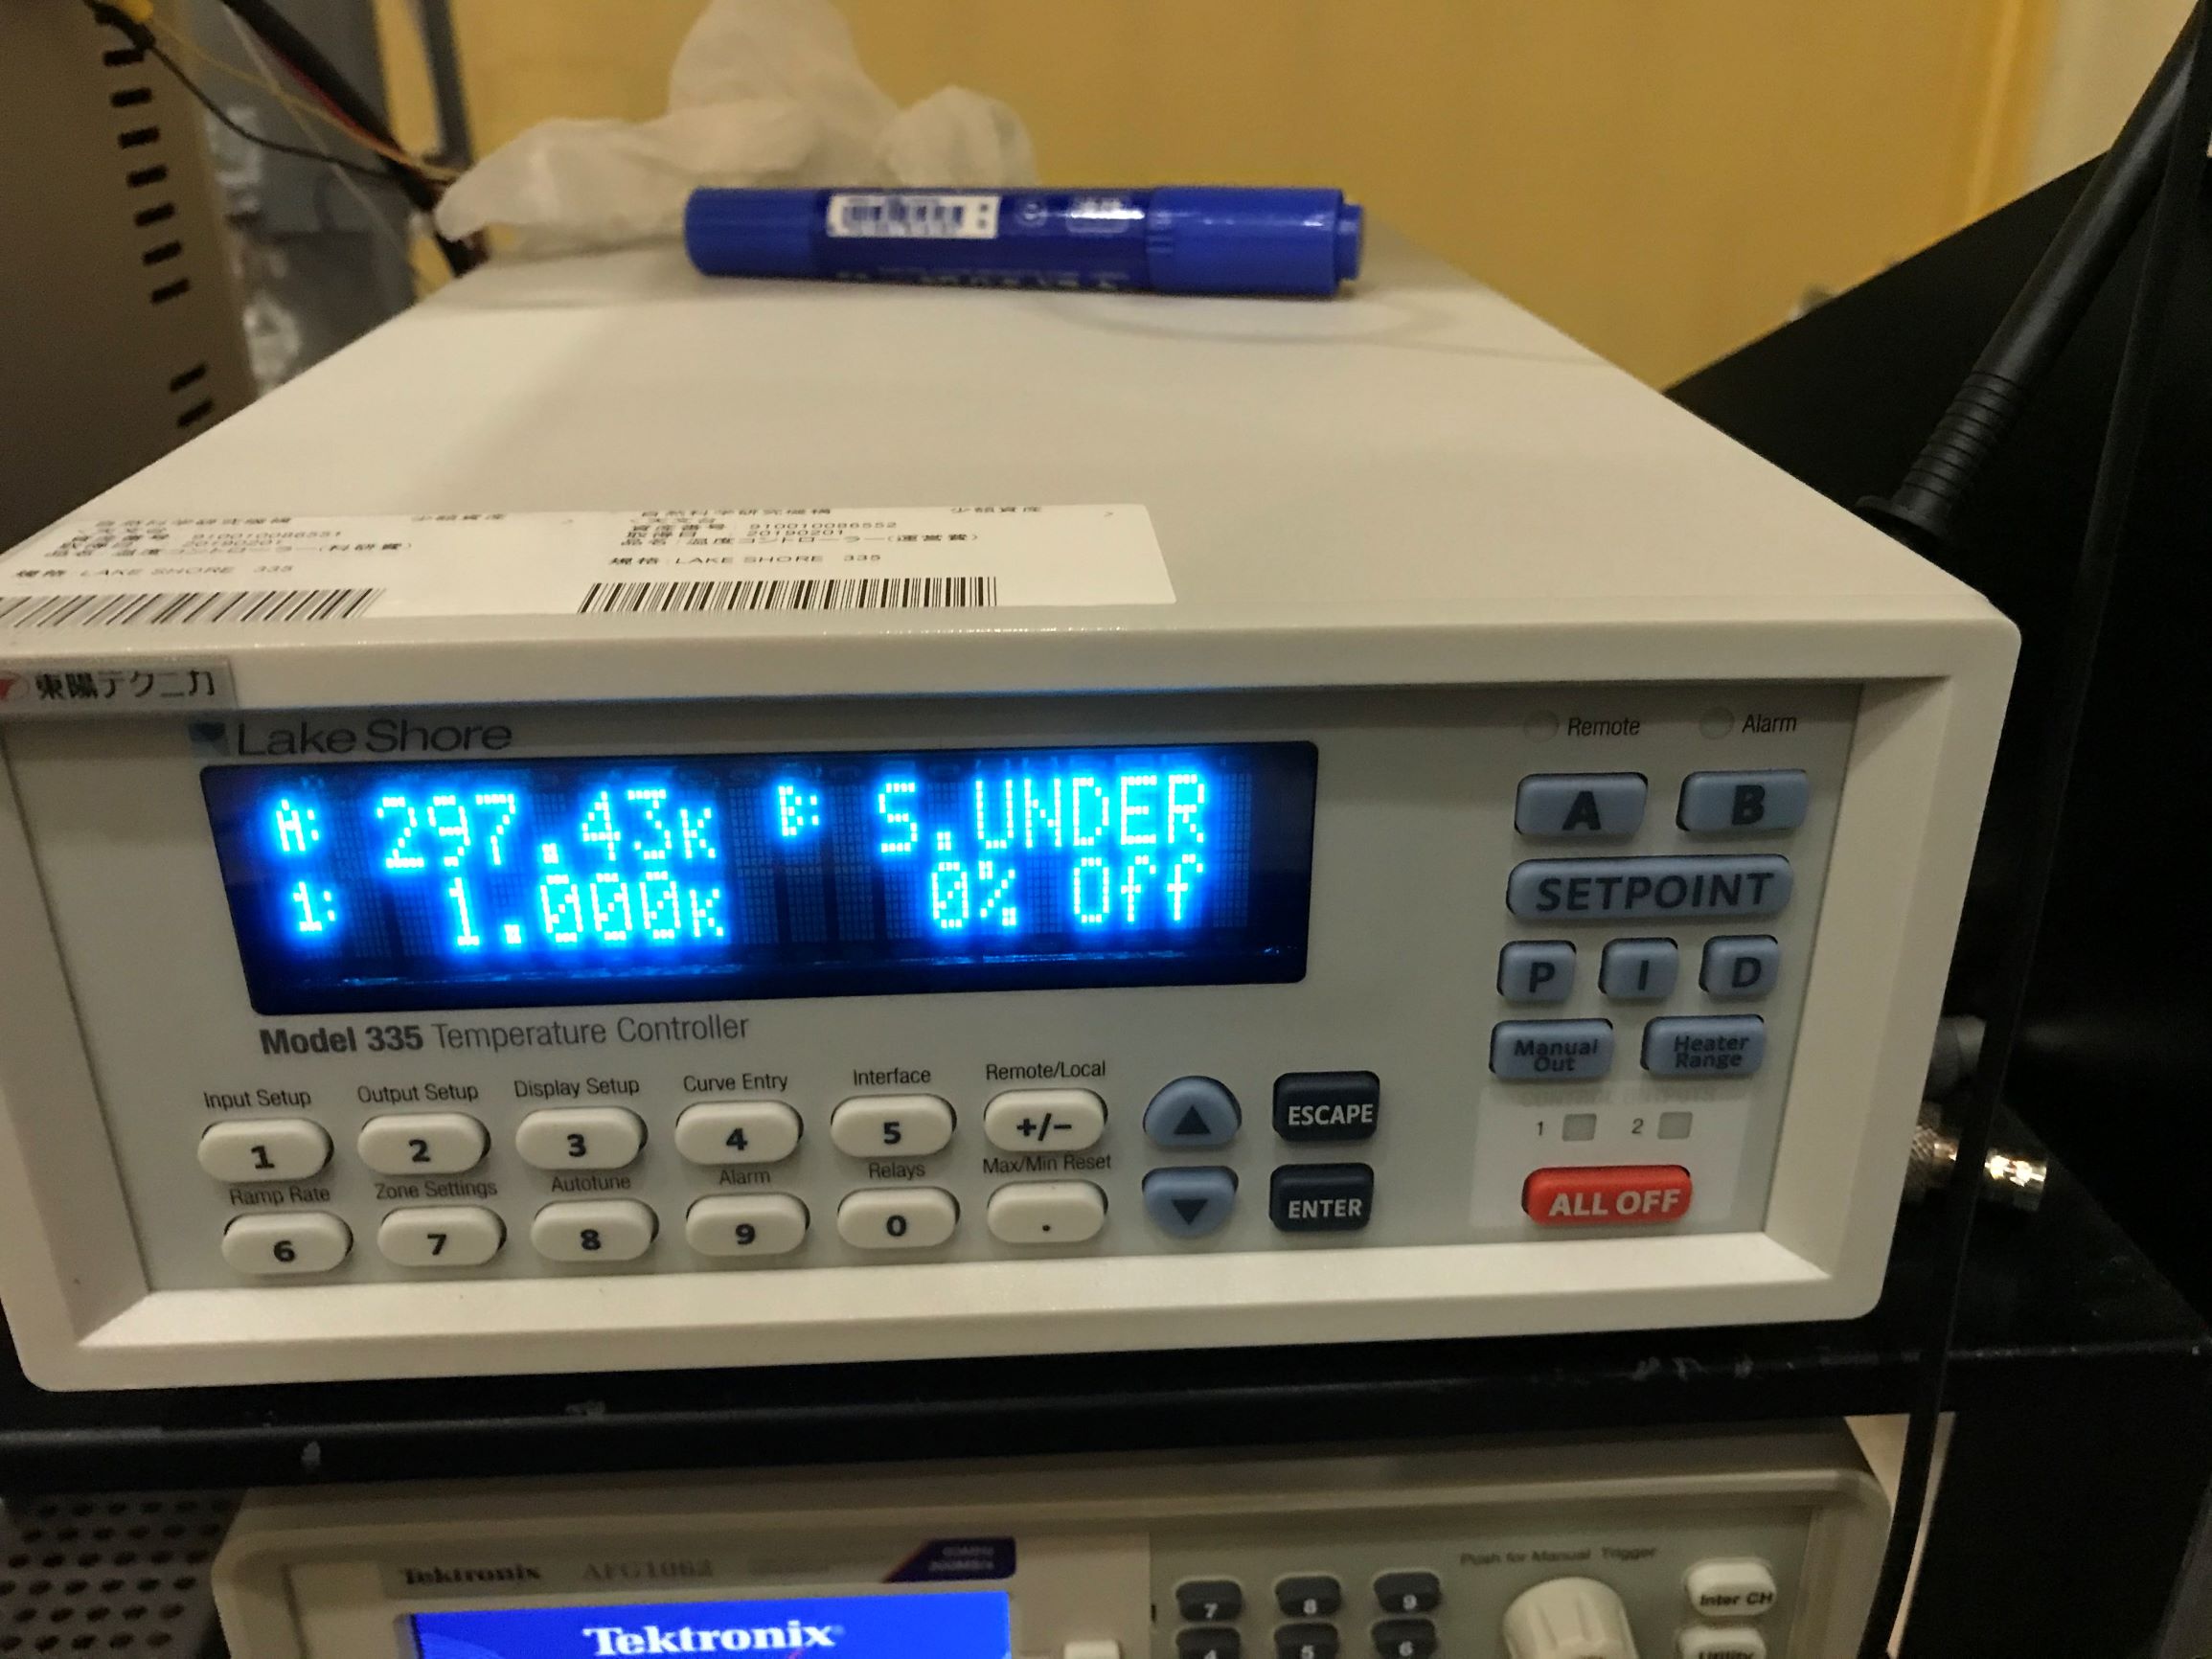
After that, I checked the temperature which was displayed on the controller.
The value was about 430 K and was strange.
I suspected that there was a contact failure at some point.
Eventually, it was due to the poor connection between the cable and the pin.
After solving this problem, the displayed value was reasonable as shown in the attached picture.
Next step
I will install another temperature sensor and Q-mass.
And then I will start cooling down.
Shimode-san, Miyakawa-san
After experiencing the failure of AA channels and PSD reported in entry #2096. We shipped the PSD and its power supply to Kamioka where Shimode-san investigated the circuits.
His report is reported below (the japanese version is in the attachments):
1. Features of 100V of NAOJ power supply
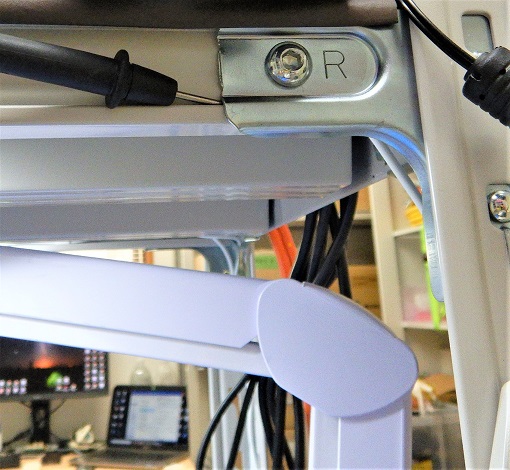
3pin Earth terminal: Earth line connected to cold and grounded into earth through the power distribution. (Pic 6. "100v_Earth.jpg")
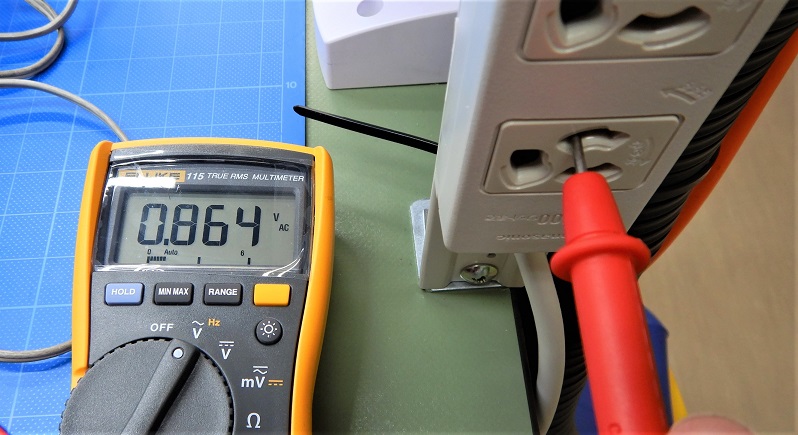
3pin Cold terminal: Power output connected to Earth on the power distribution. (Pic 5. "100v_Cold.jpg")
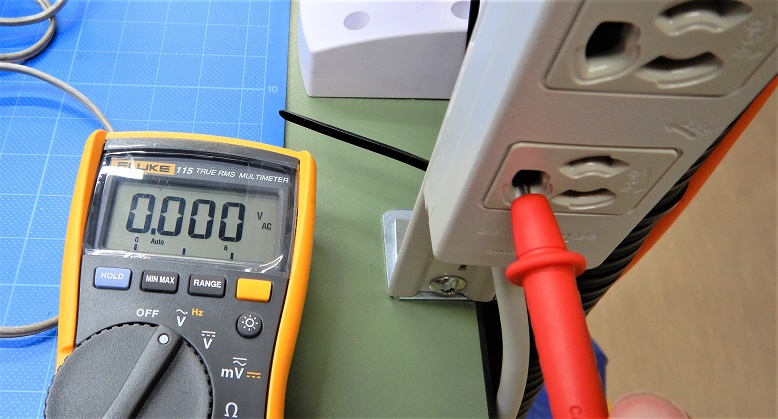
3pin Hot terminal: Power output not connected to Earth on the power distribution. (Pic 7."100v_Hot.jpg")
* Note that the tester voltage is based on the Earth (rack) of the building. (pic 3. Earth_point.jpg)
2. Features of connection between PSD and power supply
(1) The PSD chassis is connected to the power supply chassis by a shield on the power connection cable. As a result, the PSD chassis and the power supply chassis have the same voltage.
(2) The NAOJ power supply's GND (black) is isolated from the power supply chassis. Therefore, the PSD chassis and the PSD board are at different voltage levels from the PSD's GND.
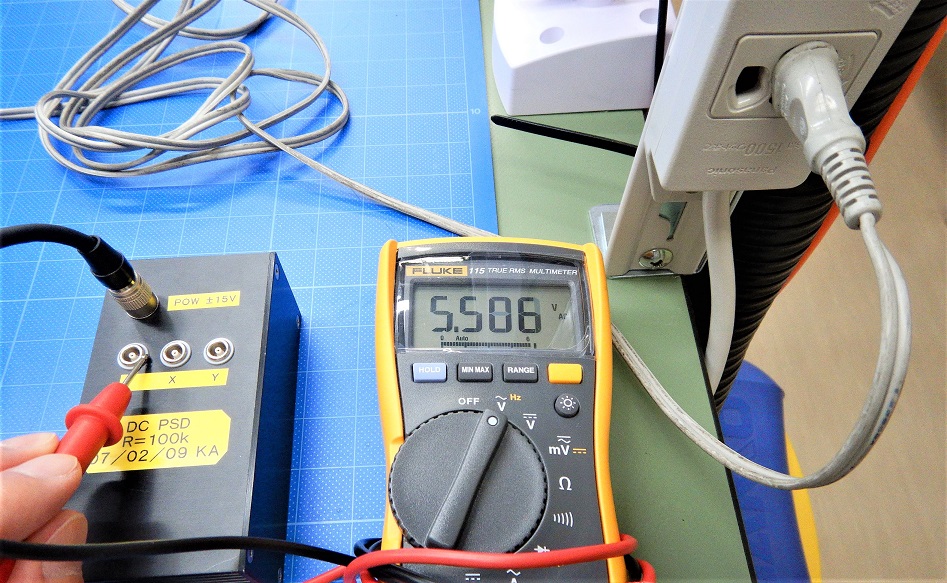
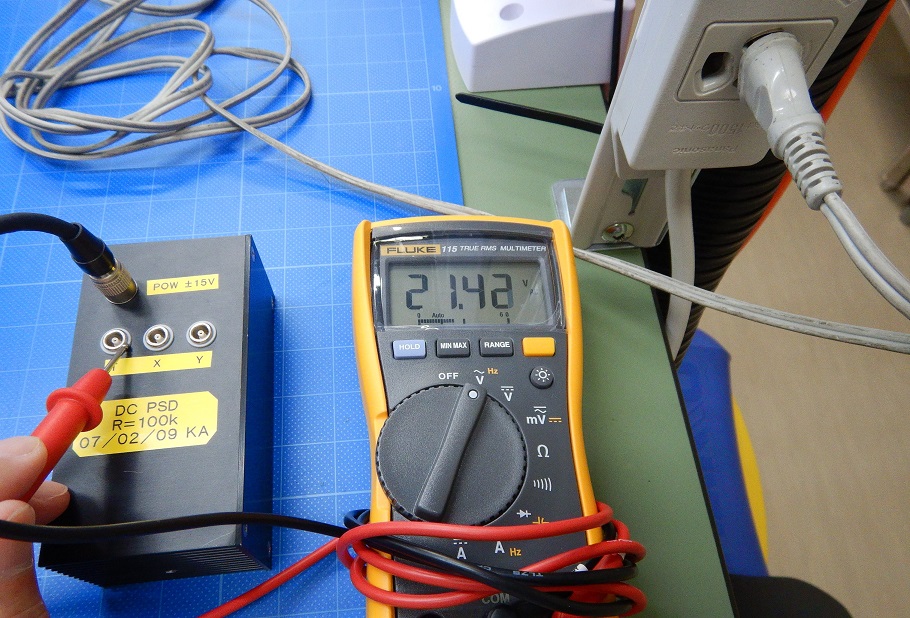
(3) The voltage difference between the NAOJ power supply's GND and the 3pin 100V power supply's ground terminal is about 21V! or 1V depending on the way to plug to AC100V power (forward and reverse). (pic.1, pic.2 "100vON_A.jpg" "100vON_B.jpg)
3. GND in each chassis.
(1) About PSD output
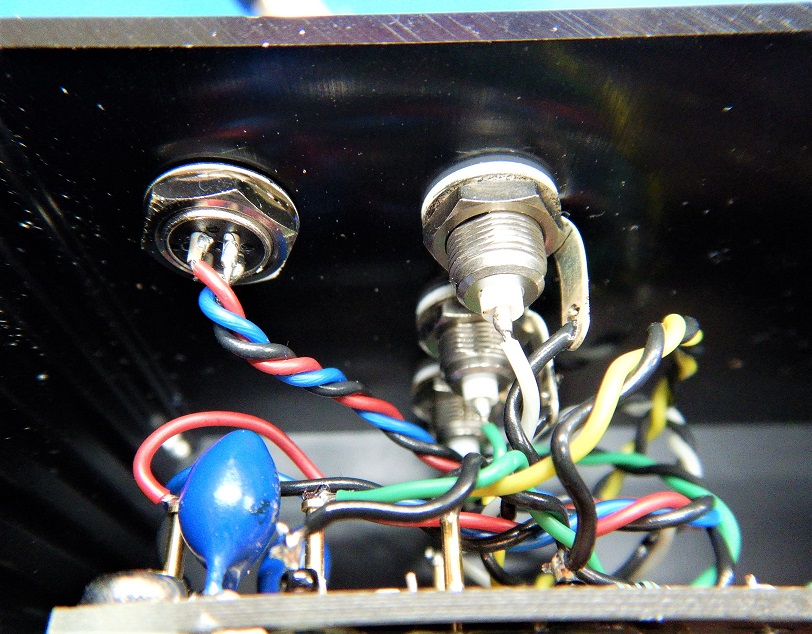
As shown in "PSD_connector.jpg", the outer of LEMO is GND because of the unbalanced output. If conversion to BNC without connecting to chassis GND, the voltage at "2. (3)" is applied to both positive and negative.
(2) BNC to Dsub chassis
BNC is from parallel input to Dsub parallel output. GND is not connected in the chassis. (See https://gwdoc.icrr.u-tokyo.ac.jp/DocDB/ 0047/D1604782/001/BncDsub_ADC.pdf )
(3) About AA/AI Chassis
The 5pin of Dsub INput in the AA/AI chassis is not connected. (The AA/AI chassis is designed to use the power supply's GND connection.)
(See https://gwdoc.icrr.u-tokyo.ac.jp/DocDB/ 0099/D1909971/001/ADC_AA_interface.pdf )
(See https://gwdoc.icrr.u-tokyo.ac.jp/DocDB/ 0099/D1909969/002/AA_AI_Filter.pdf )
* The new AA/AI Filter Board has a 5pin connection, but the 5pin is disconnected on the interface board.
4. From the above
The GND among PSD → BNC-Dsub → AA/AI Interface Board → AA/AI Board is not connected. As a result, a large voltage difference can happen between [GND of PSD] and [GND of AA/AI circuit].
It is presumed that the very high common-mode voltage originating from the power supply (from noise around) is applied to the AA/AI board and the first stage ICs are all damaged.
In addition, I guessed that the high voltage from the power supply, GND and Earth went to AA/AI input, but the same things can happen even if different voltages are applied to the power supply chassis, power supply cable or circuit configuration chassis due to other factors.
5. Solution.
Temporal solutions: (1) Pull the GND line from the GND (black wire) inside the power supply, and connect to the GND(0V) of DC power supply supplying the AA/AI along the signal line. (2) Connect the ground wire between the "PSD chassis + NAOJ power supply chassis" and the "AA/AI chassis".
Fundamental Solutions: (1) Use 15V power supply boards AEL made in all chassis. The power line should be along the signal line. (2) Connect the chassis and the rack to the GND (0V) of the power supply. (3) Connect the ground through wire between the PSD chassis and the AA/AI chassis. Connect them with a relatively thick wire. (4) Insulate the PSD from surrounding metal objects.

Matteo, Yuhang, Eleonora
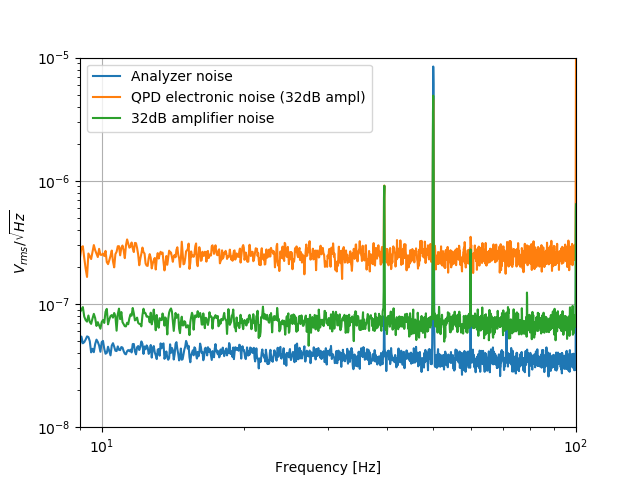
We measured the QPD2 electronic noise with spectrum analyzer using 32 dB amplification.
Pic1: Amplified QPD2 noise compared with 32 dB amplifier noise and spectrum analyzer.
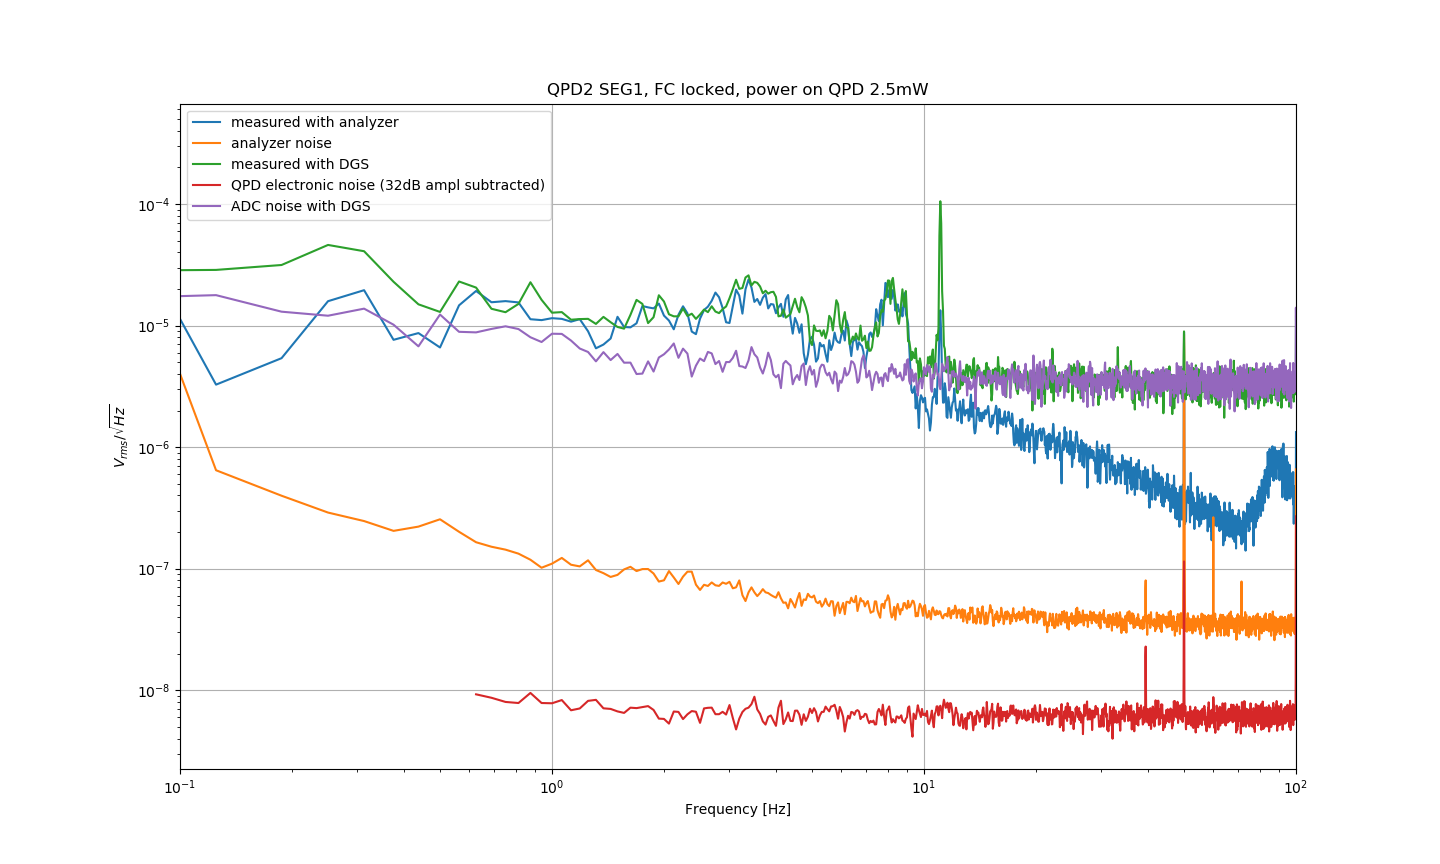
Pic2: Same plot of entry #2121 where we added QPD electronic noise. Note that the data were divided by a factor 40 to subtract the 32 dB amplication used for the measurement. We didn't plot data below 1Hz as we assumed they are dominated by the spectrum analyzer noise.
We verified that the QPD measurement doesn't change when we added a bandpass filter (https://www.minicircuits.com/WebStore/dashboard.html?model=SIF-70%2B) before the 32 dB amplifier.
Yamamoto-san, Aso-san, Yuhang, Eleonora
Thanks to Aso-san's help Guardian PC is now connected to the TAMA DGS network. We used a USB-> ethernet adaptor since the system was not recognizing the ethernet port.
Aso-san solved also a problem caused by the fact that space on the disk was completely occupied by log files generated by an error.
Then Yamamoto-san could remotely access the PC and set up the guardian. Below a memo of his work:
##################
Today, we have some progress about guardian deployment in TAMA. Thanks to the help from Yamat. The detailed information can be found in the #filter_cavity channel of gokagra in Slack. Here, I put a summary of my activity today.
1. Yamat helped us check simulink file and found no problem.
2. Yamat suggested to run caget K1:FDS-FC_GR_TRA to check potential issue on client workstation of desktop1 and k1grd0. Running it on desktop1, I got -27.7212 for K1:FDS-FC_GR_TRA. But running it on k1grd0, I got channel connect timed out for K1:FDS-FC_GR_TRA.
3. Yamat suggested to check environment values in guardian computer. To do that, I used 'env > tama_filter_cavity_k1grd0_env_out.txt' to save the environment variable of k1grd0 workstation. Then I used 'scp tama_filter_cavity_k1grd0_env_out.txt controls@192.168.11.110:/home/controls/Desktop' to copy environment variables from k1grd0 workstation to desktop1 workstation. To share with Yamat on Slack, I firstly uploaded the txt file to dropbox and then share link with him. (Note that I didn't just take screenshot because the environment variable information is large.)
4. After Yamat checking env output, he found that a variable called 'EPICS_CA_ADDR_LIST' seems to have a wrong IP address. He suggested to change this from '/home/controls/.bashrc or /kagra/apps/etc/client-user-env.sh.' and reboot k1grd0.
5. I found the channel 'EPICS_CA_ADDR_LIST' is in /kagra/apps/etc/epics-user-env.sh. So I did the modification and reboot k1grd0. But the problem is not solved.
6. I found after modifying from /kagra/apps/etc/epics-user-env.sh, the env output in k1grd0 is still as before and didn't change. Maybe this is why the problem is not solved. Now I am waiting for the answer from Yamat.
Yuhang, Eleonora
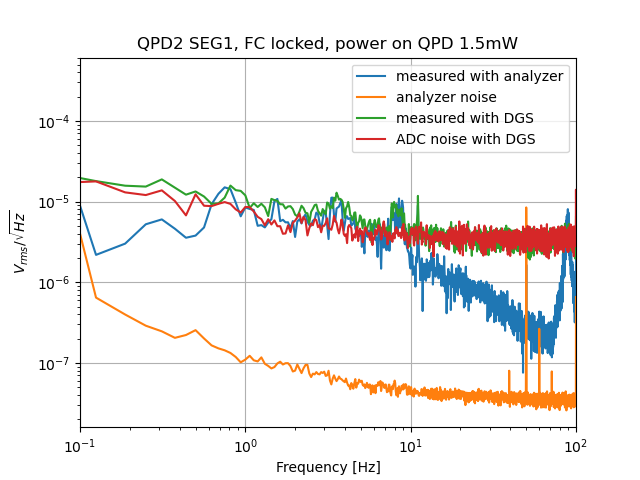
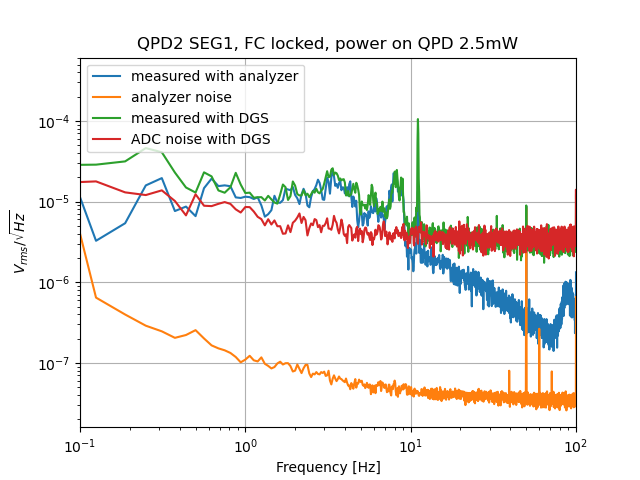
Pic.1 shows the QPD2 (seg 1) signal for FC (oplev OFF), aquired with DGS and spectrum analizer respectively for 1.5 mW sent on QPD
Pic.2 shows the QPD2 (seg 1) signal for FC (oplev OFF), aquired with DGS and spectrum analizer respectively for 2.5 mW sent on QPD
We checked that the QPD dark noise is below the spectrum analyzer noise.
# About green power to FC
In order to have more light on QPD we increased the light injected into FC by incresing modulation amplitude of AOM/ ( from 2.5dBm to 5.5dBm).
The green refleced light when FC is locked is about 1/4 of the input light. The reflected light is splitted by a BS (92:8) and 92% is send to QPDs and 8% is sent to FC lock PD. (note that an additional attenuation of a factor 3 is present before the PD)
The usual amount of light sent to FC is ~14.5 mW, the maximum we can send is ~25 mW. The limitation is due to 78 MHz EOM damage threshold.
Here the two cases corresponding to the shown measurement:
| Injected into FC |
TOT reflected |
to each QPD | to lock PD(before attenuation) |
| 14.5 mW | 3.6 mW | 1.5 mW | 0.3 mW |
| 25.5 mW | 5.8 mW | 2.5 mW | 0.5 mW |
Yuhang, Eleonora
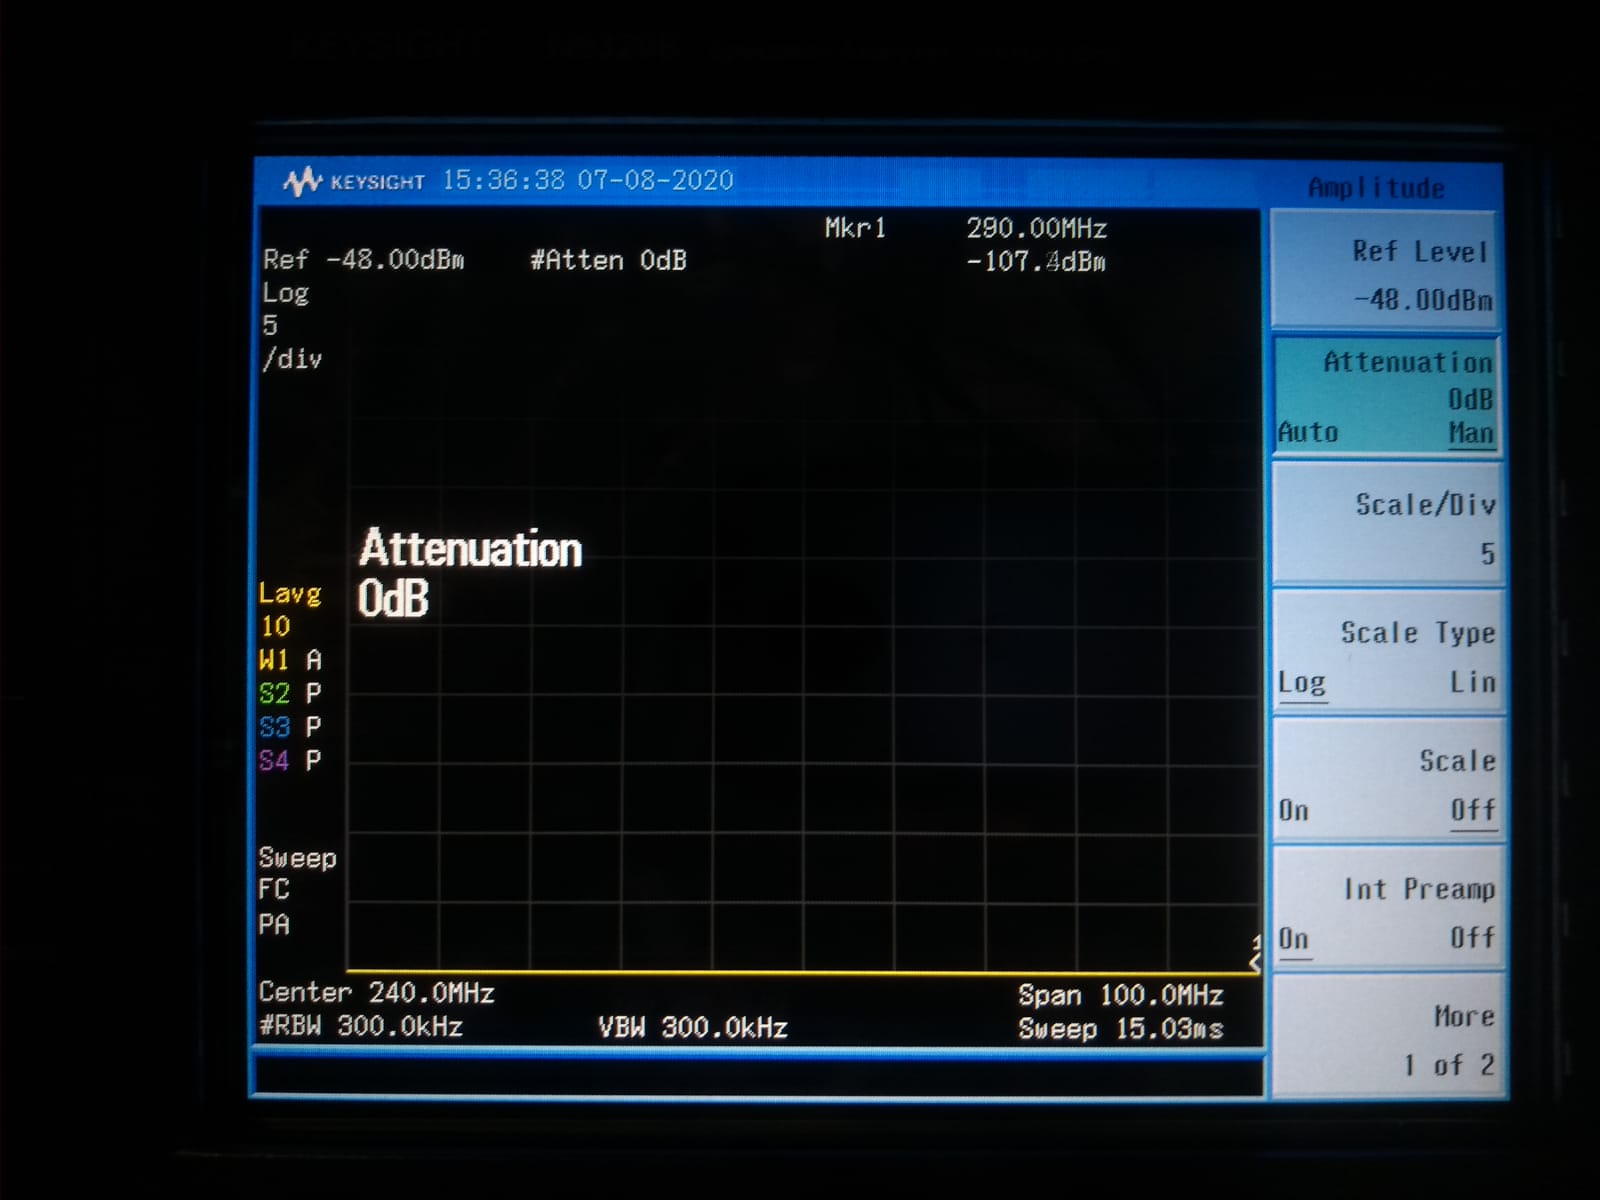
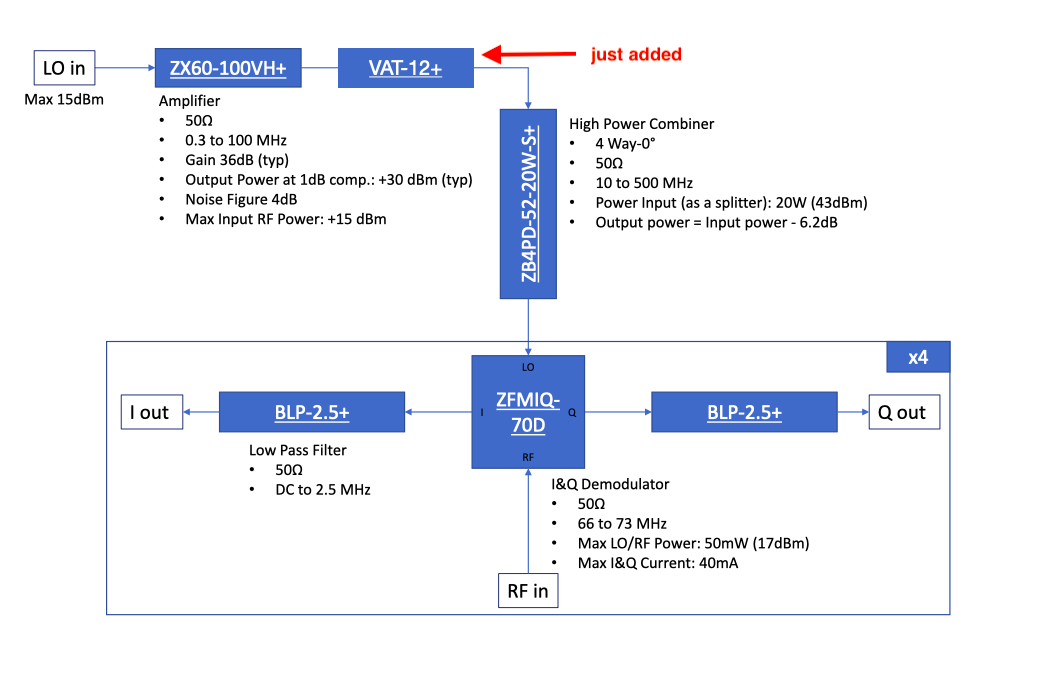
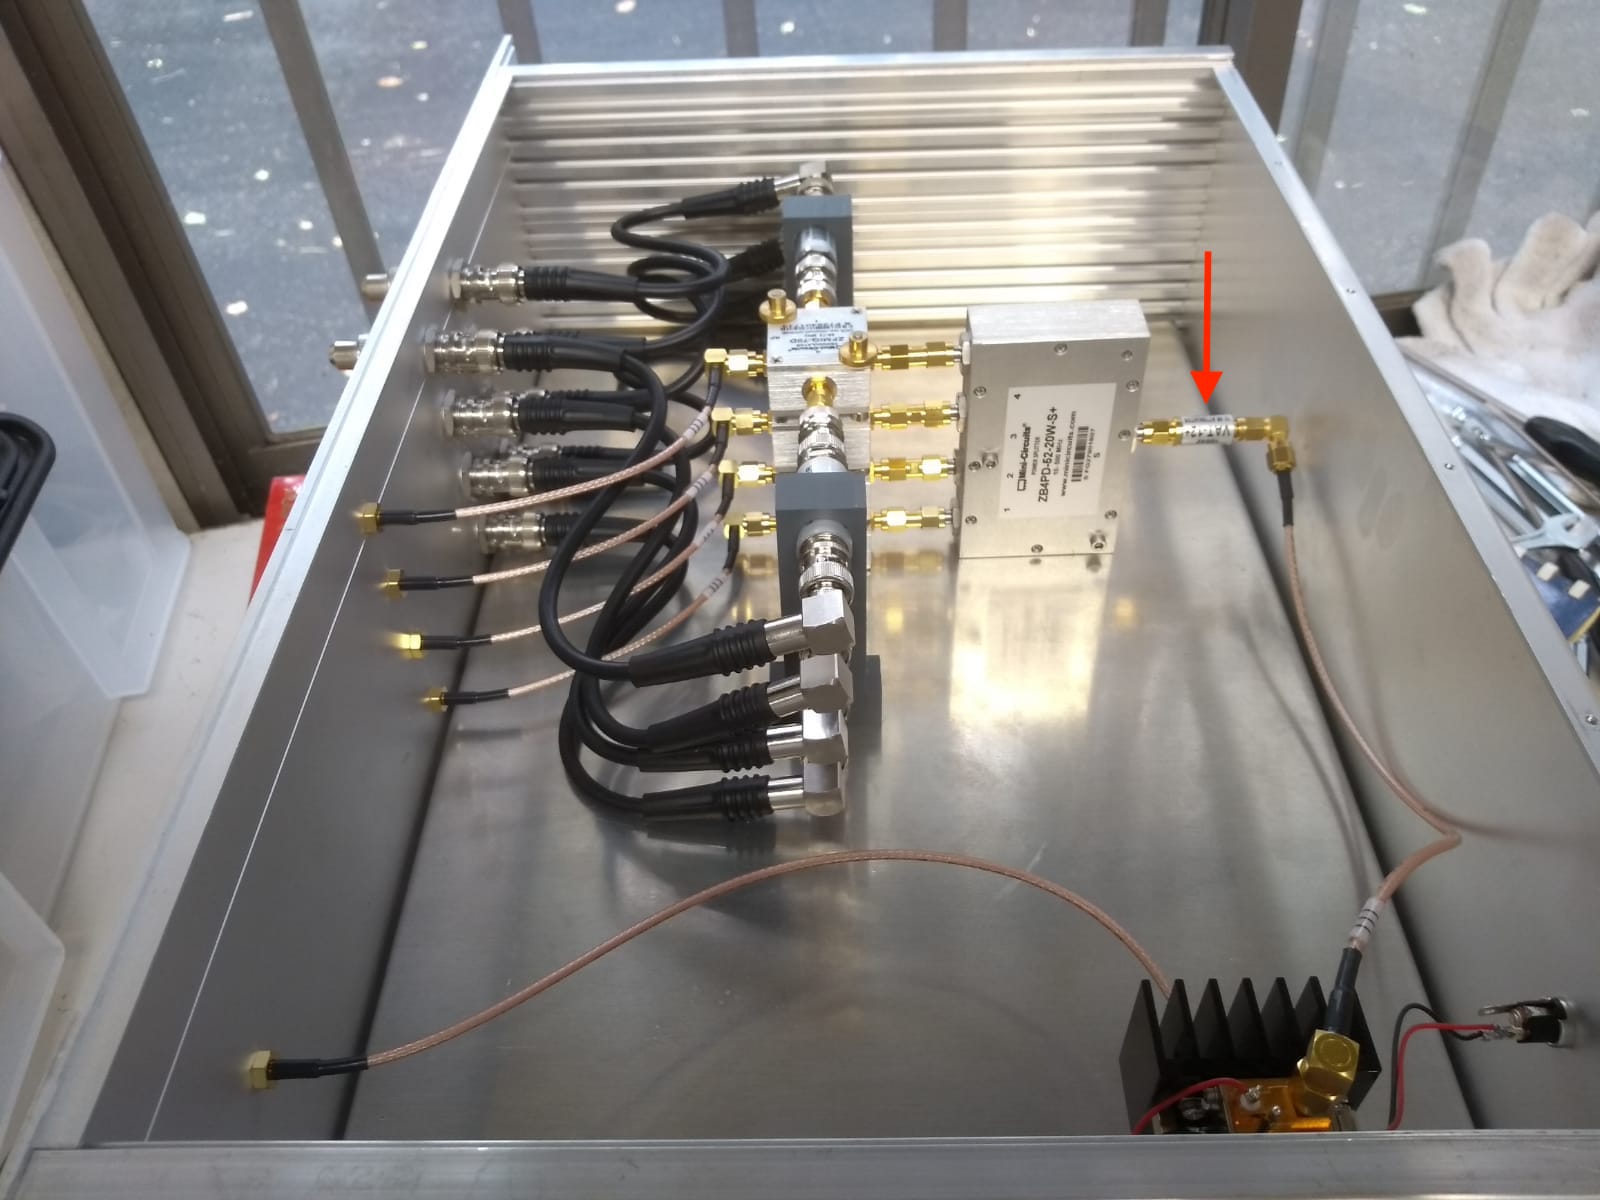
We installed 12 dB attenuator on the LO of the QPD2 demodulation board, as we did for QPD1 demodulation board 1 (see entry #2112)
We performed the same test and confirmed all the channels are working fine.
The LO was -6dBm, we notice that if we put additional attuantion the demodulated signal is slightly increased. For a LO of -21 dBm the demodulated signal reaches the maximum amplitude and it is a factor 1.2 higher that in -6dBm case.
Anyway we will split -6dBm LO between the 2 demodulation boxes. The actual LO for each board will be -12dBm which is fine.
Yuhang, Eleonora
We report three additional failures of Anti Aliasing (AA) channels.
Symptom: ADC channel reads large, almost constant offset (order of ~1000 counts). The offeset is still present if we disconnect cables towards AA board -> it is not coming from the BNC2Dsub converter. The offset is reduced when we switched off AA board and disappear when we disconnect AA from ADC.
This time the broken channels are:
- Ch.10 of AA0 used for INPUT YAW OPLEV (We realized it while charachterizing input oplev on 13/07)
- Ch.16 of AA0 used for END L SUM OPLEV (not currently used, we know it is broken since several months)
- Ch.14 of AA1 board, used for WFS2 Q3 (We realized it while charachterizing demodulators on 10/07)
For the moment I rearranged the model to used spare Anti Aliasing channels for INPUT YAW OPLEV (chan 9-12 of AA0 moved to chan 25-28 of AA1).
We shoud understand the origin of such problem and solve it. According to Miyakawa-san It might be due to a ground-connection issue in the design of KAGRA Bnc2Dsub converter JGW-D1604781 https://gwdoc.icrr.u-tokyo.ac.jp/cgi-bin/private/DocDB/ShowDocument?docid=47
Eleonora and Yuhang
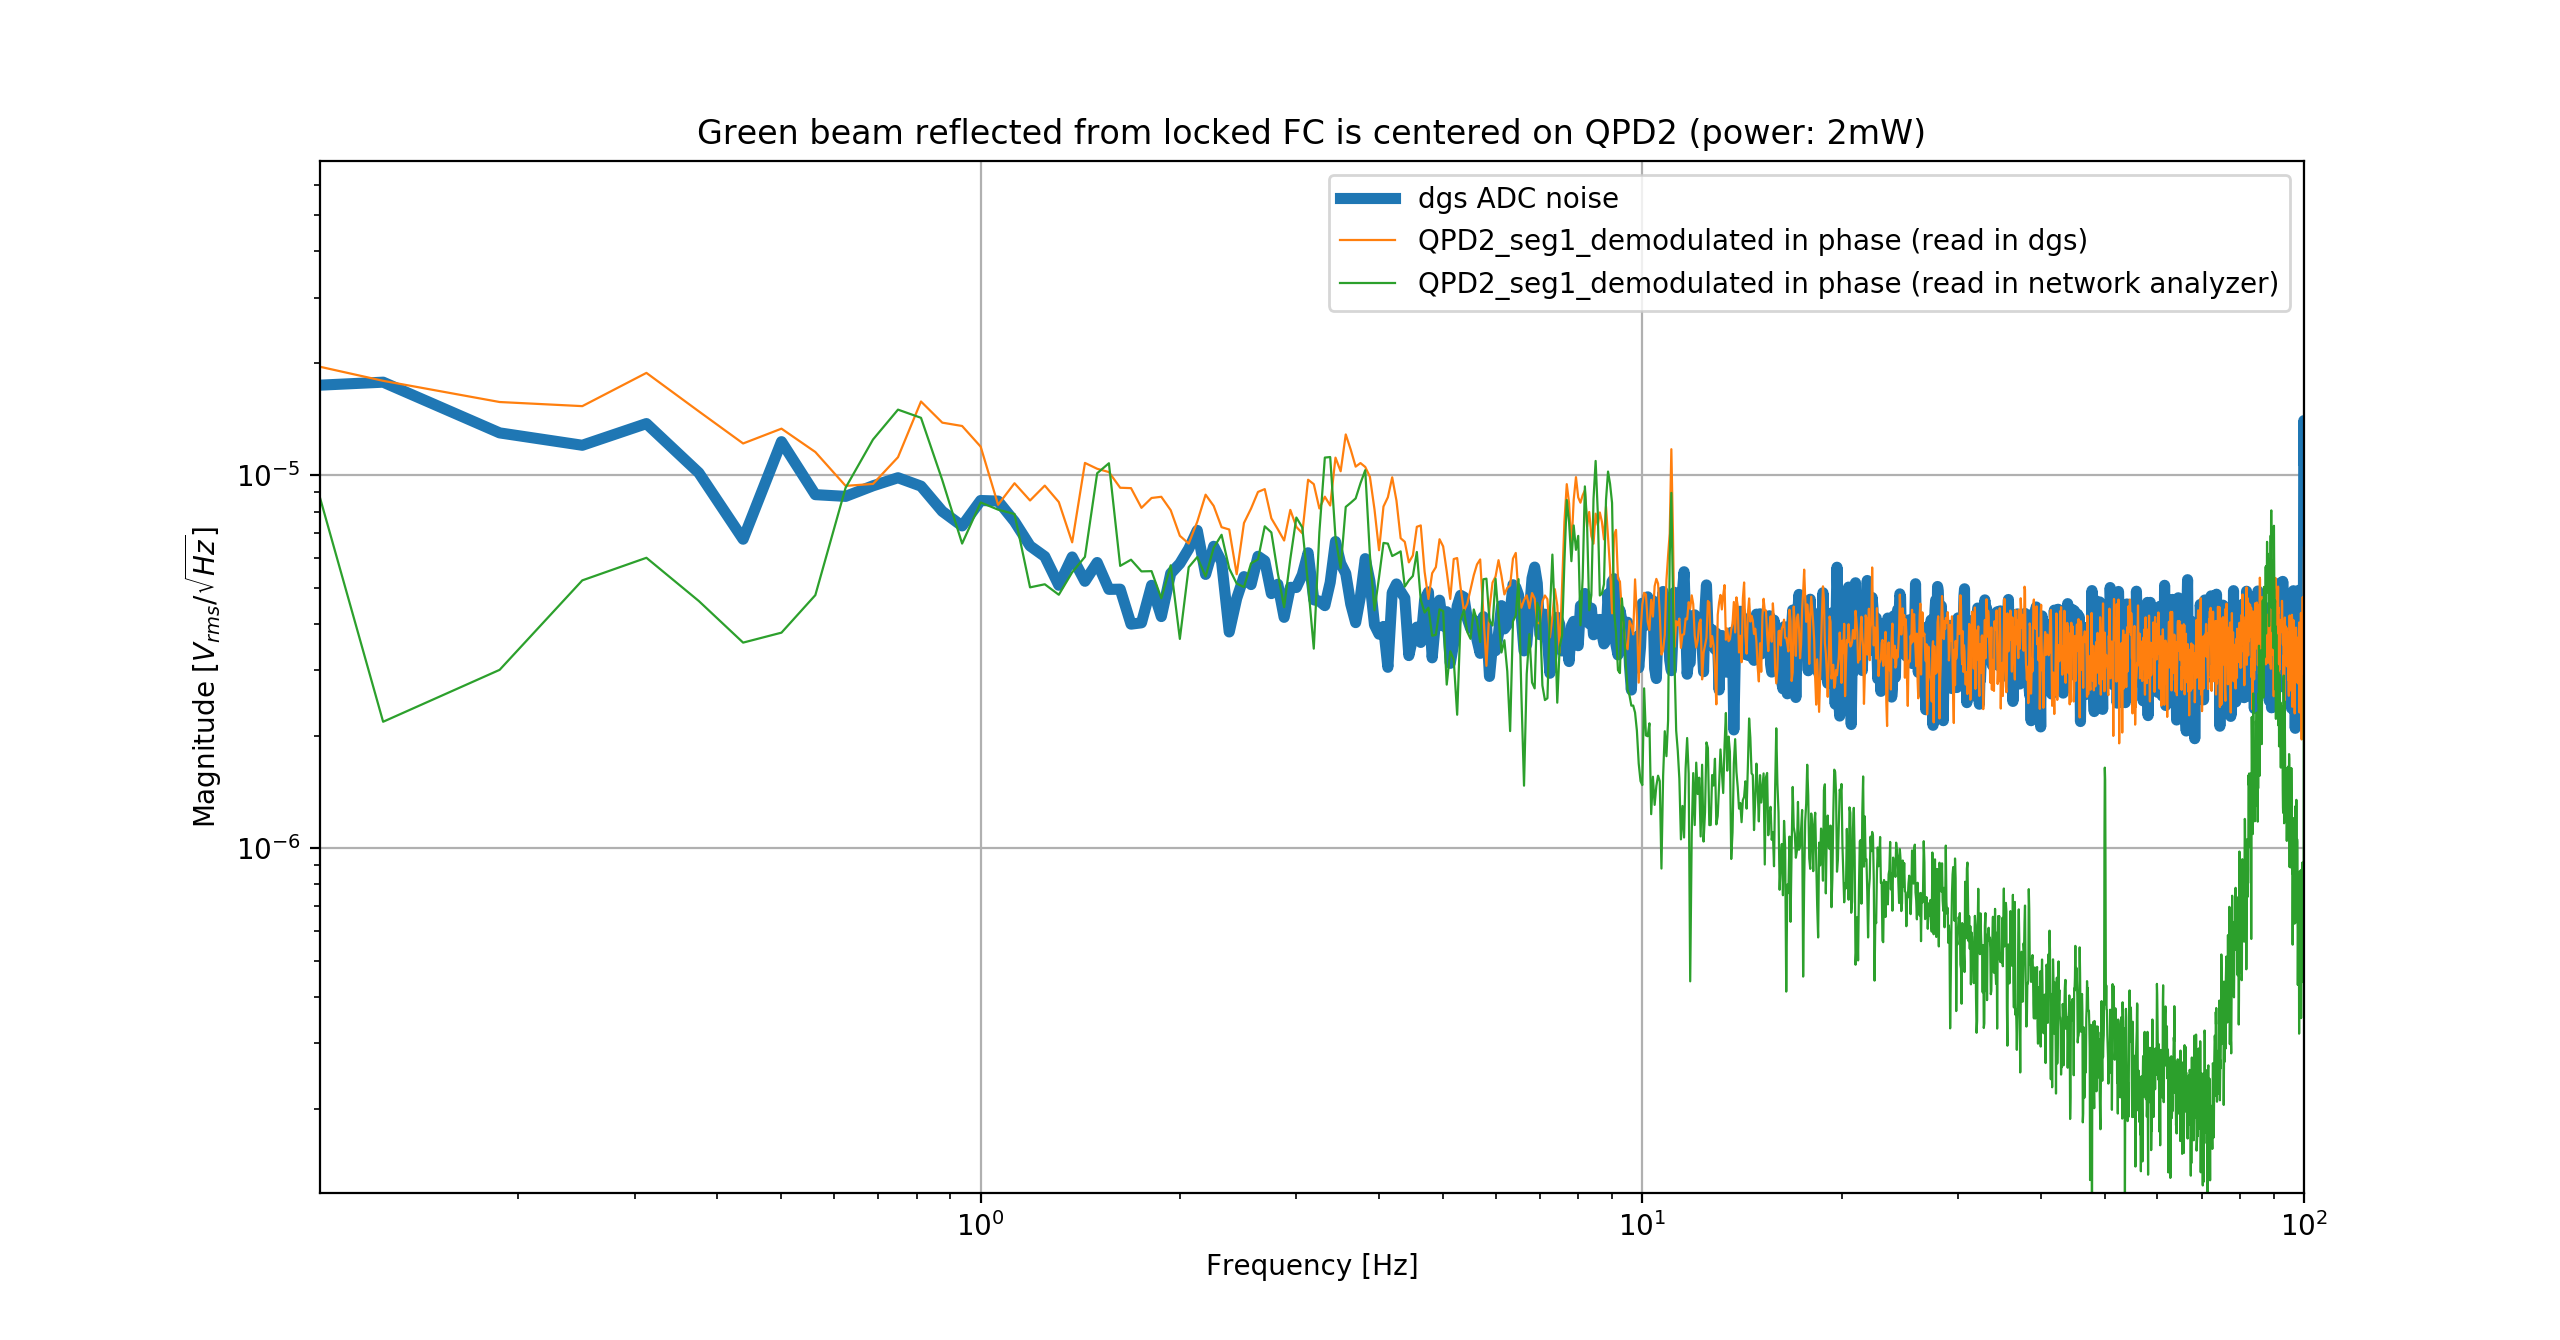
To have an idea about how much amplification is required for demodulated signals from QPD, we compared the QPD demodulated signal with DGS and network analyzer.
The test is done by taking signal from QPD2 segment1 with green beam reflected form the locked filter cavity. The beam was centered with galvo on the QPD and power was ~1.5mW
In the first attached figure, the in-phase demodulated signal (measured in DGS/network analyzer) is shown together with DGS ADC noise. We see that the measurement in DGS and network analyzer agree with each other. However, in the measurement of DGS, the peaks are barely higher than the ADC noise.
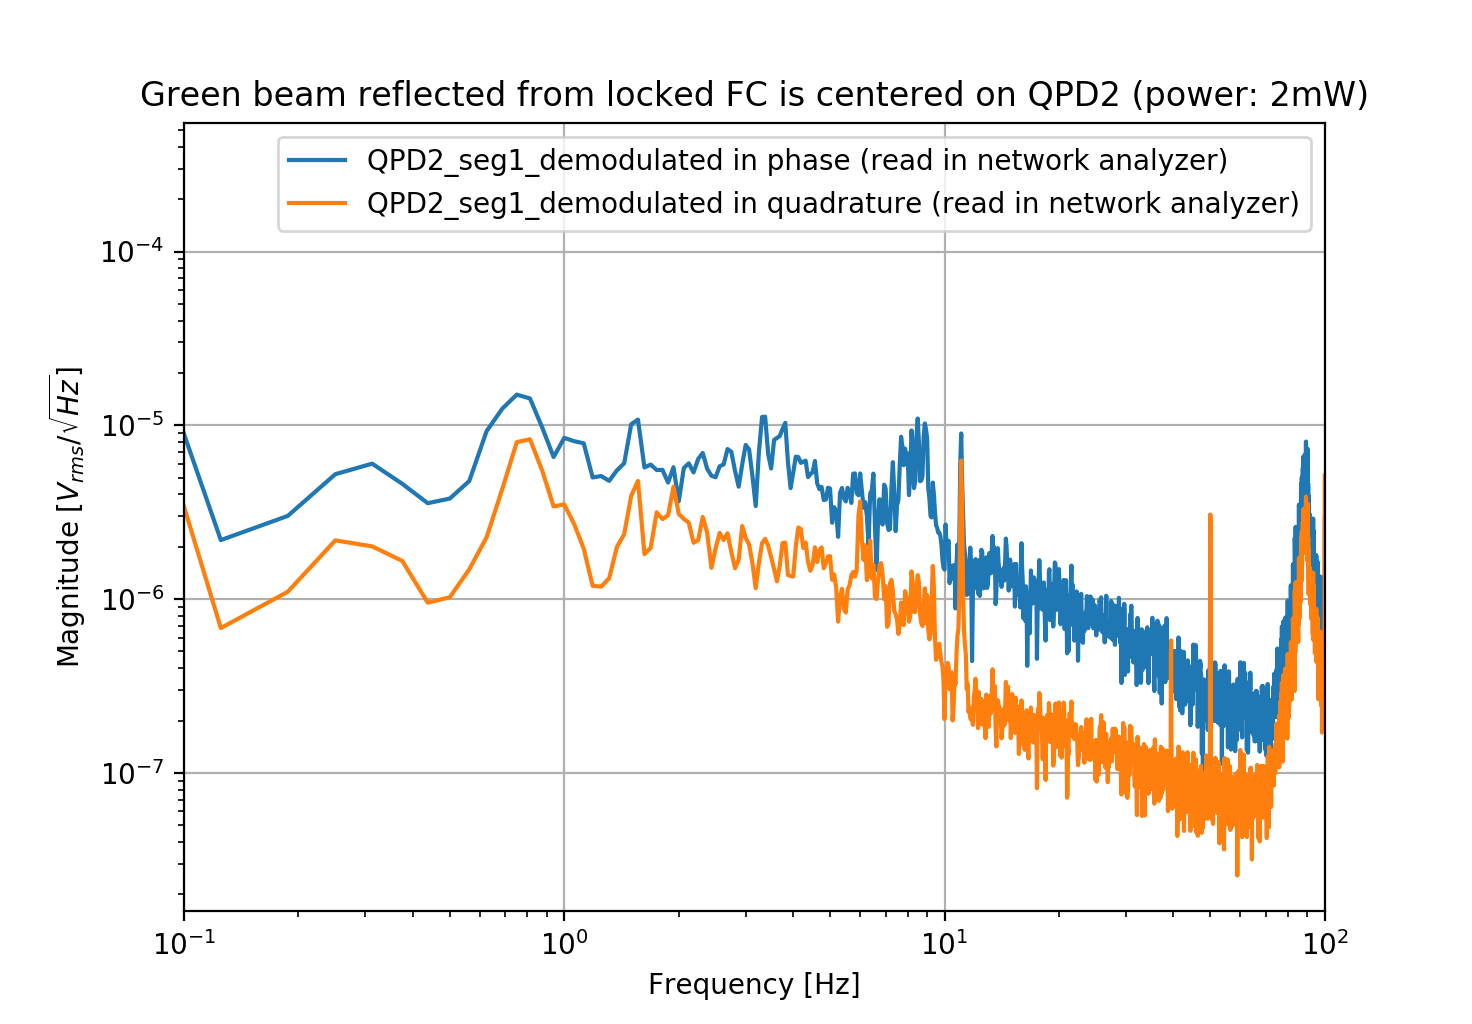
In the second plot, there is a comparison of demodulated in-phase/in-quadrature signals.
The large peak at 88 Hz is due to galvo loop, we adjusted the gain of galvo servo and it is reduced.
Yuhang, Eleonora
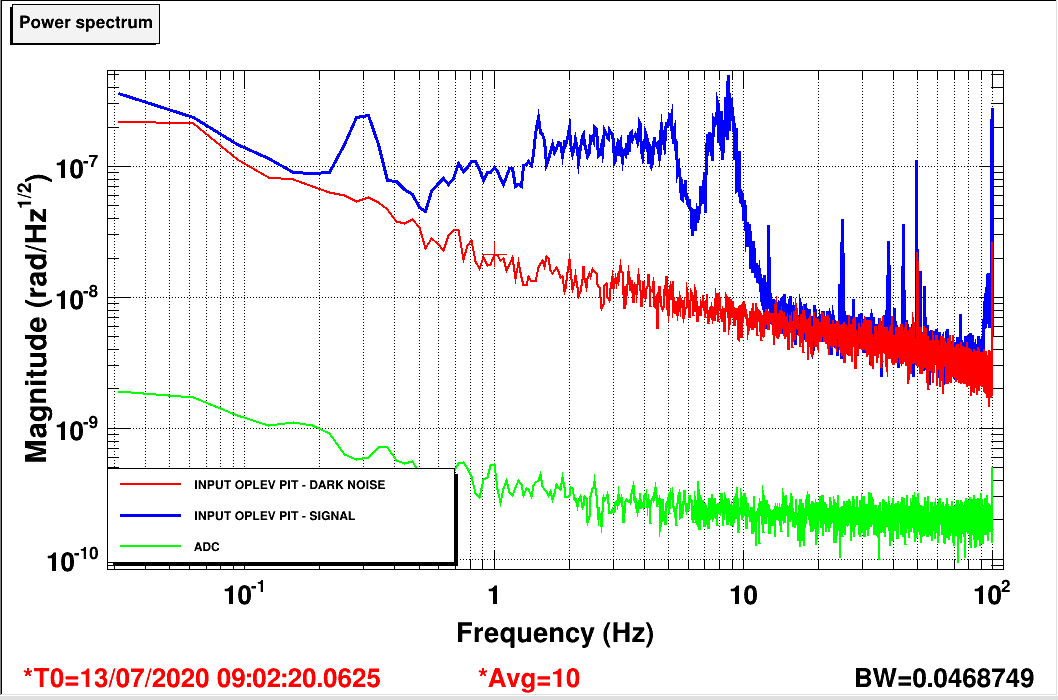
Some measurement on the local control noise was done, in order to compare their performamces to those of AA.
This is for the input mirrors. The calibration in rad/count is (reported in entry #1874) used for this measuremnt is:
| Pitch | Yaw |
| 0.038 [urad/count] | 0.027 [urad/count] |
We recall that that Input and end mirrors oplev use commercial PSD (thorlabs PDP90A) and the signal is amplified by a factor 100 with a SR560 and filtered with a 2nd order lowpass with cut-off frequency 100 Hz.
PIC 1: Piitch signal compared with ADC noise and dark noise (the noise measured when the laser is switched. Factor 100 amplification from SR560 still present)
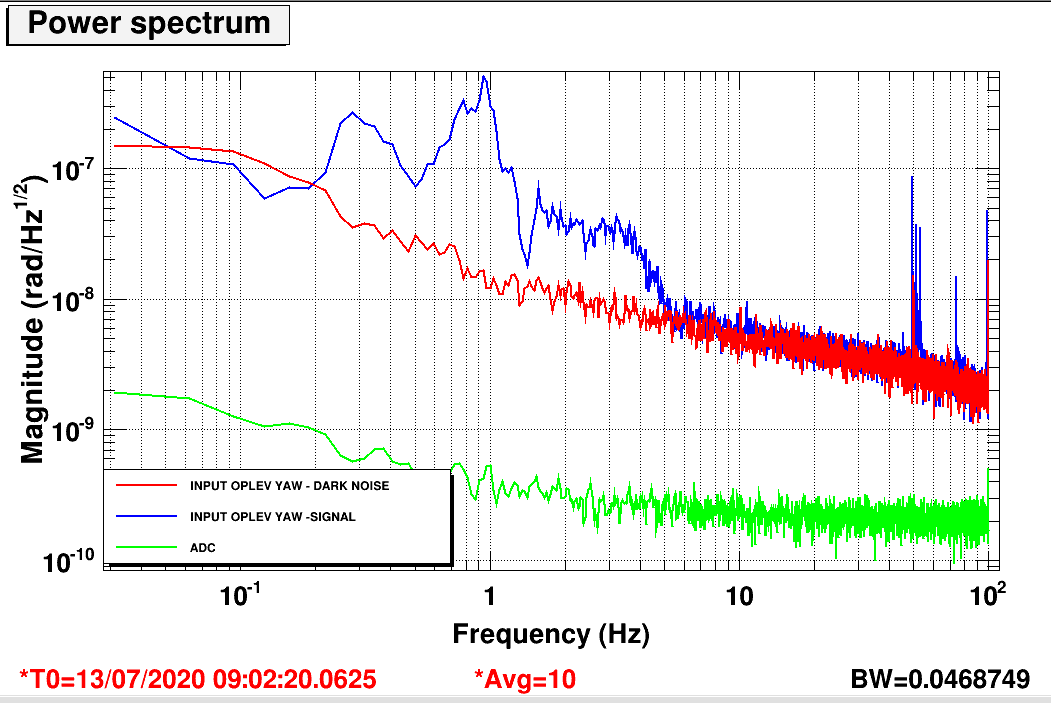
PIC 2: Yaw signal compared with ADC noise and dark noise (the noise measured when the laser is switched off. Factor 100 amplification from SR560 still present)
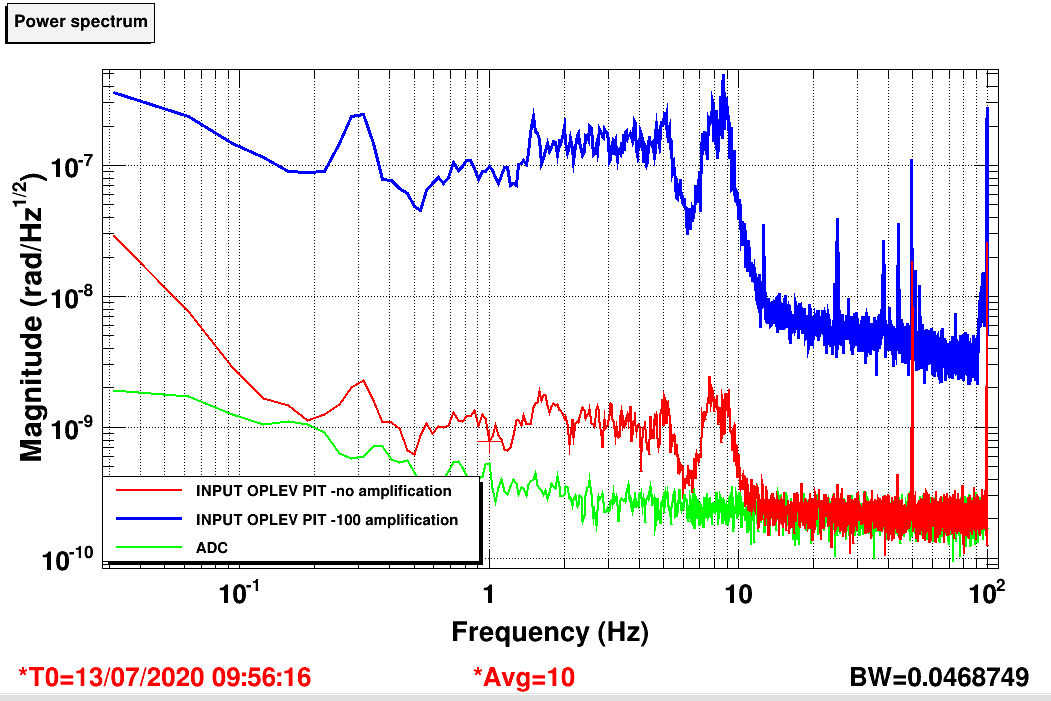
PIC 3: Piitch signal compared with ADC noise and signal withoud the factor 100 amplification (red curve should be multipplied by a factor 100 to have the good calibration)
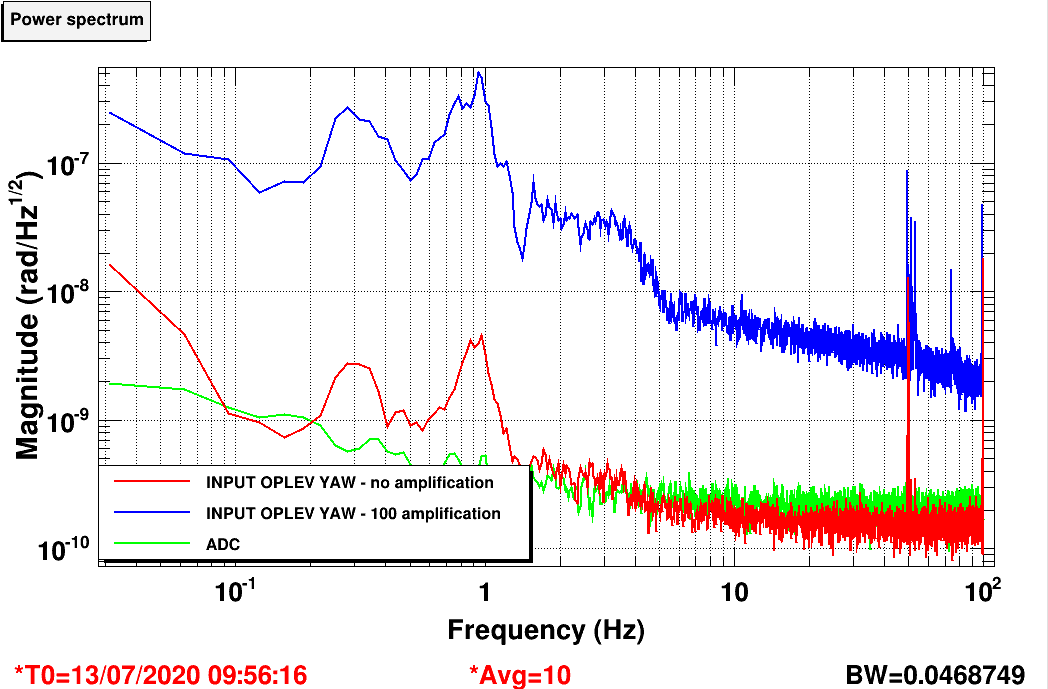
PIC 4: Yaw signal compared with ADC noise and signal withoud the factor 100 amplification (red curve should be multipplied by a factor 100 to have the good calibration)
Matteo, Eleonora
We test QPD1 demodulator after adding the 12 dB attenuator on the LO path (see elog #2106) and confirmed that all the 4 channels were working fine.
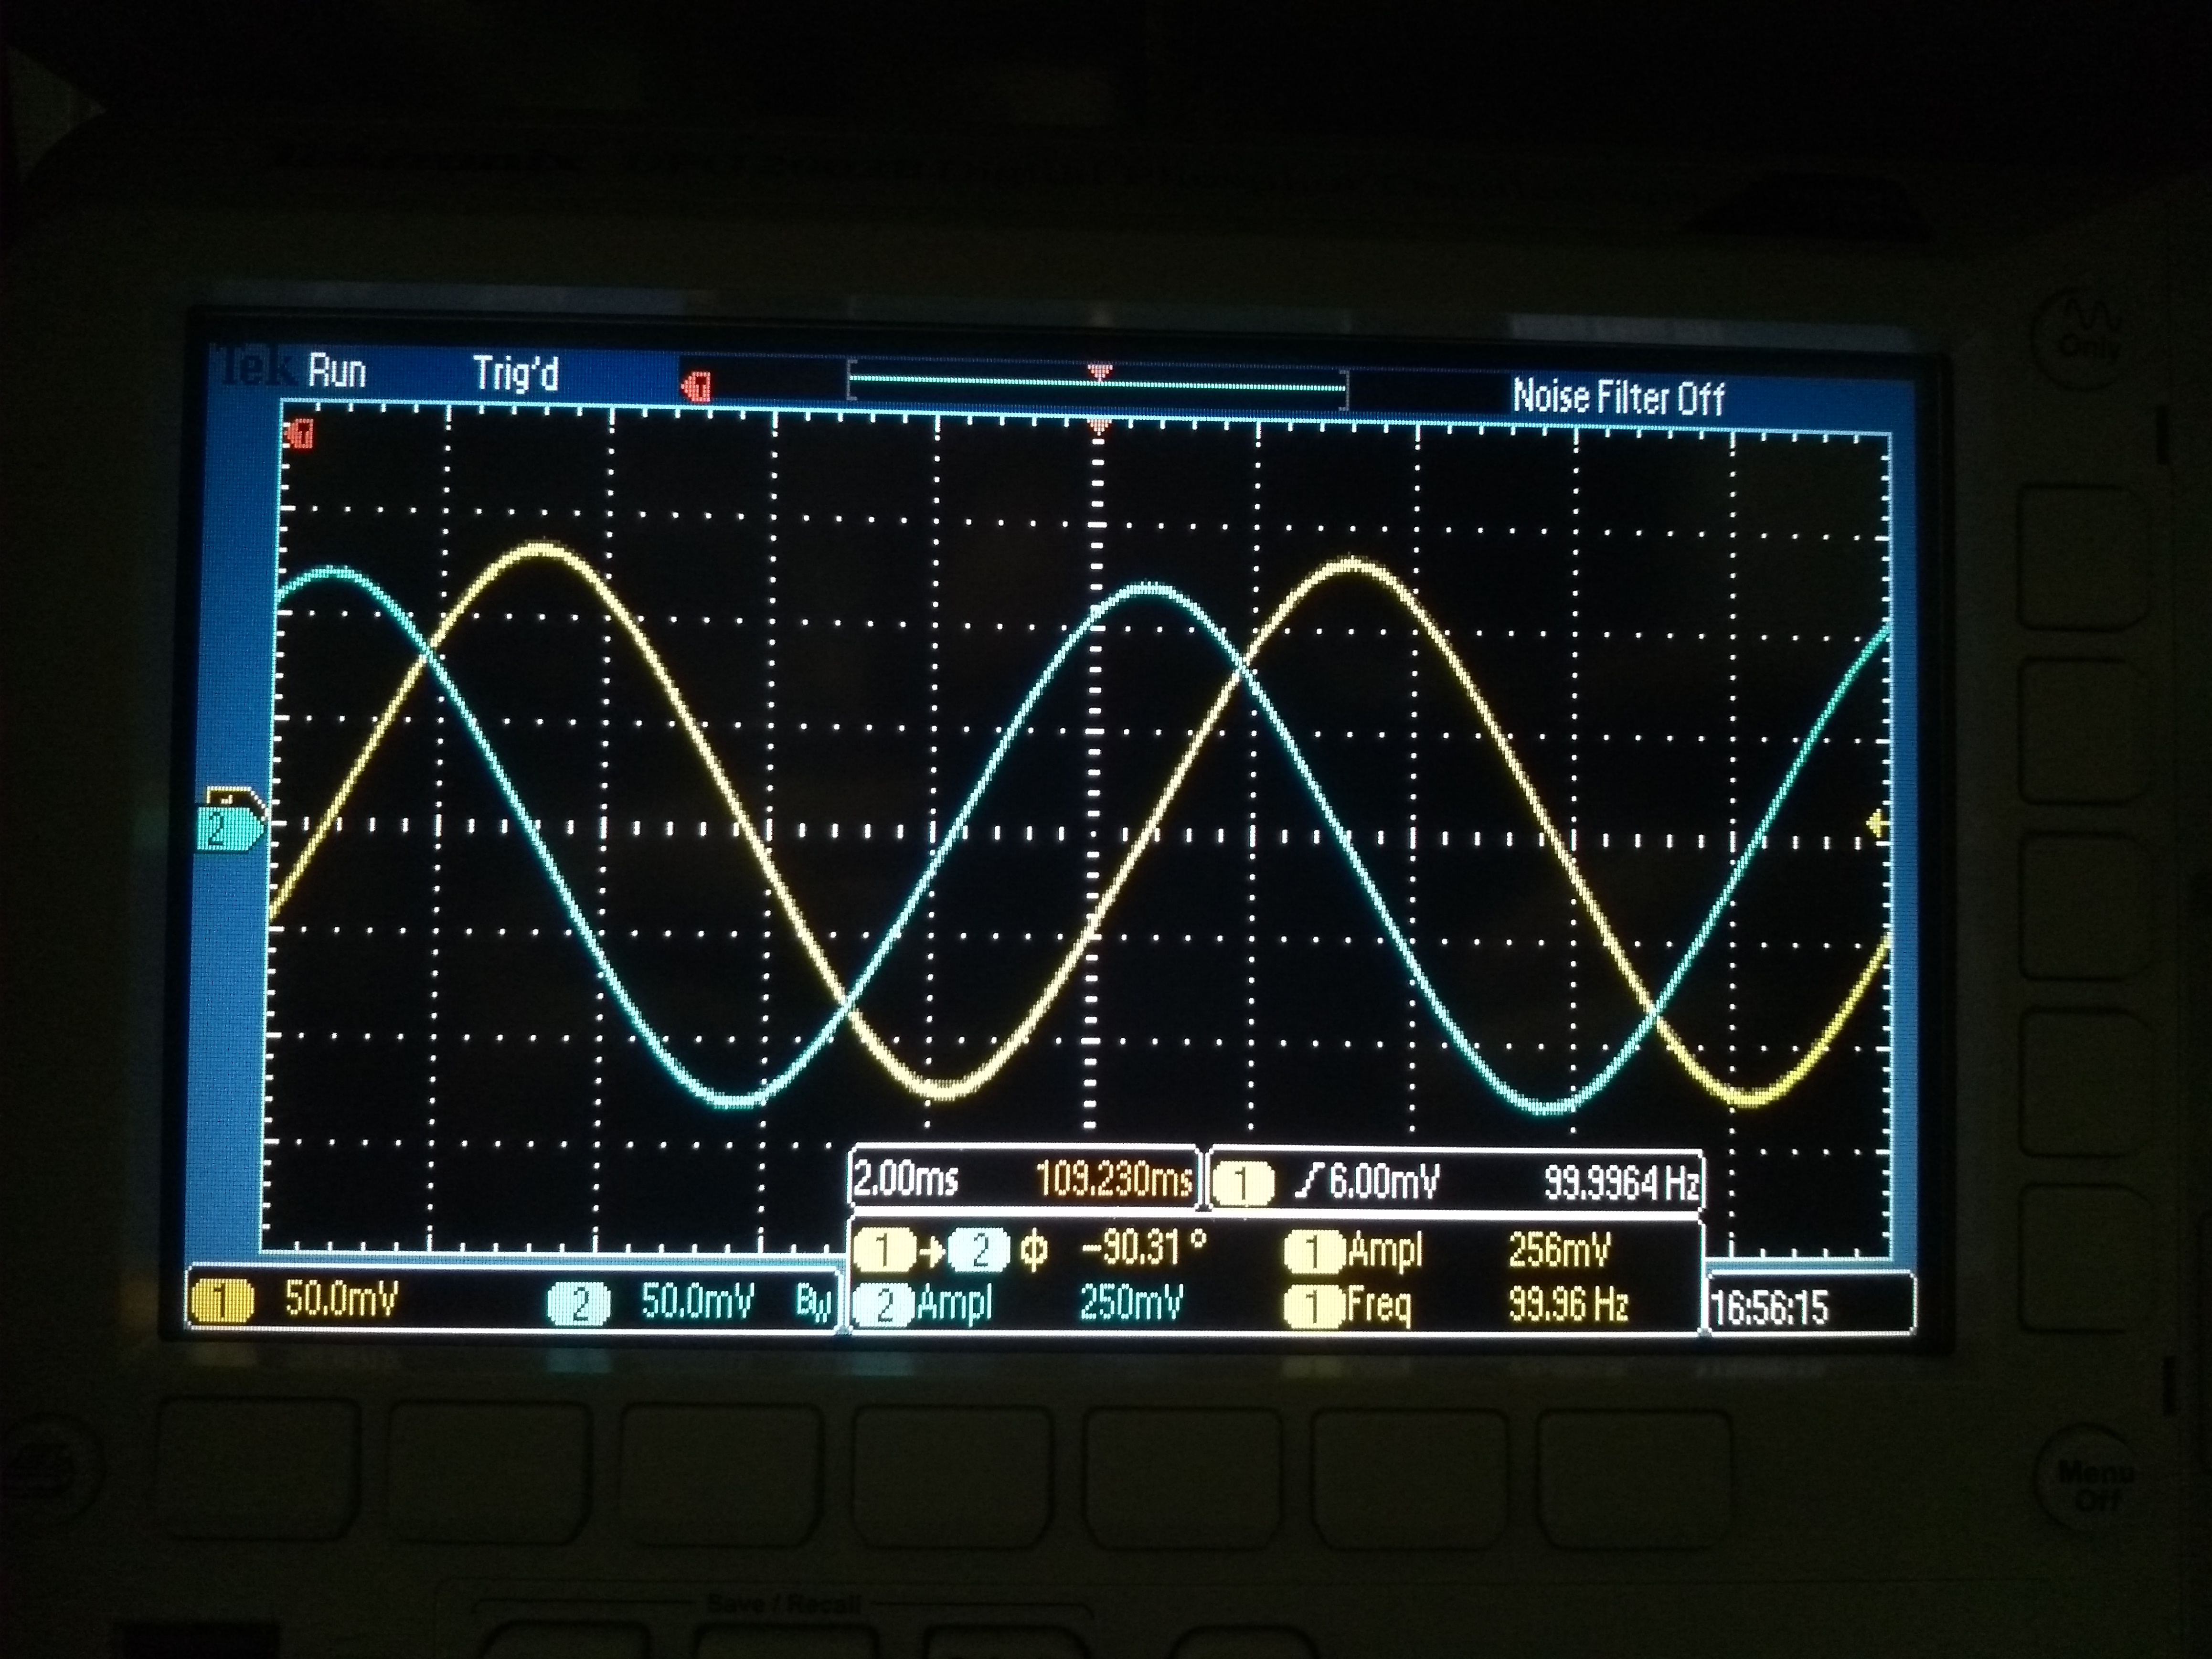
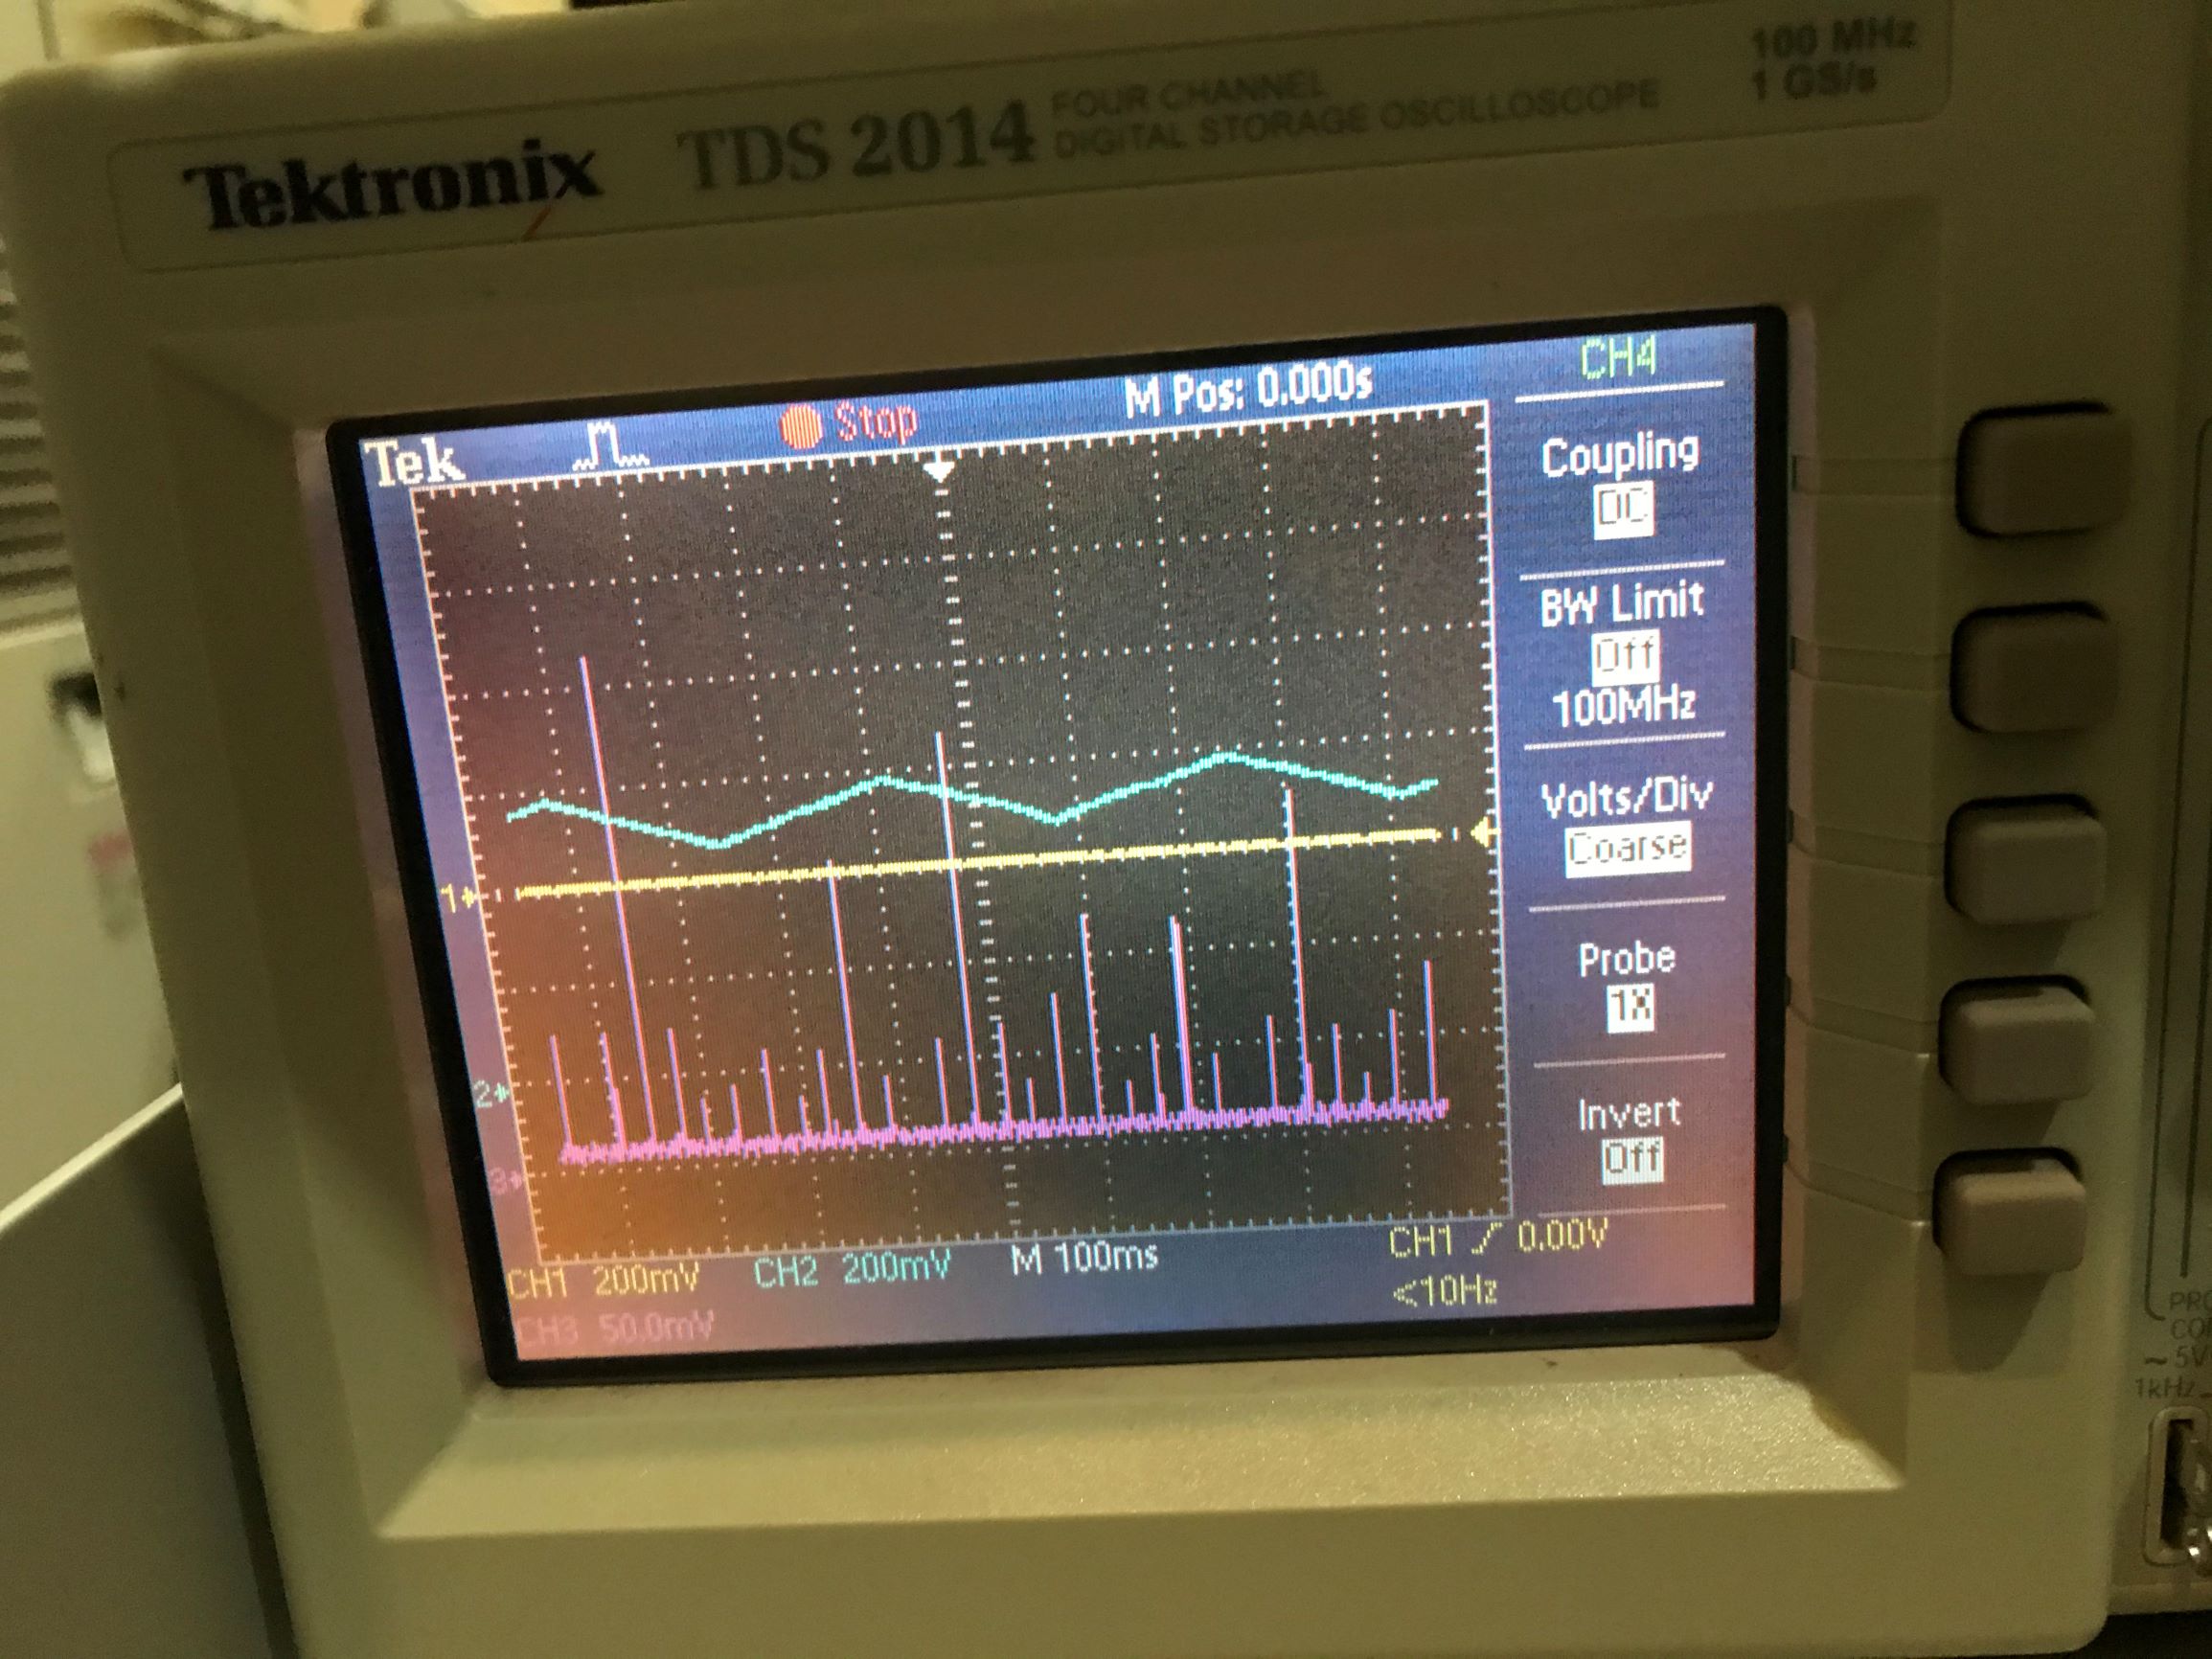
We sent a LO and RF signal from DDS (-6 dB both). LO was at 78 MHz and RF was at 78MHz + 100 Hz. We could correctly seeing a signal at 100 Hz after the demodulation, shifted by 90 deg in the I and Q output. (see pic).
We tested other offsets (from 1 Hz to 10 kHz). For all these values demodulated signal has a constant amplitude fase offset between I and Q is always ~90 deg. We verified this for all the 4 channels.
Matteo, Eleonora
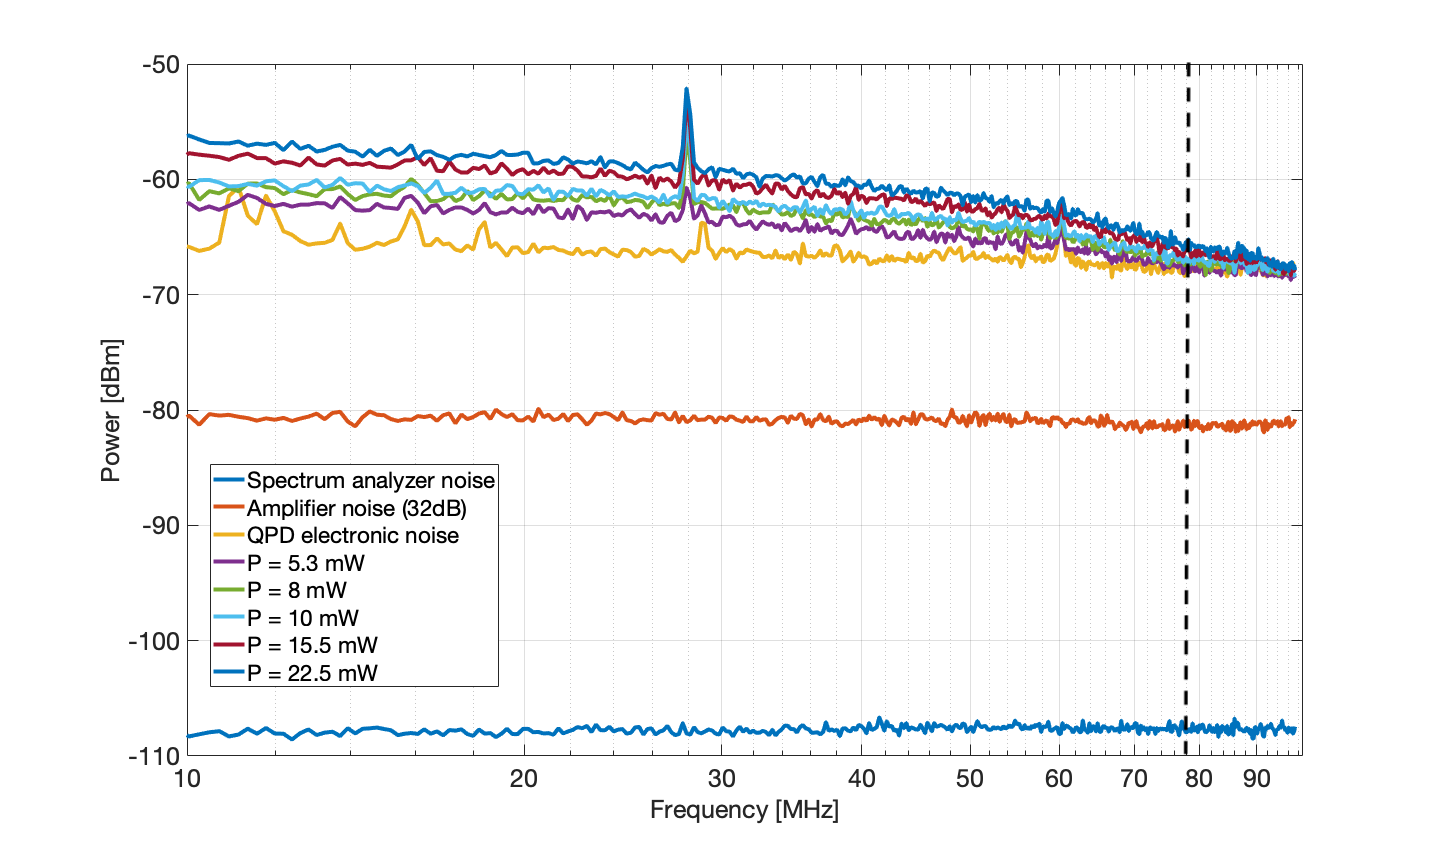
We put a reflective mirror after green FI so that the light is reflected back to the QPD2 using the standard path. The power was changed acting on the AOM modulation amplitude. 78MHz and 87.6 MHz modulation are switched off.
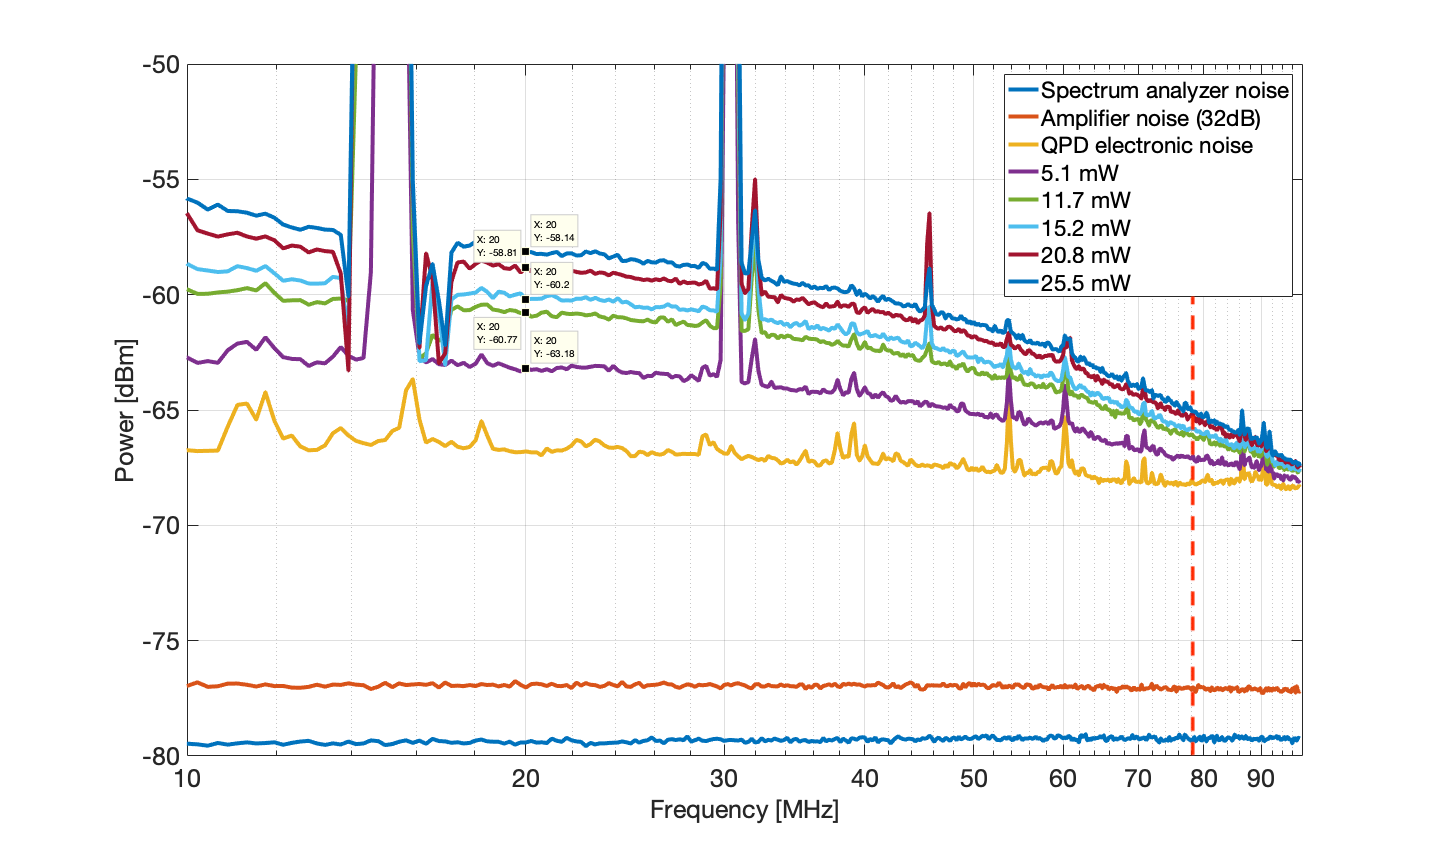
Pic 1: RF output of QPD2 Seg 1 in with different power level.
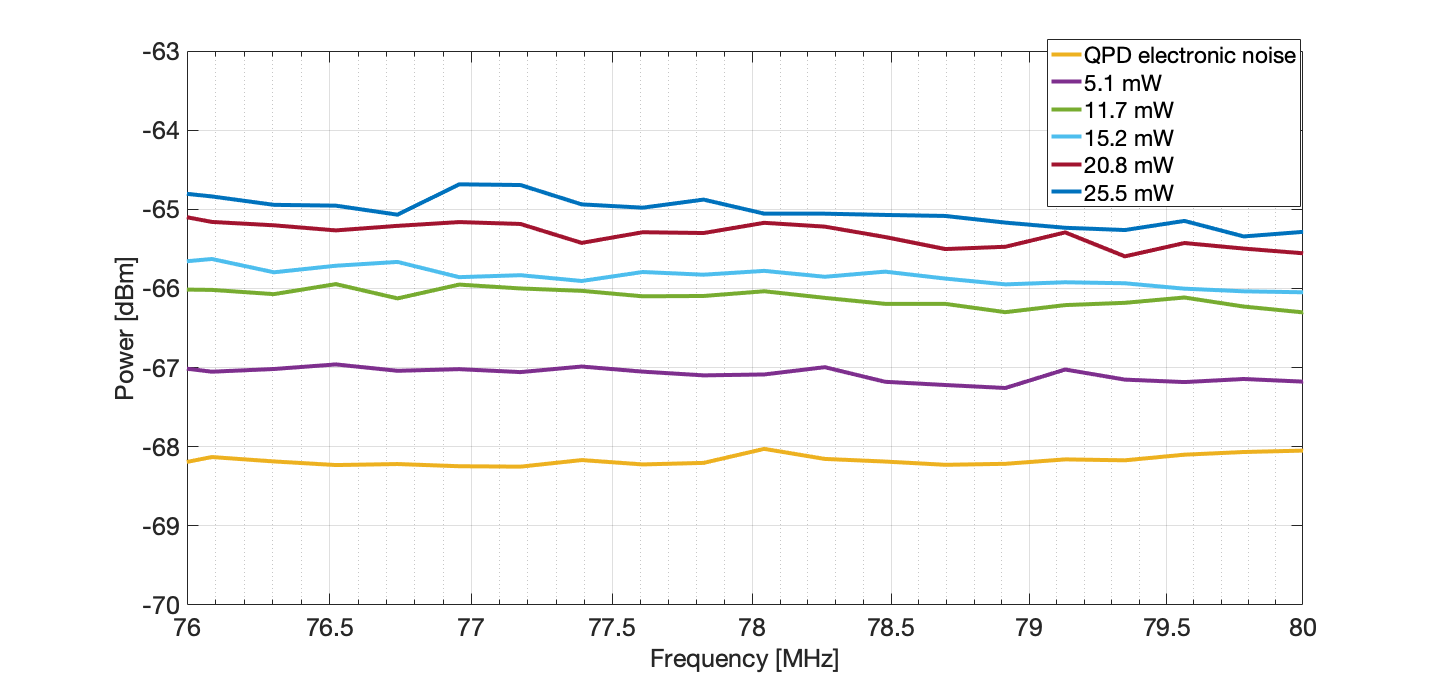
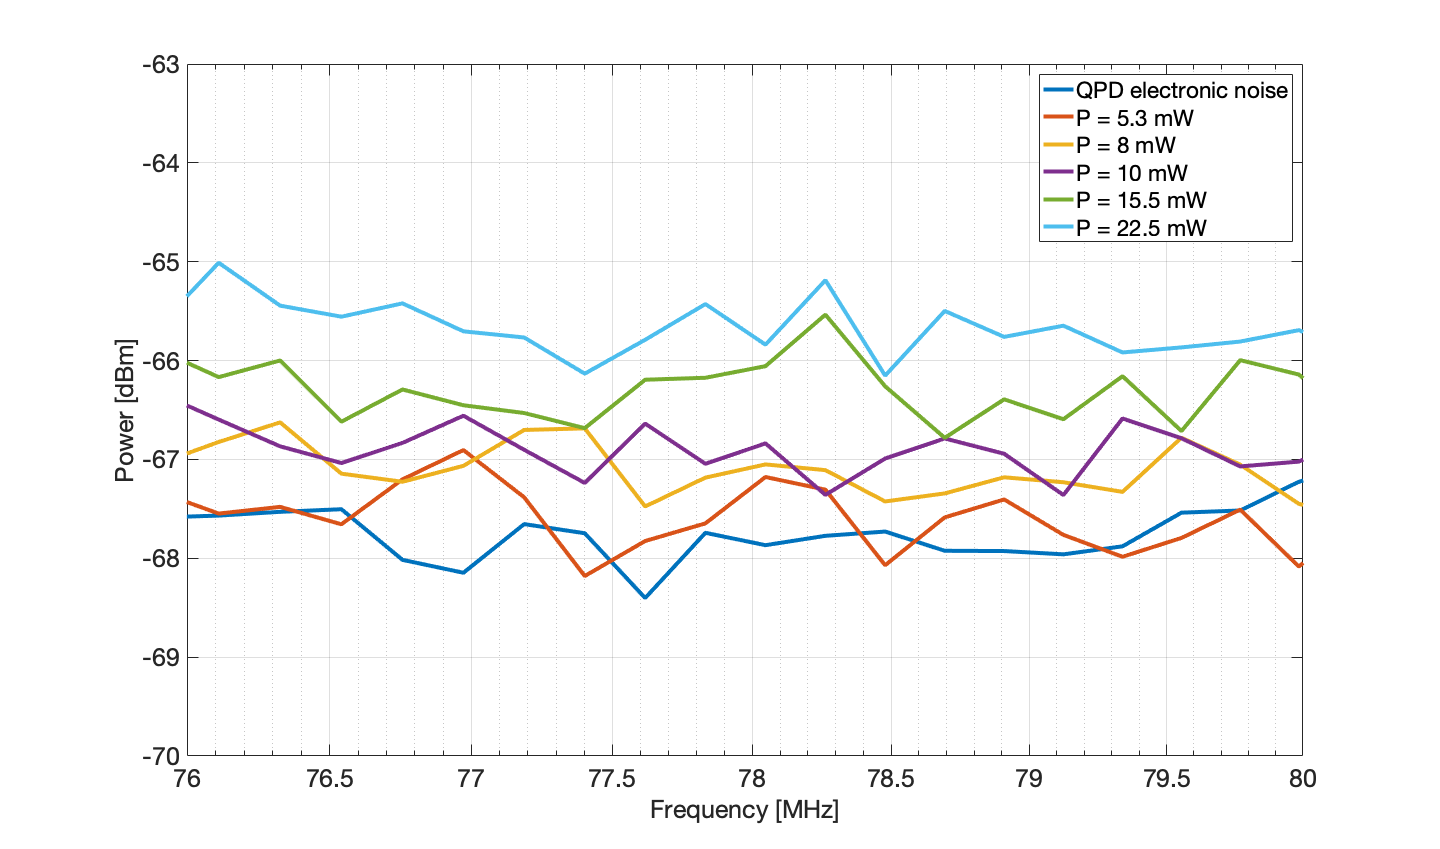
Pic 2: Same of Pic 1 but zoomed around 78 MHz.
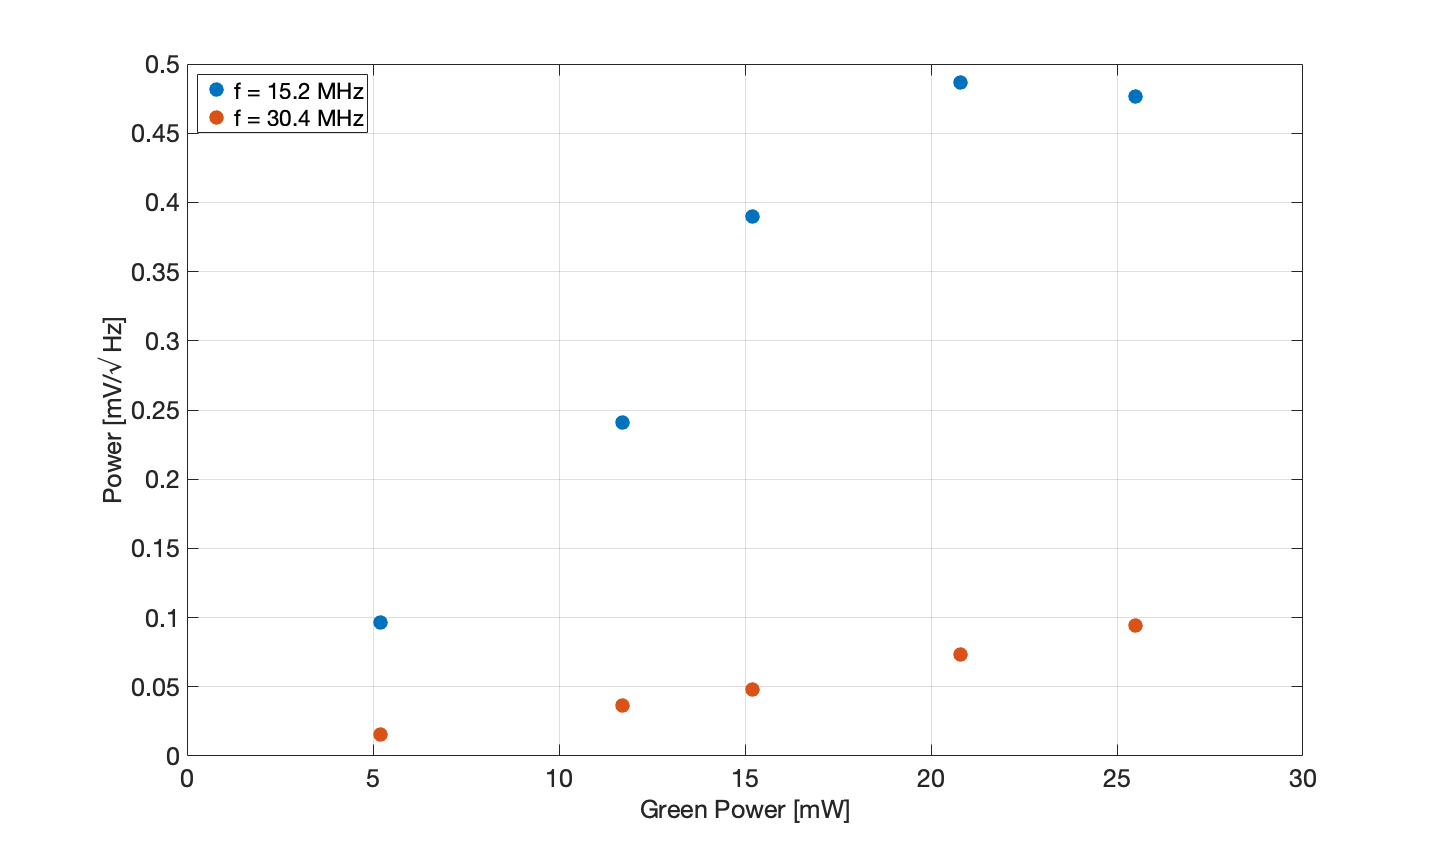
Pic 3: Peak height at 15.2MHz and 30.4 MHz as a function of the green power. (This is a real signals come from PDH of SHG)
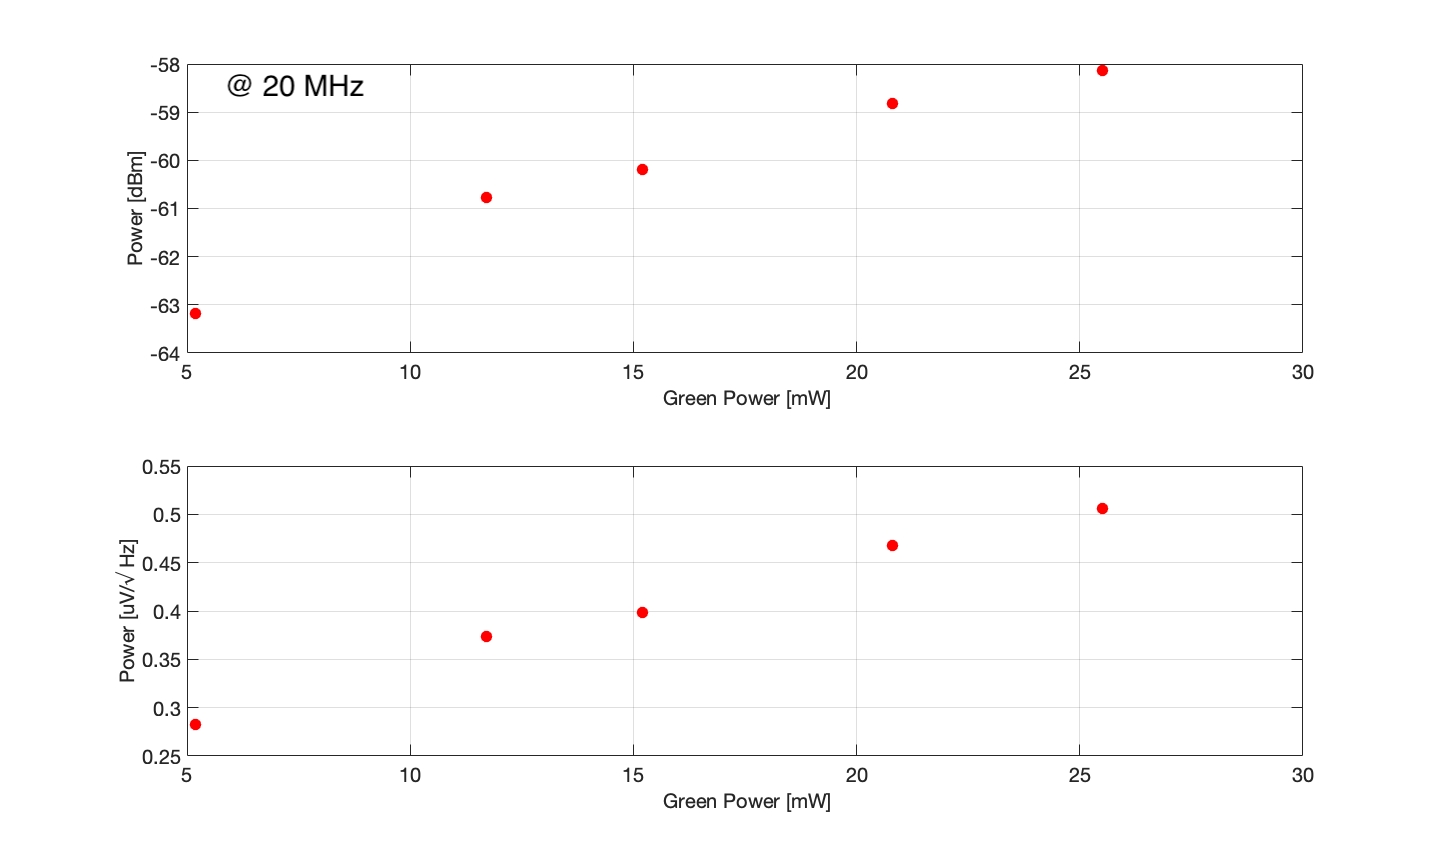
Pic 4: Noise at 20 MHz as function of the green power.
Measured data are reported below:
| Green Power [mW] |
Current [mA] |
Noise @ 20 MHz [dBm] | Noise @ 20 MHz [uV/sqrt Hz] | Peak @15.2 MHz [dBm] | Peak @ 15.2 MHz [mV/sqrt Hz] | Peak @ 30.4 MHz [dBm] | Peak @ 30.4 MHz [mV/sqrt Hz] |
| 5.2 | 0.6 | -63.18 | 0.28 | -12.53 | 0.097 | -28.20 | 0.0159 |
| 11.7 | 1.8 | -60.77 | 0.37 | -4.57 | 0.24 | -21.00 | 0.0364 |
| 15.2 | 15.2 | -60.20 | 0.40 | -0.40 | 0.39 | -18.55 | 0.0482 |
| 20.8 | 20.8 | -58.81 | 0.47 | 1.52 | 0.49 | -14.88 | 0.0736 |
| 25.5 | 25.5 | -58.14 | 0.51 | 1.34 | 0.48 | -12.73 |
0.0943 |
We used the following setting :
RBW: 300kHz. VBW: 10kHz
Average: 10
Internal amplifier: OFF
Spectrum analyzer attenuator: 10 dB
When measuring the peak hight we used different attenuation levels (20/30 dB) to avoid saturation
Yuhang, Eleonora
We changed the BS used to split the reflection of green FI FC lock PD and QPDs.
Before we were using a BS T 10 (70:30 for s-pol) and we replaced it with a BS X 10 (90:10 for s-pol).
Note that we are using p-pol so the actual ratios are different.
In the previous configuration we had 2 OD (0.5 and 0.6). Now we use only one OD (0.6) and the power is ~0.35 mW and the power reacing the pd is ~150 uW
We need to check FC PDH signal.
Yuhang, Eleonora
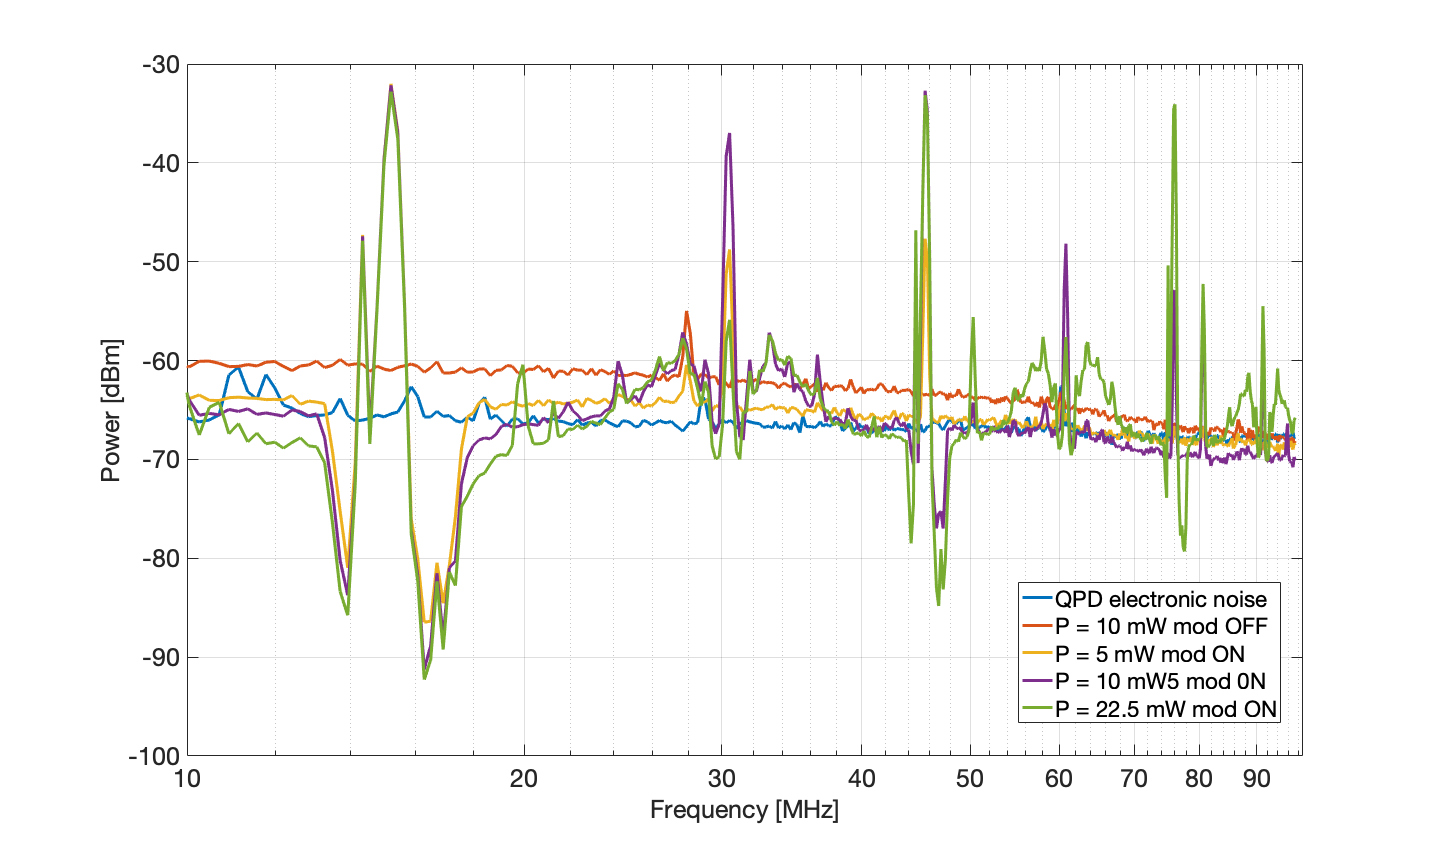
Pic 1: RF output of QPD2 Seg 1 in with different power level.
The 15.2 MHz modualtion was switched off. The SHG was set on resonance manually. For each measurment we double-check that the power was stable.
We put a reflective mirror after Green FI so that the light is reflected back to the QPD using the standar path. The power was changed acting on the AOM modulation amplitude.
For 10 mW of green power we measured 1.8mA
Pic 2: Same of Pic 1 but zoomed around 78 MHz.
Pic 3: RF output of QPD2 Seg 2 in with different power level. This time the 15.2 MHz modulation was switched on. The EOM RF driving signal was - 9dbm in this measurement. (Note that DDS output (-6dBm) is usualy amplified by 14dB and attanuated by -6dB, in this case we divided the DDS output by 8 in the software (corresponding to -9dB)). We want to confirm how much modulation depth are we using for 15.2 MHz EOM. I put a curve with modulation switched on (P = 10 mW) for comparison. The stuctures are at harmonic frequencies of 15.2 MHz. It seems there is a quite strong saturation effect. This is strange becasue this effect was not observed in e-log #2067 when the 15.2MHz modulation was even higher (not dived by 8 inside DDS software). [UPDATE: we found this is due to saturation of the spectrum anlayizer internal amplifier which was off in the previous measurement]
###################################################
We used the following setting (see Pic4):
RBW: 300kHz
Average: 10
Internal amplifier: On
We found that electronicn noise on seg 2-3-4 is ~ -67 dBm while for seg 1 is ~ -69 dBm.
Matteo, Yuhang, Eleonora
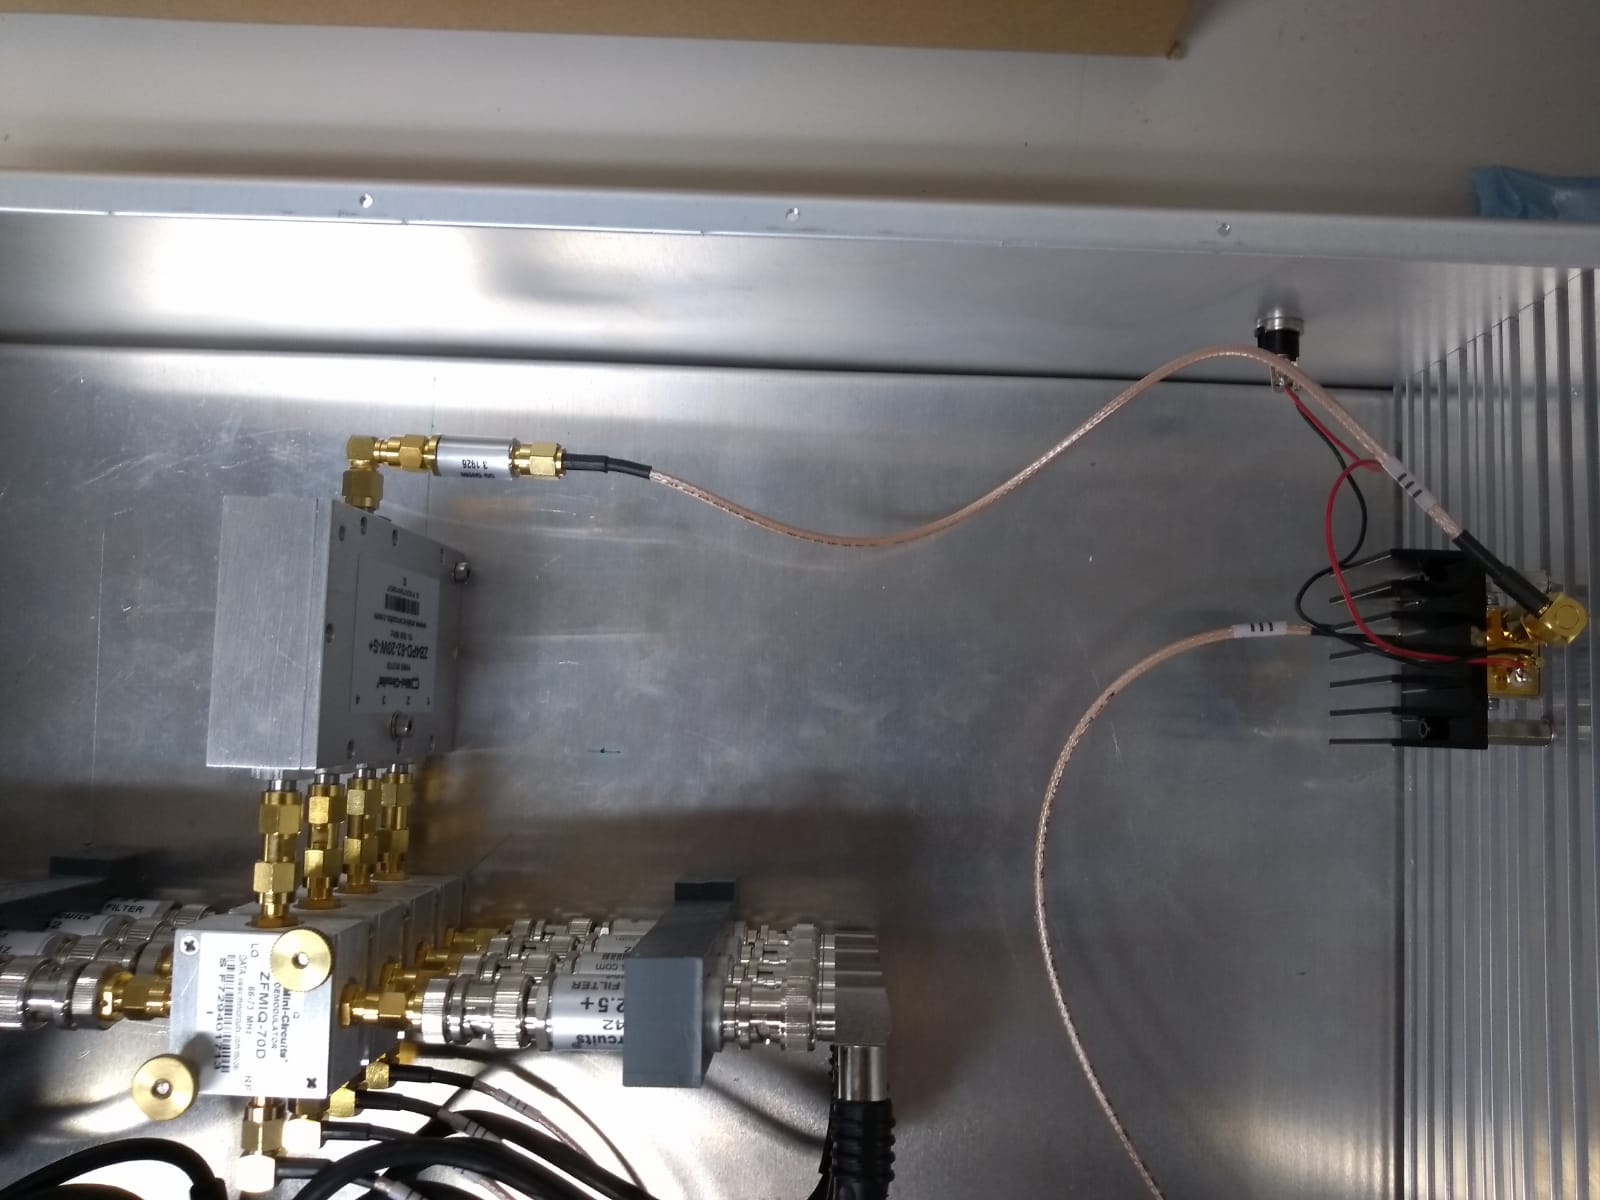
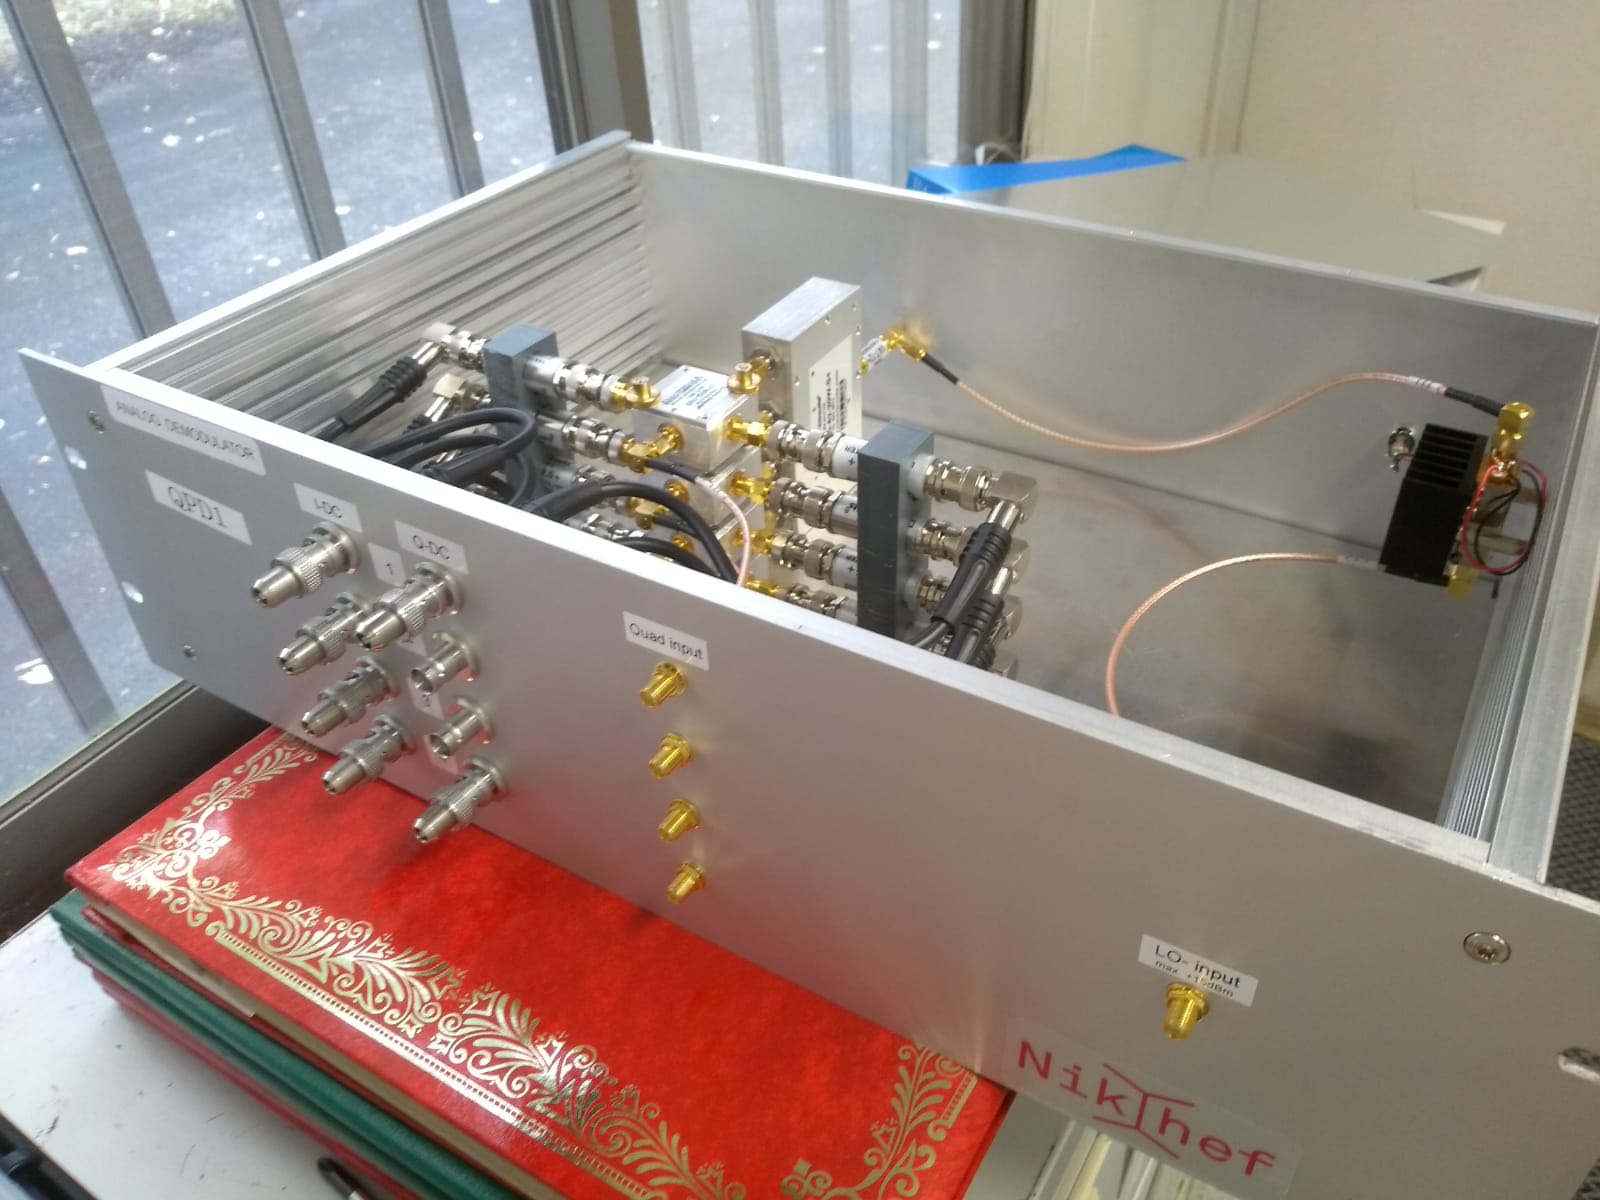
An attenuator of 12 dB was added in QPD1 demodulator between the LO amplifier and the splitter.
See attached scheme and pictures.
Now a LO of -6dBm (DDS output) shoud not exceed the maximum power allowed by the mixer.
What I Did
- Lock the laser to the folded cavity
- Did ringdown measurement for rough estimation of the finesse
First, I tried to lock the laser with the servo by adjusting the offset.
Then I could lock and transmitted power was 60 uW.
After that, I turne off the AOM in order to test the ringdown measurement.
The decay time was about 2.5 usec.
It should be noted that the decay time of diffracted beam power by AOM was about 100 nsec.
Therefore, the impact of AOM can be negligible.
From this result, the finesse can be estimated about 1.4-1.5*104.
Next time, I will record the result and calculate the decay time by fitting.
Next Step
- Measure the OLTF
- Ringdown measurement test
- Thermometer installation
Yuhang, Eleonora
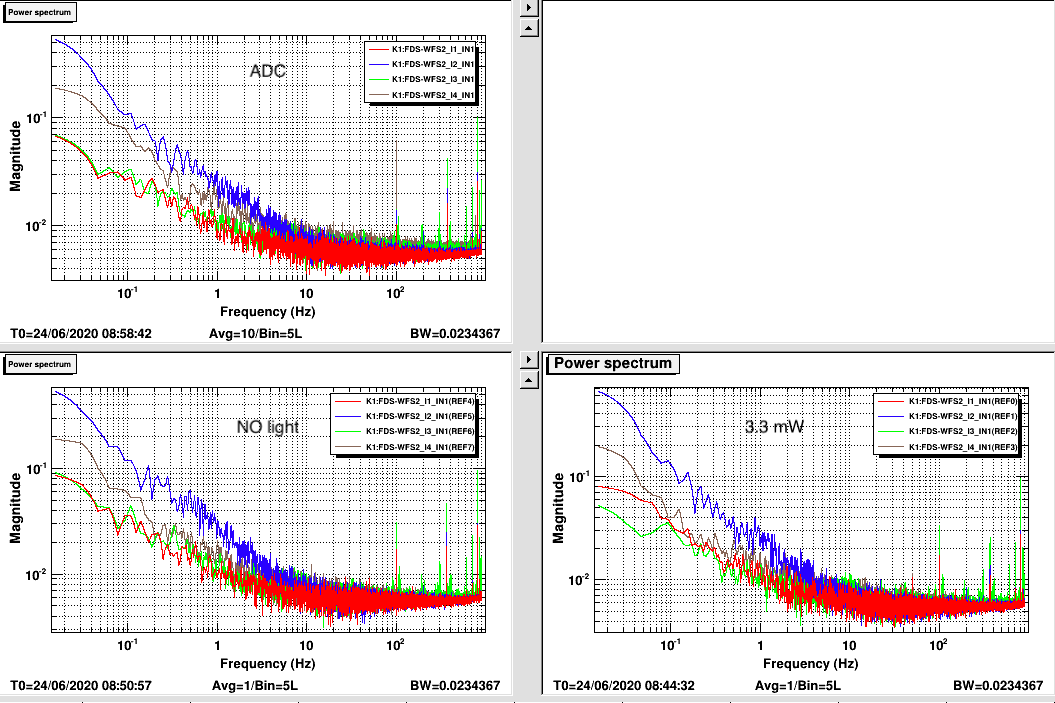
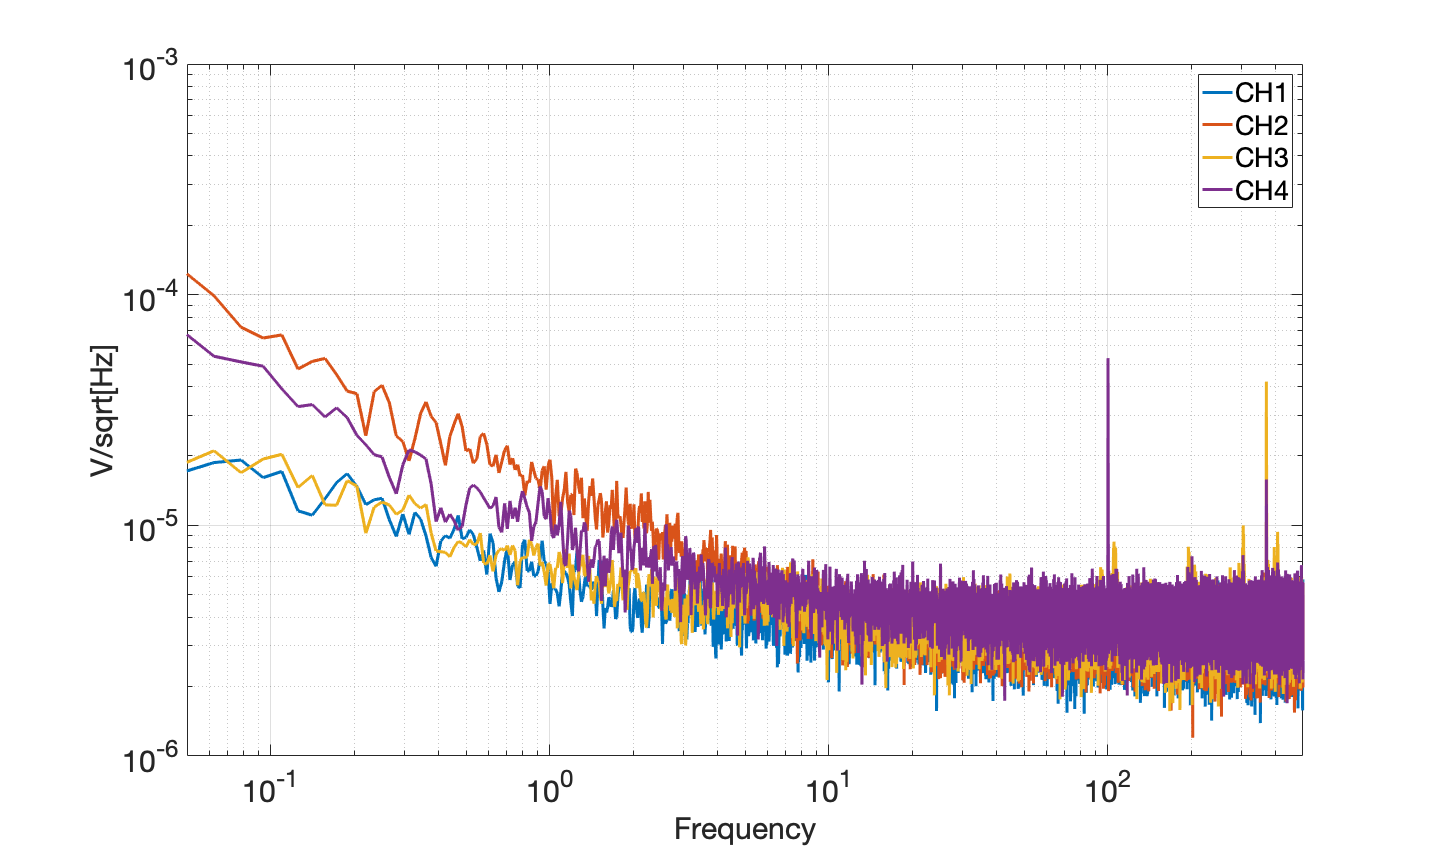
On 24/06 we quicky checked the output of demodulated signal QPD2 acquiring it with DGS.
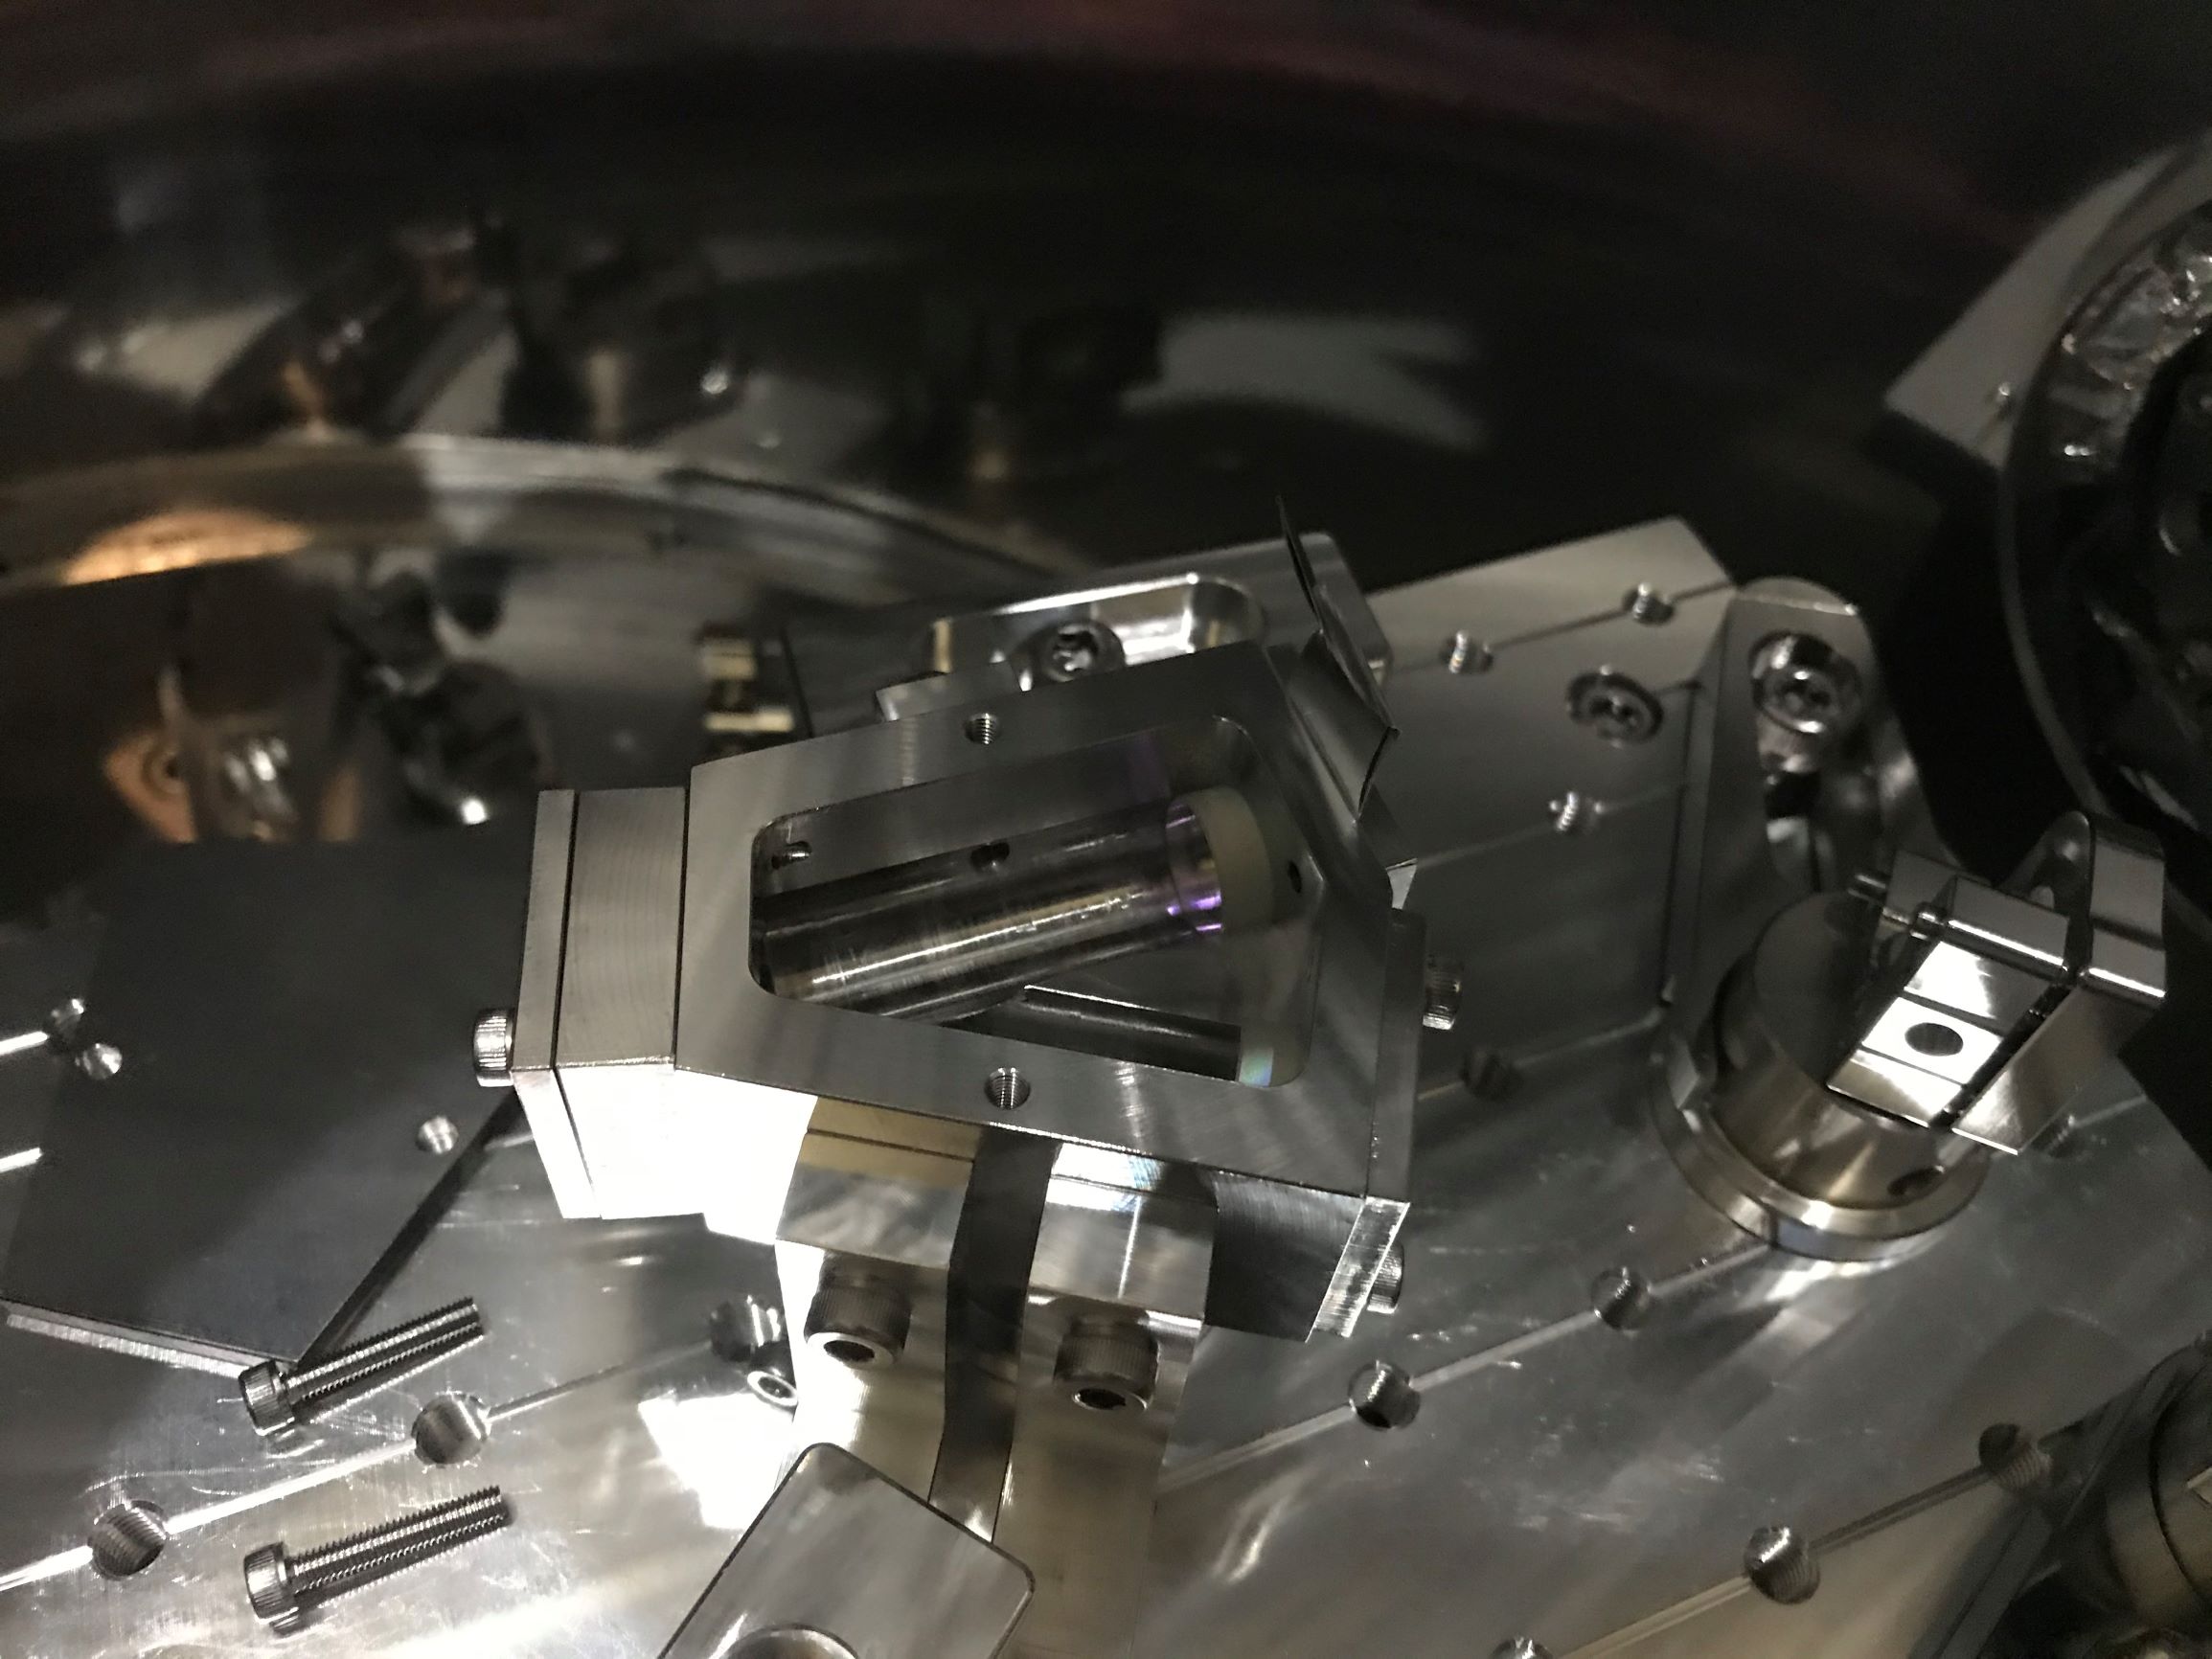
The measurement was done by putting a reflective mirror after the last green faraday before viewport. The beam was centered into the quadrant. Power on QPD was 3.3 mW.
There was no additional amplification.
As shown in Pic. 1 the signal is dominated by ADC noise.
Pic.2 shows a calibrated spectrum of the ADC noise for the 4 channels used to acquire the demodulated RF signals.
I replaced the screws which were used to fix the input and output mirrors.
Then I tried to improve the alignment.
Finally, the transmitted power became about 180 uW.
Tomorrow I will try to measure the finesse and lock the laser.
Then try to measure the OLTF.
What I Did
Today I locked the laser to the fixed folded cavity.
After the alignment work, I measured the output power by the power meter.
The output power was 4.7 uW.
This may be due to the alignment problem.
Using this value, one can estimate the intra-cavity power.
Since the transmittance of the mirror is 0.017 %, the intra-cavity power can be estimated about 28 mW.
There is room for improvement.
Next Step
I am planing to improve the alignment of the mirrors and try to increase the output power to 100 uW.
Then I will try to lock with pumps on.
Also, some pedestals are to be replaced to vacuum copatible ones.
Log on June 23, 2020
What I did
First, I tried to lock the laser with turbo pump on.
Actually, the lock was not stable and it may need suspension to reduce the vibration.
Then, I inserted the spacer and installed mirrors to compose the folded cavity.
The procedure was as usual.
This time I removed the block between the spacer and mirror holder to reduce the cavity length as shown in the picture.
Thanks to this, I could see the transmitted flash as shown in the picture (red line).
Still transmitted power is low and need to be improved.
Next step
I will improve the alignment to increase the transmitted power.
Then I will try to lock the laser to the cavity.
Log on June 19, 2020
What I did
I installed the servo which was from TAMA and modified.
Then I tried to lock by adjusting the gain and the offset.
Result
I could lock the laser to the cavity though the lock lasted only 10 sec or so.
The transmitted beam power was about 160 uW.
As the transmittance of the mirror is 0.017%, the intra-cavity power is estimated as about 1 W which is a reasonable value.
Next step
I am planning to lock the laser under the vacuum pressure to check whether I can or not lock when the turbo pump is on.
Also I will measure the open loop TF to see the phase margin and so on.