Yuhang, Eleonora
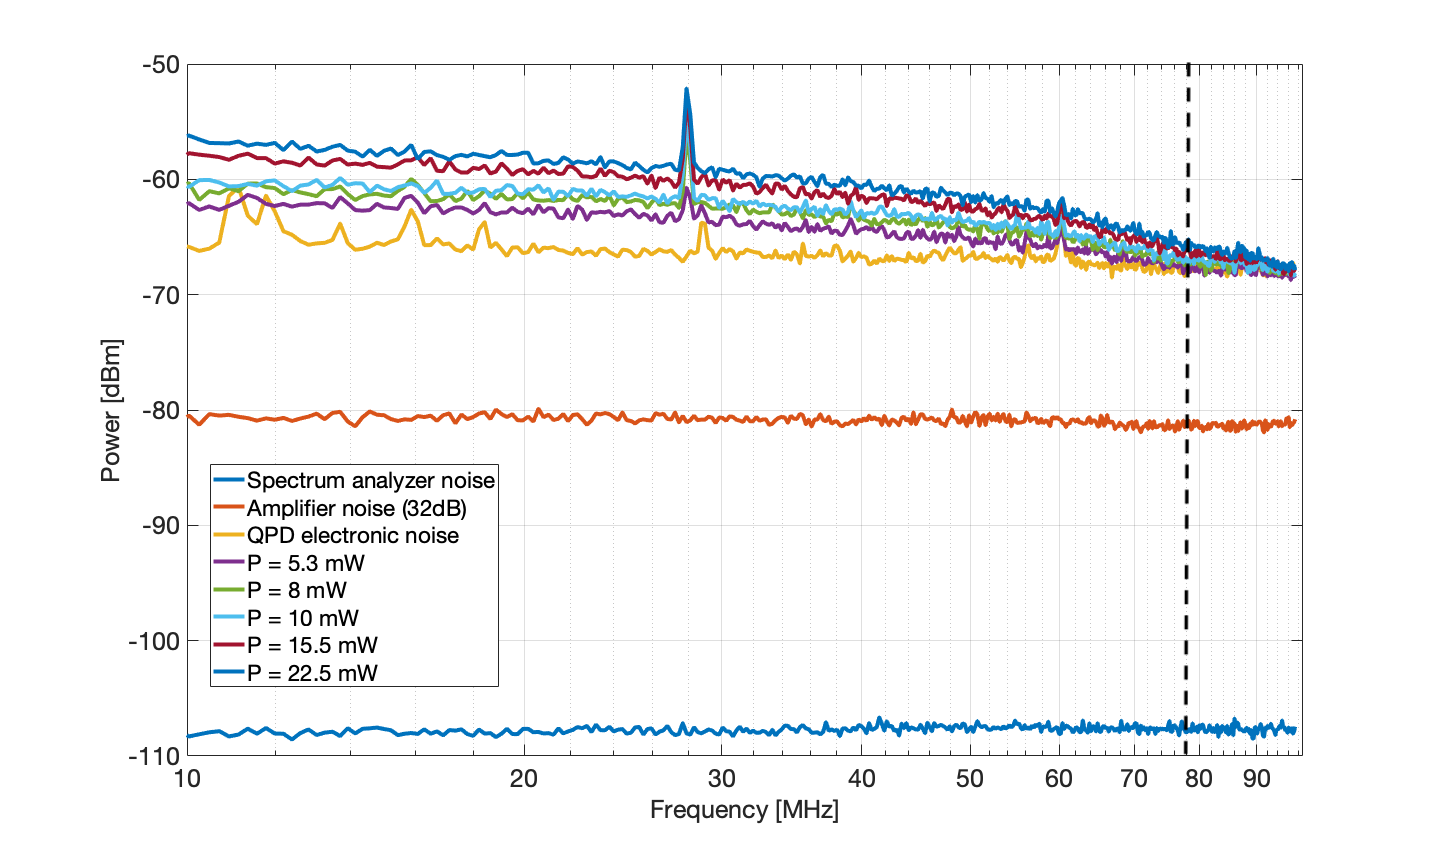
Pic 1: RF output of QPD2 Seg 1 in with different power level.
The 15.2 MHz modualtion was switched off. The SHG was set on resonance manually. For each measurment we double-check that the power was stable.
We put a reflective mirror after Green FI so that the light is reflected back to the QPD using the standar path. The power was changed acting on the AOM modulation amplitude.
For 10 mW of green power we measured 1.8mA
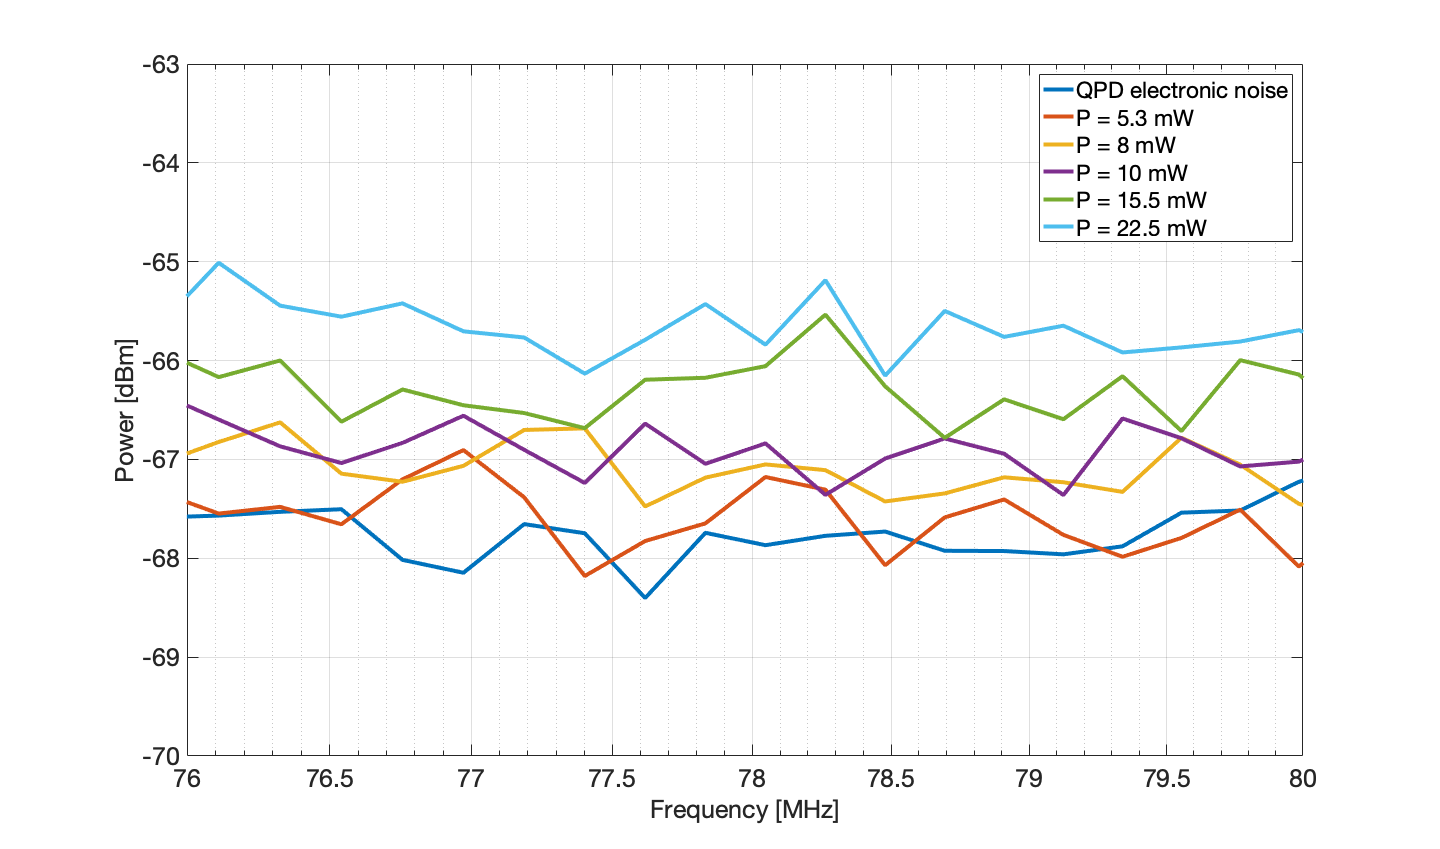
Pic 2: Same of Pic 1 but zoomed around 78 MHz.
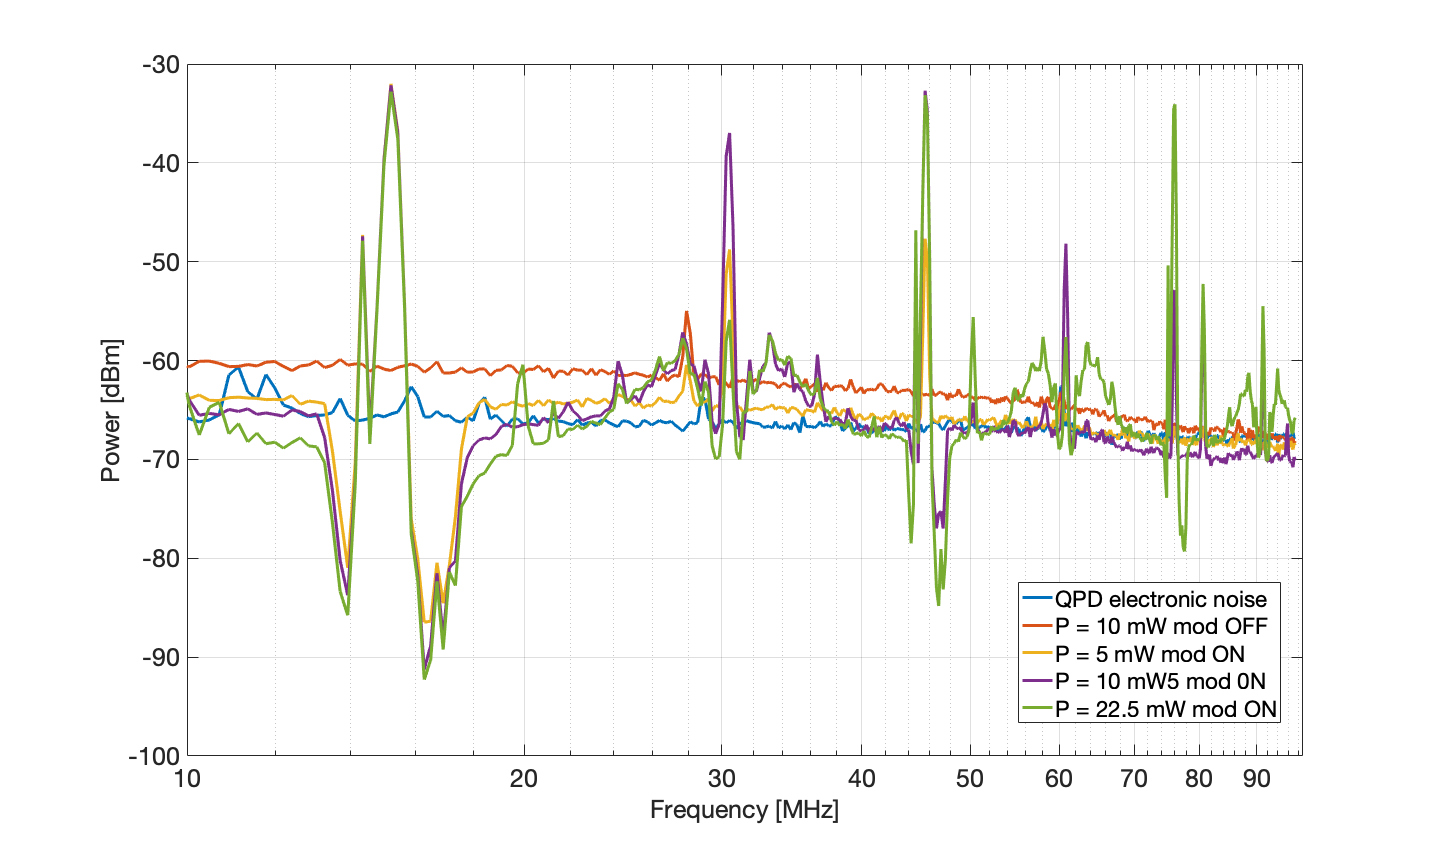
Pic 3: RF output of QPD2 Seg 2 in with different power level. This time the 15.2 MHz modulation was switched on. The EOM RF driving signal was - 9dbm in this measurement. (Note that DDS output (-6dBm) is usualy amplified by 14dB and attanuated by -6dB, in this case we divided the DDS output by 8 in the software (corresponding to -9dB)). We want to confirm how much modulation depth are we using for 15.2 MHz EOM. I put a curve with modulation switched on (P = 10 mW) for comparison. The stuctures are at harmonic frequencies of 15.2 MHz. It seems there is a quite strong saturation effect. This is strange becasue this effect was not observed in e-log #2067 when the 15.2MHz modulation was even higher (not dived by 8 inside DDS software). [UPDATE: we found this is due to saturation of the spectrum anlayizer internal amplifier which was off in the previous measurement]
###################################################
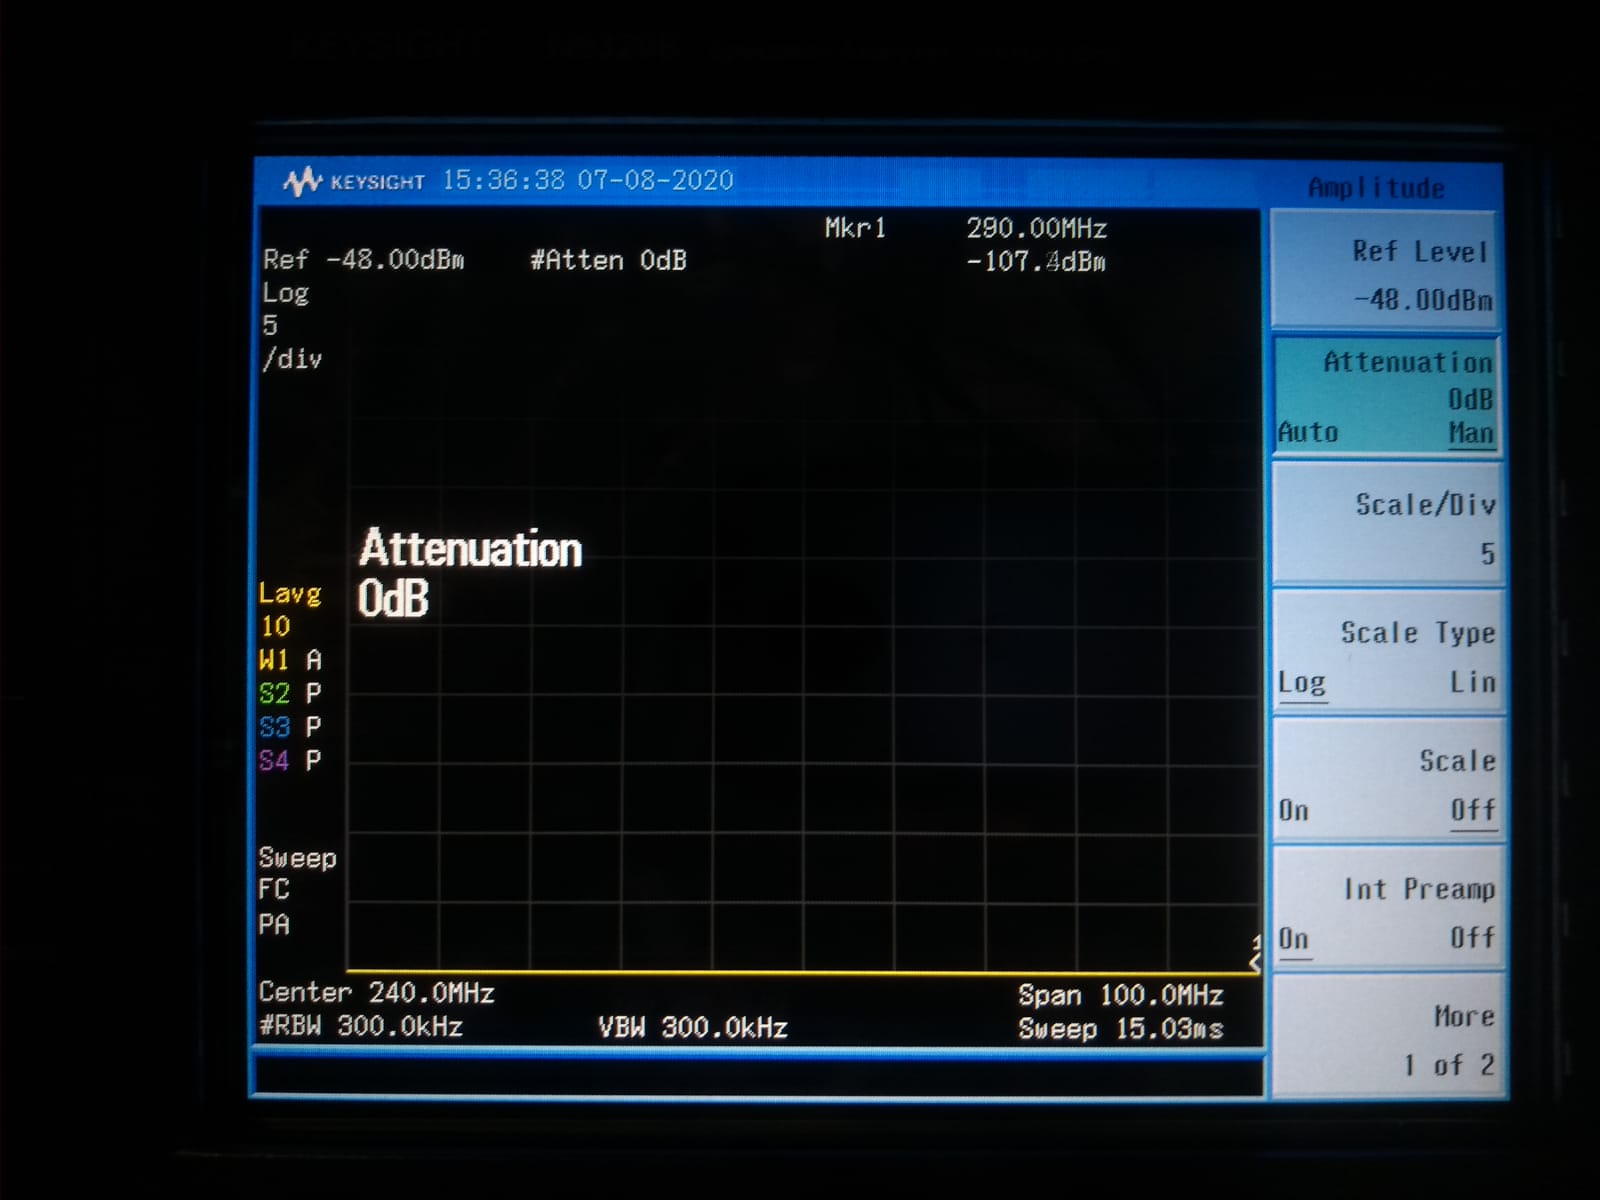
We used the following setting (see Pic4):
RBW: 300kHz
Average: 10
Internal amplifier: On
We found that electronicn noise on seg 2-3-4 is ~ -67 dBm while for seg 1 is ~ -69 dBm.