Yuhang, Eleonora
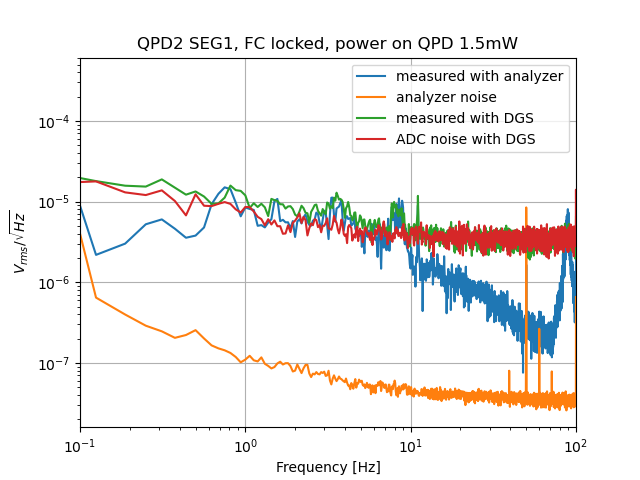
Pic.1 shows the QPD2 (seg 1) signal for FC (oplev OFF), aquired with DGS and spectrum analizer respectively for 1.5 mW sent on QPD
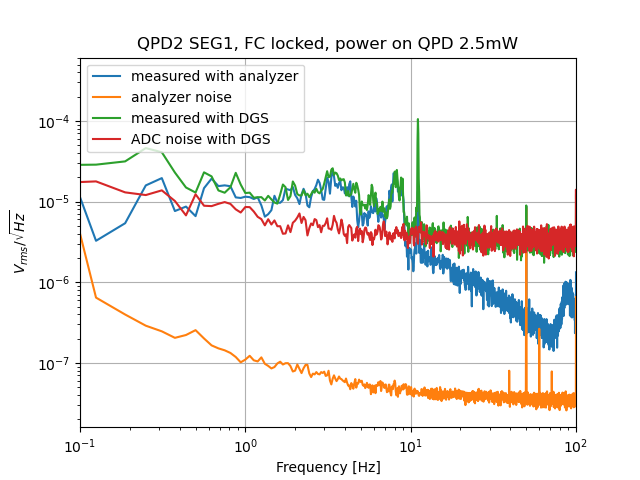
Pic.2 shows the QPD2 (seg 1) signal for FC (oplev OFF), aquired with DGS and spectrum analizer respectively for 2.5 mW sent on QPD
We checked that the QPD dark noise is below the spectrum analyzer noise.
# About green power to FC
In order to have more light on QPD we increased the light injected into FC by incresing modulation amplitude of AOM/ ( from 2.5dBm to 5.5dBm).
The green refleced light when FC is locked is about 1/4 of the input light. The reflected light is splitted by a BS (92:8) and 92% is send to QPDs and 8% is sent to FC lock PD. (note that an additional attenuation of a factor 3 is present before the PD)
The usual amount of light sent to FC is ~14.5 mW, the maximum we can send is ~25 mW. The limitation is due to 78 MHz EOM damage threshold.
Here the two cases corresponding to the shown measurement:
| Injected into FC |
TOT reflected |
to each QPD | to lock PD(before attenuation) |
| 14.5 mW | 3.6 mW | 1.5 mW | 0.3 mW |
| 25.5 mW | 5.8 mW | 2.5 mW | 0.5 mW |