NAOJ GW Elog Logbook 3.2

1-Setting of switches on the front panel:
* The differentiator shall be disabled on the front panel in setting the switch on "OFF".
* The switch INV/NON INV on the front panel, shall be set on INV.
2-Setting of the 8 straps on the board:
Low-pass filter, Notch filter 1 and notch filter 2 are activated on the board in setting strap on connectors P7, P8 and P9 (3 pins) between pins 1 and 2
* The reflection signal is negative with a base at about -600mV (after the change of the trans-impedance resistor of the photodetector from 51 Ohm to 510 Ohm ).
It shall be inverted: the strap on connector P4 (3 pins) is set between pin 2 and 3.
The threshold level must normally be tuned to a positive level of +300mV (THRESHOLD OUT).
In practice, we had best result with a threshold level of about +500mV.
We had also to increase the sample-hold capacitor (C89). See below.
* Strap is set on connector P11 (3 pins), between pins 2 and 3, in order to activate the sample-and-hold on the triangular signal, on the locking.
* Strap is set on connector P3 (2 pins) to connect the triangular signal to the output stage.
* Strap is set on connector P2 (3 pins), between pins 1 and 2, for test purpose.
To check low-pass filter, notch 1 and notch 2 filters (in scan mode) between TEST IN and TEST OUT. For this test the differentiator, shall be set on "ON" (not intuitive but important). After this test, the differentiator shall be disabled the front panel in setting the switch on "OFF".
* Strap is set on connector P1 (2 pins), in order to be able to tune the offset.
3-Modification of components:
* Integrator 1/f: corner frequency changed to 154 Hz
Capacitor CMS 1206: C38 = 470nF
* Integrator 1/f2: corner frequency changed to 220 Hz
Capacitor CMS 1206: C26 = C33 = 330nF
* Low-pass filter: cut-off frequency changed to 154 Hz
Capacitor CMS 0805 : C45 = 2.2nF (0805) + 270nF (through capacitor)
Resistor CMS 1206 : R59 = 3.9k
* Notch filter 1: notch frequency changed to 11.85 kHz / quality factor changed to 3 (measured)
[Capacitor CMS 0805 1% : C49 ; C50 ; C51 ; C53 = unchanged (560 pF)]
Resistor CMS 1206 : R65 ; R66 ; R67 ; R68 = 24k
Resistor CMS 1206 : R73 = 2.7k
* Notch filter 2: notch frequency changed to 17.75 kHz / quality factor changed to 0.9 (measured)
[Capacitor CMS 0805 1% : C60 ; C61 ; C62 ; C63 = unchanged (560 pF)]
Resistor CMS 1206 : R79 ; R80 ; R81 ; R82 = 16k
Resistor CMS 1206: R89 = 13k
* Gain adjustment (G): Gmin = 0.0125 / Gmax = 0.5 / Gtyp = 0.1ÂÂ
Resistor CMS 1206 : R33 = 2.2k
Resistor CMS 1206 : R5 = 10k
Resistor CMS 1206 : R7 = 10k
* Modification of threshold circuit in order to have a better tuning.
Resistor CMS 1206 : R108 = 1M (hysteresis resistor).
Resistor 2k added between pin 1 of the J14 connector and the wire (red) going to potentiometer 2k on front panel
Resistor 2k added between pin 3 of the J14 connector and the wire (blue) going to potentiometer 2k on front panel
* Modification of he sample-hold capacitance on the triangular signal:
Capacitor 1206 of 4.7microFarad added on the 1microFarad capacitor (C89).
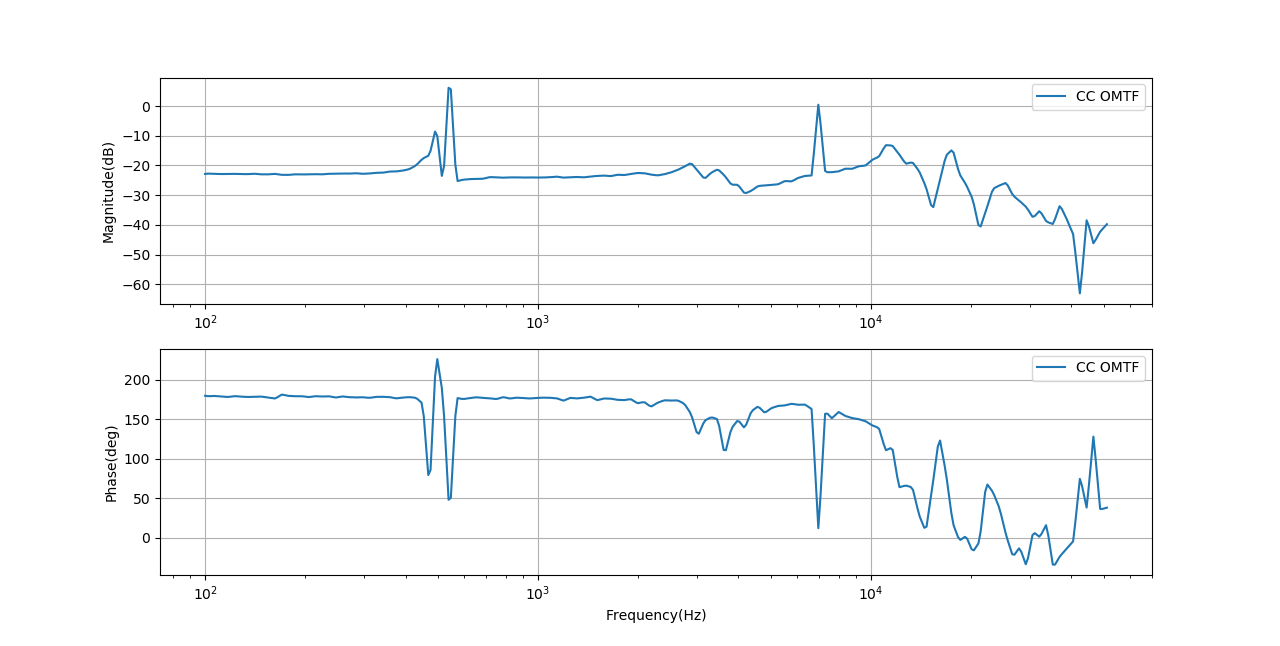
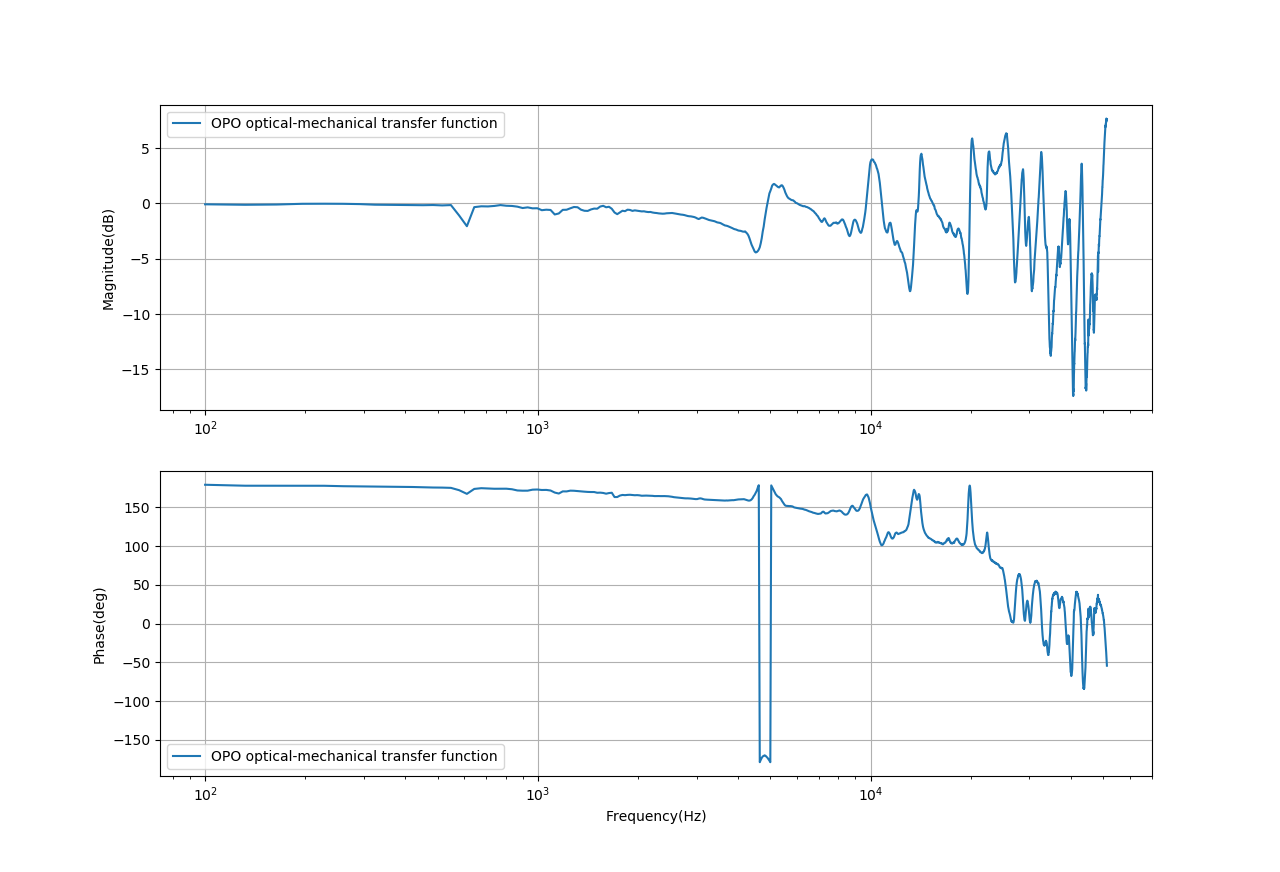
In the beginning, we measured the optomechanical transfer function of the CC loop with Stanford Research 560 at the beginning. However, since this lock is not so stable, the measurement was very noisy.
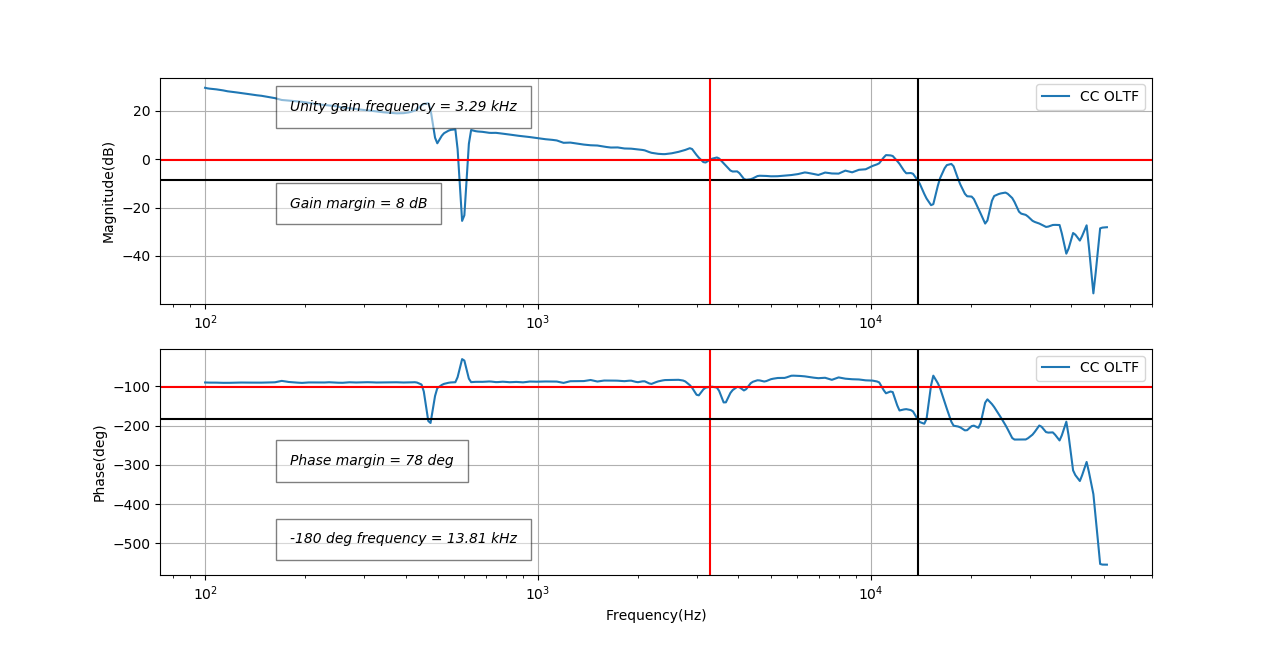
Then Pierre put an integrator before 10kHz. We could lock loop with high gain. However, this is a small stable region. If we increase or decrease gain, we can both have oscillation. Anyway, we can lock in that small region. Then we measured both open loop transfer function and optomechanical transfer function.
The result is shown in the attached figure. There are several peaks in the low-frequency region.
Pierre and Yuhang
Here is the open loop transfer function of OPO.
After connecting the power of homodyne and spectrum analyzer(this can remove the ground loop noise), I measured noise spectrum of homodyne again. During this measurement, there is only an infrared beam incident and has a power value of 1.3mW.
The result is shown in the attached figure.

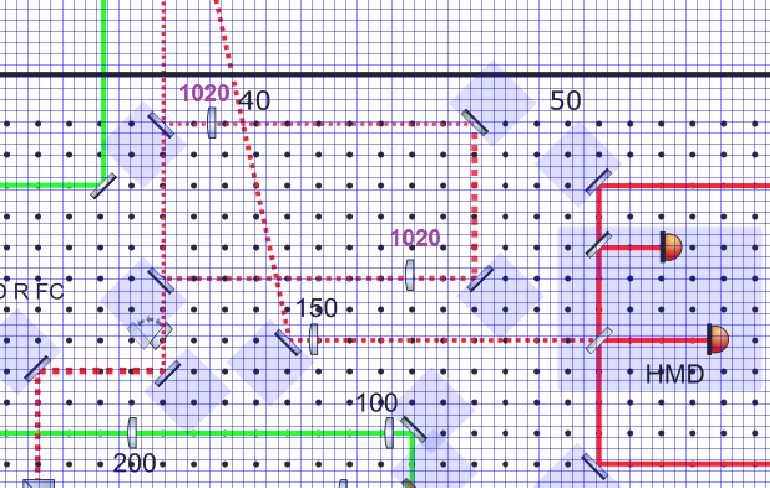
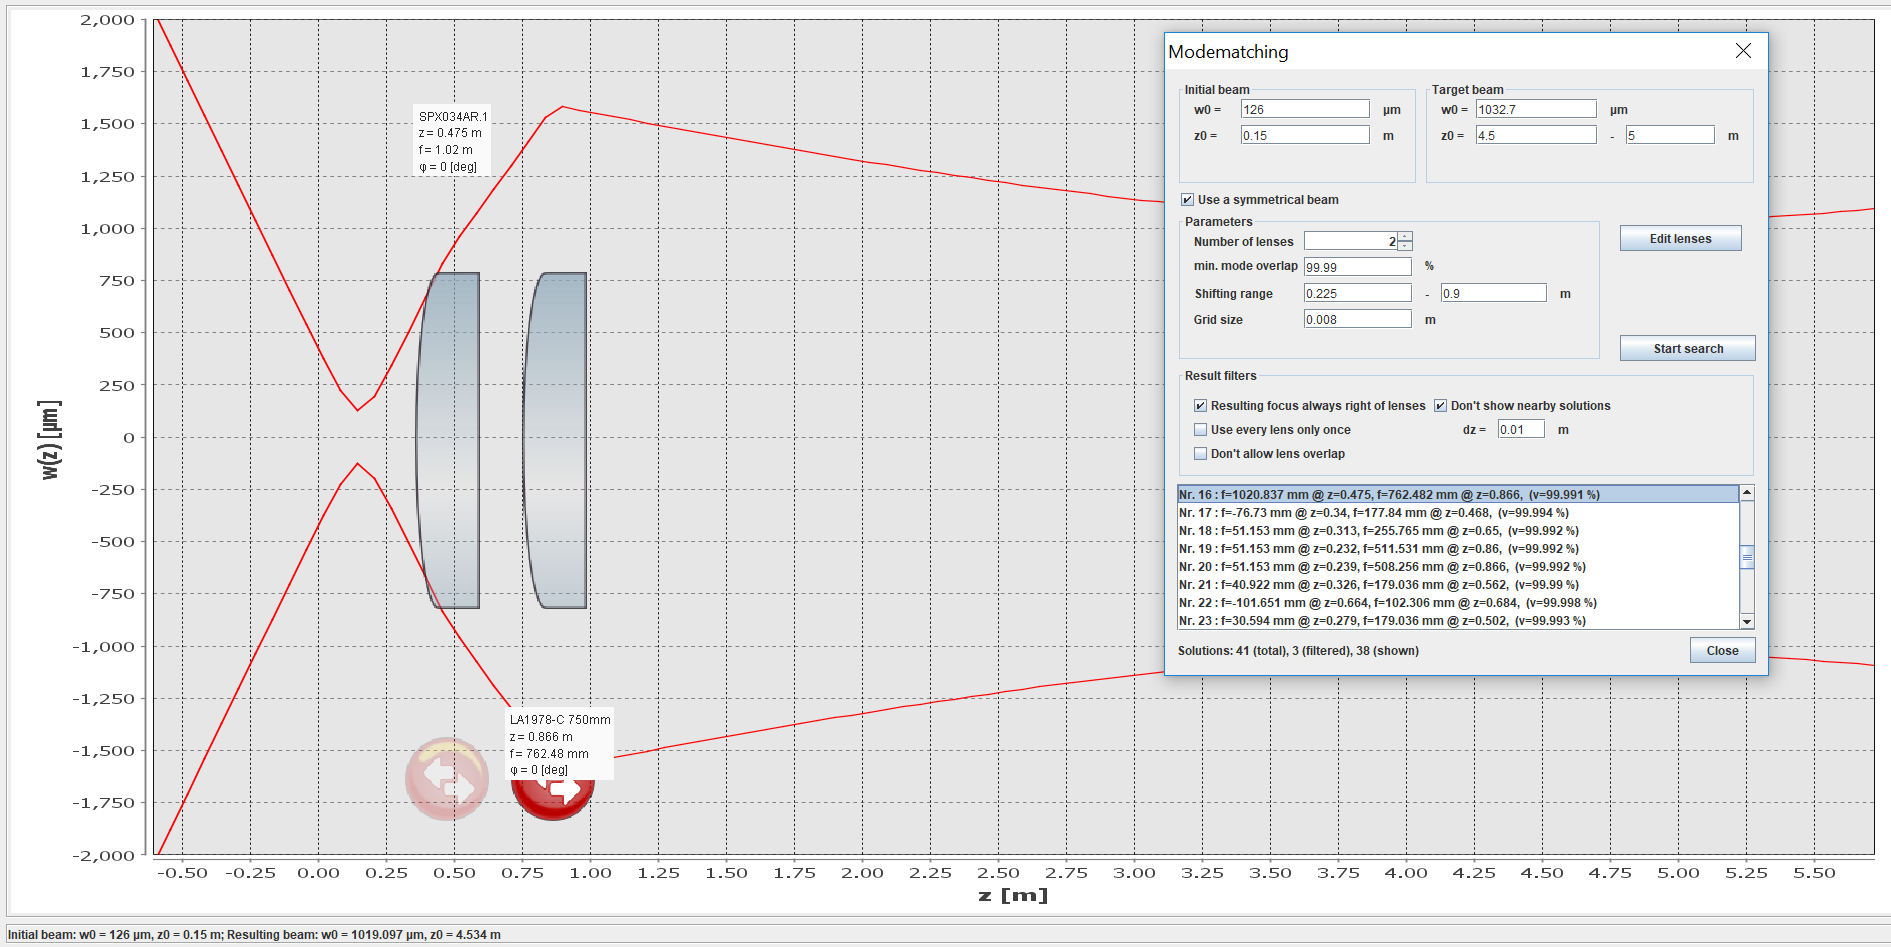
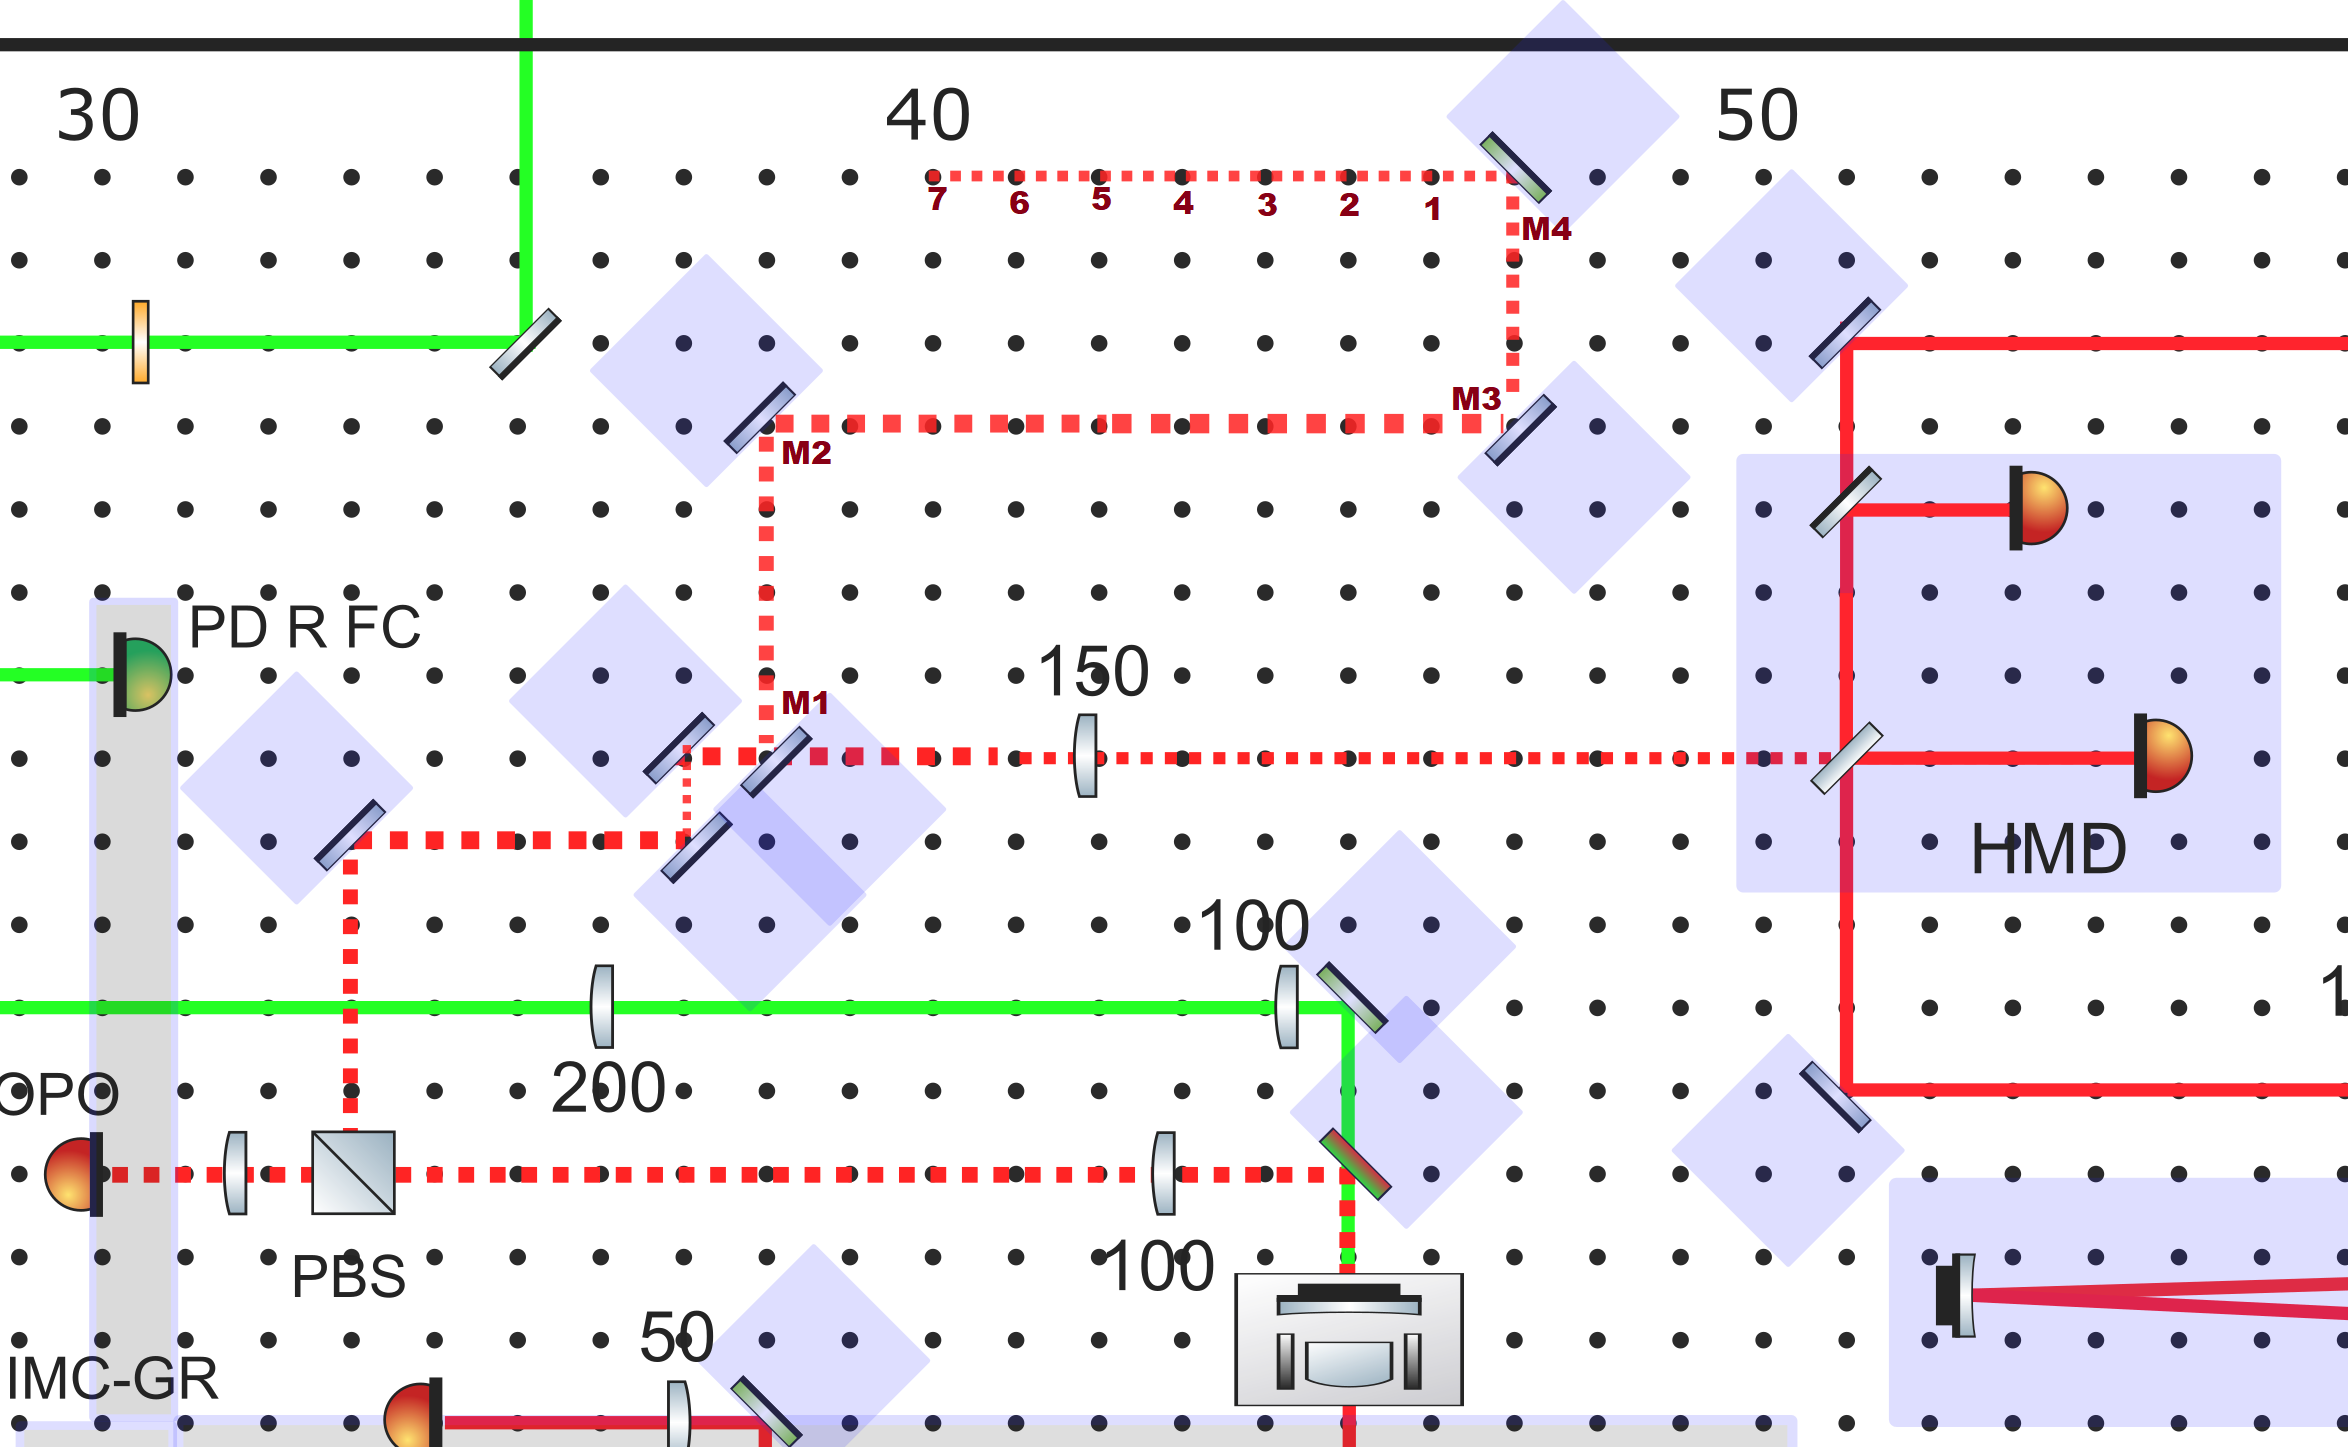
I did a new simulation extending the optical path (of 45 cm), using 4 additional mirrors (fig 1).
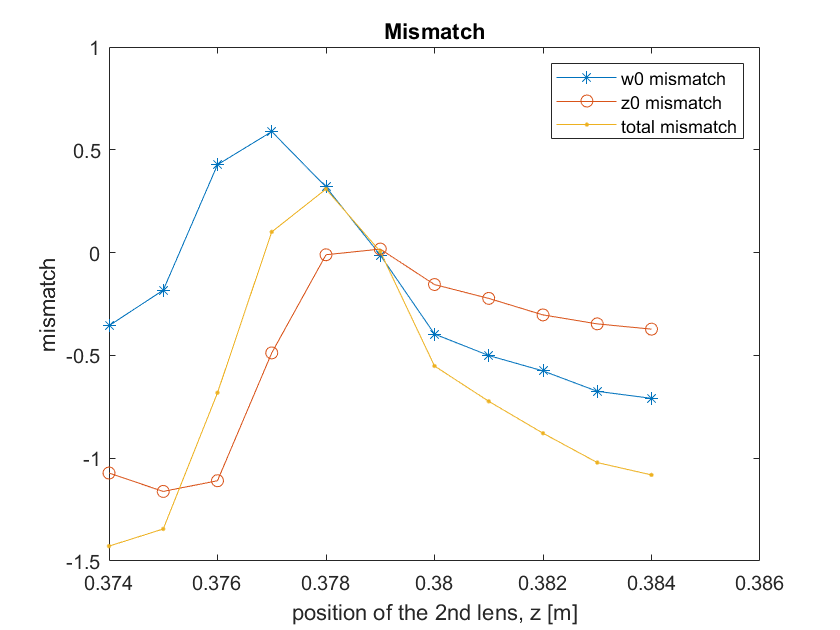
The best simulation is shown in fig 2 where the first lens is 47.5 cm far from PBS and the second one is 86.6 cm far from PBS, both with the same focal of 1020 mm.
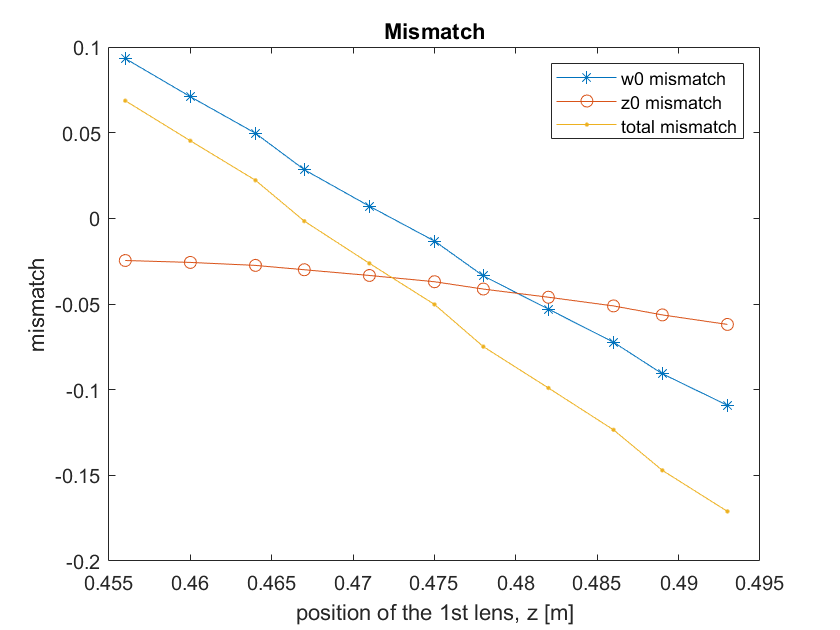
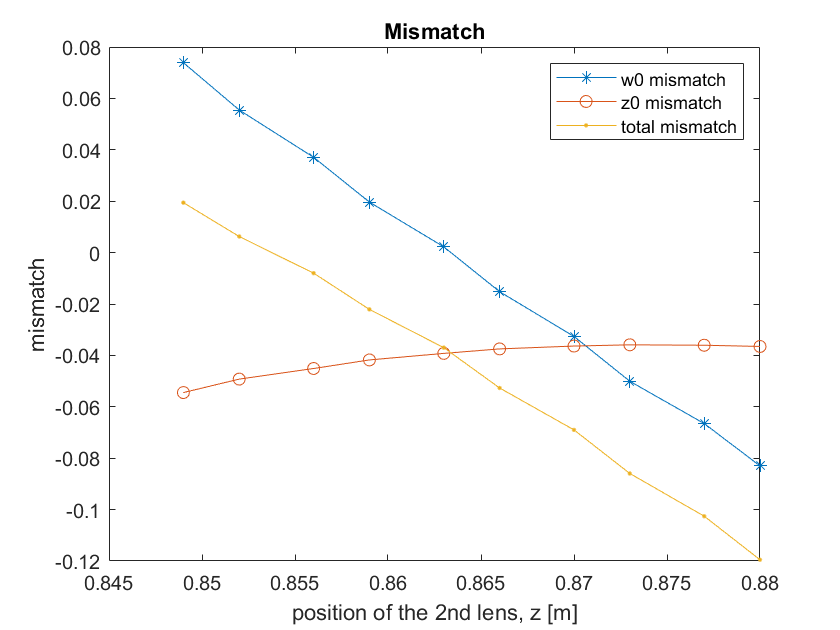
This solution is more robust than the previous one (entry #1283) as shown in fig 3 and fig 4. Moving the lenses of +/- 1 cm we have a mismatch < 10%.
Next step:
- Simulation for the FC reflected beam (first idea in fig 5).
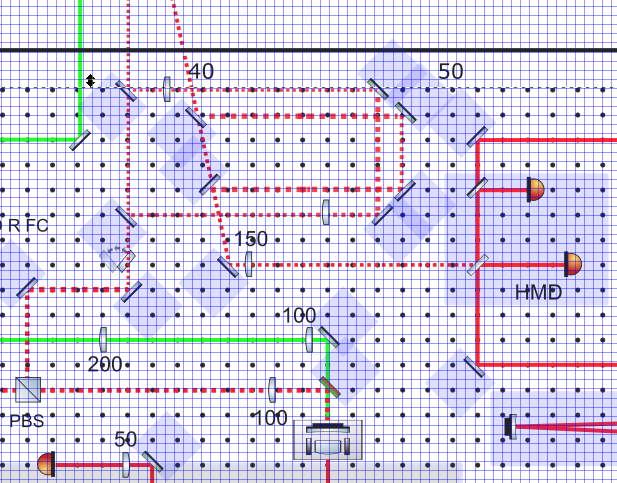
Yuhang and Matteo
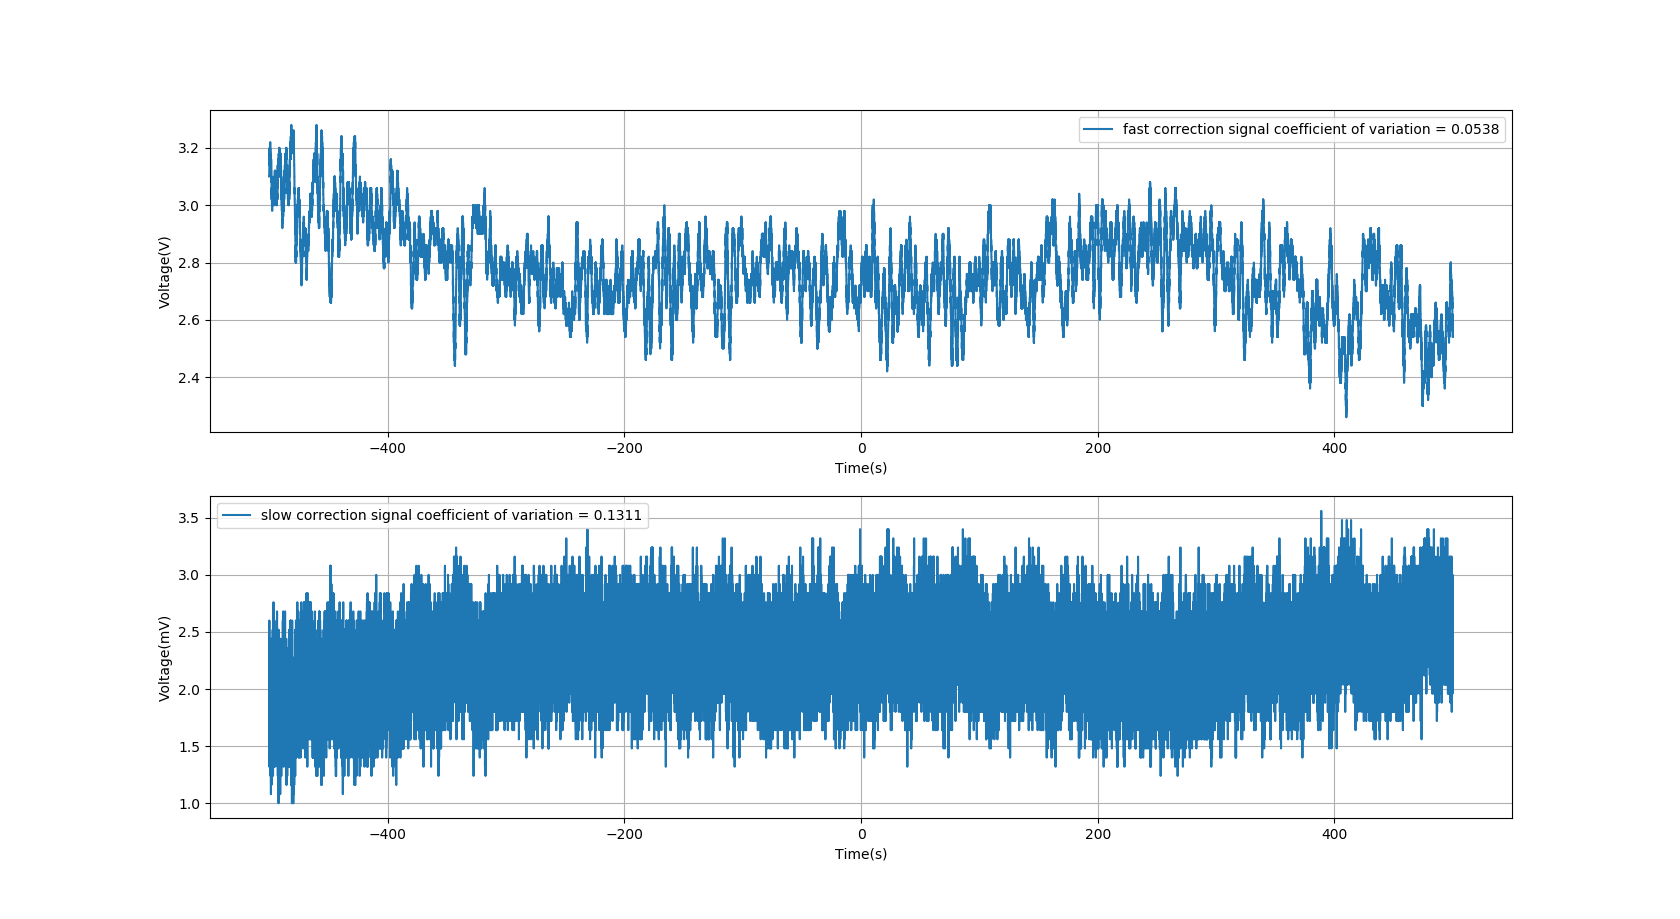
After Pierre replaced the chip of coherent control PLL, we measured the correction signal within a long period of time. This correction signal tells us the stability of CC PLL loop.
The coefficient of variation of the fast correction signal is 0.0538.
While the coefficient of variation of the slow correction signal is 0.1311.
Although we saw a clear change of fast correction signal. The slow correction signal shows much more high-frequency noise.
I also calculated the correlation coefficient between these two signals. It is -0.5155 as we can see one signal is going down while the other is going up.
Since we have new IRMC servo working. I measured again the noise spectrum of homodyne when there is only LO incidence. I did the measurement after common mode noise rejection. The result is shown in the attached figure. There is three main difference.
1. New servo has more flat low-frequency noise.
2. New servo shows much more peaks in the low-frequency region. It looks like electronic noise. As pointed by Matteo, this is because of the ground loop.
3. The peaks at the high frequency of these two situations are different.
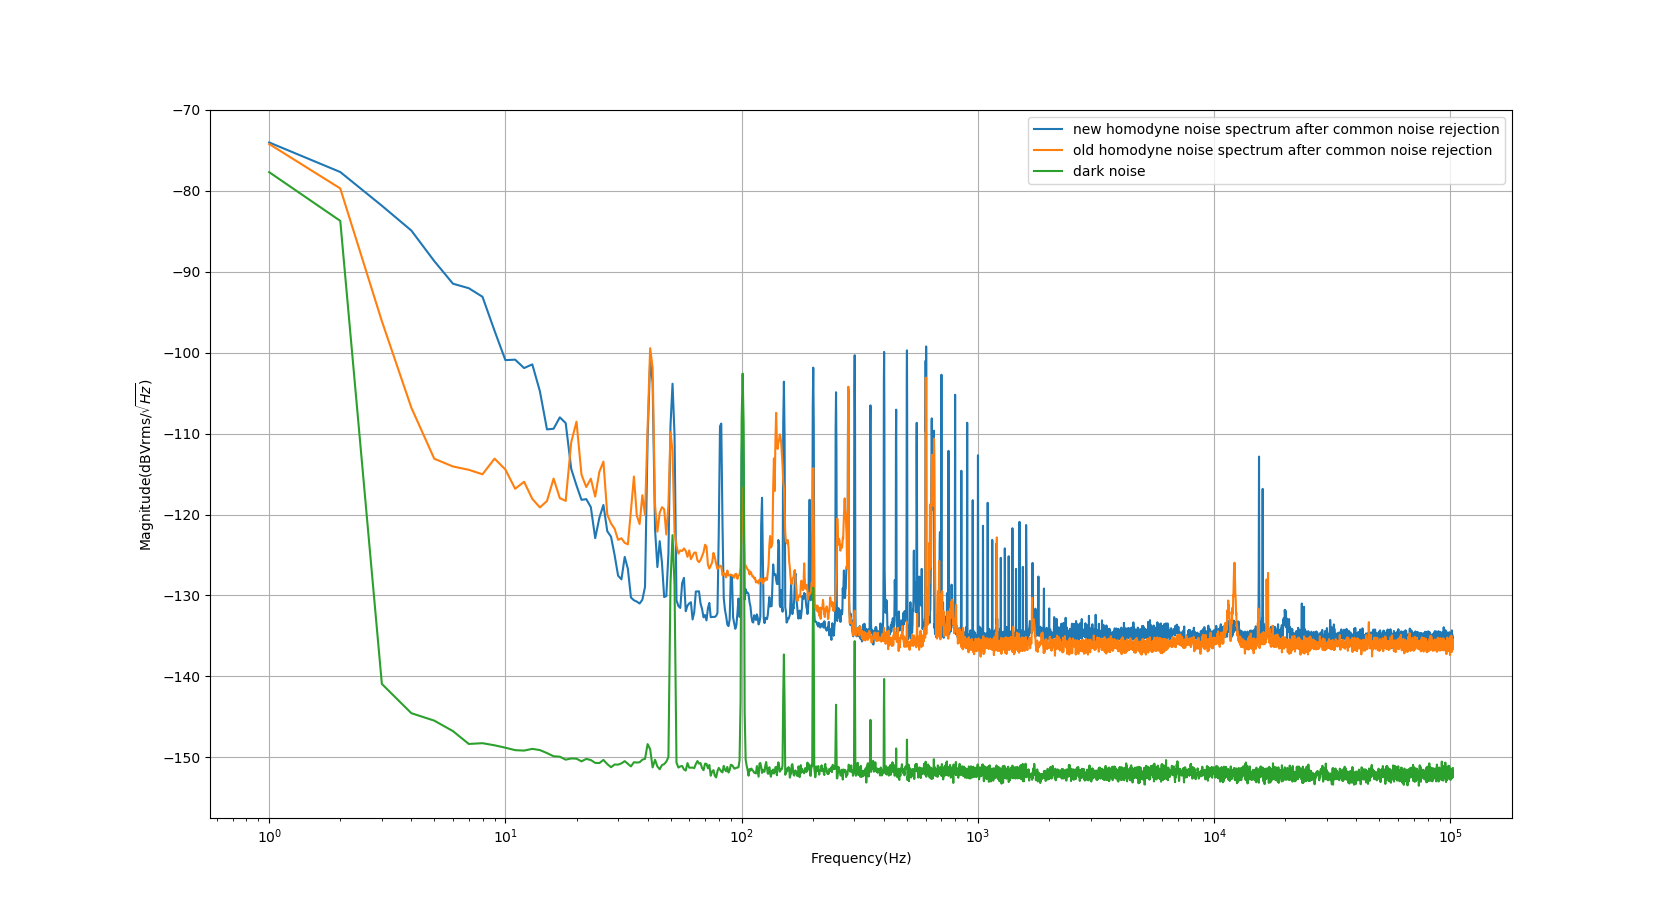
After connecting the power of homodyne and spectrum analyzer(this can remove the ground loop noise), I measured noise spectrum of homodyne again. During this measurement, there is only an infrared beam incident and has a power value of 1.3mW.
The result is shown in the attached figure.
[Eleonora P, Yuhang]
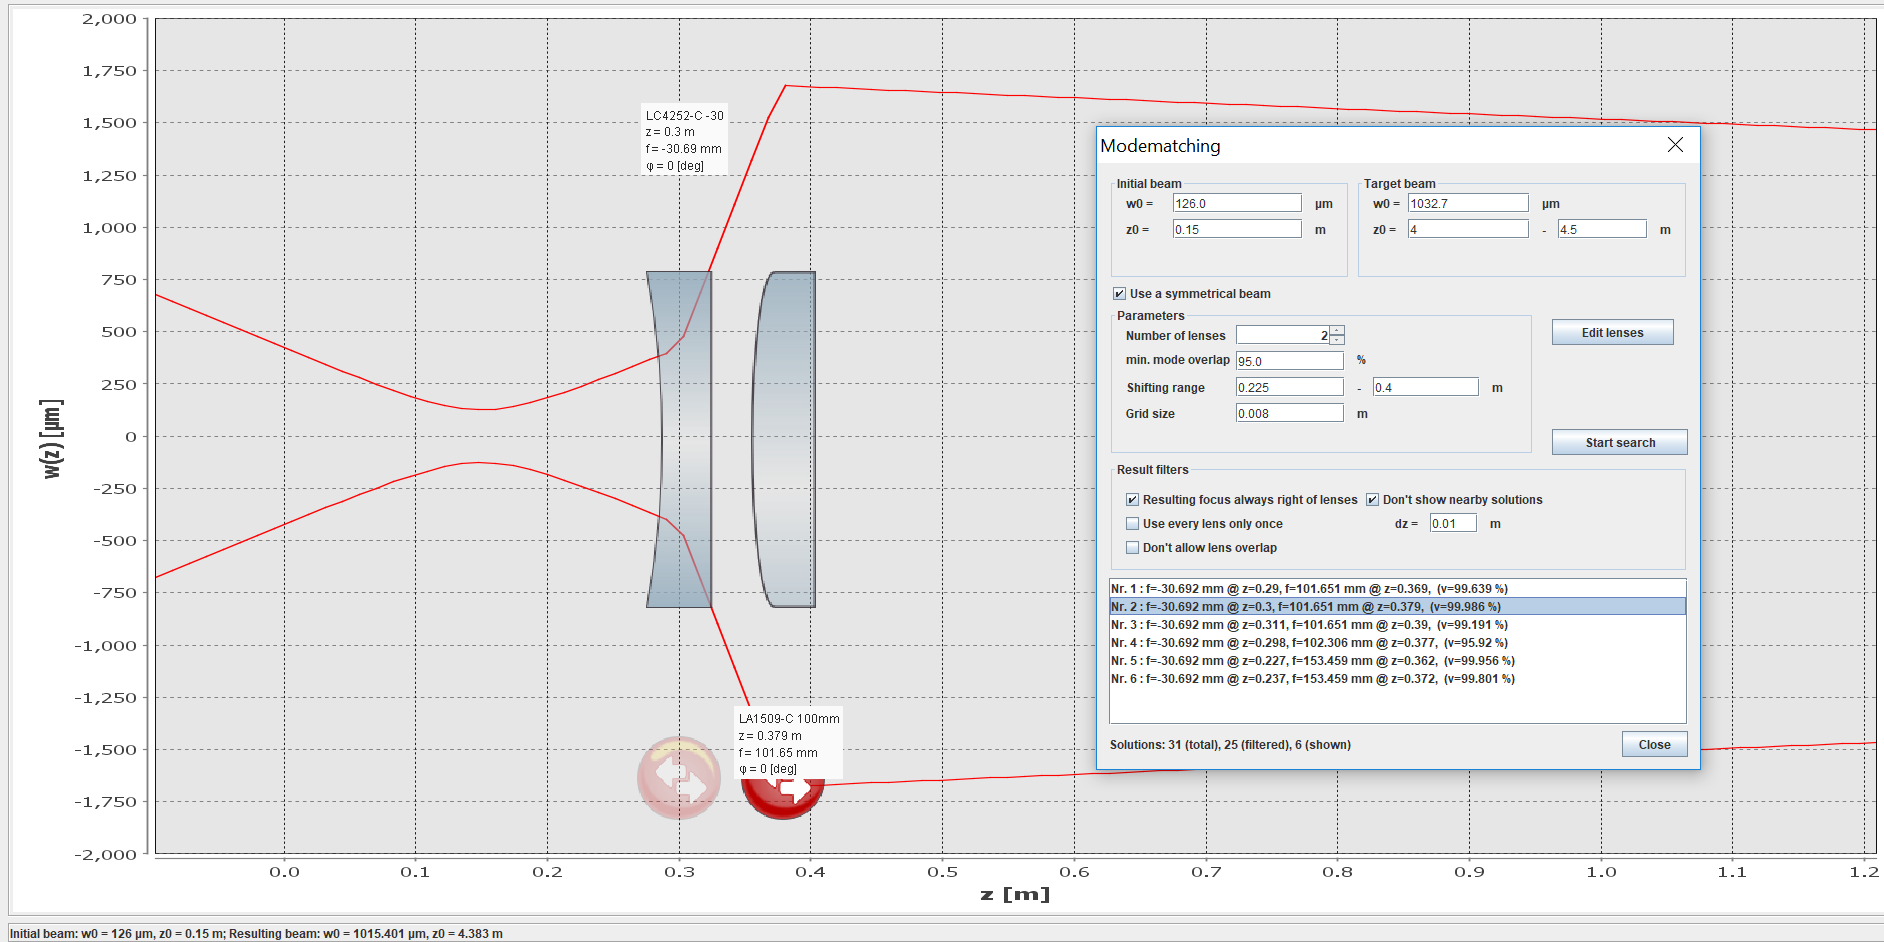
Considering the beam parameters of entry #1133, we made the first simulation (using Jammt) for the IR injection telescope. In this simulation (fig 1) we put only two lenses in the straight path on the bench before the FC.
We set as initial position the one of PBS.
Initial beam parameters (entry #1280):
z0 = 15 cm
w0 = 126 um
Resulting beam parameters (entry #1133):
z0 = 4,2673 m
w0 = 1032,7 um
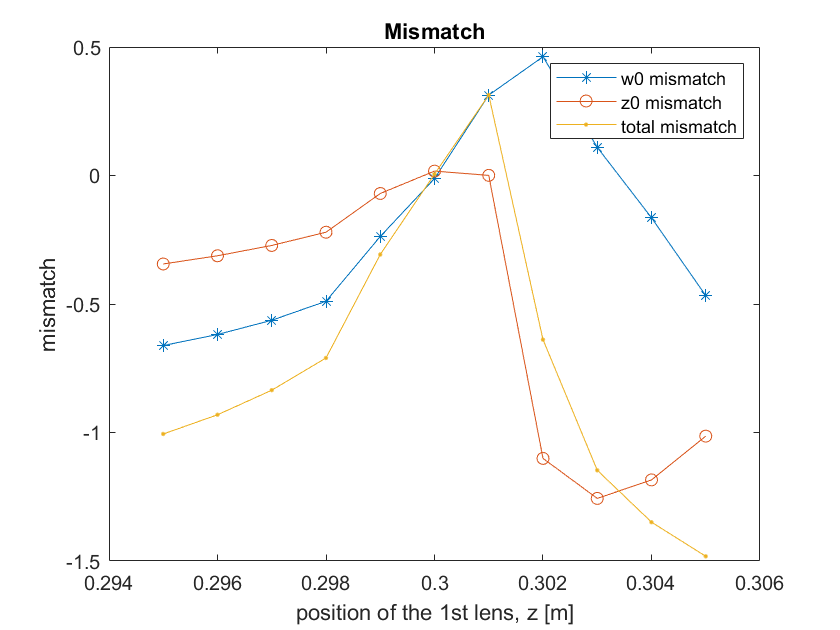
The problem is that this solution is not robust, so there is a large mismatch as function of the position of the lenses of the telescope.
This is shown in fig 2 moving of +/- 5mm the 1st lens and in fig3 moving of +/- 5mm the 2nd lens.
Another problem is that with this configuration we are using the same two mirrors for the FC and homodyne alignment.
Next step:
- extend the optical path before FC using 4 mirrors: good for alignment, bad for losses
- do again the simulation
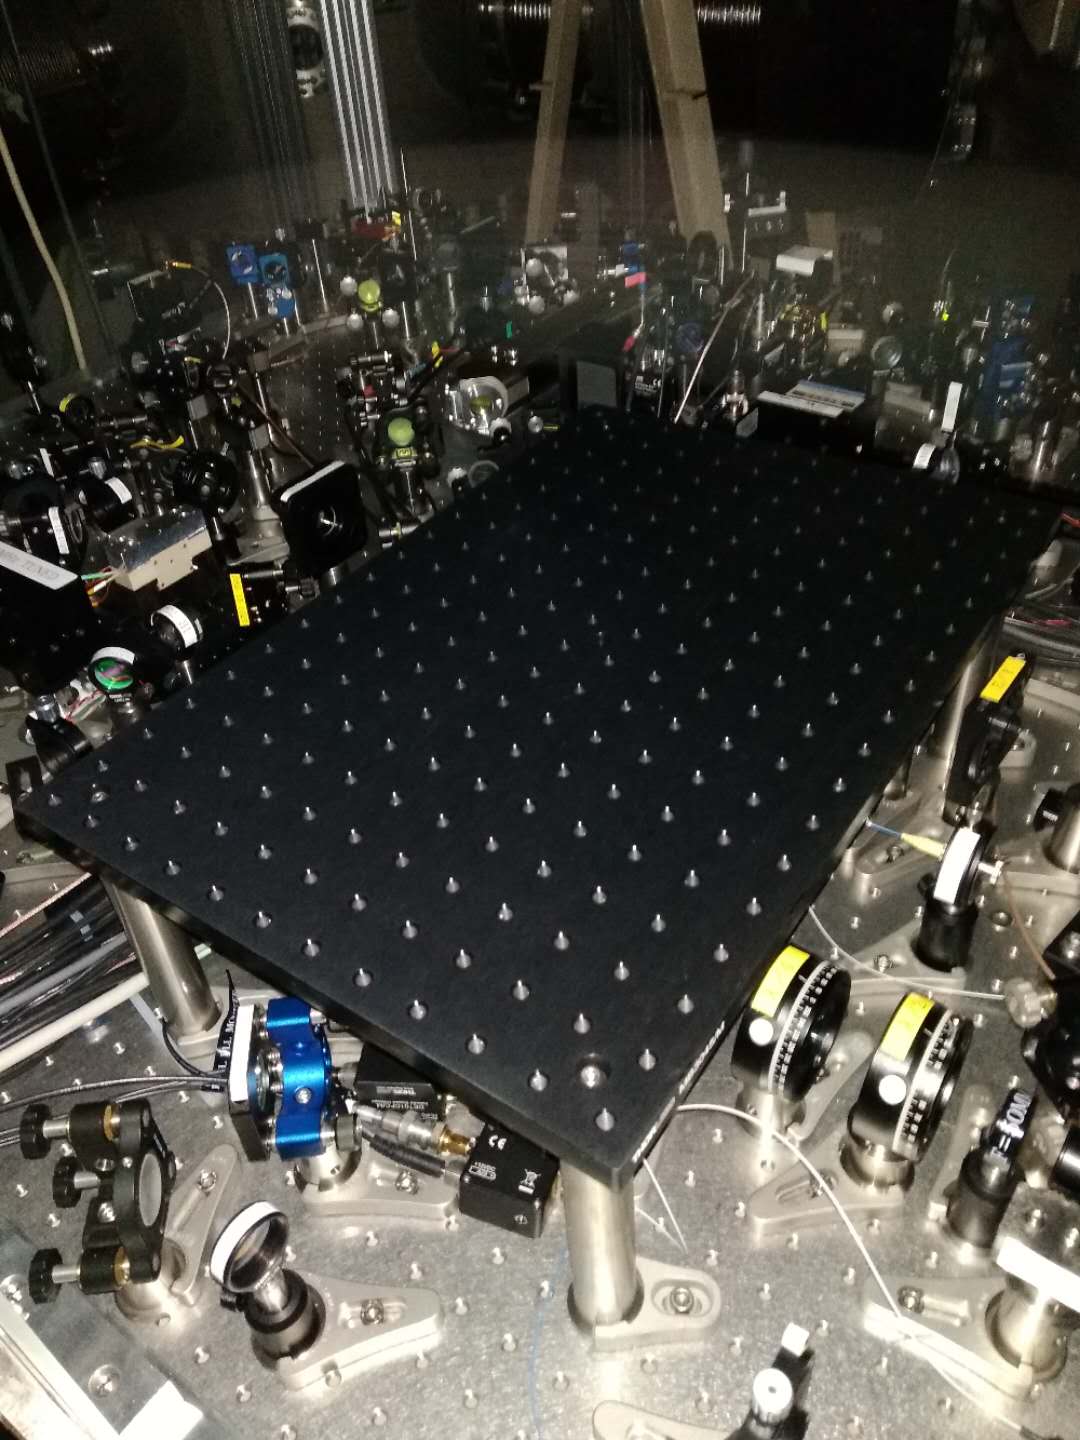
I upload some picture of the galvo with some dimensions.
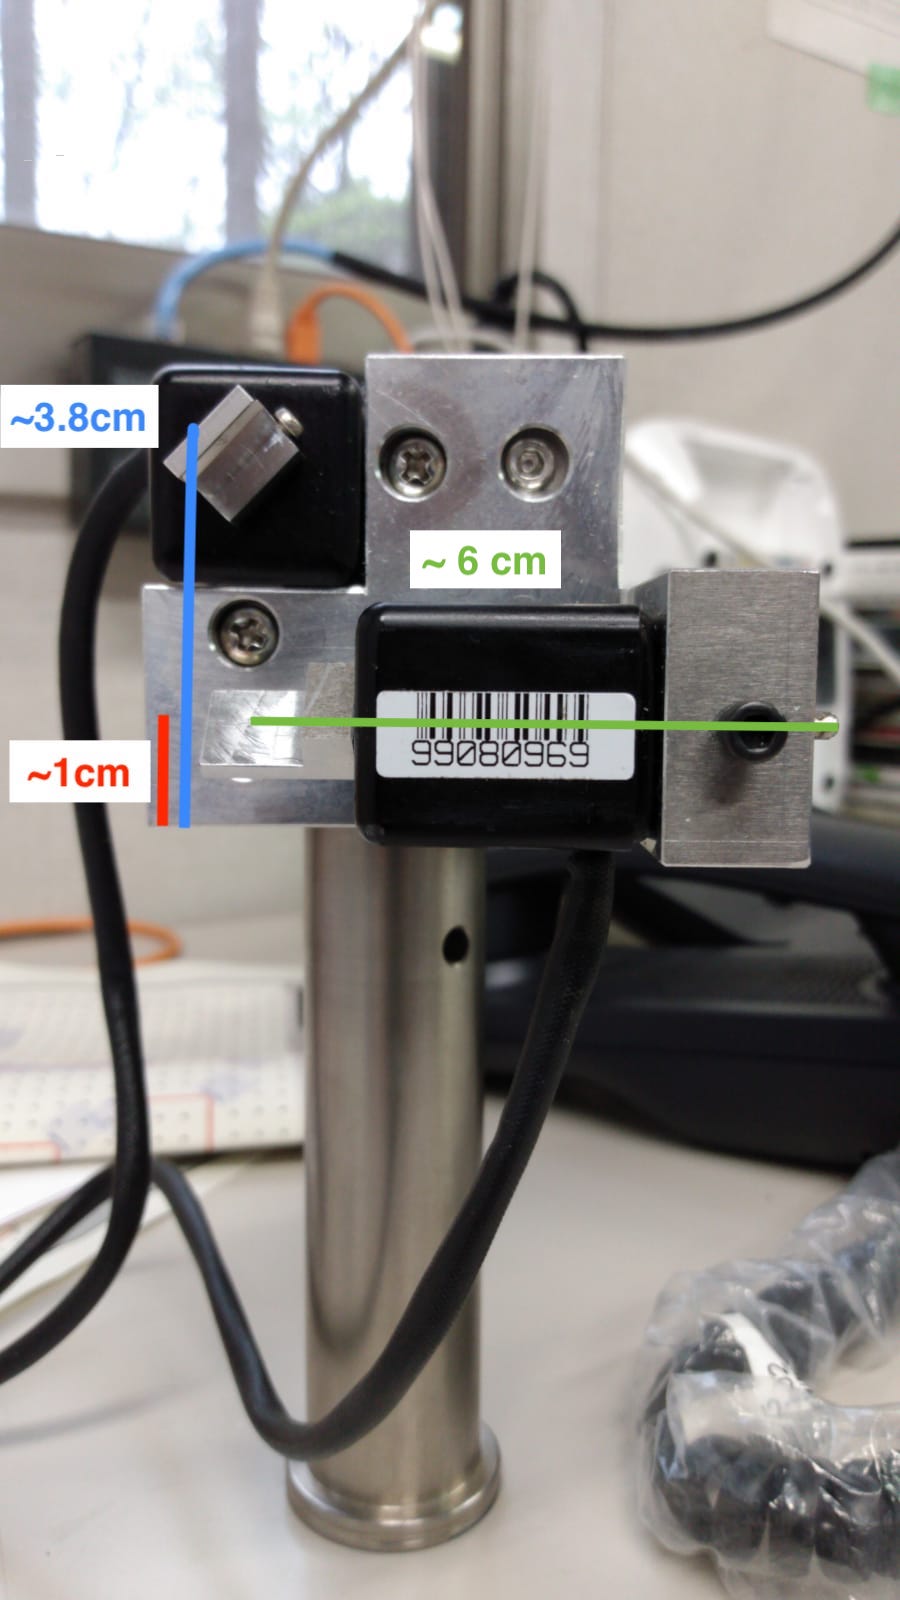
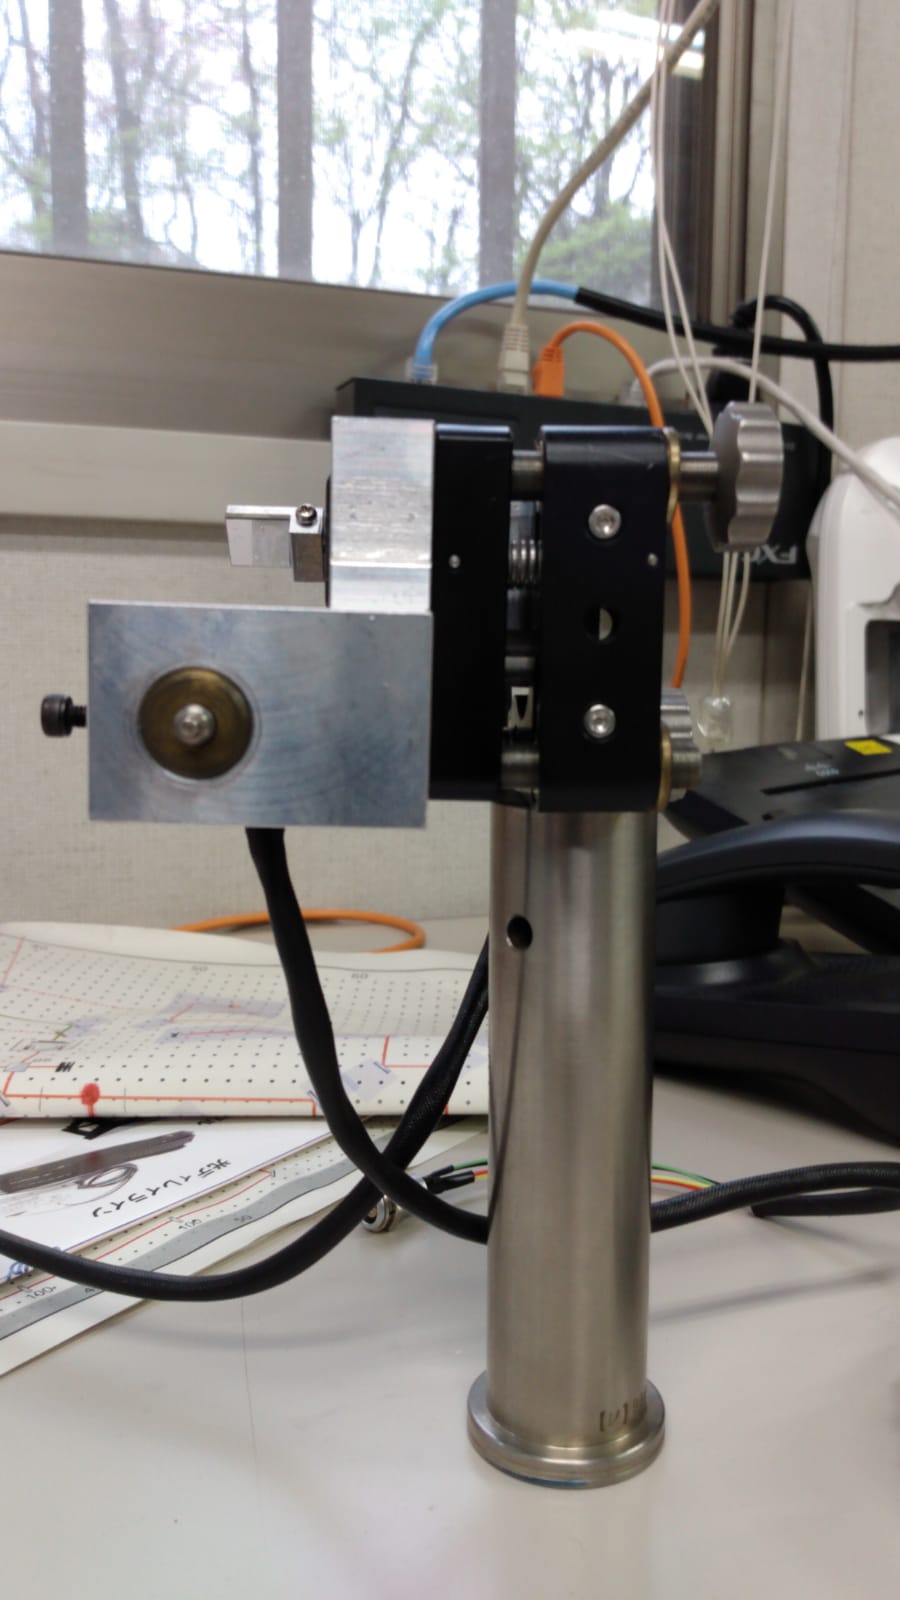
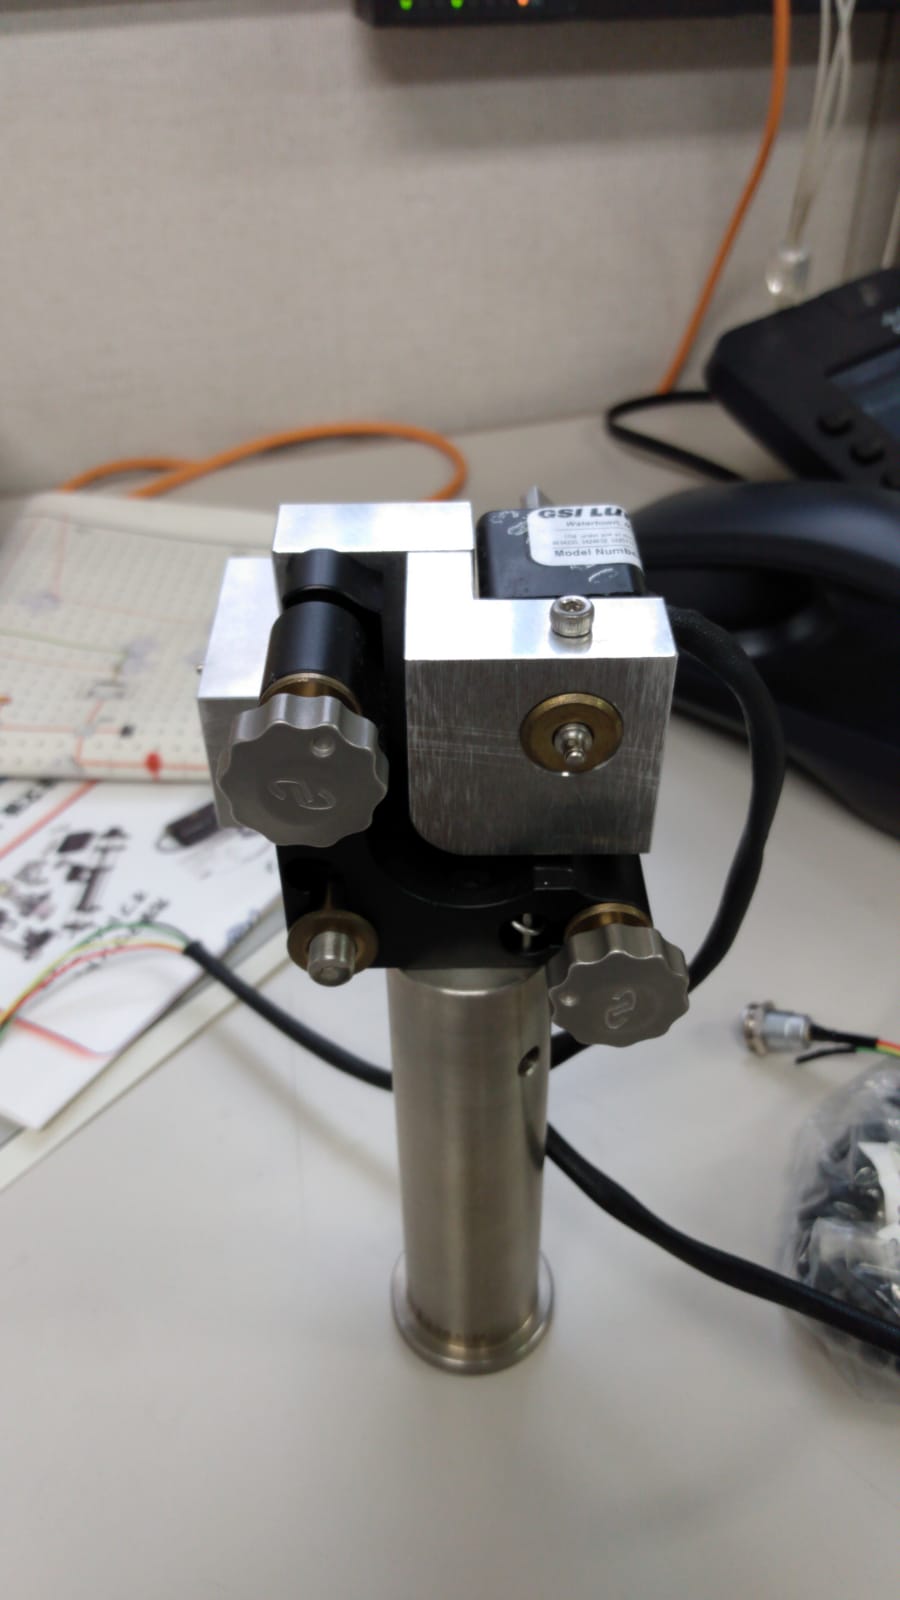
Yuhang and Matteo
We installed the second layer breadboard for auto-alignment system. The height from bench surface to the surface of breadboard is 6.5inch which is 165.1mm. If we consider to put a smallest pedestal pillar for QPD, the height of beam on breadboard should be 4.6+1.27cm=5.87cm. Then the height of beam from the surface of bench is 22.38cm.
Pierre, Yuhang
We had some problem with implementing our new servo made by Pierre. The problem is auto lock function doesn't work very well. Sometimes we can lock and sometimes we cannot. Also, we need to set the threshold of locking close to full reflection from IRMC cavity. In principle, the logic part will give 1 when our signal is smaller than the threshold we give. That means a threshold of half maximum should work well. However, not it doesn't work.
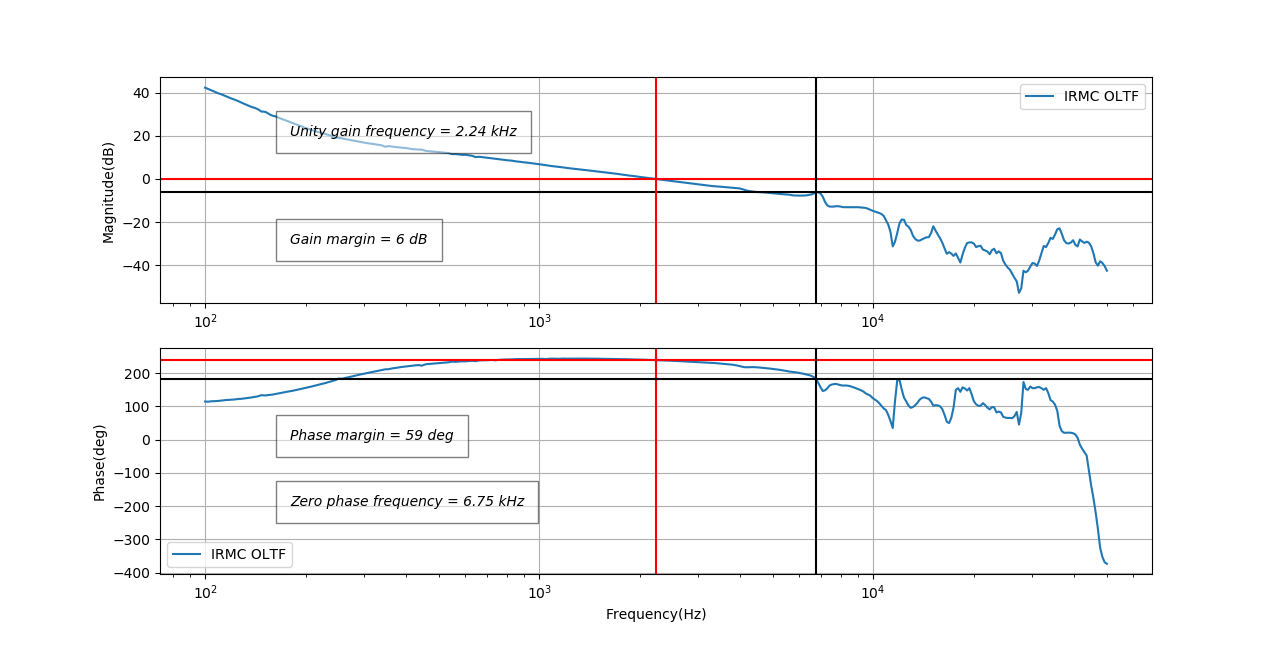
However, we found if we move high voltage driver and make the TEM00 peak close to the center of the ramp signal. The auto lock system can work very well. After this success of locking, we measured OLTF and moved Gain to have good phase margin and gain margin. At least, we know the locking problem doesn't come from filter design.
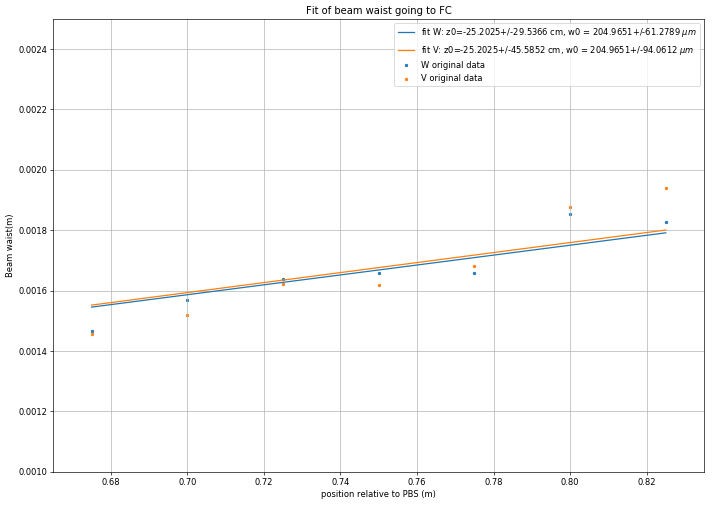
We measured accurately the size of the beam that will go inside FC and we extimated the parameters of this beam.
We checked the locking of the PLL (ML and ppol) for each point, we used the fork to fix the camera on the bench, we tried to make the beam going as straight as possible inside the camera.
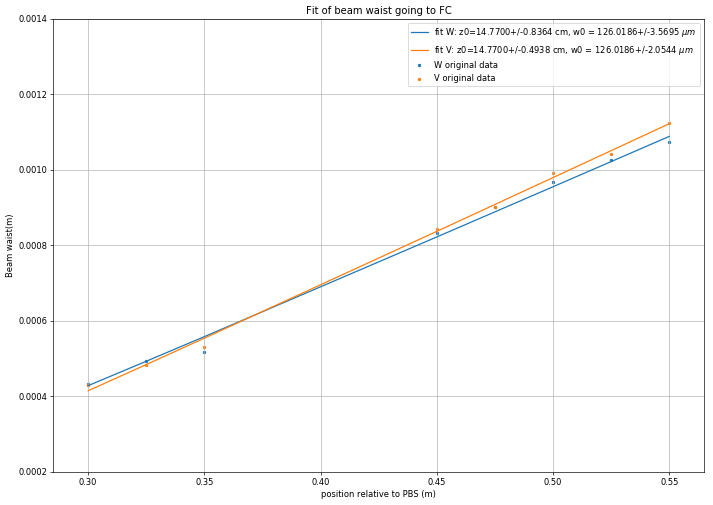
Parameters from the fit (fig 1) of the data are:
for W direction
-z0 = (14.8 +/- 0.8) cm --> distance from PBS
-z0 = (14.8 + 35)cm = 59.8 cm --> distance from OPO
-w0 = (126 +/- 3) um
for V direction
-z0 = (14.8 +/- 0.5) cm --> distance from PBS
-z0 = (14.8 + 35)cm = 59.8 cm --> distance from OPO
-w0 = (126 +/- 2) um
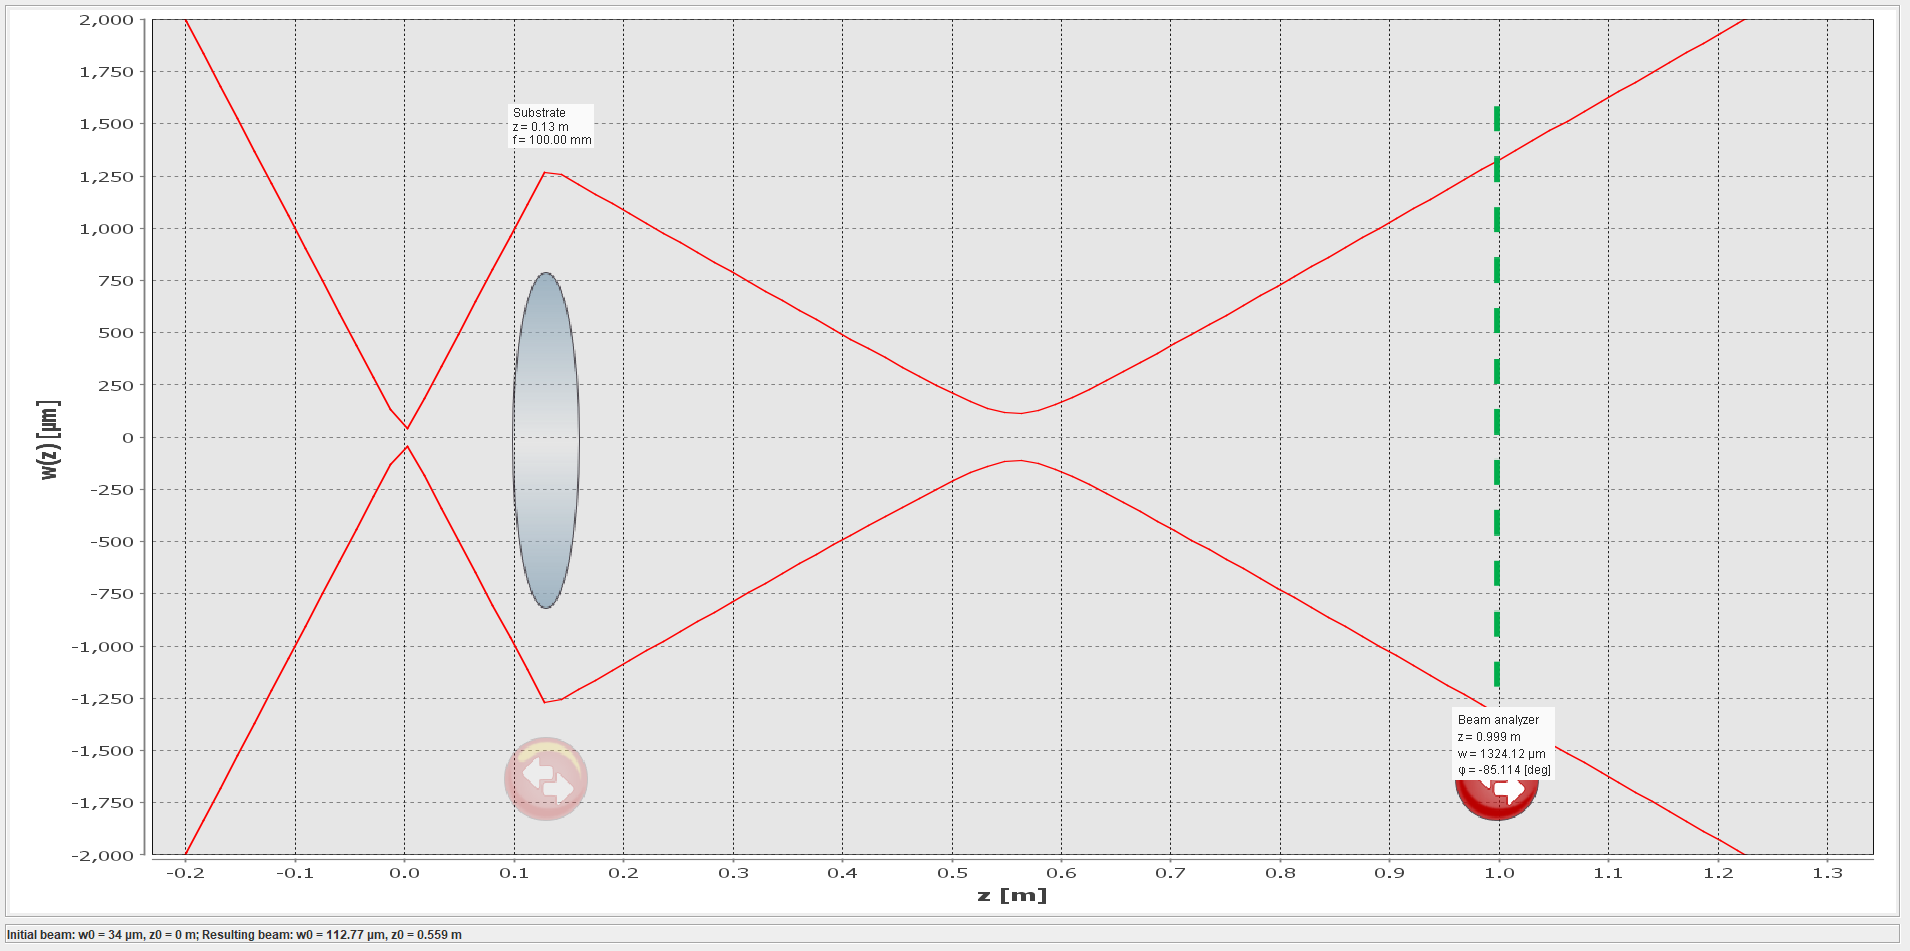
Parameters from the simulations, considering different positions z OPO-lens (since we are not sure about waist beam position inside the OPO):
for z = 0.13 m (fig 2)
-z0 = 59 cm --> distance from OPO
-w0 = 124 um
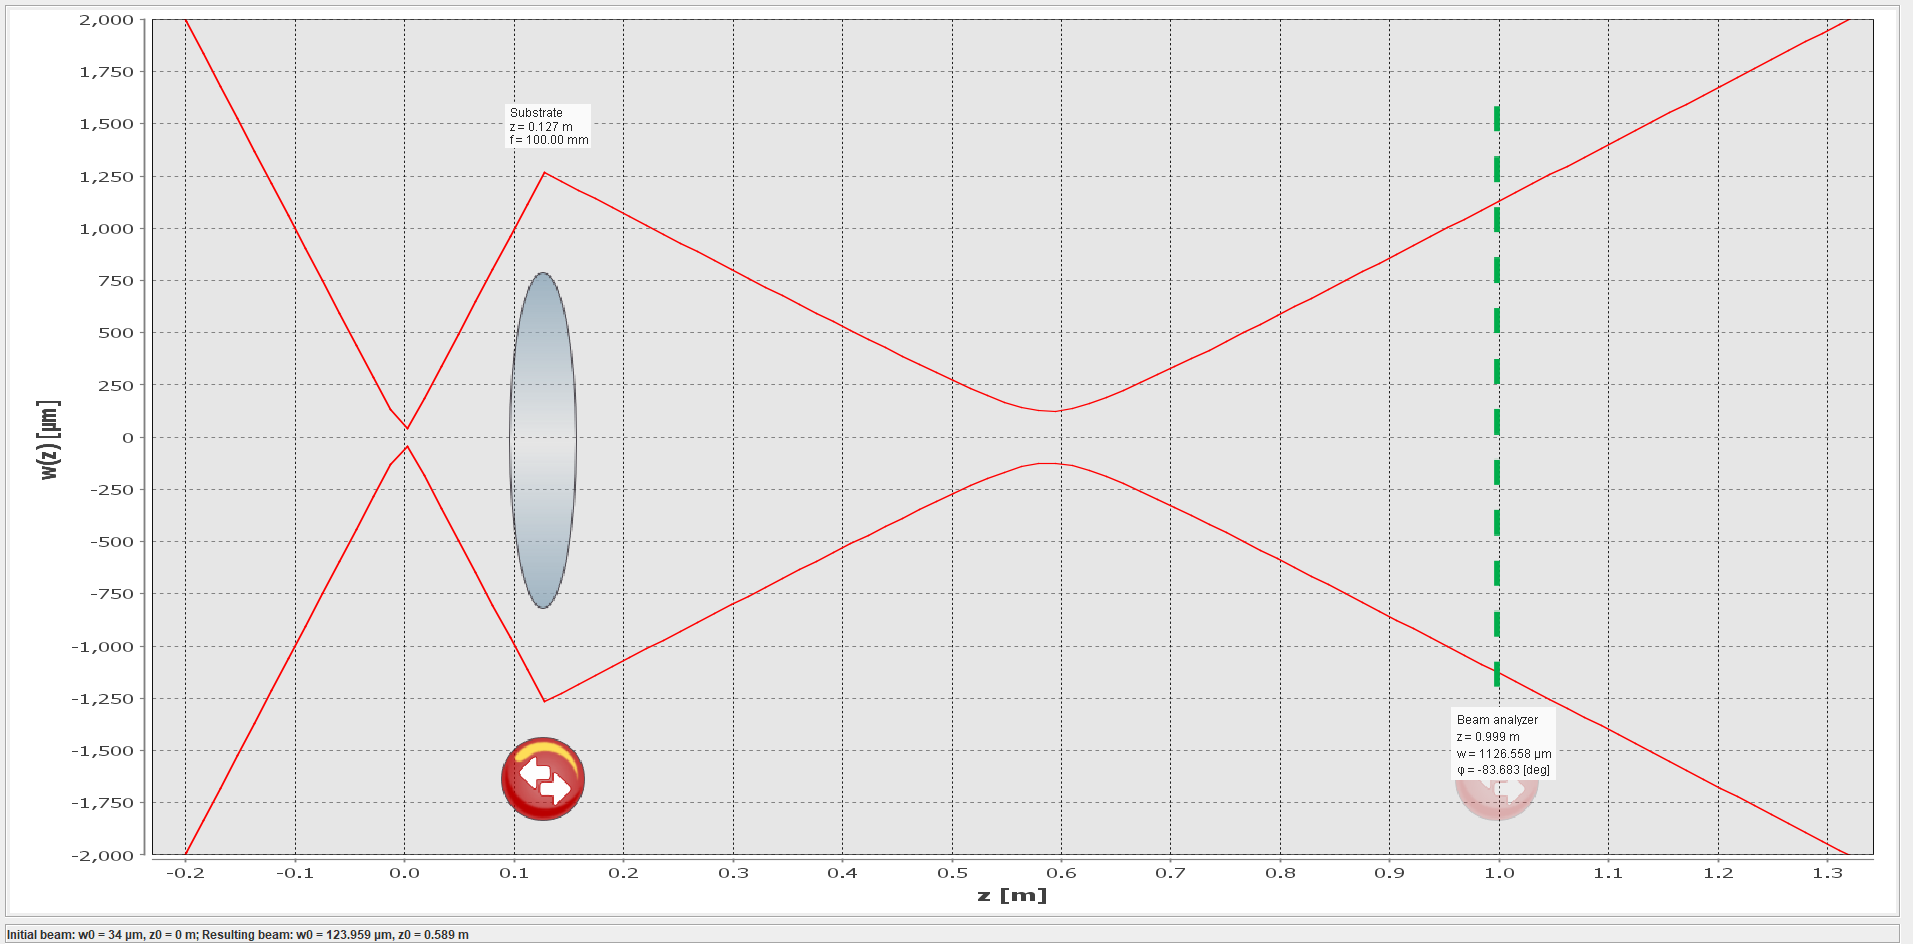
for z = 0.127 m (fig 3)
-z0 = 56 cm --> distance from OPO
-w0 = 113 um
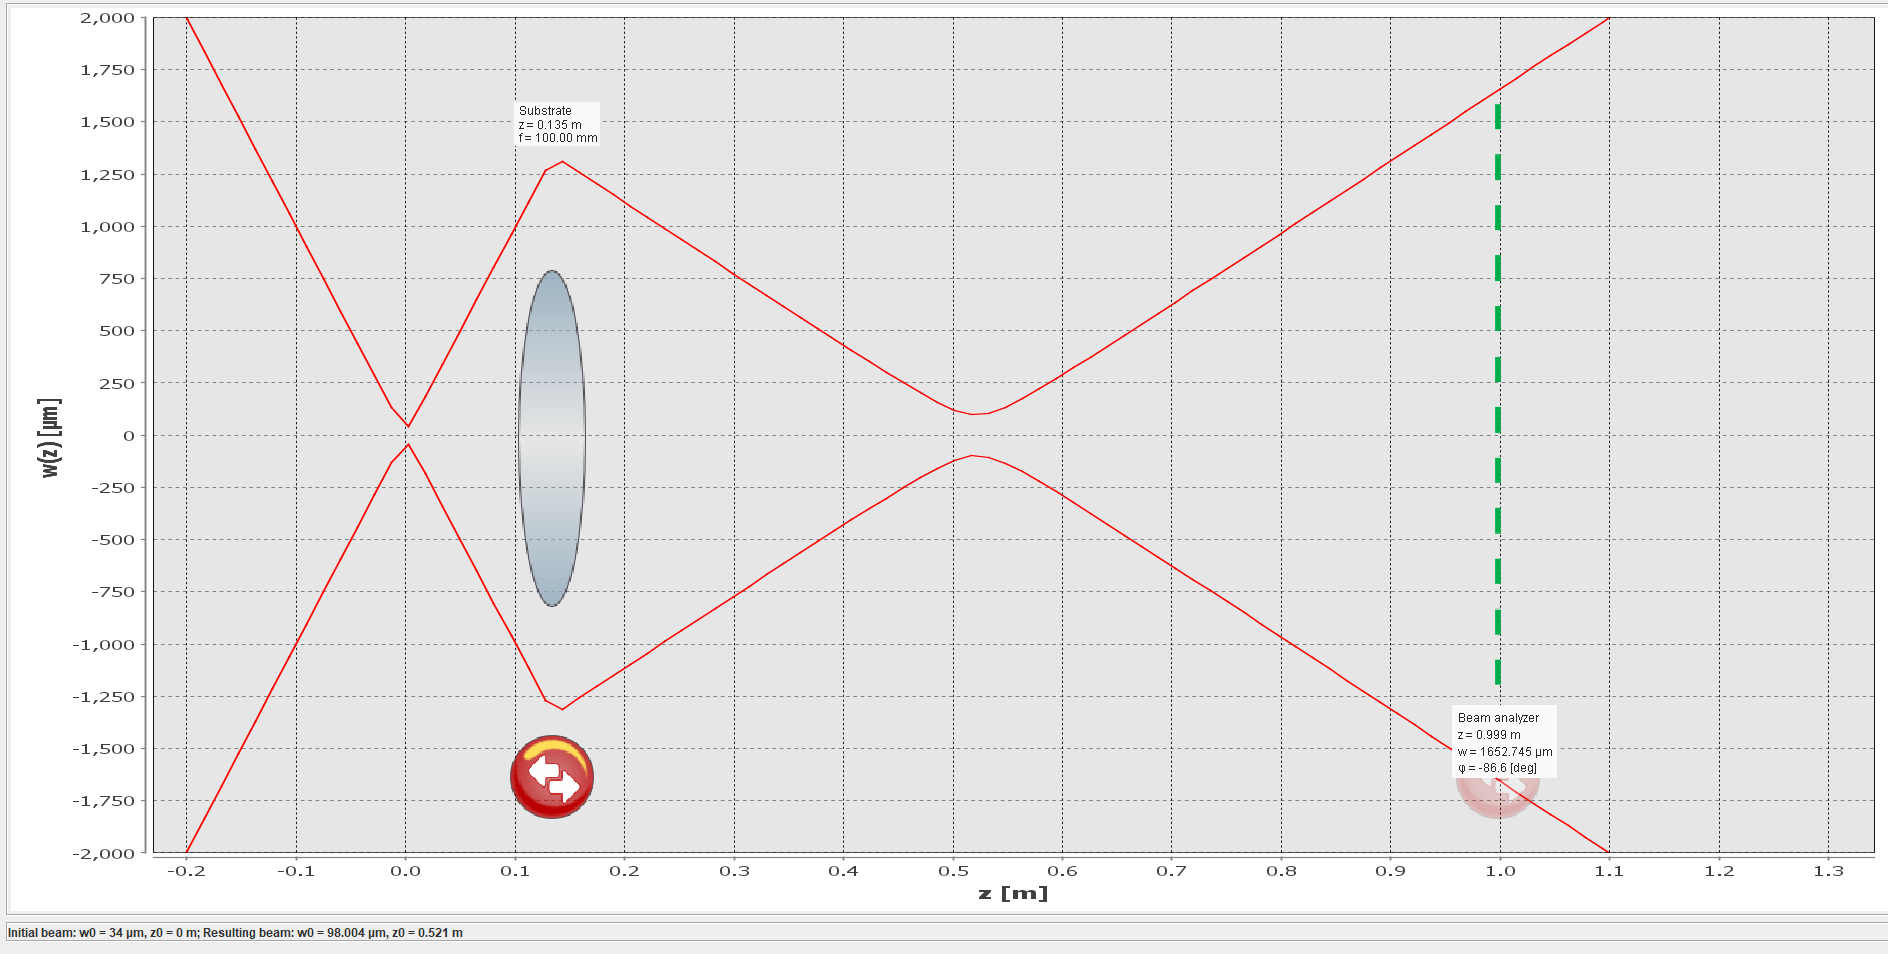
for z = 0.135 m (fig 4)
-z0 = 52 cm --> distance from OPO
-w0 = 98 um
The results are good.
Next step:
- Telescope before FC
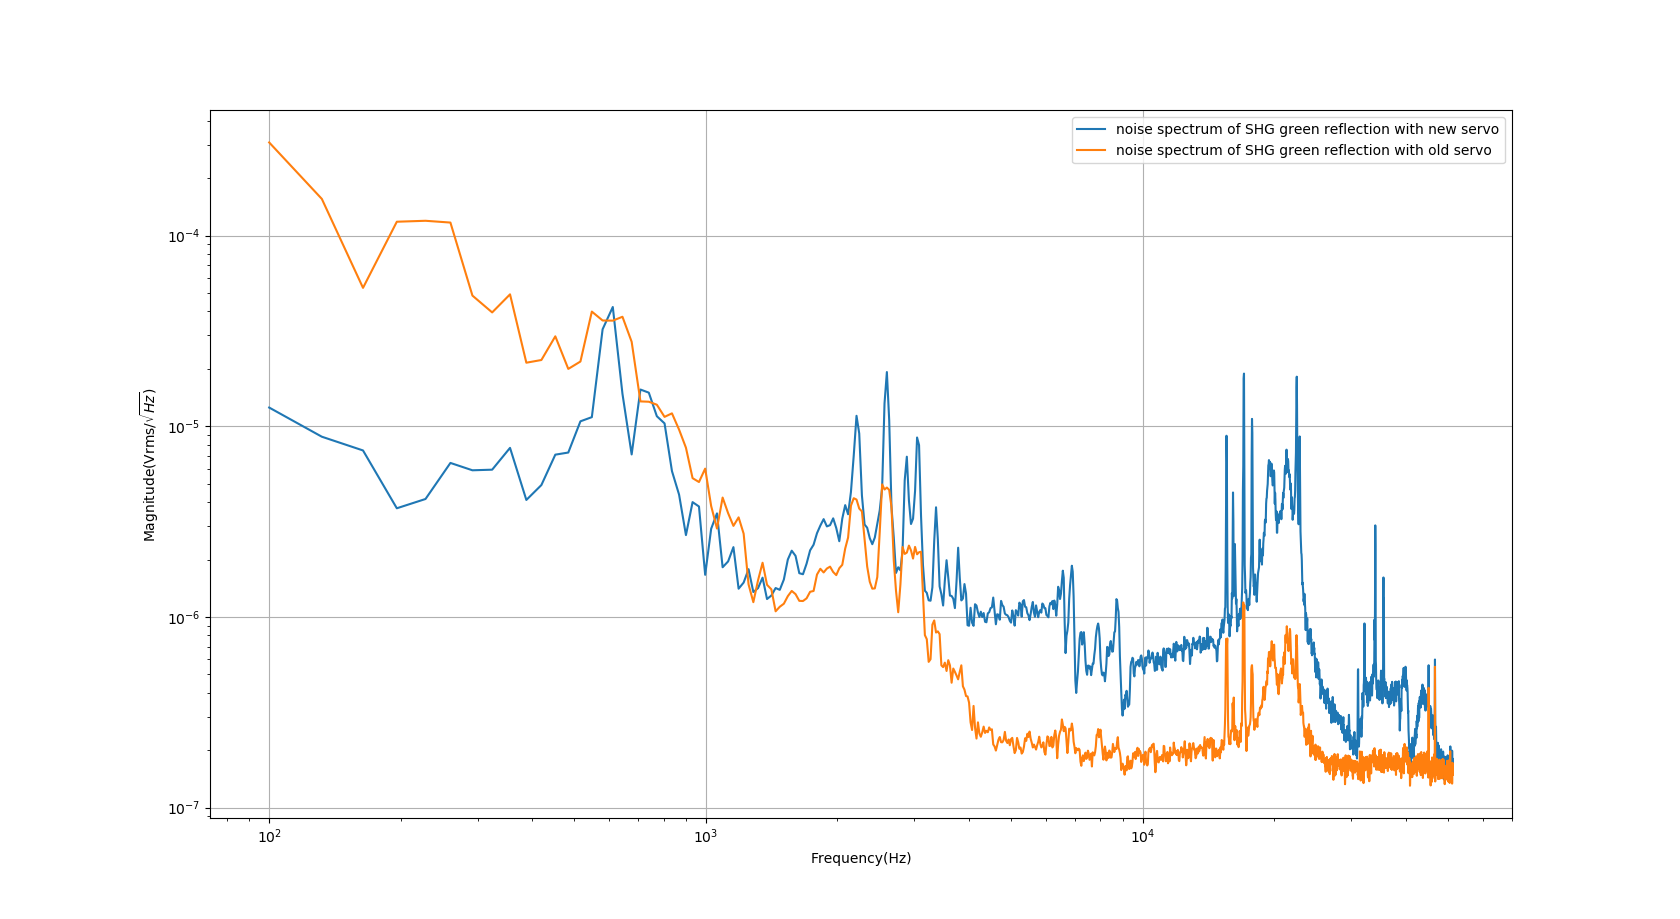
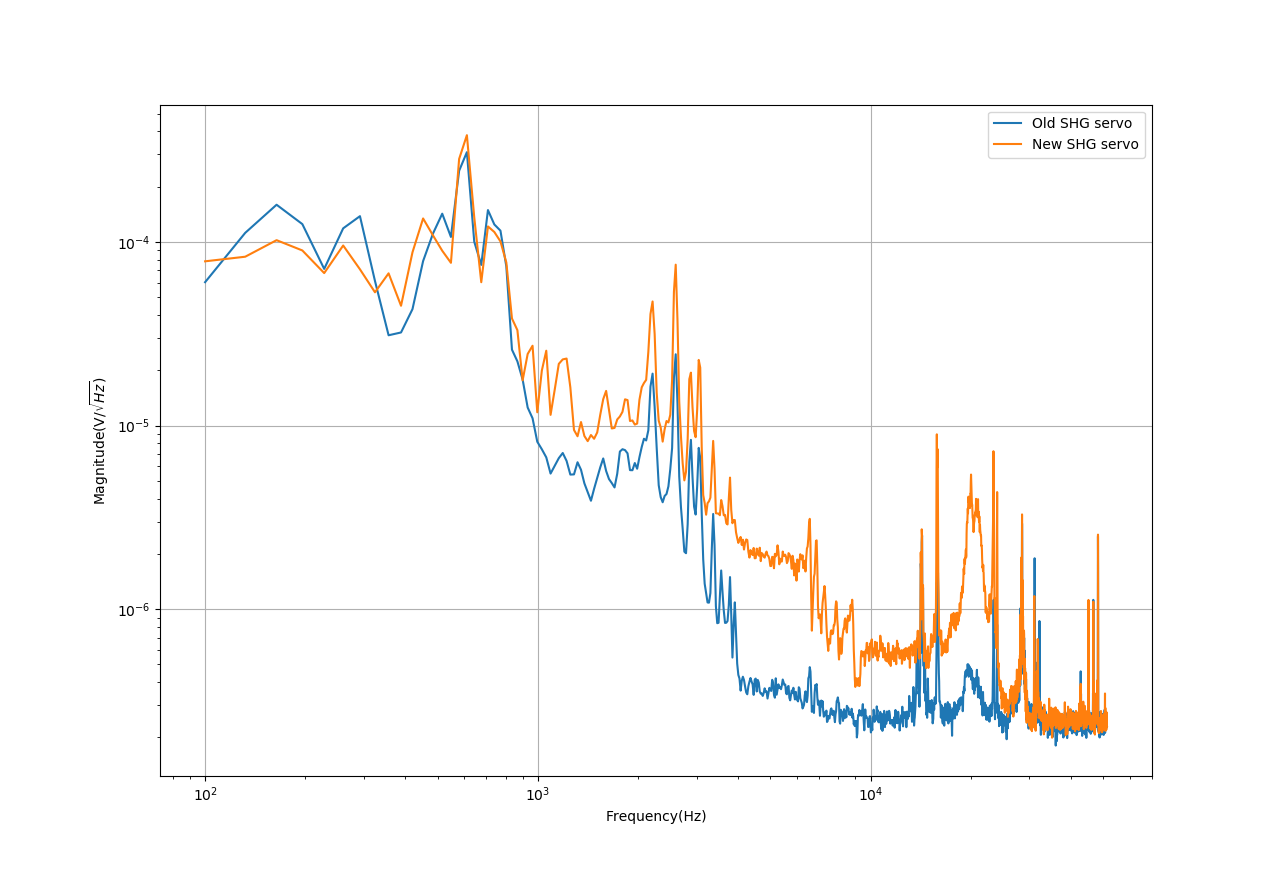
I set up a PD for SHG reflection. It can directly measure the green light noise spectrum. Then I did the measurement. The result is shown in the attached figure.
The new servo shows almost 10 times smaller noise at low frequency. While at high frequency(above 2kHz), the noise is five times higher than the old servo. The reason can be that we put notch around here.
1-Setting of switches on the front panel:
* The differentiator shall be disabled on the front panel in setting the switch on "OFF".
2-Setting of the 8 straps on the board:
Low-pass filter, Notch filter 1 and notch filter 2 are activated on the board in setting strap on connectors P7, P8 and P9 (3 pins) between pins 1 and 2
* No transmission signal: the strap on connector P4 (3 pins) is set between pin 2 and 3.
* Strap is set on connector P11 (3 pins), between pins 2 and 3, in order to activate the sample-and-hold on the triangular signal, on the locking.
* Strap is set on connector P3 (2 pins) to connect the triangular signal to the output stage.
* Strap is set on connector P2 (3 pins), between pins 1 and 2, for test purpose.
To check low-pass filter, notch 1 and notch 2 filters (in scan mode) between TEST IN and TEST OUT. For this test the differentiator, shall be set on "ON" (not intuitive but important). After this test, the differentiator shall be disabled the front panel in setting the switch on "OFF".
* Strap is removed on connector P1 (2 pins): modification of Offset circuit (see below)
3-Modification of components:
* Integrator 1/f: corner frequency changed to 2.2 kHz
Capacitor CMS 1206: C38 = 33nF
* Integrator 1/f2: corner frequency changed to 220 Hz
Capacitor CMS 1206: C26 = C33 = 330nF
* Low-pass filter: cut-off frequency changed to 2.2 kHz
Capacitor CMS 0805 : C45 = 2.2nF
Resistor CMS 1206 : R59 = 33k
* Notch filter 1: notch frequency changed to 12.9 kHz / quality factor changed to 3.6 (measured)
[Capacitor CMS 0805 1% : C49 ; C50 ; C51 ; C53 = unchanged (560 pF)]
[Resistor CMS 1206 : R65 ; R66 ; R67 ; R68 = 22k
Resistor CMS 1206 : R73 = 2.7k
* Notch filter 2: notch frequency changed to 18.95 kHz / quality factor changed to 0.9 (measured)
[Capacitor CMS 0805 1% : C60 ; C61 ; C62 ; C63 = unchanged (560 pF)]
Resistor CMS 1206 : R79 ; R80 ; R81 ; R82 = 15k
Resistor CMS 1206: R89 = 13k
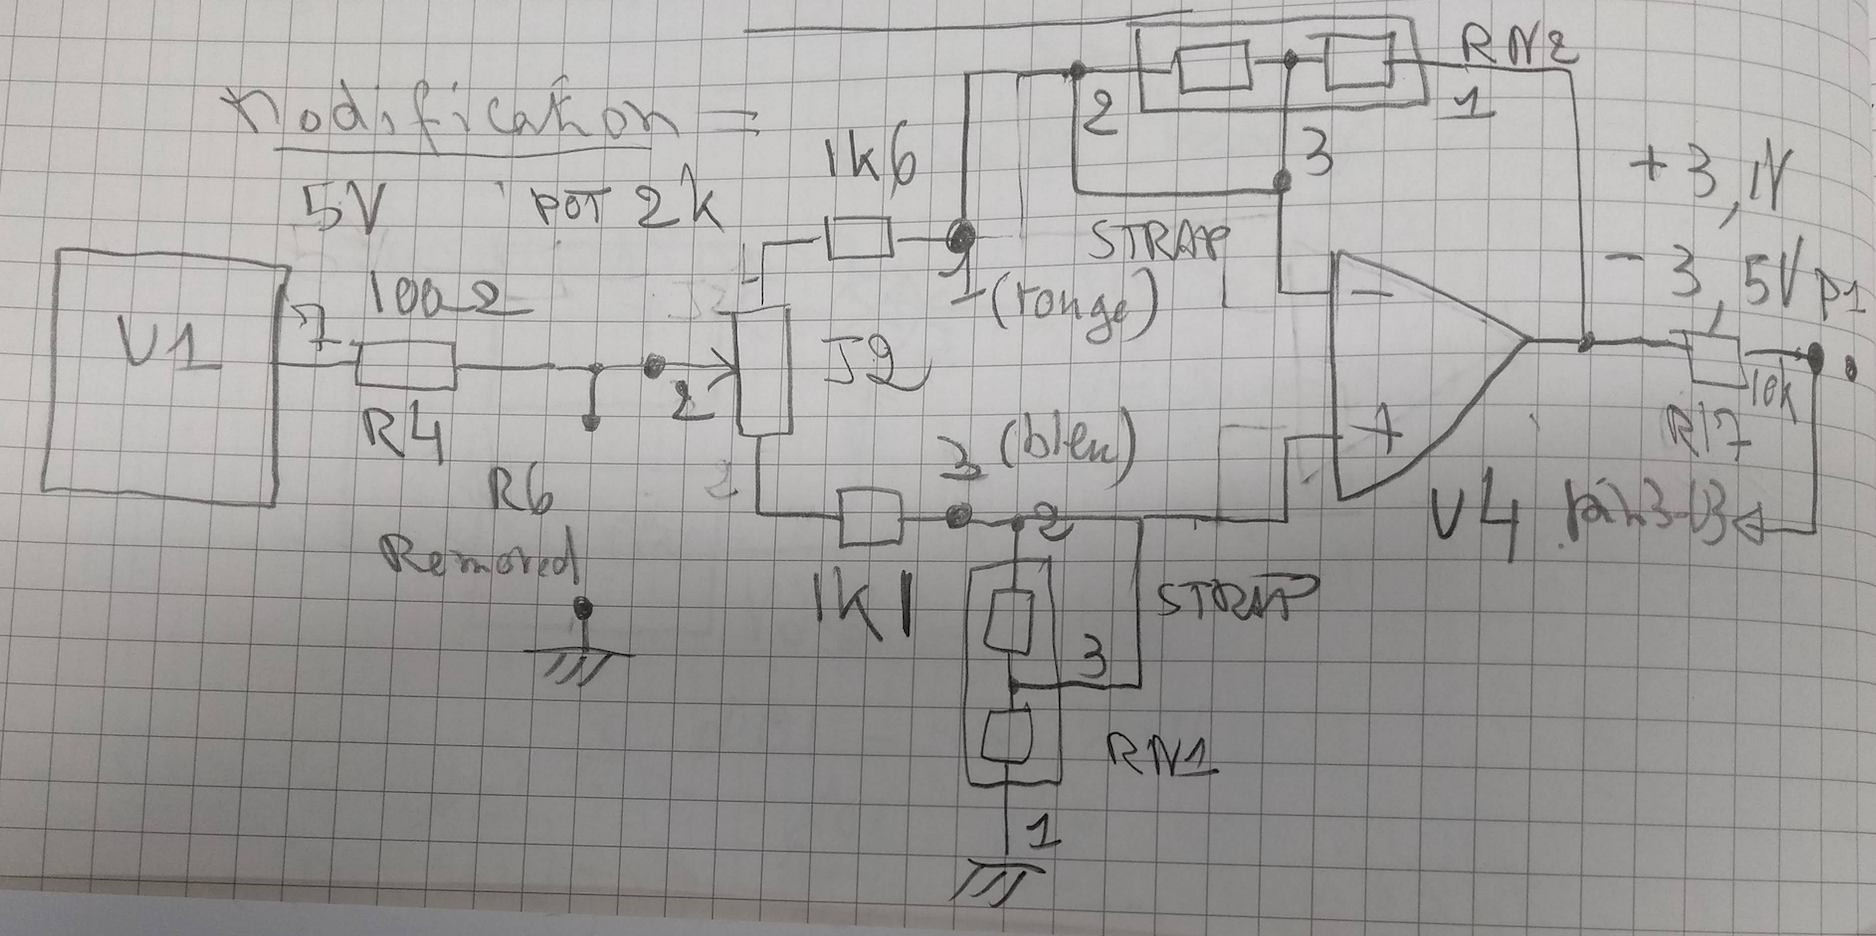
* Modification offset:
The offset circuit is modified in order to have an offset between -3.5V and 3.1V. It is injected at the input of the servo: pin 2 Op-amp U3
Resistor CMS 1206: R4 = 100
Resistor CMS 1206: R6 = removed
Strap (wire) between pin 2 and 3 of the resistive divider RN1
Strap (wire) between pin 2 and 3 of the resistive divider RN2
Resistor 1k6 added between pin 1 of the J2 connector and the wire (red) going to potentiometer 2k on front panel
Resistor 1k added between pin 2 of the J2 connector and the wire (blue) going to potentiometer 2k on front panel
Strap P1 removed
Wire set between pin 1-P1 and pin 2-U3 (pad of C7 connected to pin 2-U3).
* Gain adjustment (G): Gmin = 0.02 / Gmax = 5 / Gtyp = 0.8
Resistor CMS 1206: R33 = 22k
Resistors CMS 1206: R7 = 10k
Resistors CMS 1206: R5 = 5.1k
* Input impedance: 50 Ohm load removed
R145 and R146 removed
Here I put the new measurement of OPO optomechanical transfer function. The difference between last time is considered as coming from the replacement of photodetector.
The data is also attached.

[Eleonora.P, Eleonora.C, Pierre and, Yuhang]
Here I put some result about the noise performance of two positions. One is SHG transmission and the other is GRMC transmission.
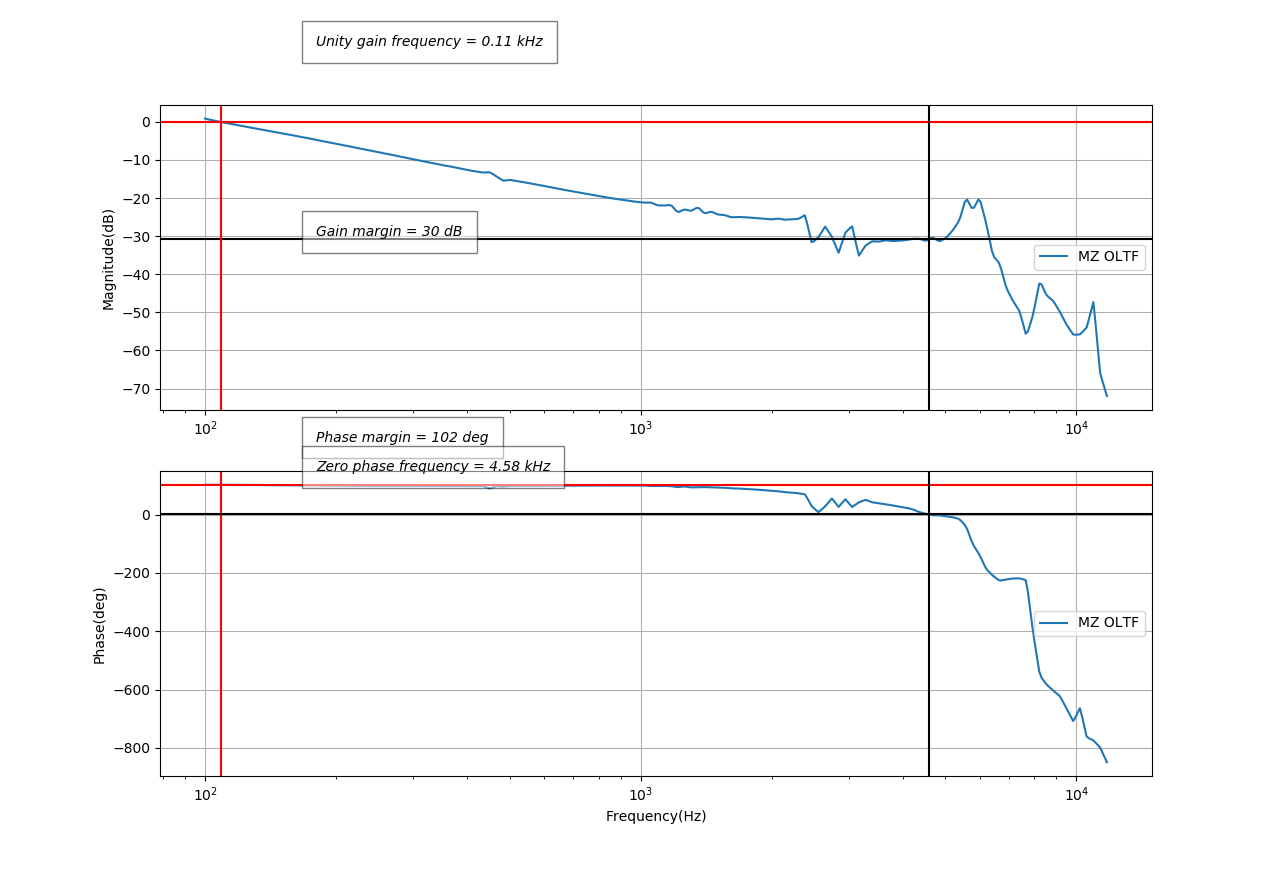
I also measured the open loop transfer function of SHG again.
Figure 1: The new SHG servo shows an order of 2~10 larger noise above 1kHz.
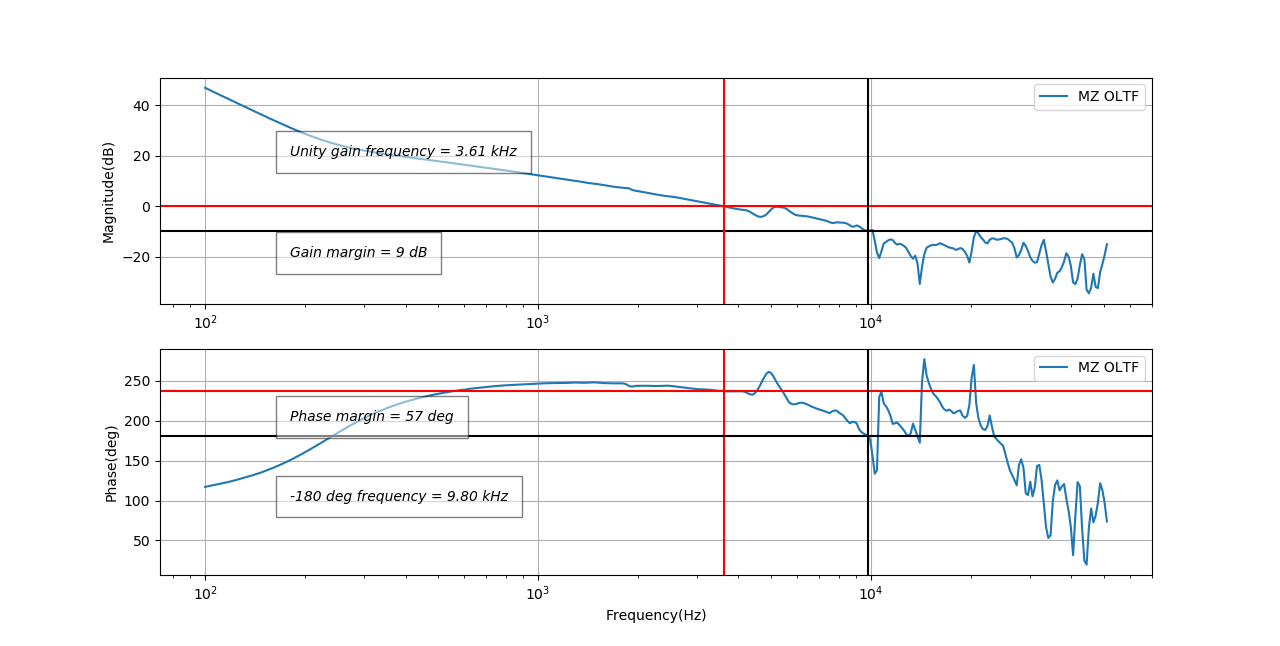
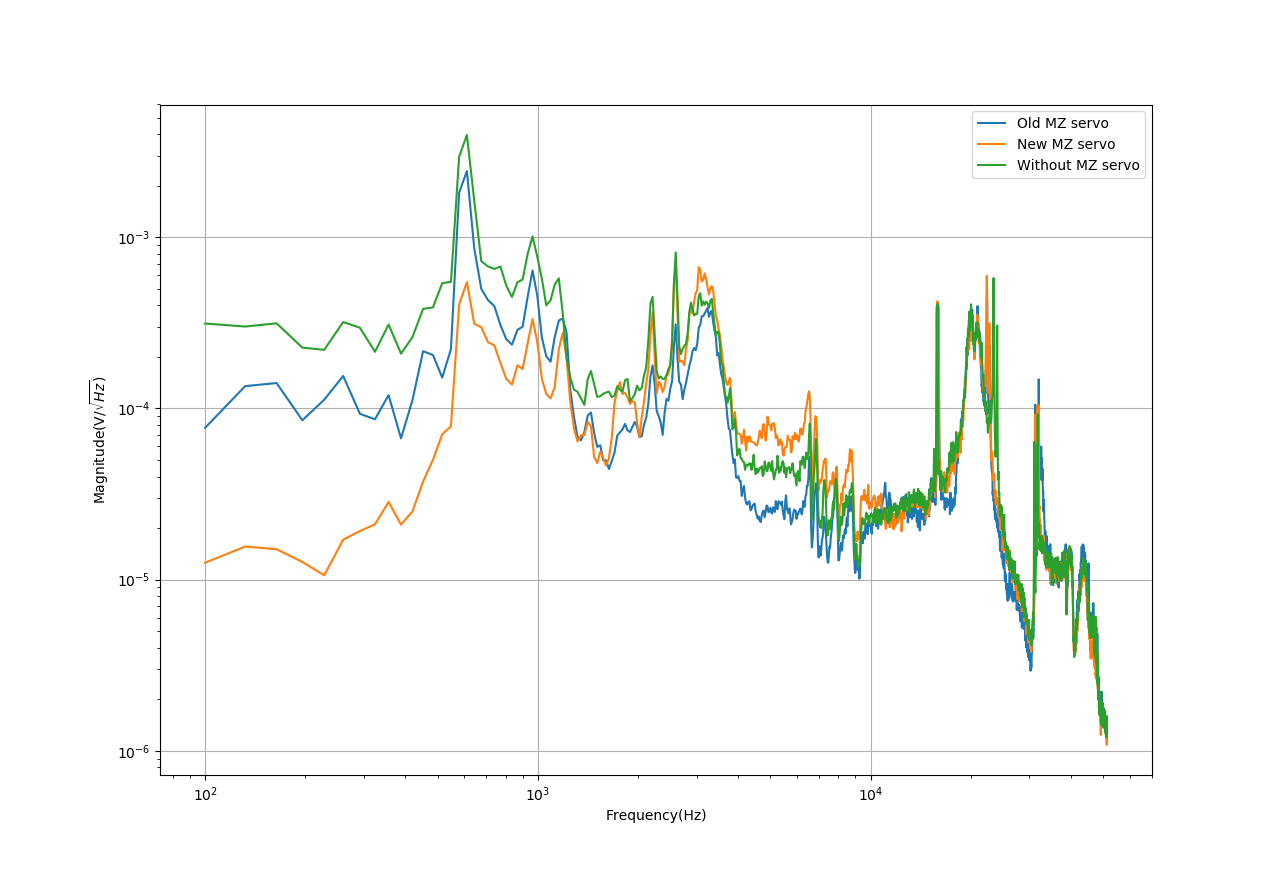
Figure 2: New MZ servo reduces low frequency(100-1k) noise by a factor of 3~30. While the old servo reduces low frequency only a factor of 2~3. However, the new servo increases high frequency noise by a factor of ~1.2 while the old one reduce it by a factor of ~1.2
The measurement of old SHG OLTF shows very strange behavior. It has only unity gain frequency of 100Hz. There should be something wrong. But up to now, we didn't find out what is wrong.
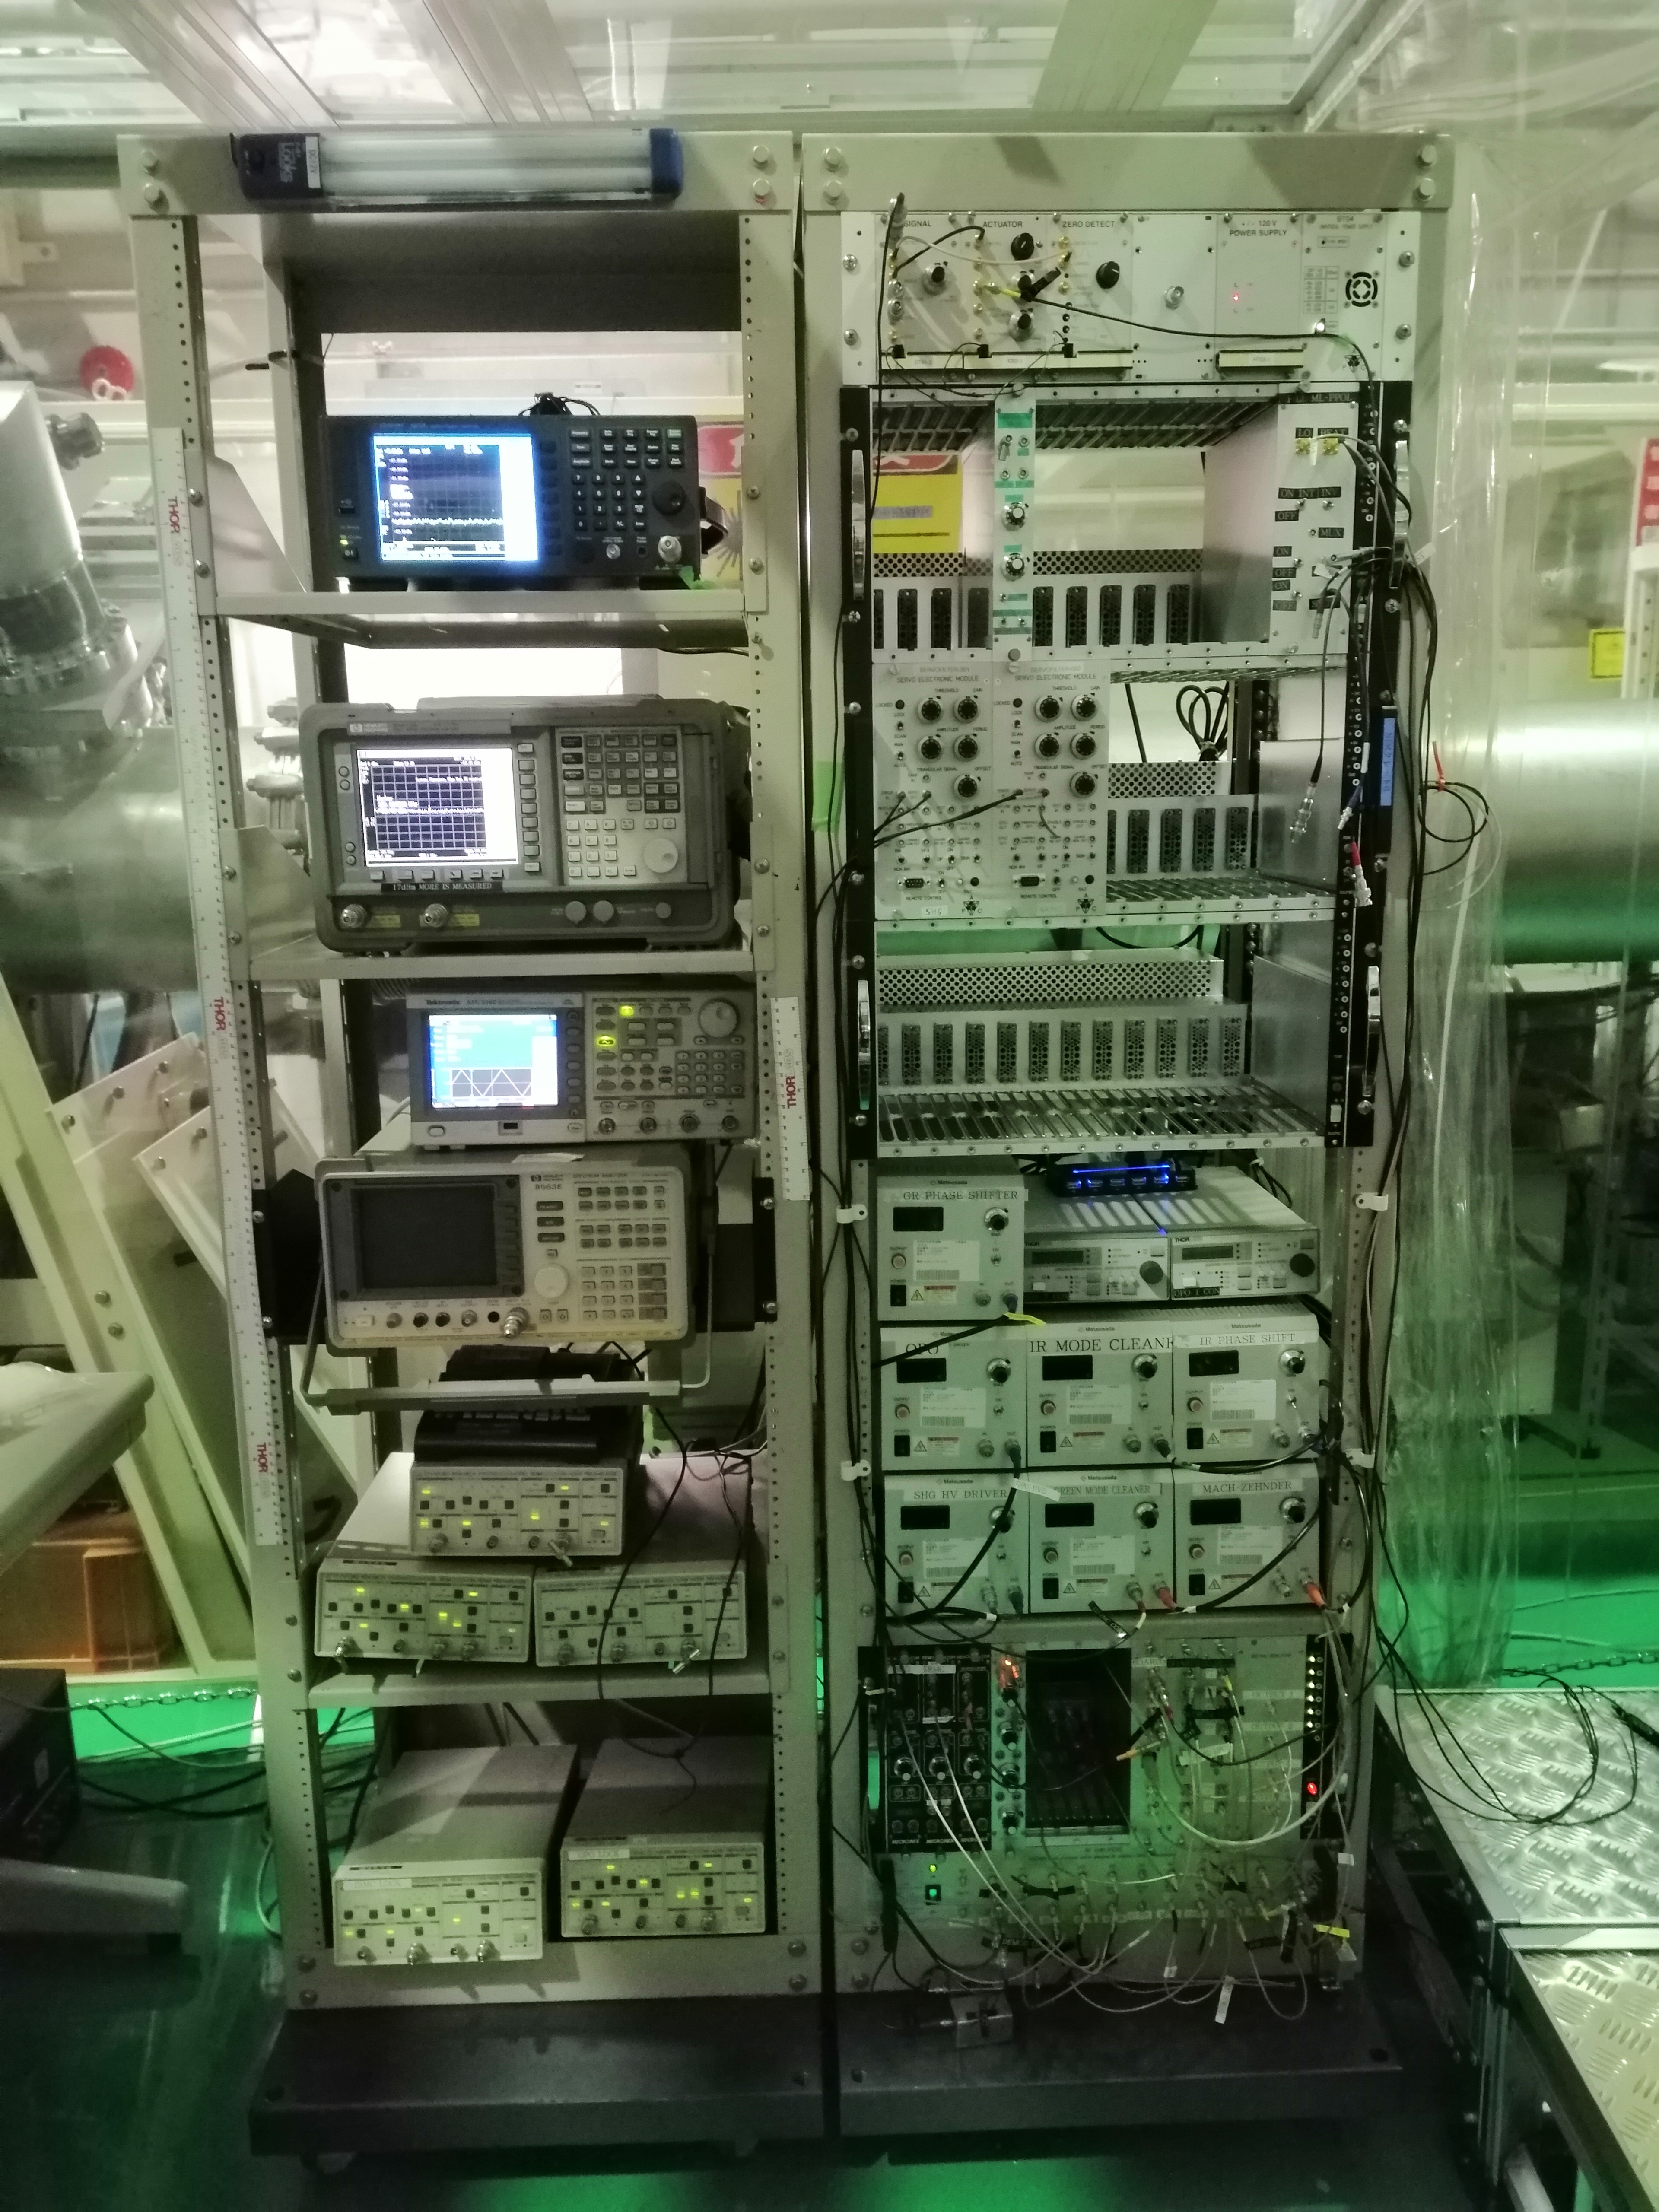
We re-organize the storage rack, introducing two NIM racks, in order to make space for the new NIM modules provided by Pierre Prat.
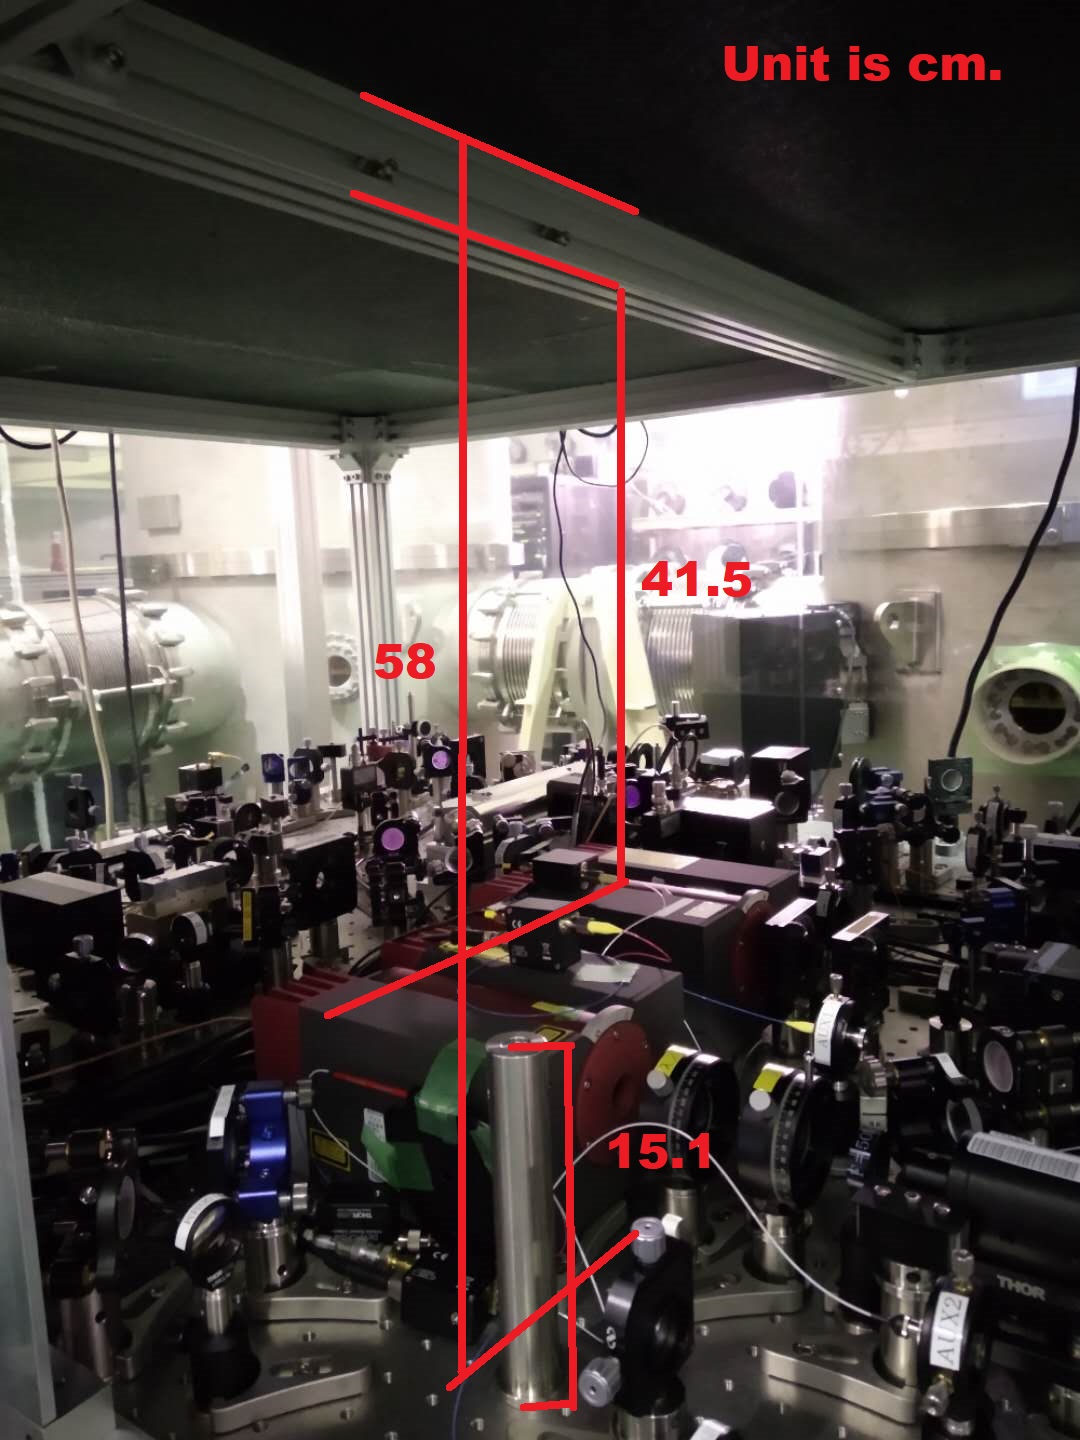
| Bench surface to ceiling | 58cm |
| Bench surface to top frame | 53cm |
| Bench surface to laser head top surface | 11.5cm |
| Pedestal pillar(thin and longest we have) | 15.1cm |
| Spacer used to extend pedestal pillar(longest we have) | 11.3cm |
| Thickness of breadboard | 1.2cm |
We measured the beam size of OPO TEM00 transmission after PBS (setting the initial position in the z0 of OPO), that will be sent to the filter cavity. We acquired 7 data points (fig 3) for two perpendicular axes of the beam (W and V) and we made the fit, as shown in fig 1.
Beam parameters estimated by the fit:
- w0 = (0,21 +/- 0,06) mm (in W direction)
- z0 = (0,10 +/- 0,29) m (in W direction)
- w0 = (0,21 +/- 0,09) mm (in V direction)
- z0 = (0,10 +/- 0,45) m (in V direction)
This estimation is not reliable as we can see from the errors.
We did the simulation about the beam propagation after the OPO, fig 2. The reference position is the beam waist position inside OPO.
Beam parameters in OPO (initial beam):
- w0 = 0,034 mm
- z0 = 0 m
Beam parameters after the lens (z = 0,13m, focal 100mm) after OPO (resulting beam):
- w0 = 0,113 mm
- z0 = 0,56 m
Comparing the above results, we found that the discrepancy is not too large.
One reason should be that also a small change in position of the lens after OPO changes a lot the beam parameters, because we don't know exactly the position of beam waist inside OPO. Another reason can be the not really good quality of the measurements, because the beam size was fluctuating a lot, maybe because of the movement on the hand during the acquisition.
Since the first and last points are quite far from the line of the fit, we need to acquire more data to have a better estimation.
Next step:
- To acquire few points also between the second and the third mirrors, fixing the position of the camera every point.
- To do again the fit and compare the results with what we expect.

1-Setting of switches on the front panel:
* The differentiator shall be disabled on the front panel in setting the switch on "OFF".
* The switch INV/NON INV on the front panel, shall be set on INV.
2-Setting of the 8 straps on the board:
Low-pass filter, Notch filter 1 and notch filter 2 are activated on the board in setting strap on connectors P7, P8 and P9 (3 pins) between pins 1 and 2
* The transmission signal is positive with a peak at about 2.6V.
It shall be inverted: the strap on connector P4 (3 pins) is set between pin 2 and 3.
The threshold level must be tuned to -1.3V (THRESHOLD OUT).
* Strap is set on connector P11 (3 pins), between pins 2 and 3, in order to activate the sample-and-hold on the triangular signal, on the locking.
* Strap is set on connector P3 (2 pins) to connect the triangular signal to the output stage.
* Strap is set on connector P2 (3 pins), between pins 1 and 2, for test purpose.
To check low-pass filter, notch 1 and notch 2 filters (in scan mode) between TEST IN and TEST OUT. For this test the differentiator, shall be set on "ON" (not intuitive but important). After this test, the differentiator shall be disabled the front panel in setting the switch on "OFF".
* Strap is set on connector P1 (2 pins), in order to be able to tune the offset.
3-Modification of components:
* Integrator 1/f: corner frequency changed to 2.2 kHz
Capacitor CMS 1206: C38 = 33nF
* Integrator 1/f2: corner frequency changed to 220 Hz
Capacitor CMS 1206: C26 = C33 = 330nF
* Low-pass filter: cut-off frequency changed to 2.2 kHz
Capacitor CMS 0805 : C45 = 2.2nF
Resistor CMS 1206 : R59 = 33k
* Notch filter 1: notch frequency changed to 7.23 kHz / quality factor changed to 3.6 (measured)
Capacitor CMS 0805 1% : C49 ; C50 ; C51 ; C53 = 2.2nF
[Resistor CMS 1206 : R65 ; R66 ; R67 ; R68 = unchanged (10k)]
Resistor CMS 1206 : R73 = 2.7k
* Notch filter 2: notch frequency changed to 11.85 kHz / quality factor changed to 0.9 (measured)
[Capacitor CMS 0805 1% : C60 ; C61 ; C62 ; C63 = unchanged (560 pF)]
Resistor CMS 1206 : R79 ; R80 ; R81 ; R82 = 24k
Resistor CMS 1206: R89 = 13k
* Gain adjustment (G): Gmin = 0.007125 / Gmax = 0.285 / Gtyp = 0.045
Resistor CMS 1206: R33 = 1.3k
Resistors CMS 1206: R5 ; R7 = 10k
Recently, it is found that GRMC loop cannot be closed. To check what is the problem, I disconnected the slow scan of MZ and put MZ PZT offset to a value that GRMC transmission is the highest. After that, according to the original setting, I have done following checks
0. GRMC has a good alignment.
1. PDH signal has 316mV pk-pk checked from EPS1.
2. GRMC has loop sign of INV, which is as design.
3. The RF source phase is reloaded. The phase of RF source is 125deg. When it is changed to 35deg, the signal around resonance becomes flat. This indicates the RF signal phase is still a good one.
4. There is a switch which has +/- sign. This doesn't decide the sign of control loop. But when we use this type of servo for CC1/2 controls, we need to flip this switch. I tried to flip this switch, but it doesn't help to close loop.
5. GRMC transmission is checked to have 1.13V peak. This is two times smaller than the value written by Pierre.
6. Loop gain is 3 as usually used.
7. Threshold for peak identification is -0.55V. This is as required.
8. The GR power reaching AOM is measured to be 44mW, whose nominal value is 50mW.
These checks show little issues but they should not prevent the GRMC locking. More investigation is required.