NAOJ GW Elog Logbook 3.2

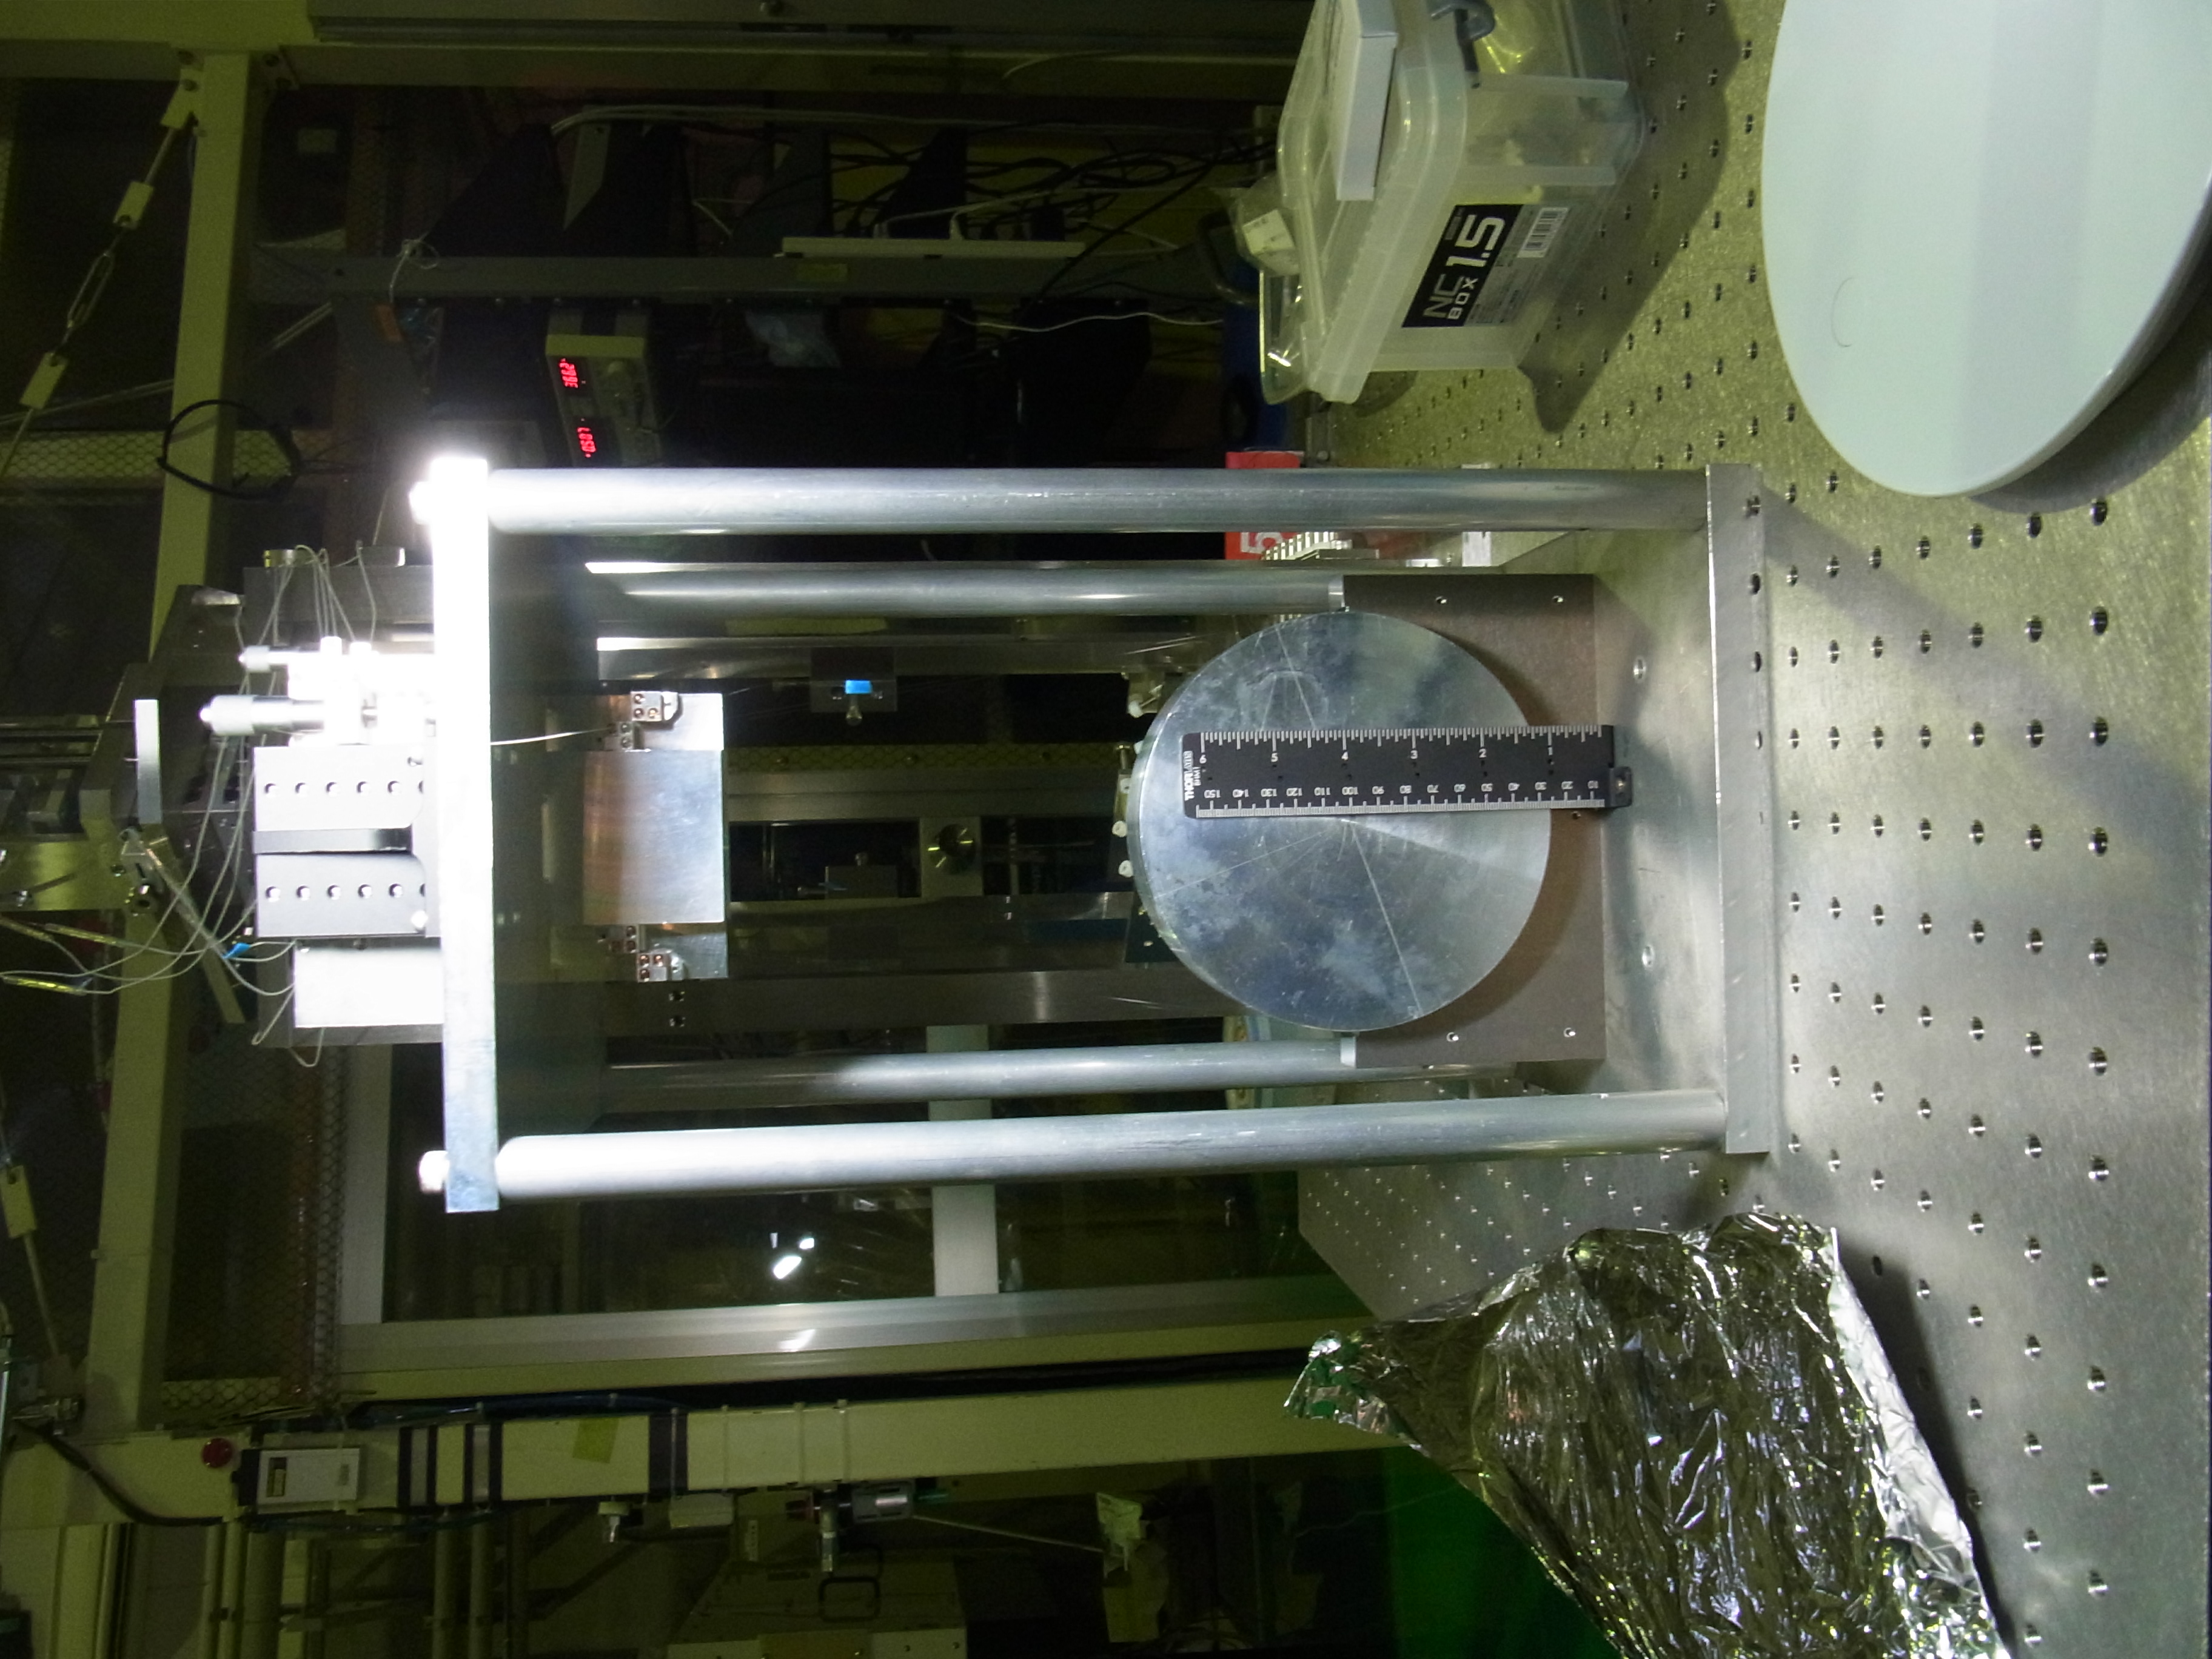
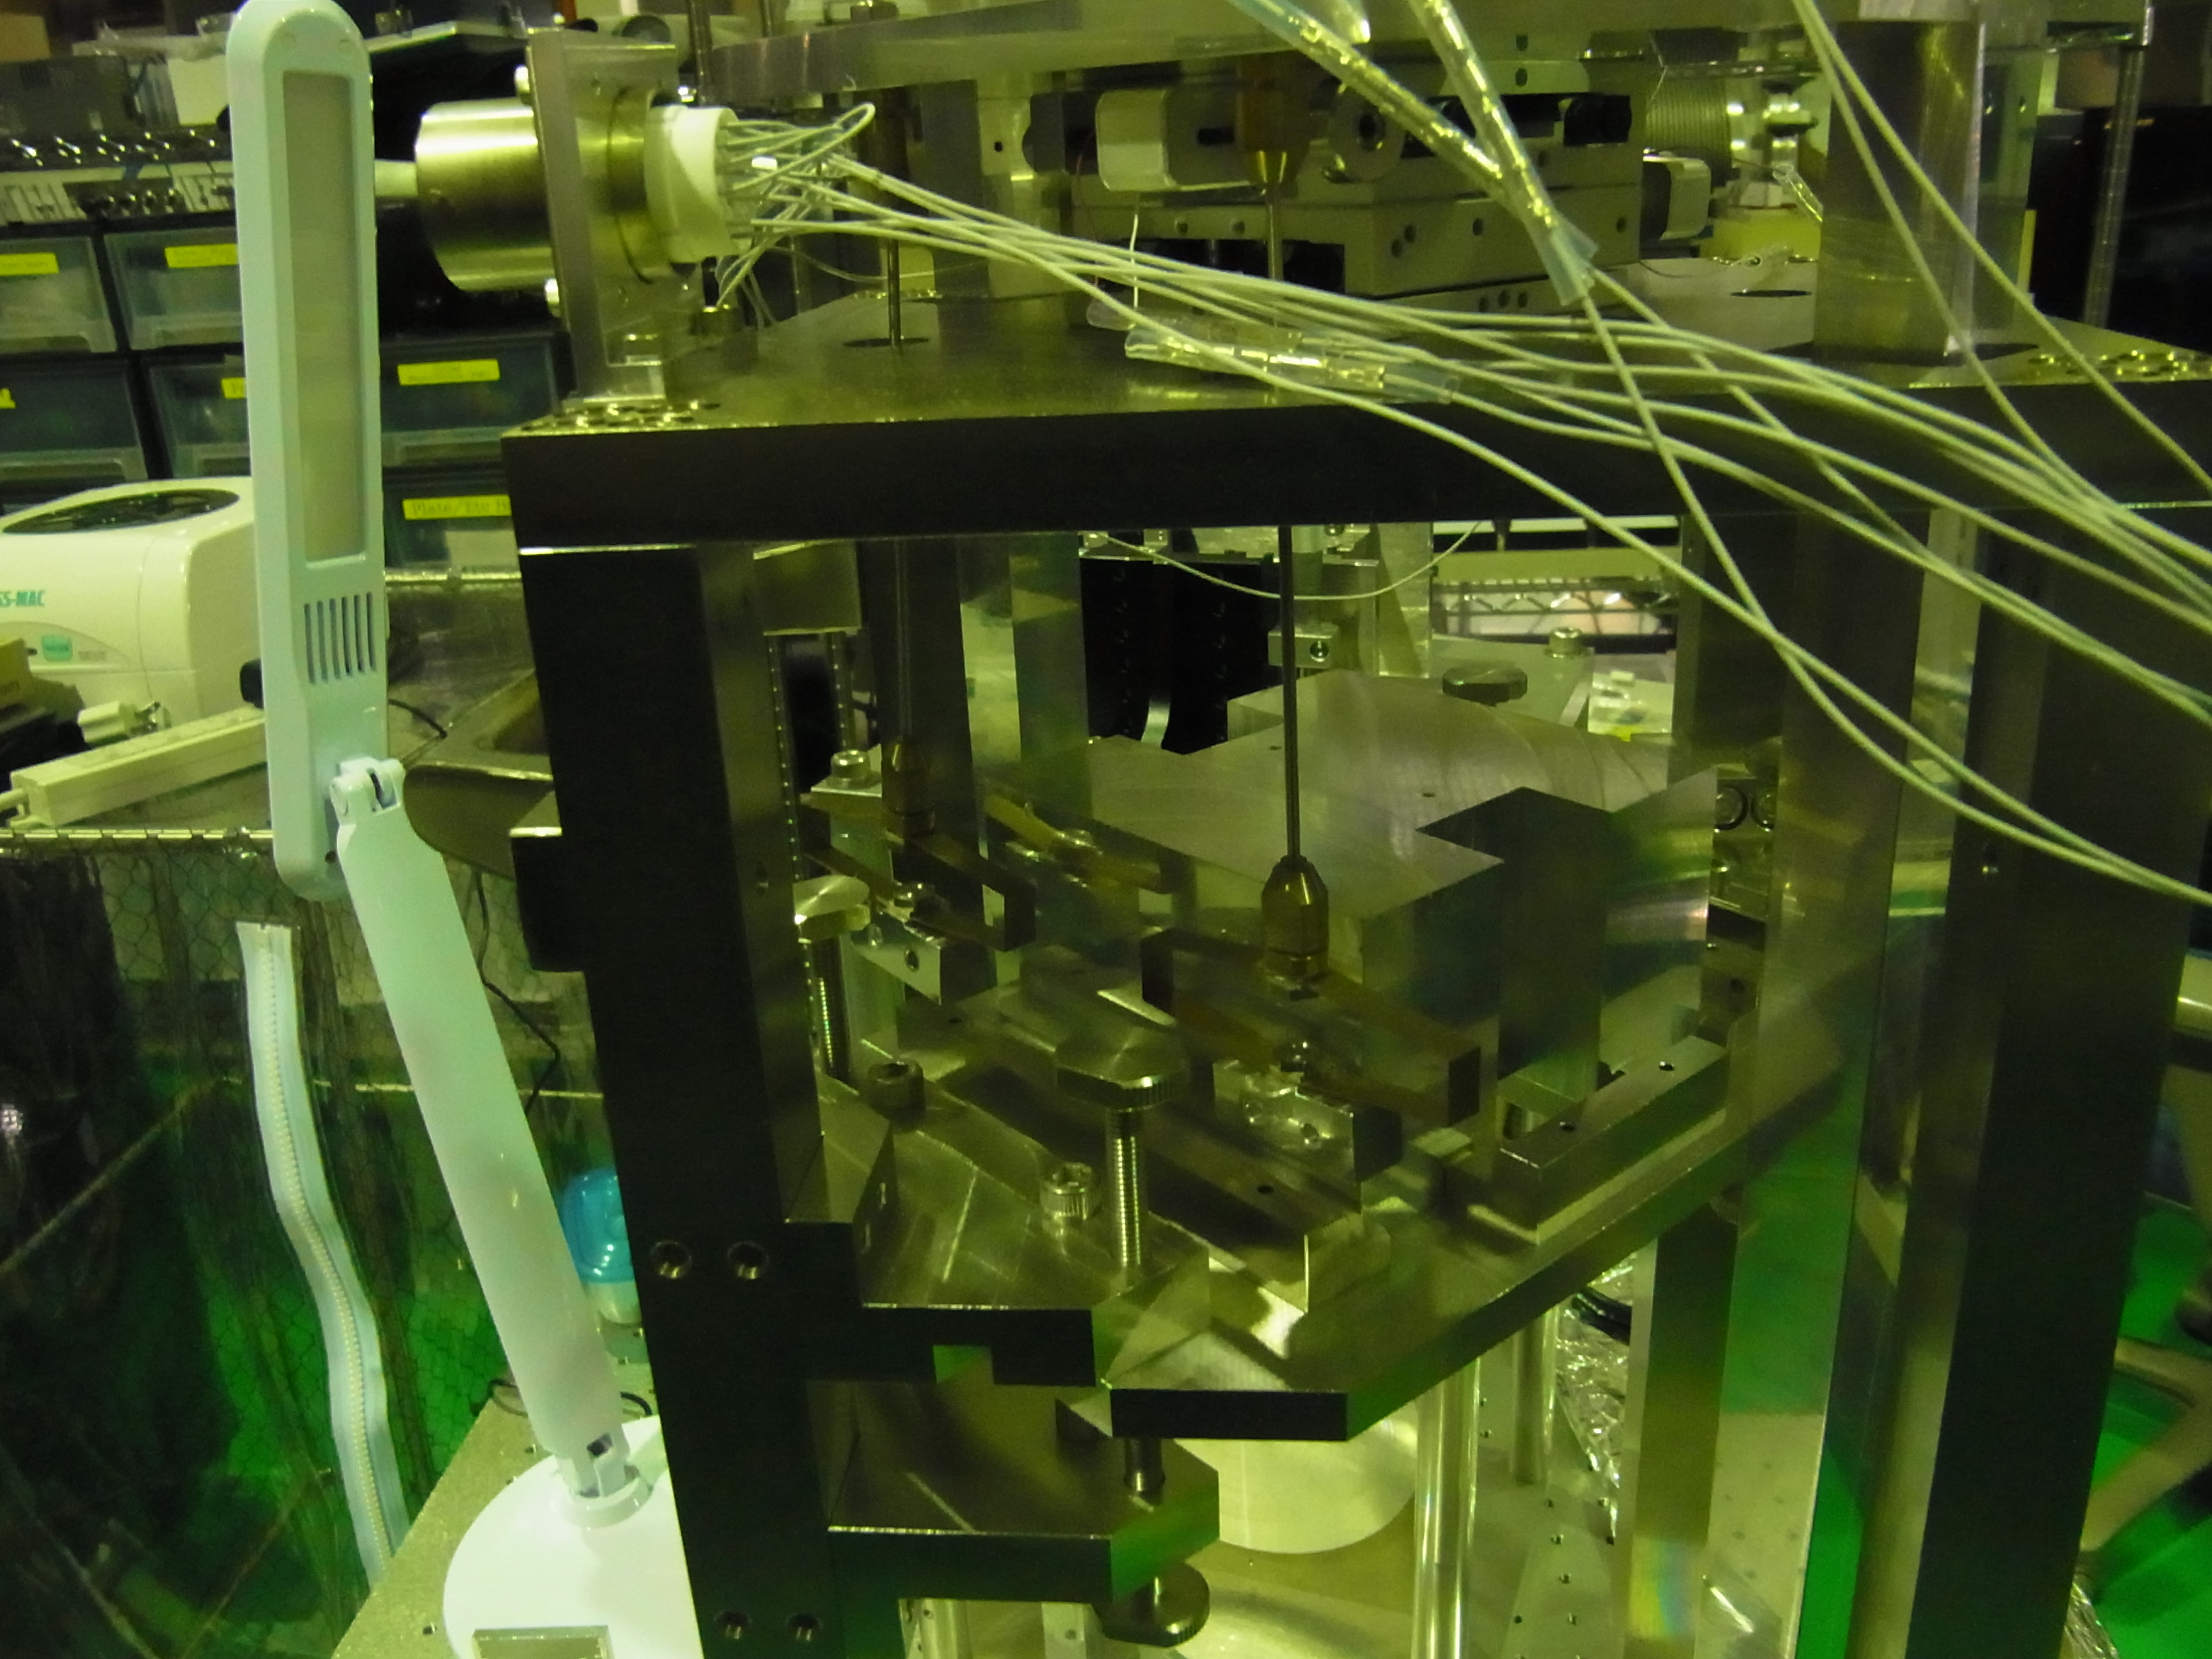
[GOOD NEWS] I successfuly hang BS dummy mass with four tungsten wires of 100 micron.
[BAD NEWS] Dumping mass of the intermediate mass is missing.
Together with this mass, strong magnets and two hanging rods are needed.
[21 Nov.] I found these at bottom of rack for absorption measurement system.
Another missing parts are base plates to sit 10 cm diameter masses for hanging JIG.
I recommend to keep whole parts in one container box.

Worker: Yuefan Guo, Daisuke TATSUMI
We failed to set suspension wire of BS mirror.
We try three times and always break the suspesion wire during the pulling up
the aluminum dummy mirror.
I guess that these failure come from systematic reasons.
Therefore, we stop the work today.
-----------------------------------------------------------------------------------------------------------
I know the safy factor of tensile strength is about 2 for 10cm fused silica mirror.
Because BS mirror has different dimensions, I calculate several parameters.
[[ ]]
1) Tensile strength of tungsten wires2500-3500 N/mm^22) Wire dimensionsDiameter 50 micro-meterNumber of wires 4-->2500 N/mm^2 * (0.025 * 0.025 * pi) * 4= 19.6 N= 2.0 kgf-------------------------------------------------------------3) Mass of mirror and dummyDiameter 1 0cm / Thickness 6 cm Volume = 471 cm^3Diameter 15 cm / Thickness 4 cm Volume = 707 cm^3Density ofFused silica 2.20 g/cm^3Aluminum alloy 5052 2.68 g/cm^3Weight of10cm / Fused silica 1036 g10cm / Aluminum 1262 g15cm / Fused silica 1555 g15cm / Aluminum 1895 gIt means that for 15cm alumimum dummy mirror,
there is almost no safety factor. If tension balance of four wires is not good,
the wires will break easily.
I decide to change the wire diameter to 100 micron.
P.S.
High wire tensions are needed to reduce its mechanical loss.
For stearing mirror of the filter cavity, we do not take car of thermal noises.
Members: Sakai, Manuel
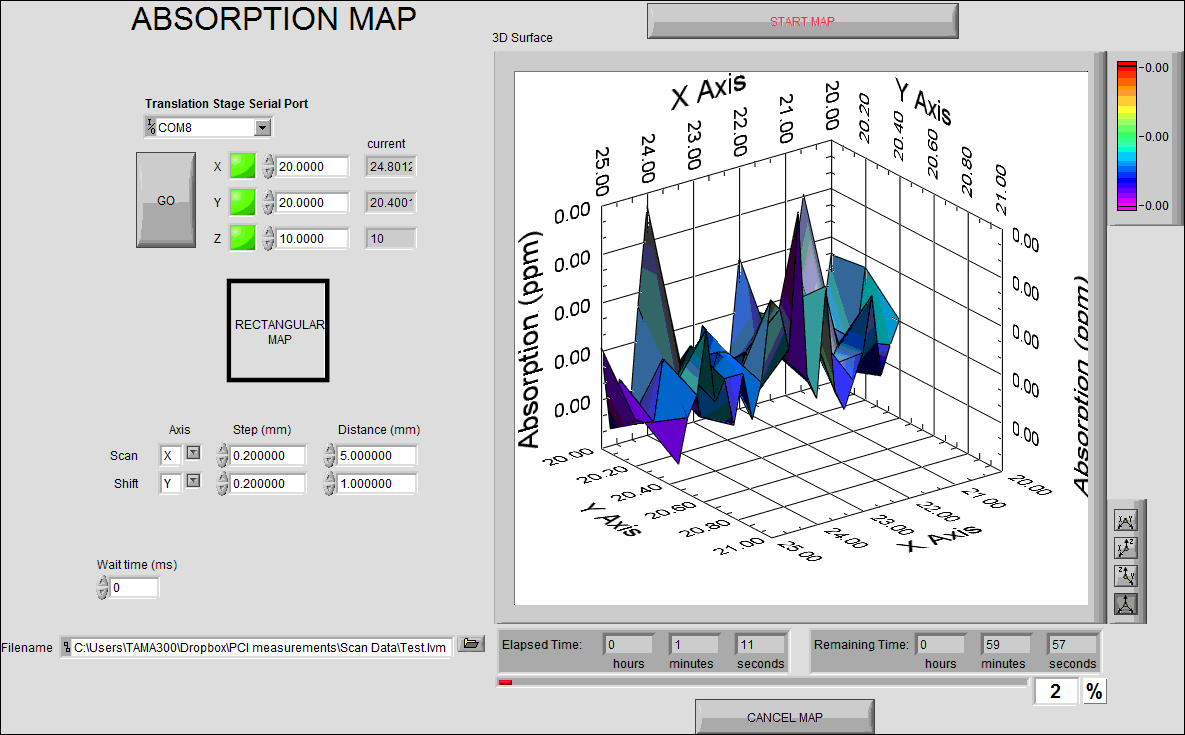
We improved the VI that makes the absorption maps. Now it can also make Circular maps. We added an elapsed/remaining time and progress indicator. We also cleaned up the Front Panel to make it simpler. Next, we will include the filters.
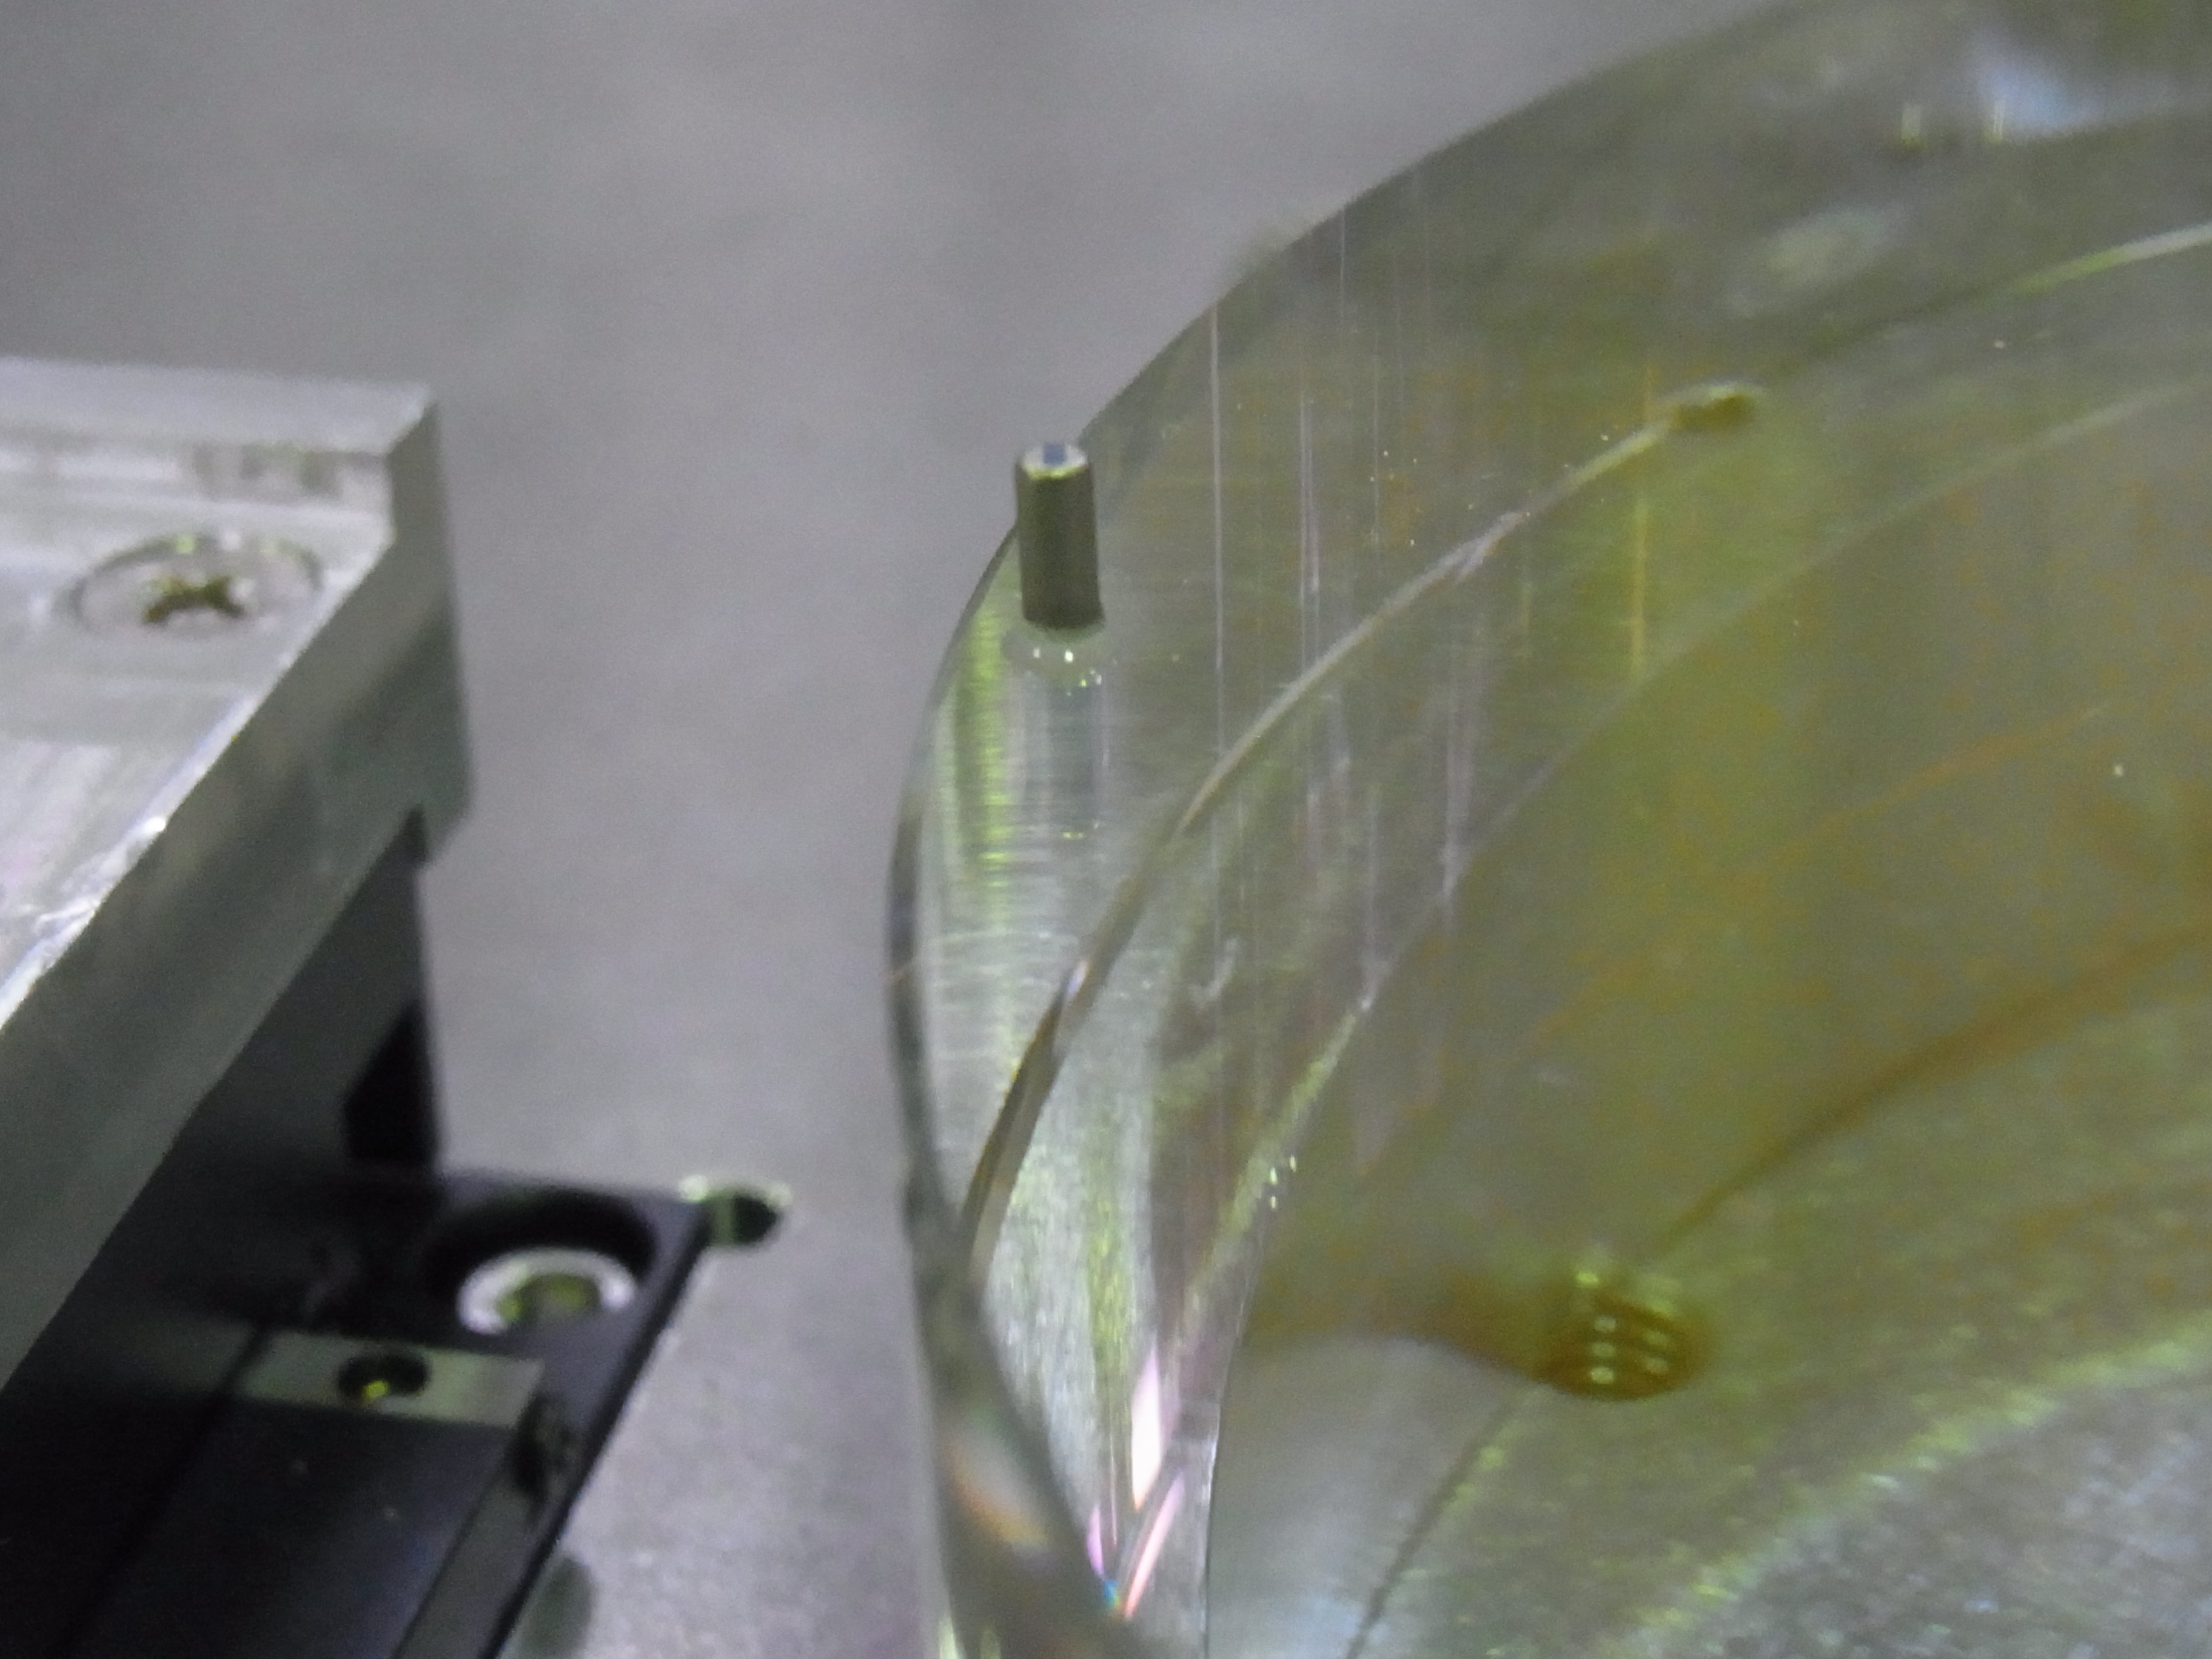
I finished the glueing work for TAMA BS mirror.
I measured the beam height at TAMA center room.
The beam height is about 1200 mm.
This is consistent with Takahashi-san's answer.
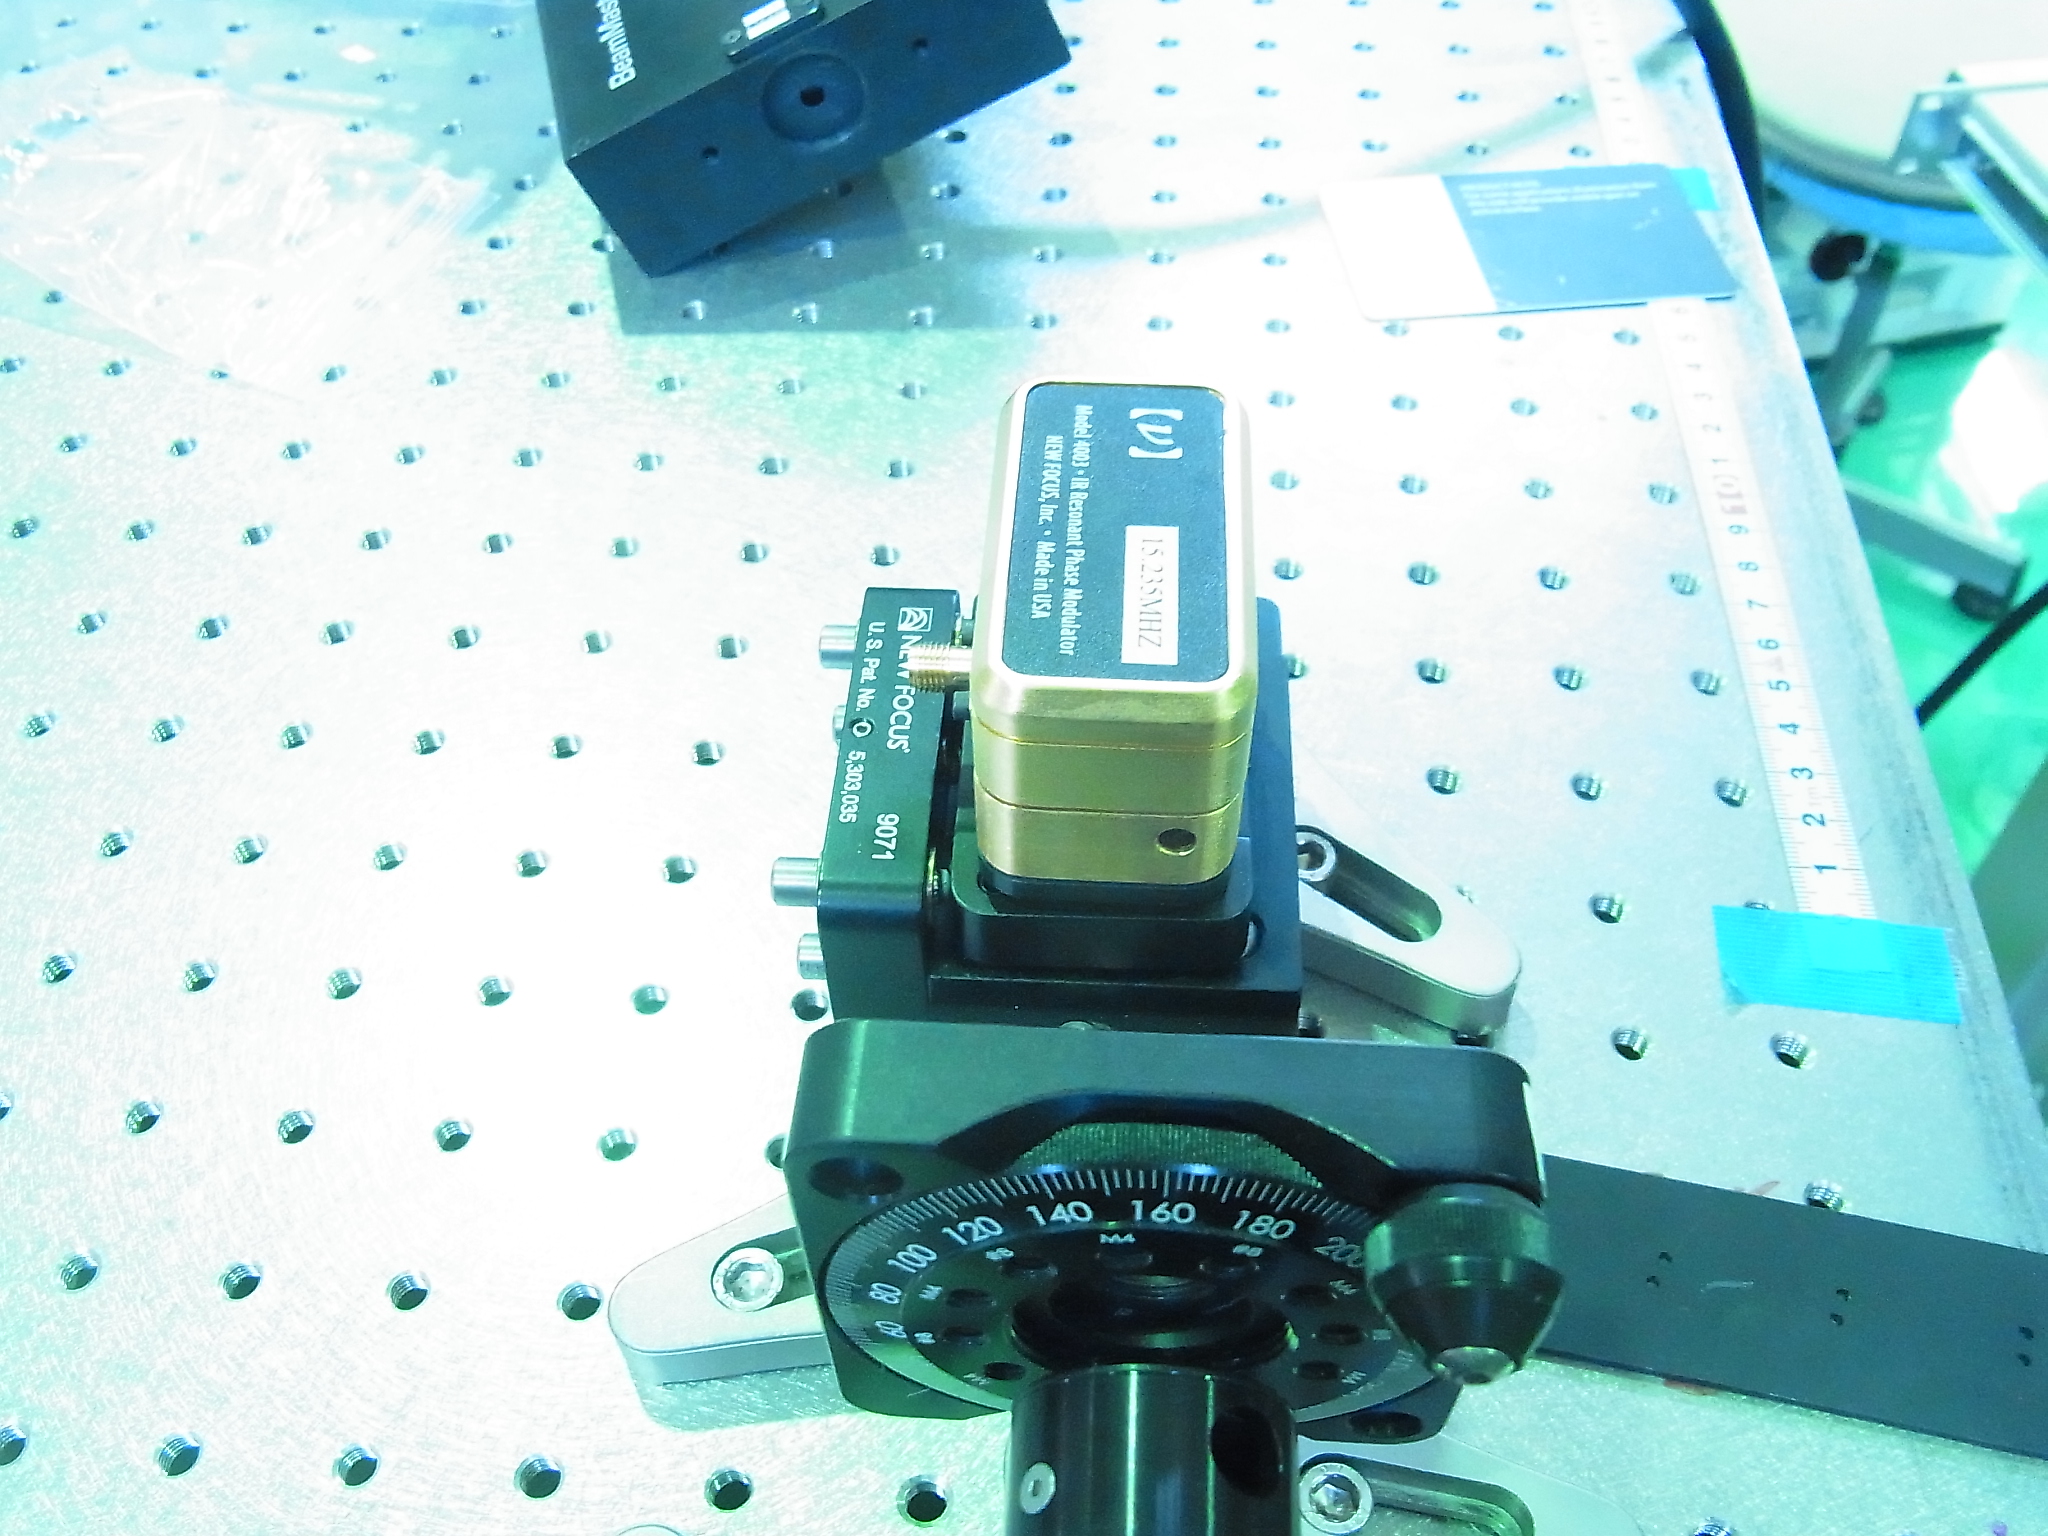
I checked some EOM at TAMA.
I found that Yuefan already installed a custom EOM for SHG.
I know the following things.
1) Custom EOM crystal (producted by DELTRONICS Inc.) was assembed into Newport 4003 housing. And then its resonant frequency was tuned to be 15.235 MHz by New Port Inc.
2) To reduce a power density of the passing beam, the crystal has dimensions of 4 x 4 x 40 mm. In addition, holes on the housing were expanded to 4 mm in diameter. Normal New Port EOM 4003 has 2 mm of its aperture.
3) At TAMA site, we have several EOMs as listed bellow.
| PRODUCT | Resonant freq. (MHz) | Aperture | |
| Custom EOM | 15.235 | 4 mm | already installed for SHG |
| NewPort 4003 | 15.24 | 2 mm | |
| NewPort 4003 | 76.1 | 2 mm |
I upload a PDF on TAMA RF photodetector.
I upload three PDF files on a system of TAMA Faraday Isolator. I do not have information on Faraday crystal.
Members: Sakai-kun, Manuel,
We made a VI that takes a single input, uploads the array buffer, applies a median and an average filter and returns a filtered output. There are controls for the filter array sizes and switches to enable and disable the filters. We put this VI in the loop of the VI that shows the signals, we filtered the X and Y signals and plot the AC and Phase. The plots show the filtered signals in white and the unfiltered in gray.
I contacted to the company (Japan Laser Coorp. as a japanease agency of Newport). The currect legs can be separated into upper and lower parts. Cheapest way to change the height is to change the lower part of the legs. To get a quotation, about one week is needed. An expected delivering time is about three months.
Minutes of Meeting
November 2nd, 2016
Participants: M. Barsuglia, E. Capocasa, R. Flaminio, Y. Guo, M. Tacca
1. Coating at LMA
Discussion on going.
2. Optical scheme
New optical scheme produced by Matteo and Eleonora.
2a. Which polarization shall we use? The OPO and the SHG seems to work with S-pol (TBC with
Matteo Leonardi). Which polarization one is compatible with the EOM that we have?
Yuefan wil check.
2b. SHG lock. It can be done in transmission. GEO did it in transmission. Virgo is doing
it in reflection. If so we can remove the optics to do the lock-in in reflection.
2c. Share of IR power between SHG path and 1064IMC path? Need to check with Matteo Lombardi
what is the minimum power required for the SHG.
2d. Modulation frequency for the SHG/1064MC: GEO was using 75MHz. Virgo is using 80 MHz.
We are planning to use 15 MHz.
2e. IMC's. Mechanical design received form JP Zendri. Finesse: 500? Polarization: S?
Raffaele will consult with Matteo Lombardi. APC team will consult with people at LKB.
2f. Telescopes. Now that the optical lenght are fixed, telescopes can be studied.
Yuefan is studying the telescope for the SHG. Matteo Tacca will pass to Yuefan
the information about three lenses telescopes.
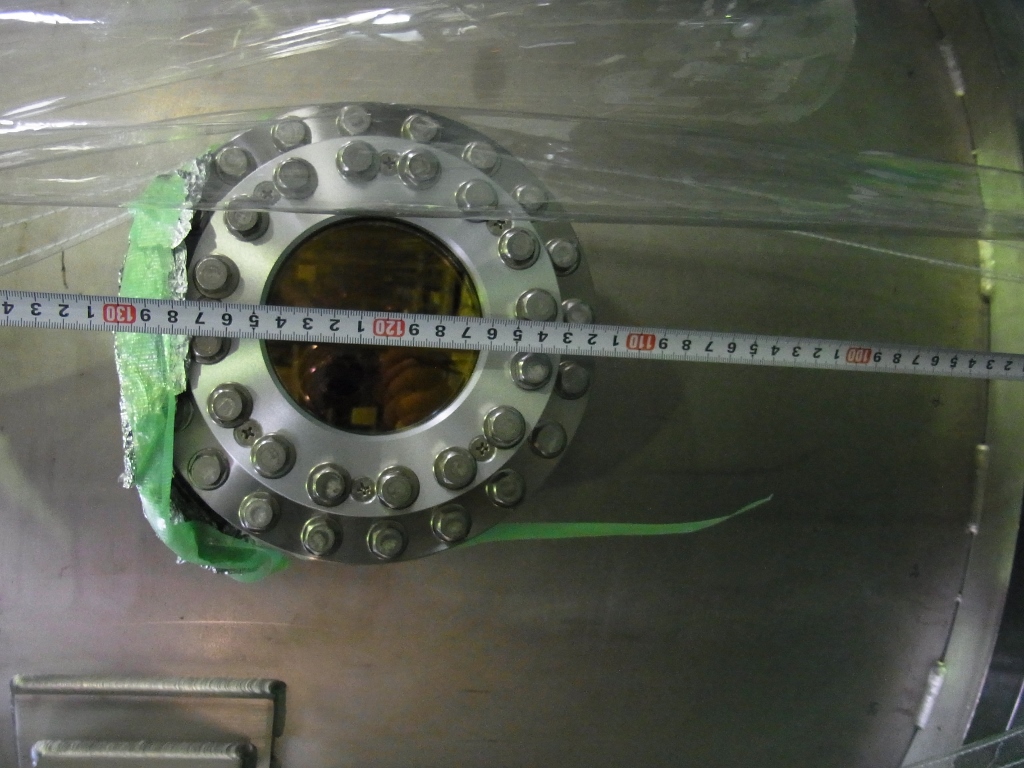
3. Window on vacuum chamber
Flange size is about 15 cm
KAGRA design received from Akutsu. With KAGRA design max window size will be ~9cm.
Matteo Tacca will ask Virgo design for same type of flange.
4. Optical table height. Tatsumi is investigating possible solutions to ahve the beam height
at the same height as the window on the vacuum chamber.
5. Visit to NAOJ of Matteo Tacca. Goal of visit will be the set-up of the green path
for the filter cavity control and the injection into the OPO. Need to define the list of
components to be bought.
Members: Sakai-kun, Manuel
In order to make maps of samples, we made a labview VI that moves the translation stage in 2 directions (namely scan and shift), reads the lockin amp values and put the data in a file.
In attachment the pdf of the front panel and the block diagram.
- Status of assembly
The moving of laser and optics according to Matteo/Eleonora new scheme is started.
We need to check the polarization used/to be used on the bench (is it OK to
work with S-pol?).
Need to check cables behind the lasers. Do they interfere with the beam?
Need to discuss with Matteo and Eleonora.
Yuefan will continue the assembly and fix the lenses required.
- Mode cleaners for 1064 nm and 532 nm
Mechanical design received from Trento. Looking for a company that can produce
them (with the help of Akutsu/ATC).
Curved mirror (1m ROC) may be bought from CVI (Raffaele contacted them)
Trento bought flat mirrors from Opto Sigma.
We can do the same but we need to fix the finesse and the polarization so that
we can fix the coating specifications (to be discussed with Virgo people).
PZT from PI. Raffaele will send the reference to Tatsumi-san to order it.
Viton o-ring to keep the mirror at the good position and allow position control
of the curved mirror. Raffaele will send the reference to Tatsumi-san to order it.
- Height of table and window
Window on vacuum chamber is at 1190 mm. Table is at 900 mm (so beam is at 973 mm).
Three beams need to enter from the window (two squeezed beams at 1064 nm and one
green beam at 532 nm). We would like to avoid periscopes and minimize losses.
So we would like to increase table height by 217 mm so to have the beams at 1190 mm.
Tatsumi-san will investigate what is the solution used in KAGRA.
- Window size
We need to pass three beams through the window.
Yuefan measured the size of the present window.
Size of present window is probably too small.
Larger size is possible. Maybe 9 cm. Is it OK?
The mechanical design used for the KAGRA windows was provided by Autsu-san.
We can start from there. Once the mechancial design will be fixed
we can fix the optic design (diameter, thickness, wedge) and ask
quotation to Sigma Koki.
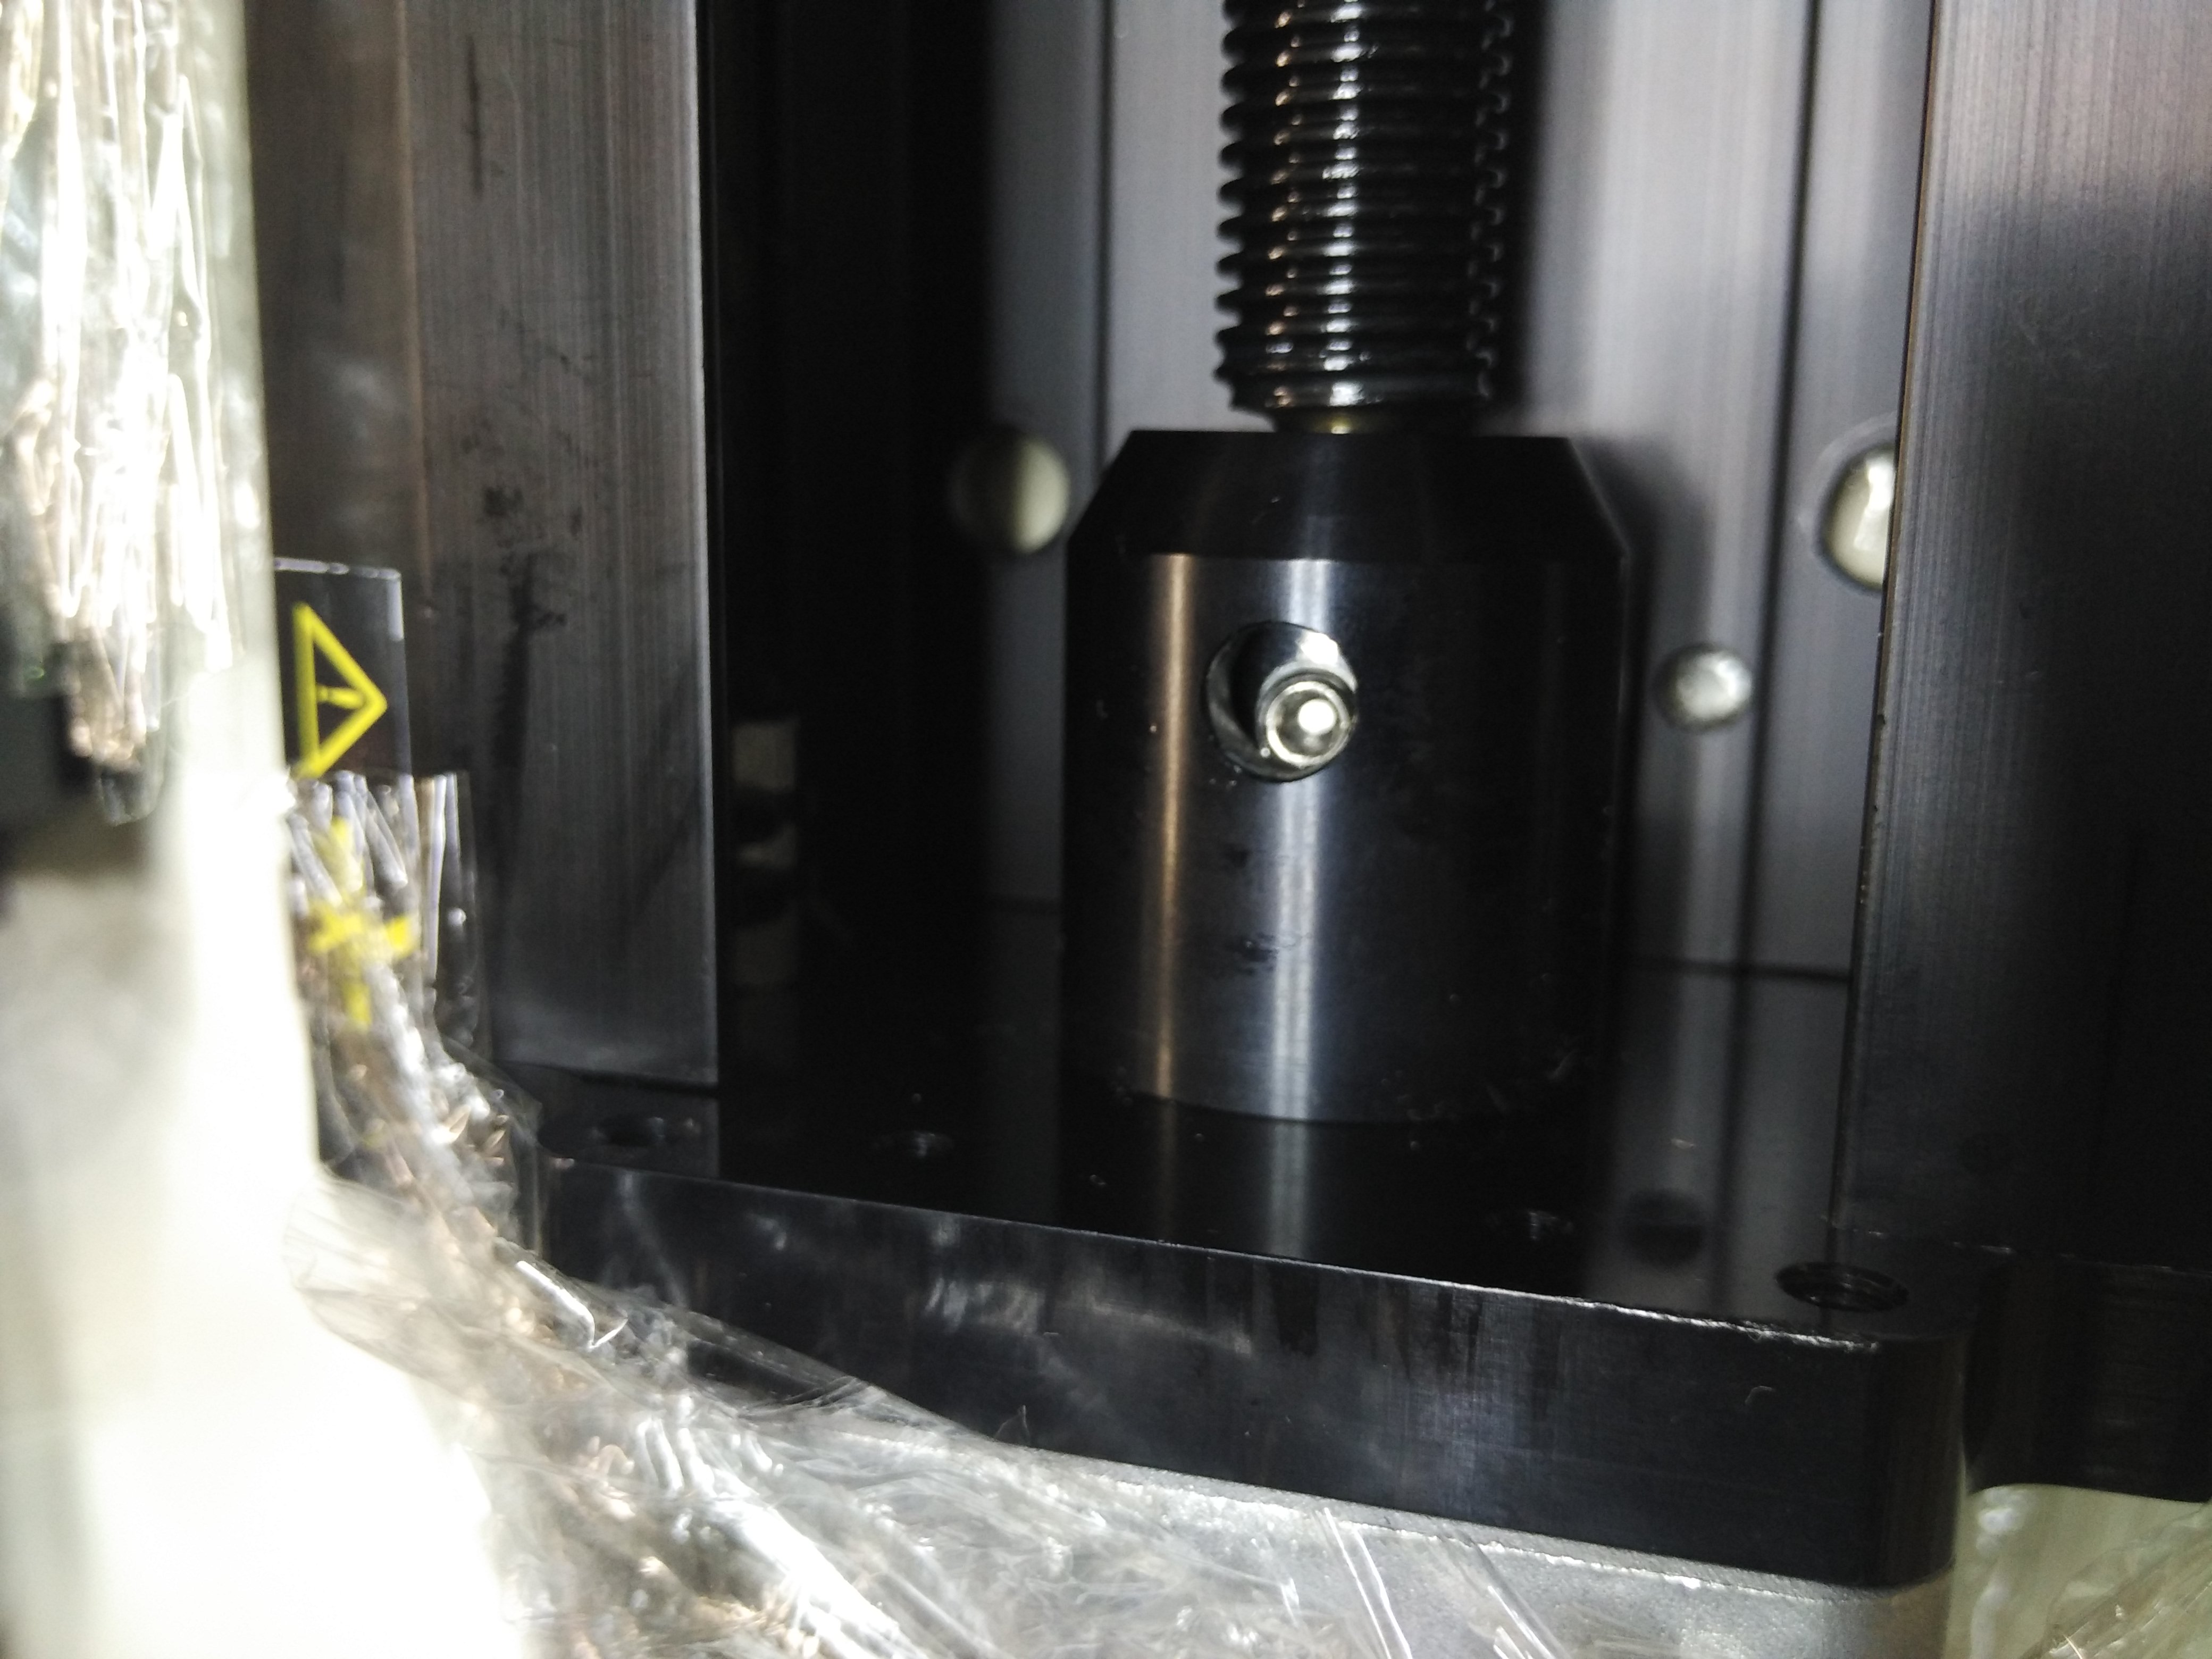
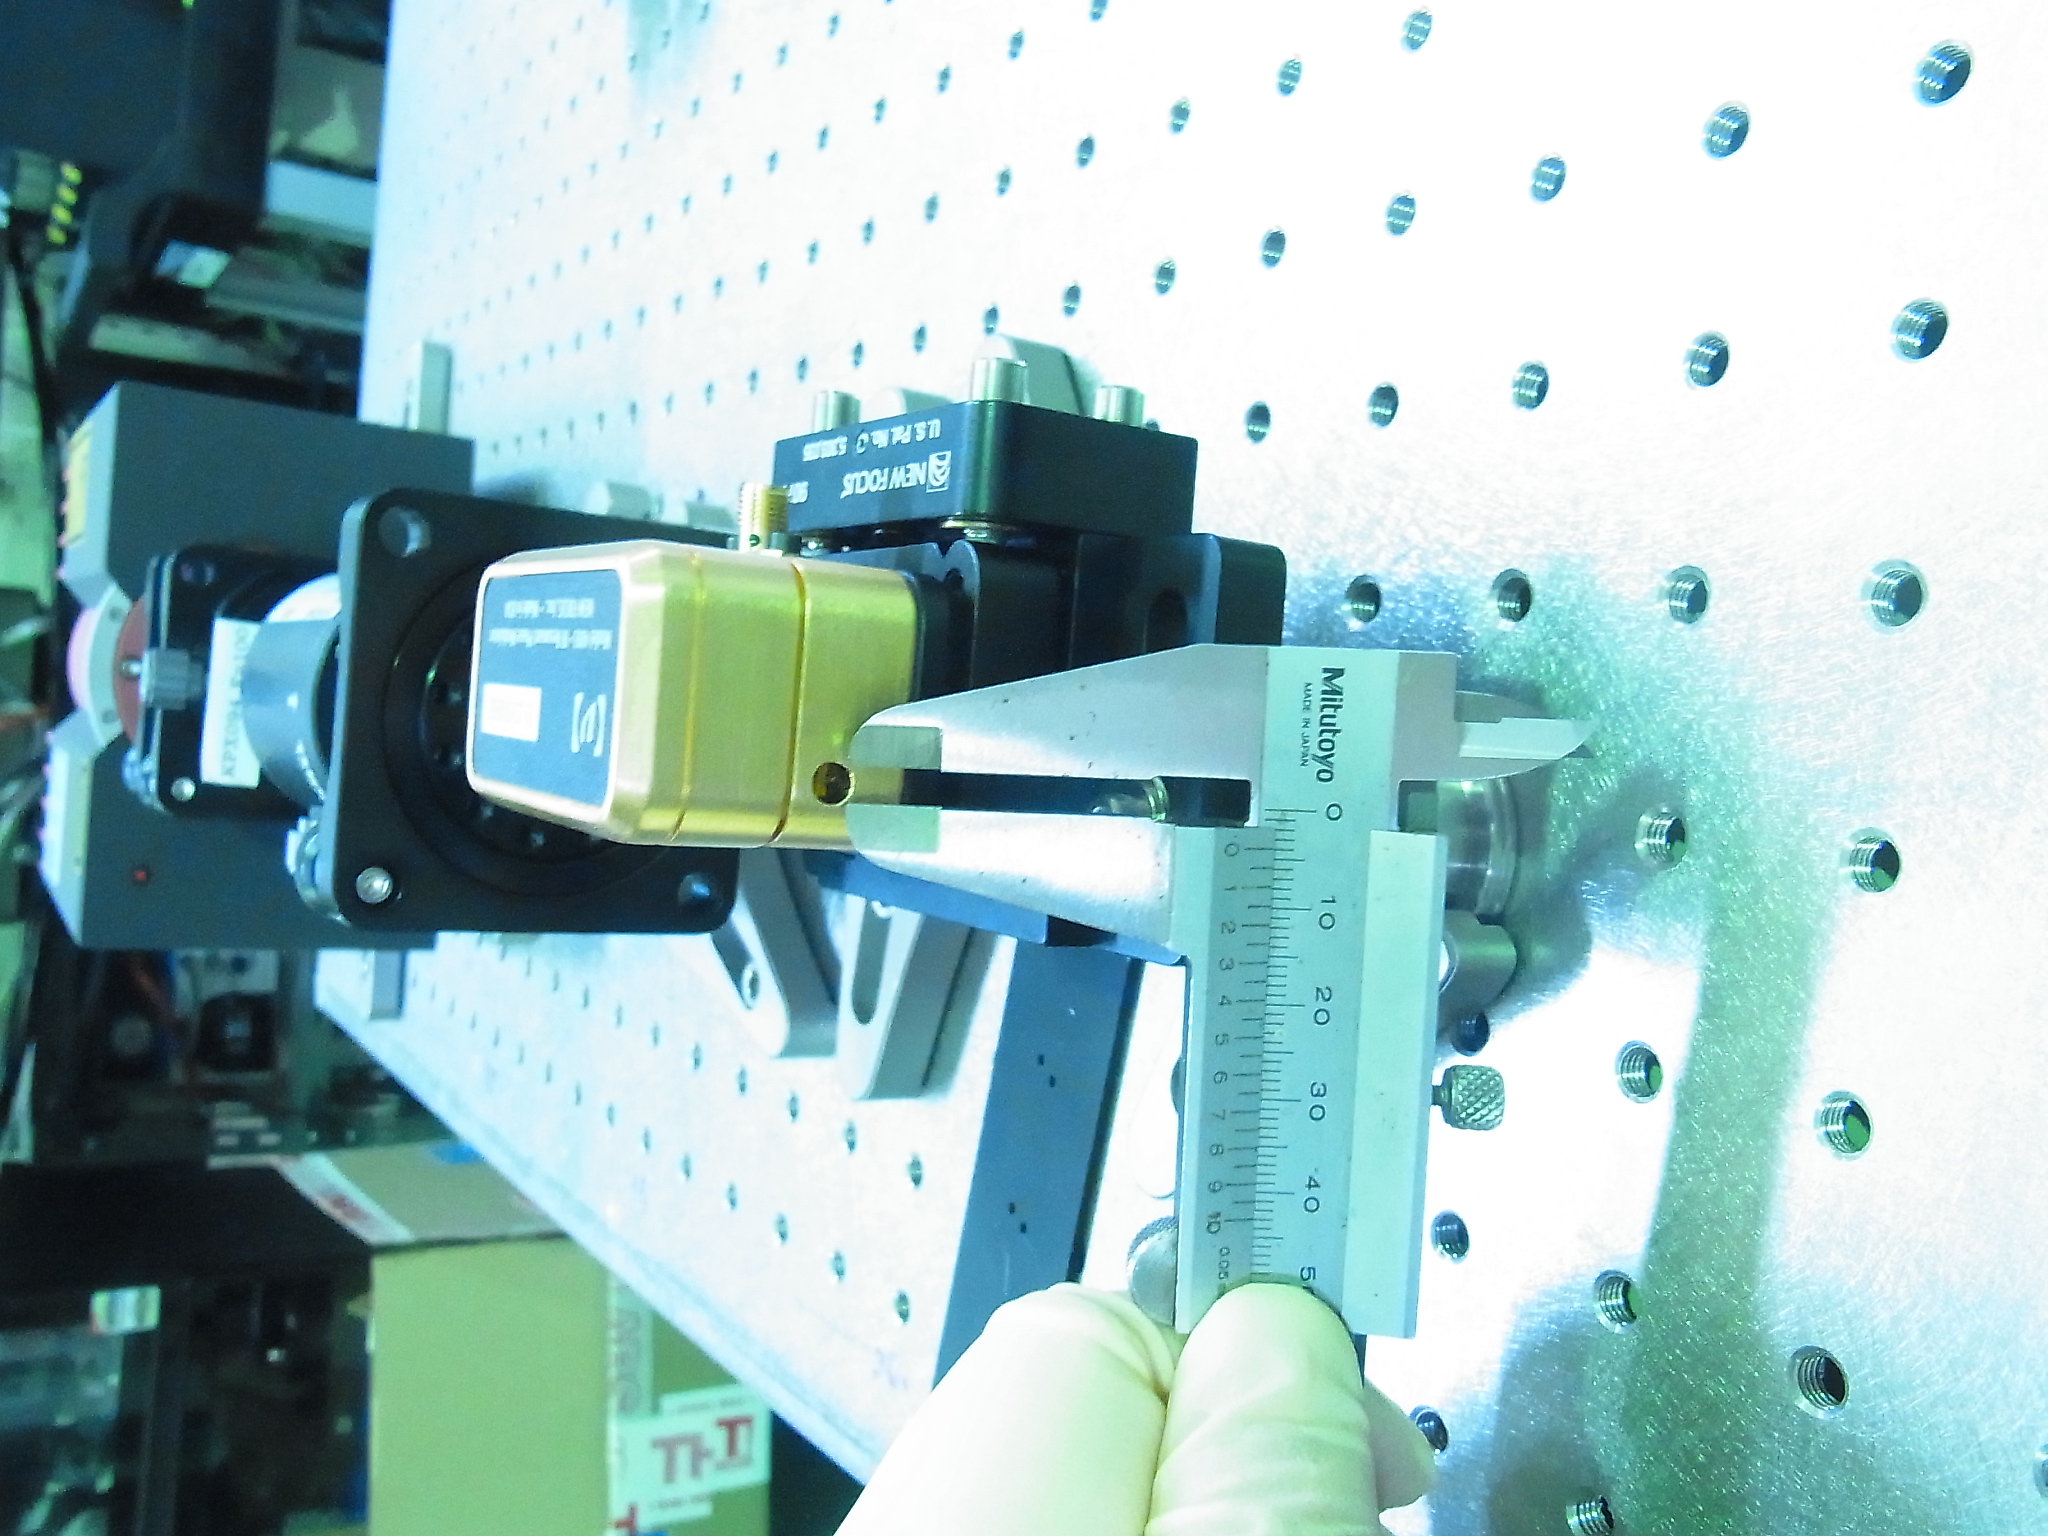
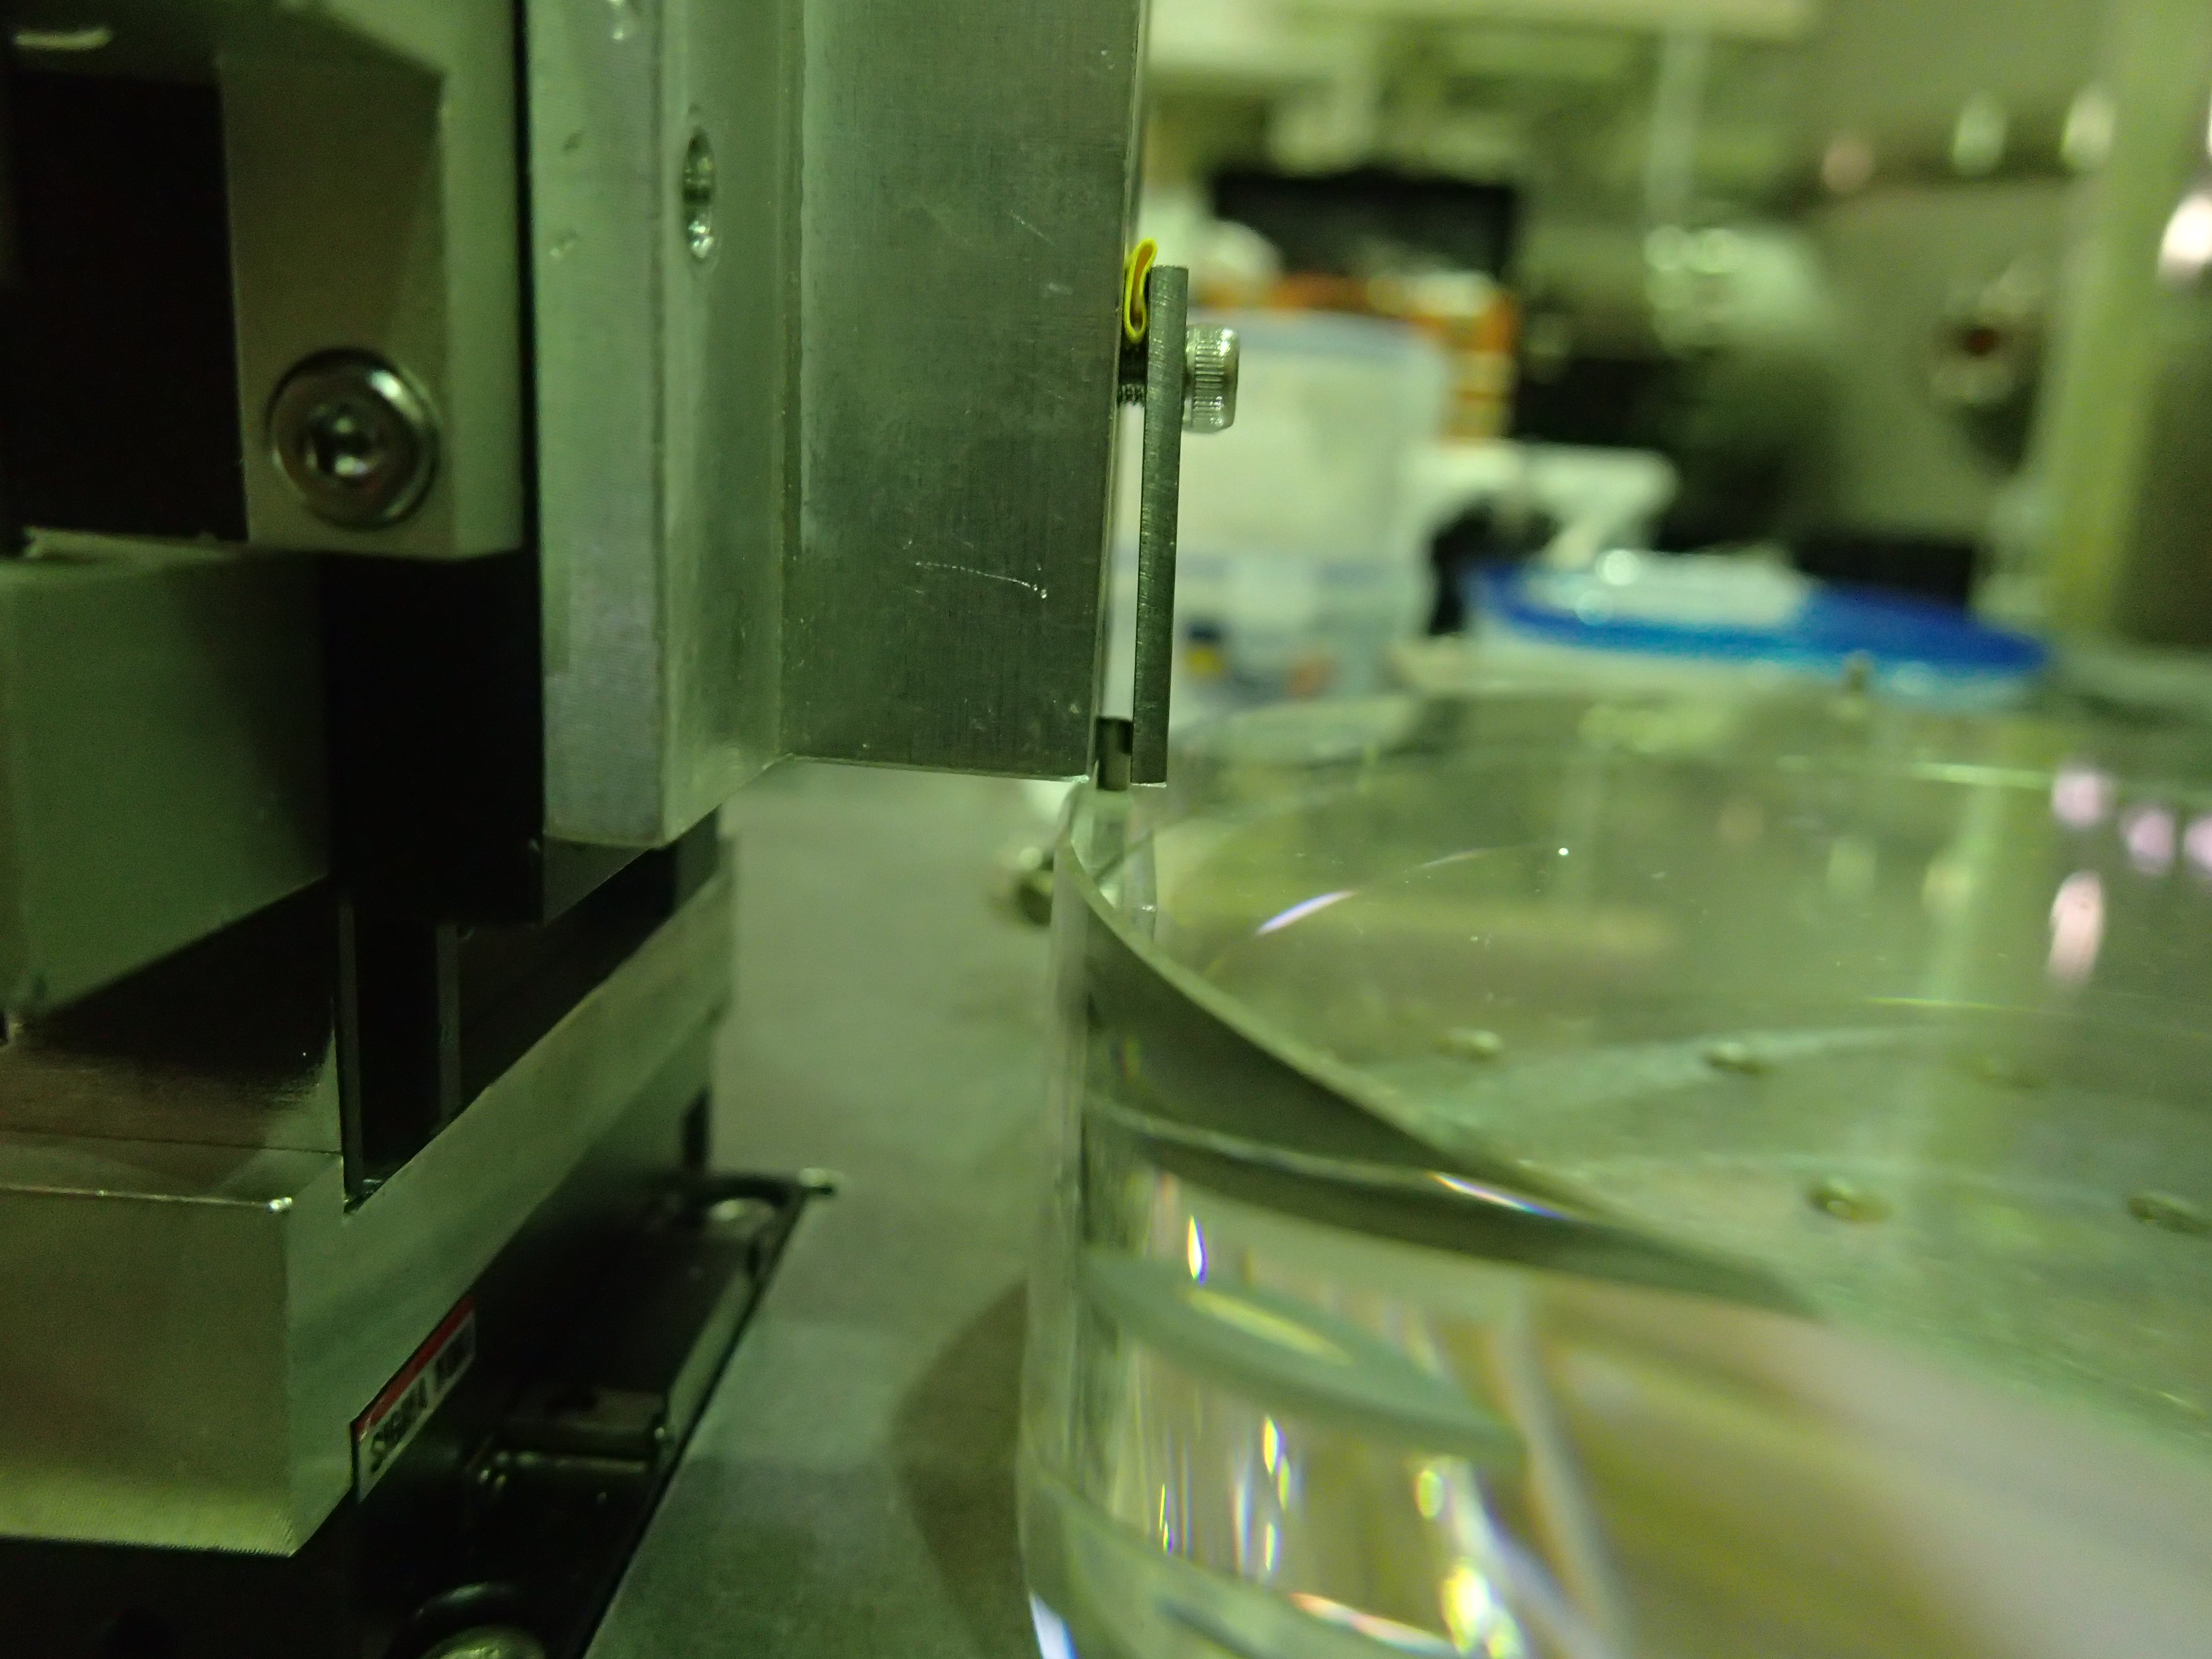
Sakai-kun found that one of the arms of the translation stage was not moving properly, the step motor was turning but the long black screw wasn't. I found that the grub screw (see the picture) was loose. I checked the other arms and found another loose screw. I guess the company that cleaned and greased it forgot to re-tighten those screws. I tightened them all. Then, by using the Zaber consol, I reset the lockstep of the couples to make them move together again.