NAOJ GW Elog Logbook 3.2

Marc and Yuhang
Marc and I were suspecting that the beam may not hit on the center of mirror. To check that, we decide to scan BS pitch/yaw and check IR transmission.
Today I did this check. I found two resonant beams while scanning BS, which can be seen from the attached video (two videos show the situation of pitch and yaw separately).
Yaw: https://drive.google.com/file/d/1ahDx6MTfYqxdoFXbyH0PbrLRPybCtIhp/view?usp=sharing
Pitch: https://drive.google.com/file/d/1N6N3BdUr3WIG_GeNLJeDQDmCbeHzdTXm/view?usp=sharing
By pointing the incident beam towards the center of mirror, these two resonant beams get closer. In the end, they still don't overlap and separate by roughly a HWHM. In the end, the pointing to the center has a precision of 2urad, considering the distance of 300m, this is 0.6mm precision.
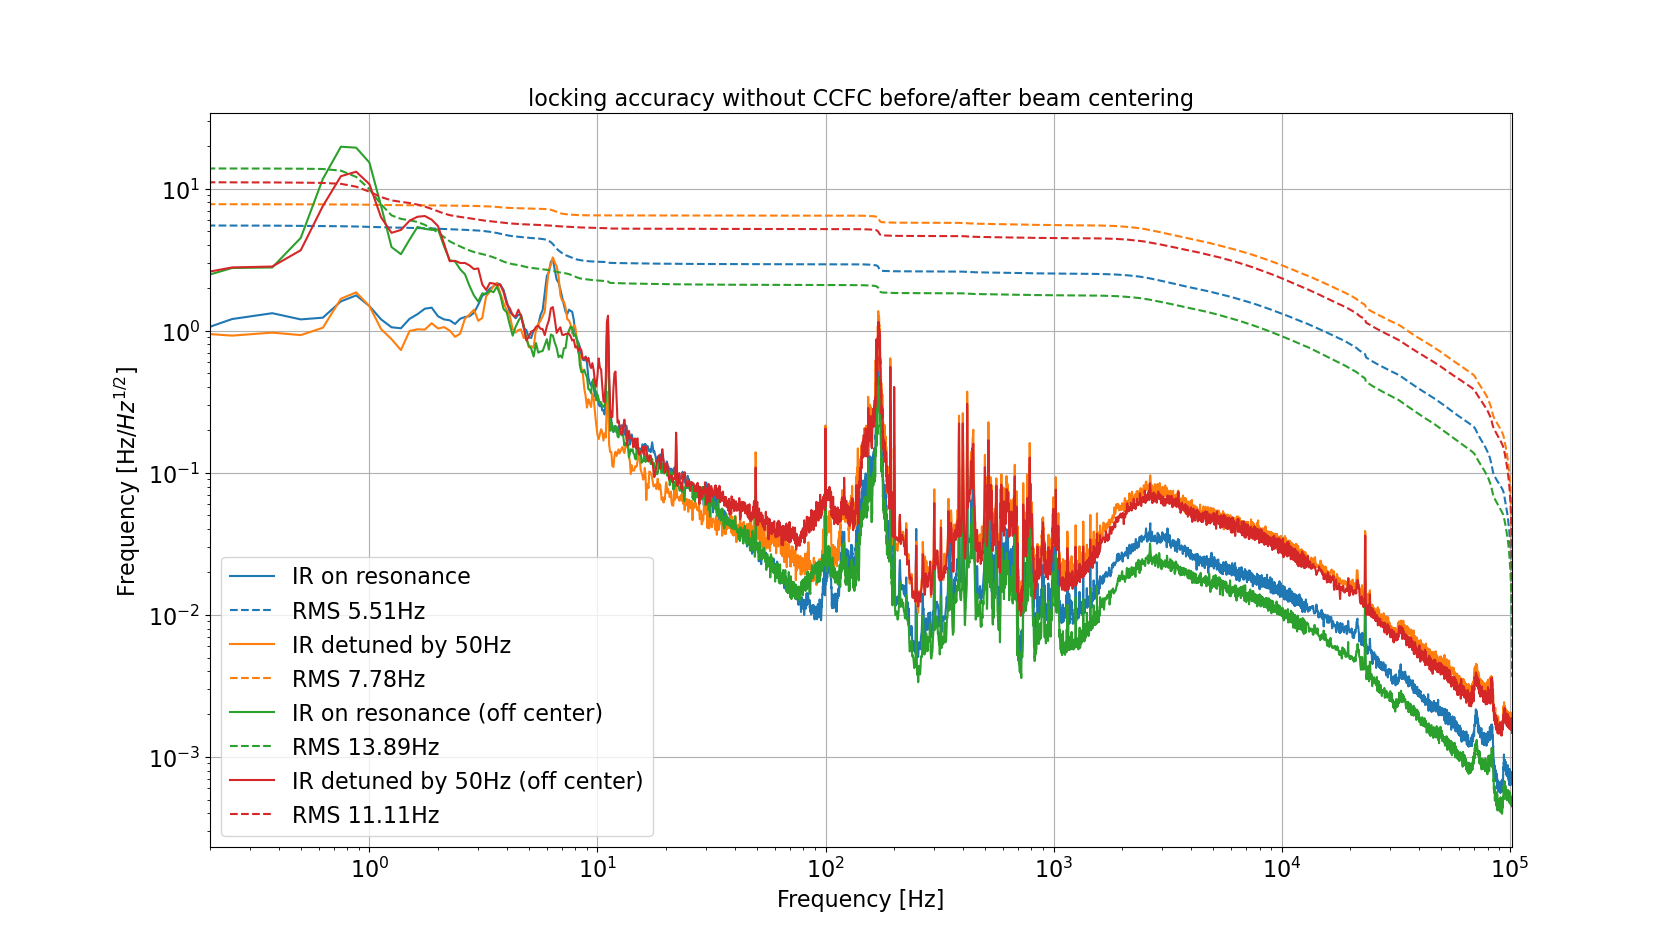
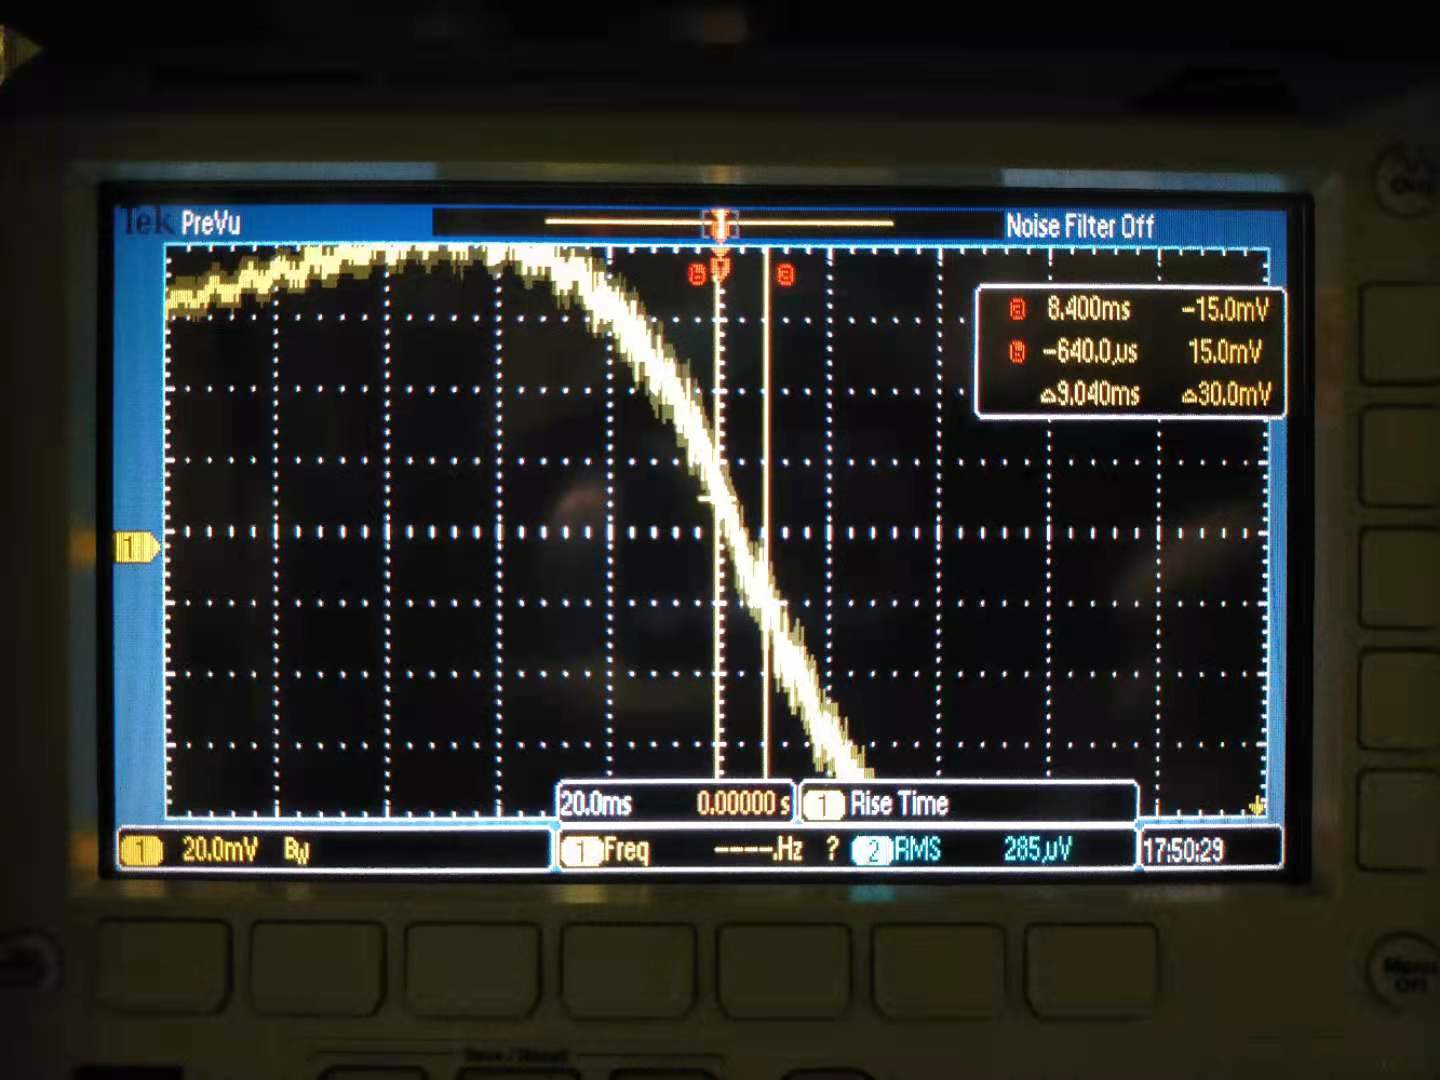
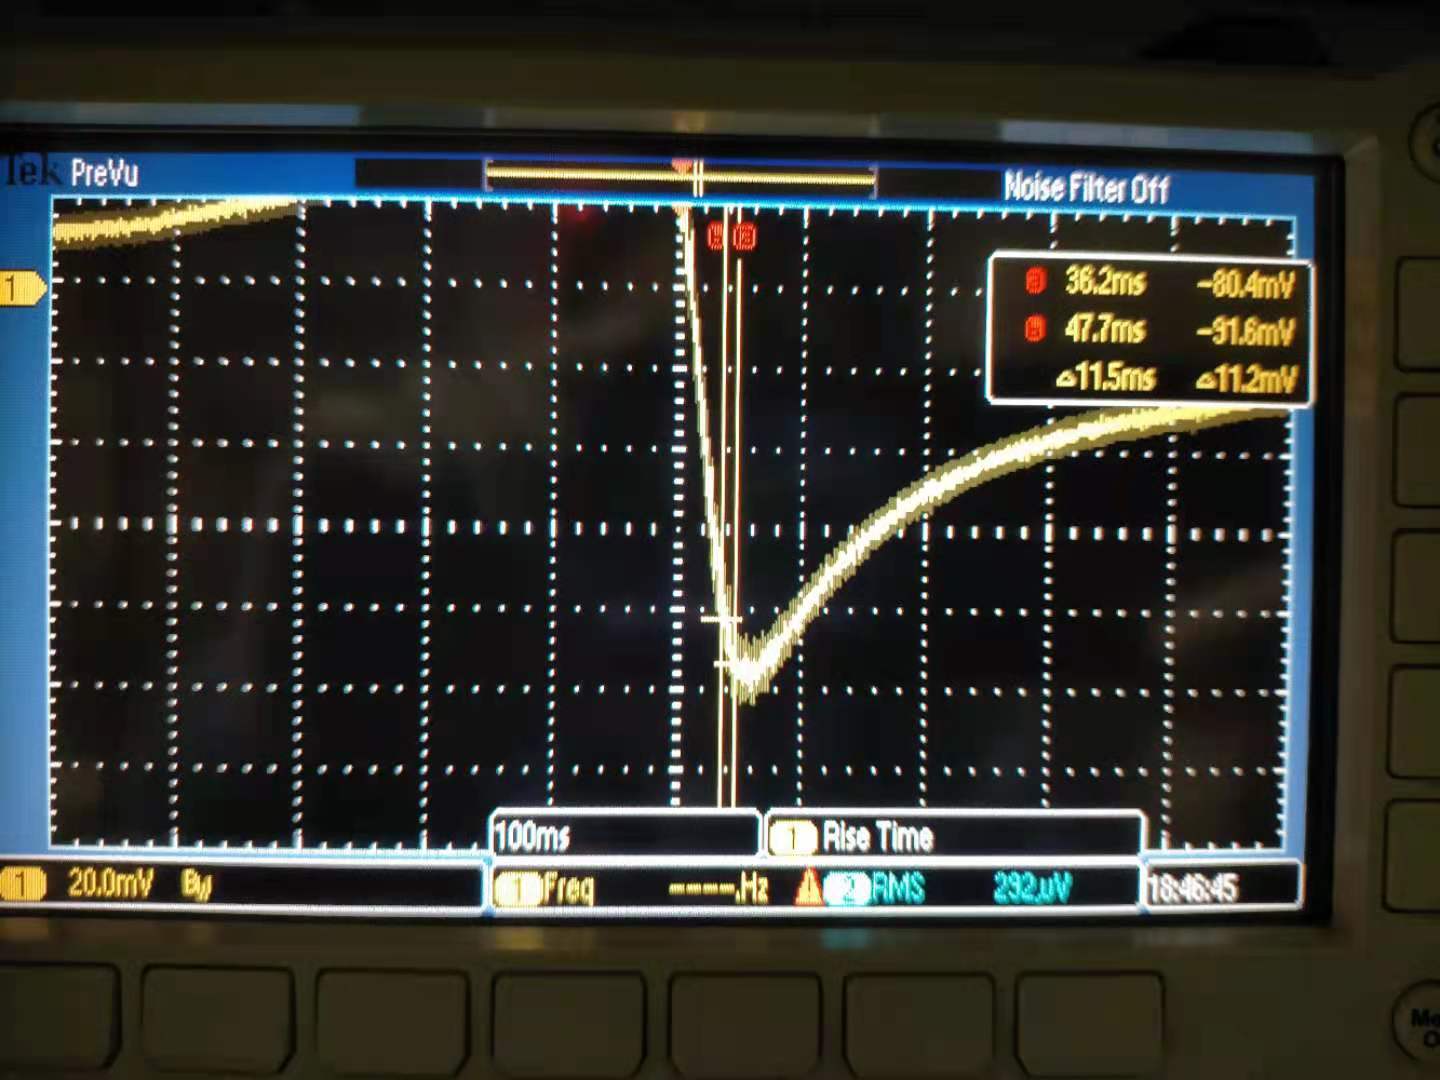
After centering the beam, I measured the IR length noise by using BAB. Attached figure 1 shows their difference. We can see that the low frequency length change is greatly reduced. Note: the calibration of IR length is done by taking the slope of PDH signal as attached figure 2, 3, 4, 5 for on resonance and detuned case, which may introduce some error. Especially, the calibration of the green line (beam off-center and on resonance) was using a PDH signal with opposite slope compared with others.
| old center for pointing | new center for pointing | |
| pitch | 24 | 4.5 |
| yaw | -8 | 16 |
The attached figure 6 shows the new location of beam now. This moves the beam by 6mm in both yaw and pitch on end mirror. We should go to end room and center beam on both camera and PSD.
In addition, the AOM frequency changed by 2415Hz, which indicates the GR and IR length difference is 2415/2e-12m = 1.2075nm. This tells us, with the residual pointing error of IR, we have 1nm GR/IR length difference after beam moves 6mm on mirror. This phenomon explains the IR detuning change issue for different alignment of GR.
I was using AOM scanning speed as 4000Hz/1.7s in the calibration. However, since the scanning speed for IR is 1/2 of the value for GR, the figure in the old elog was wrong.
Calibration for the measured spectrum should be: calibration = 2000/1.66666*11.5/11.2 #Hz/V (PDH: 11.2mV/11.5ms) (AOM: 4000Hz/1.66666s)
There was also problem for the calibration for off-center on-resonance, I modified the plot by using a more reasonable calibration. It comes from the center on-resonance. The new plot is shown in the attached figure.
We can see the new stable optical axis makes especially the low frequency length noise reduced. However, the high frequency noise is increased a bit.
The high frequency noise is same for old and new beam spots, but is increased for 50Hz detuning compared with the one on resonance. This noise difference could be explained by the cavity pole effect. The cavity pole effect for 50Hz detuning (half detune) is smaller than the one on resonance by a factor of ~sqrt(2). Please check P.50 of LIGO-T1800447 for the cavity pole effect of detuned cavity.
This entry summarizes the (too many) measurements performed last Thursday and Friday...
I started by checking the bulk reference sample as it was the last calibration measurement performed ( see entry 2510).
First, I had to change the HWP that controls the ir laser power from 118 degrees to 119 degrees in order to get the usual Pin~28 mW.
Then, I found out that the calibration was lower than expected at 0.5 cm/W.
This, together with the (small) laser power change seems to indicate that the beam parameters changed during a 2 weeks window.
My guess is that, the temperature/humidity increase of last week affected the laser beam parameters (effects of temperature inside TAMA central building can be found in entry 2493 where PR pitch motion seems to follow trends similar to temperature change troughout the day).
I replaced the bulk reference sample by the surface reference sample and started several measurements...
To summarize :
I checked the IU optimal position : 68 mm is still good.
I checked the sample Z position : after several tests, I found out that a good position for the surface reference sample is at Z = 39.5 mm
This corresponds indeed to have the surface of this sample at the ir beam waist and crossing with the red beam (details in entry 2446)
With the good sample Z position, I still could not achieve 'optimal' calibration factor.
I checked again the IU position and confirmed than IU at 68 mm is optimal.
I found out that having this sample Y center (ie Y = 121.2 mm) at the beam crossing was giving :
y = 121.2
AC_surfref = 0.4075;
DC_surfref = 3.966;
acdc = 0.1026;
P_in = 27.6e-3;
R_surf = 16.8972
while moving the Y position to 120.2 mm gives
AC_surfref = 0.411;
DC_surfref = 3.96;
acdc = 0.1038;
P_in = 27.6e-3;
R_surf = 17.0949
I will need to check if this sample has some dust in the center...
Finally, I moved on the spare viewport measurement :
I placed it on the TAMA holder using 2 spacers to fix it.
The good Z position to have the surface at the 2 beams crossing point is z = 38 + 60/2 = 68 mm
The good IU Z position is 68 - 3.4 = 64.6 mm (here I assumed 1 cm thickness of the viewport).
Unfortunately, at that point I moved by mistake the last lens on the IR path... So I performed again the surface calibration as :
AC_surfref = 0.4125;
DC_surfref = 3.974;
acdc = 0.1038;
P_in = 27.7e-3;
abs_surfref = 0.22;
R_surf = 17.0331 (screenshot saved at 20h35)
I re-installed the spare viewport and tried to measure its absorption.
28 mW did not show any signal.
428 mW (ie HWP at 89 degrees) did not show anything as well...
As this power is around the maximal that can be produced with the laser diode current of 1 A and because any current change requires ~1h to stabilize the laser power, I stopped the measurement at that point.
Anyway, this tells us that the absorption is quite low...
Good measurement! Now it is obvious that the OPO threshold is lower than before as I said.
Retry of the OPO nonlinear gain measurement in 2528, motivated by the idea that the uncertainty in the detuning fit (i.e. 2544, 2546, 2550) may be caused by uncertainty in the fit parameters (see 2544, 2549).
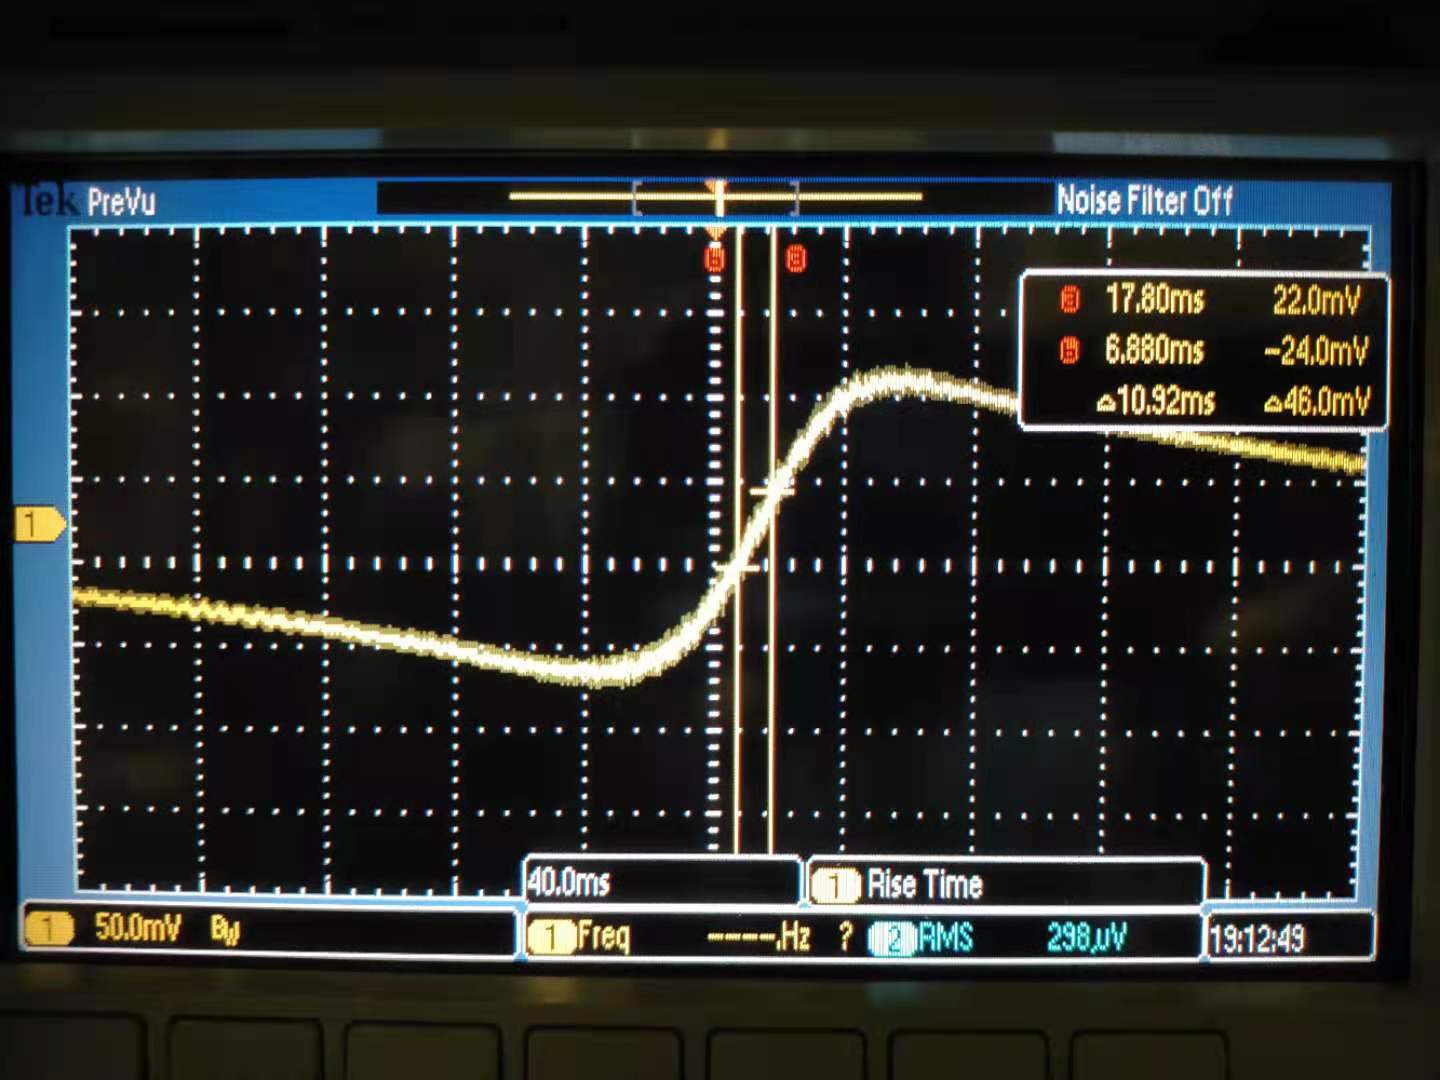
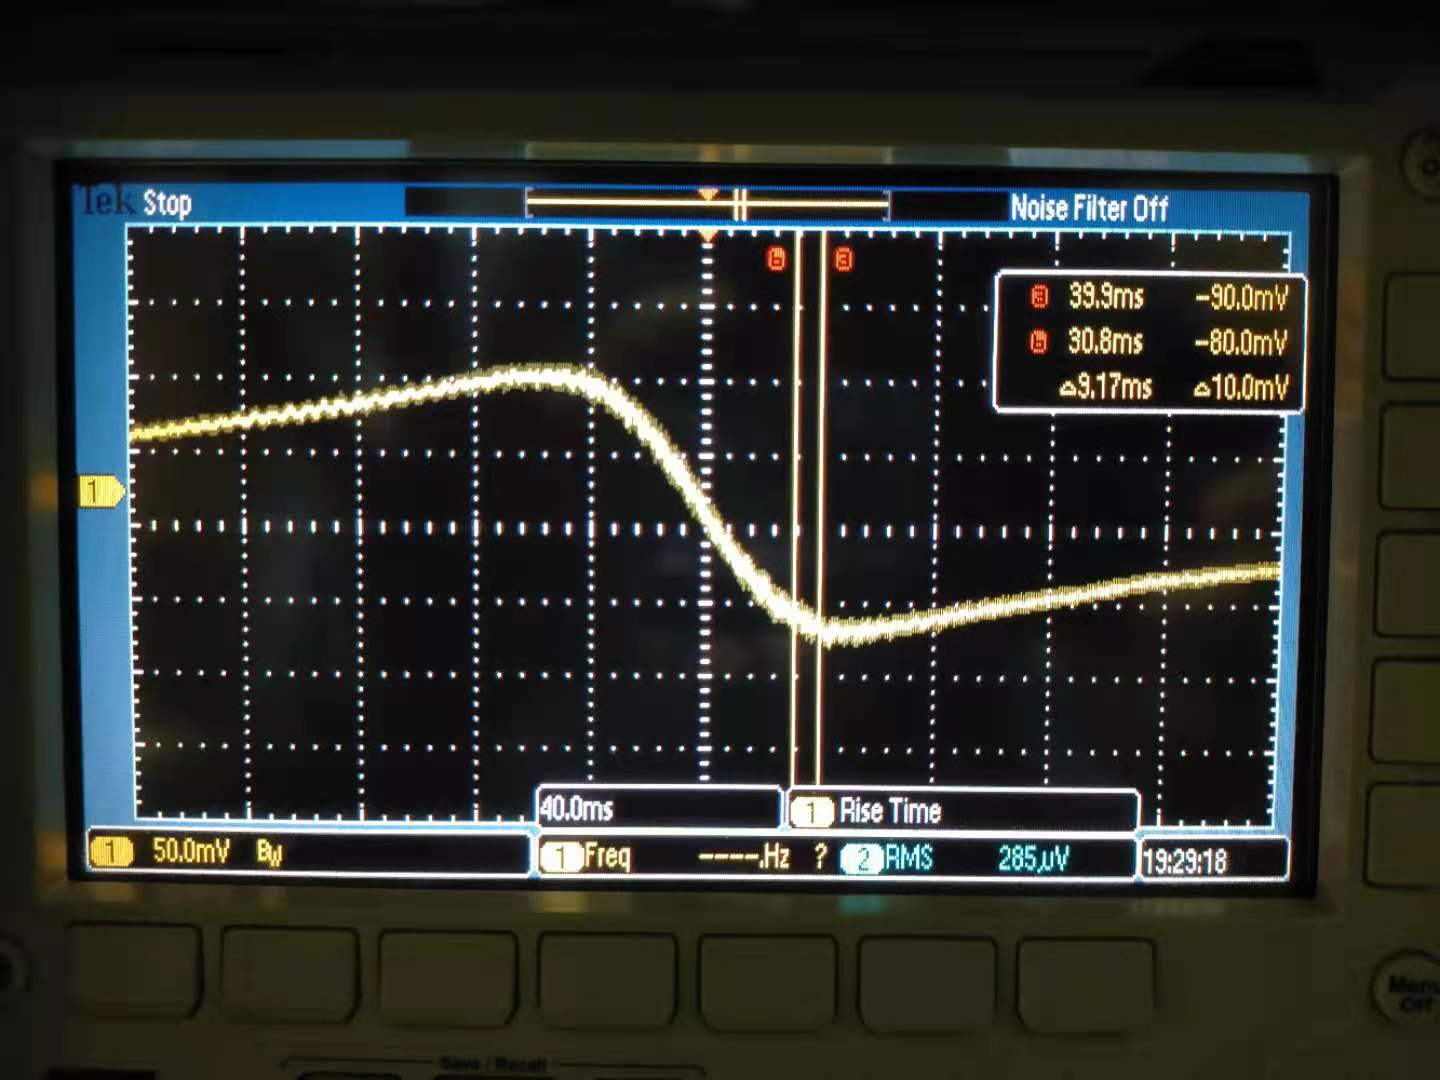
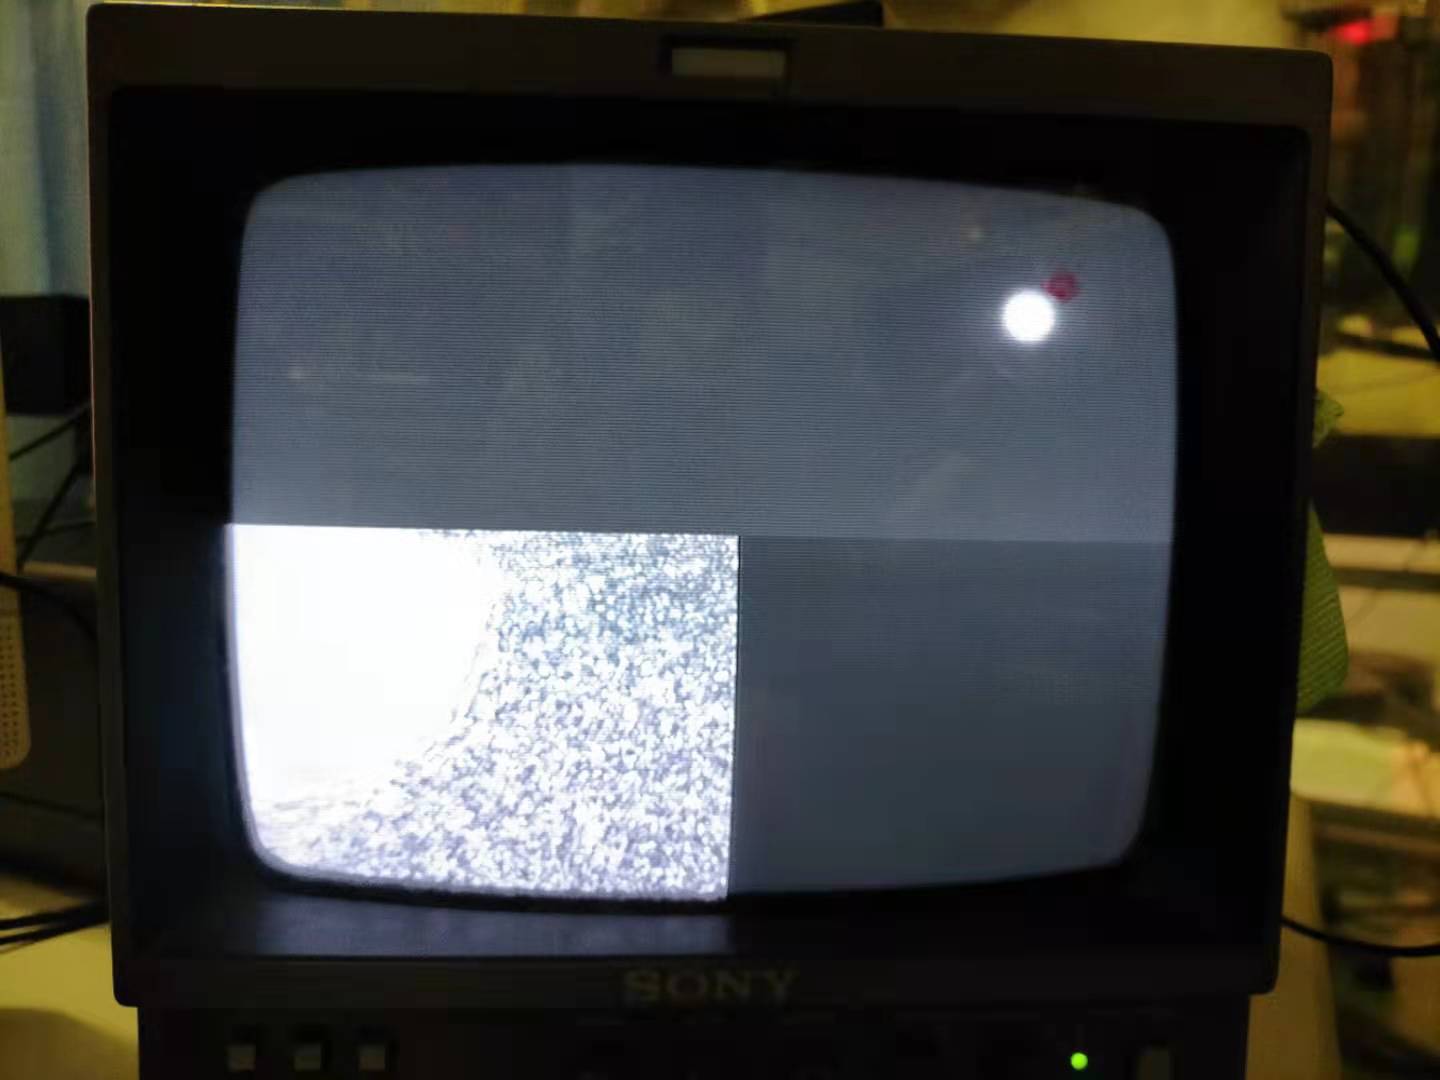
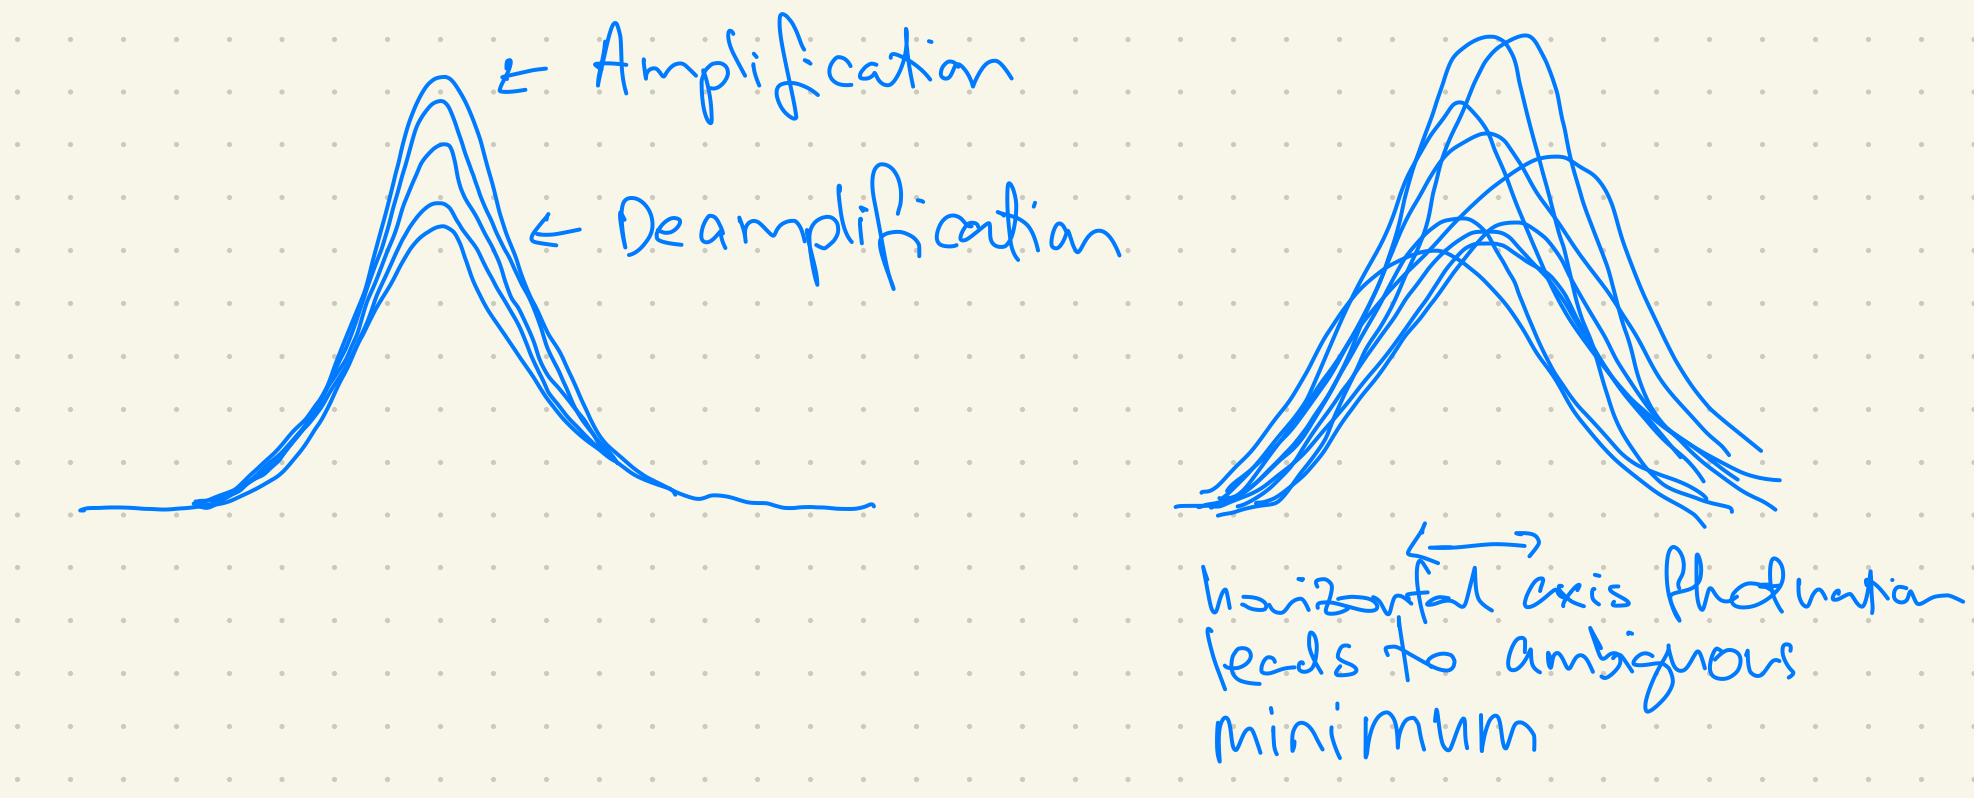
The previous measurement of OPO nonlinear gain was too imprecise in a way that user error had a lot of impact. In the previous process, we left the OPO unlocked while sending a sine wave to GRPS to modulate between amplification and deamplification. We then used the oscilloscope persist function and triggered the resonant peak to appear on the screen. The way this was intended to work is shown in figure 1, however, it seemed like the peak was fluctuating in the horizontal axis too much due to the cavity unlock, and obtaining the minimum value was quite imprecise. On top of that, the OPO temperature was not optimised for different green injection power to compensate for absorption. This of course causes an error in the co-resonance of p-pol/BAB and green.
This time I measured again with the OPO locked, and optimised the temperature and PLL frequency for each value of green injection power. With the cavity locked, the output transmission is just a sine wave due to GRPS modulation, going between amplification and deamplification. While there is less uncertainty in just reading off the values now, there is of course some user uncertainty in optimising the temperature and PLL frequency, especially because being too careful about it is very time consuming. Juding by the optimisation process, I would say that the temperature is easily optimised to about +/- 0.01 kOhm on the thermistor, with differences in this range amounting to about +/- 2-8 mV on the amplification reading on the oscilloscope, for values between 100-1000 mV.
The values were measured using a power meter in transmission of the OPO. There are a lot of green junk beams coming out of the OPO as well, so they were removed with a laser line filter to leave only the BAB transmission. I measured a calibration factor of 0.00451 mW/mV for the correspondance between power meter readout and oscilloscope voltage, but in retrospect this is unnecessary, since only the relative power matters, and the oscilloscope voltage is linear with power meter incident optical power. Aritomi also has a more accurate calibration in 2566.
Figure 2 shows the OPO nonlinear gain with simple curve fitting. I will further consider the error of the input parameters in a future update.
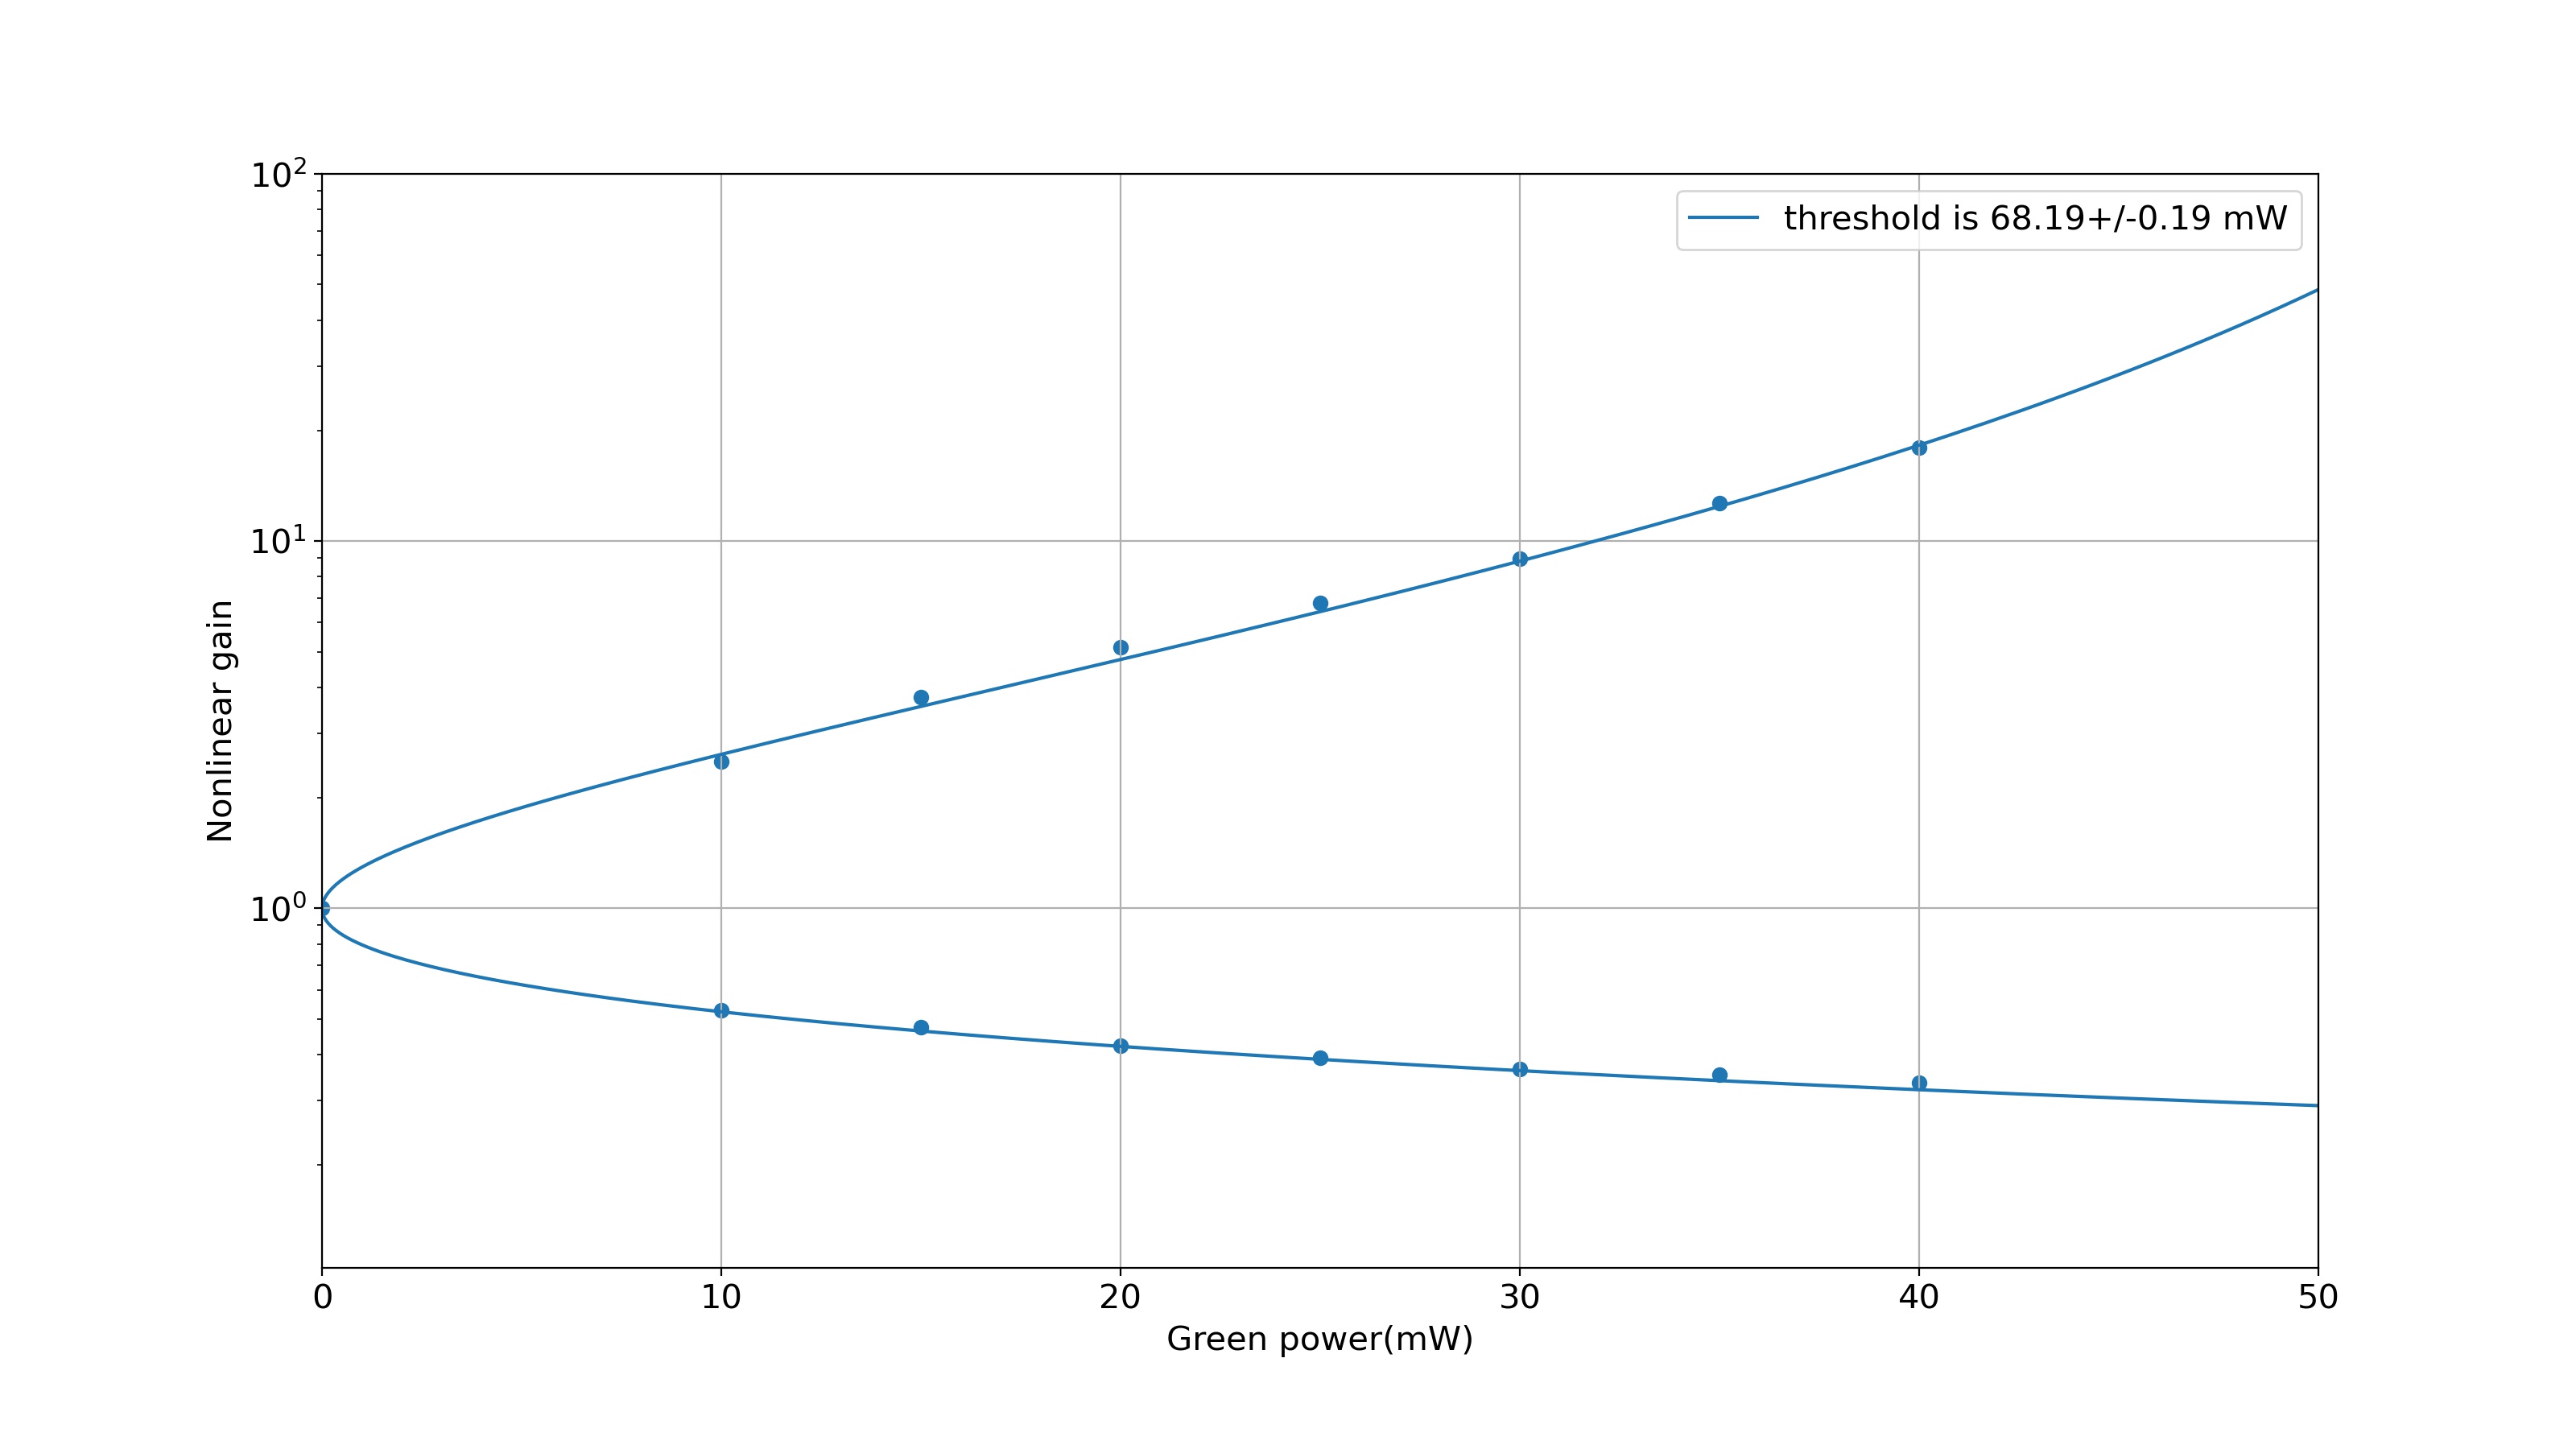
Good measurement! Now it is obvious that the OPO threshold is lower than before as I said.
I recorded the thermistor (temperature) values that I used for the OPO nonlinear gain measurement.
Initially I searched in increments of +/- 0.01 kOhm on the thermistor, and then checked a bit within the optimal range. Perhaps there is further room for optimisation when zooming in on the oscilloscope though. At 100 mV/div ranges on the oscilloscope, the difference in voltage for thermistor change under 0.01 kOhm was hard to distinguish.
In the table I give the temperature, oscilloscope reading as well as the range value on the power meter - using a range of 1.6 mW on the power meter gives 10x more voltage on the oscilloscope than a range of 16 mW.
| green power [mW] | 0 | 10 | 15 | 20 | 25 | 30 | 35 | 40 | 50 | 60 |
| MZ offset | 3.9 | 4.0 | 4.1 | 4.2 | 4.3 | 4.4 | 4.5 | 4.7 | 4.9 | |
|
Amplification reading [mV] (power meter range [mW]) |
456 (1.6) | 1140 (1.6) | 1710 (1.6) | 234 (16) | 308 (16) | 408 (16) | 578 (16) | 816 (16) | ||
| De-amplification reading [mV] (power meter range [mW]) | 456 (1.6) | 240 (1.6) | 216 (1.6) | 192 (1.6) | 178 (1.6) | 166 (1.6) | 160 (1.6) | 152 (1.6) | ||
| Thermistor value [kOhm] | 7.137 | 7.147 | 7.165 | 7.173 | 7.185 | 7.196 | 7.203 | 7.215 | 7.215 | 7.225 |
| p pol PLL frequency [MHz] | 190 | 180 | 195 | 190 | 200 | 205 | 200 | 205 | 185 | 185 |
| Nonlinear gain | 1 | 2.5 | 3.8 | 5.1 | 6.8 | 8.9 | 12.7 | 17.9 |
I analyzed again with correct shot noise level (-133.7dBVrms/rtHz) and 12% loss from visibility. The readout loss includes 12% loss from visibility, 2% loss from homodyne (dark noise, quantum efficiency, AR), and 20% loss from pick off BS.
sqz_dB = 11.8; % produced SQZ (dB)
L_rt = 120e-6; % FC losses
L_inj = 0.32; % Injection losses
L_ro = 0.31; % Readout losses
A0 = 0.05; % Squeezer/filter cavity mode mismatch
C0 = 0.06; % Squeezer/local oscillator mode mismatch
ERR_L = 1e-12; % Lock accuracy (m)
ERR_csi = 30e-3; % Phase noise (rad)
[Aritomi, Michael]
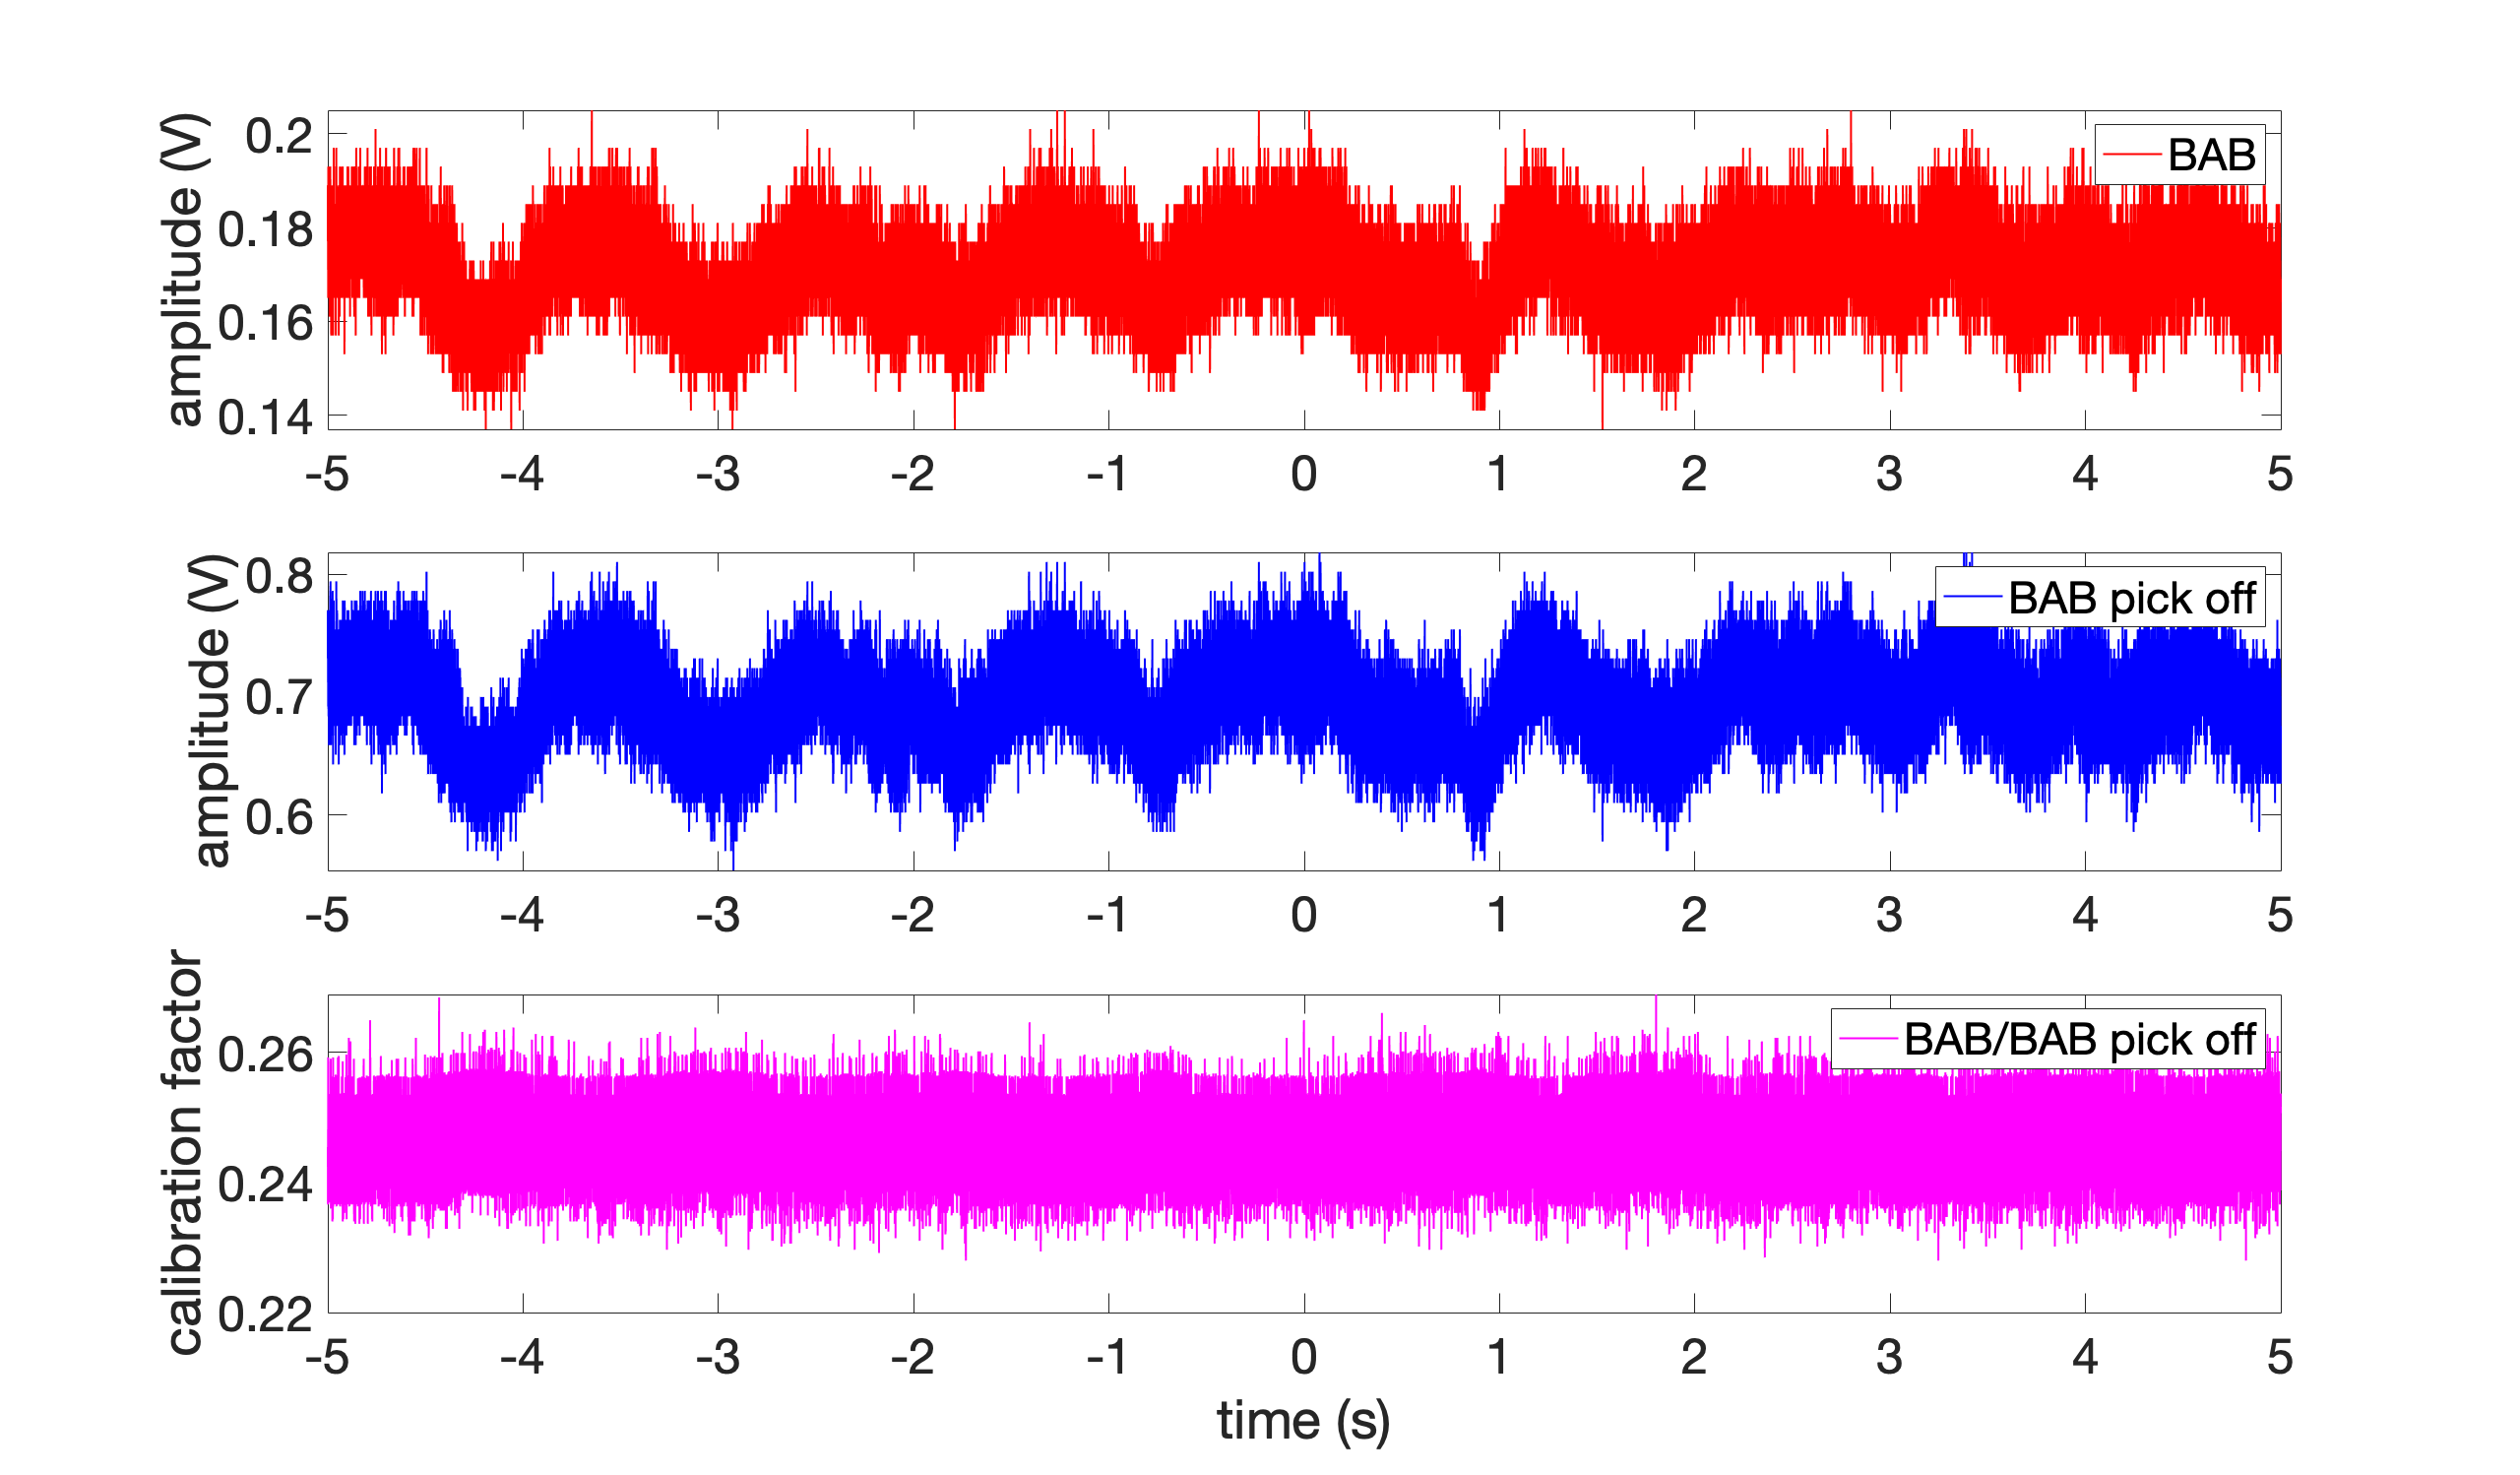
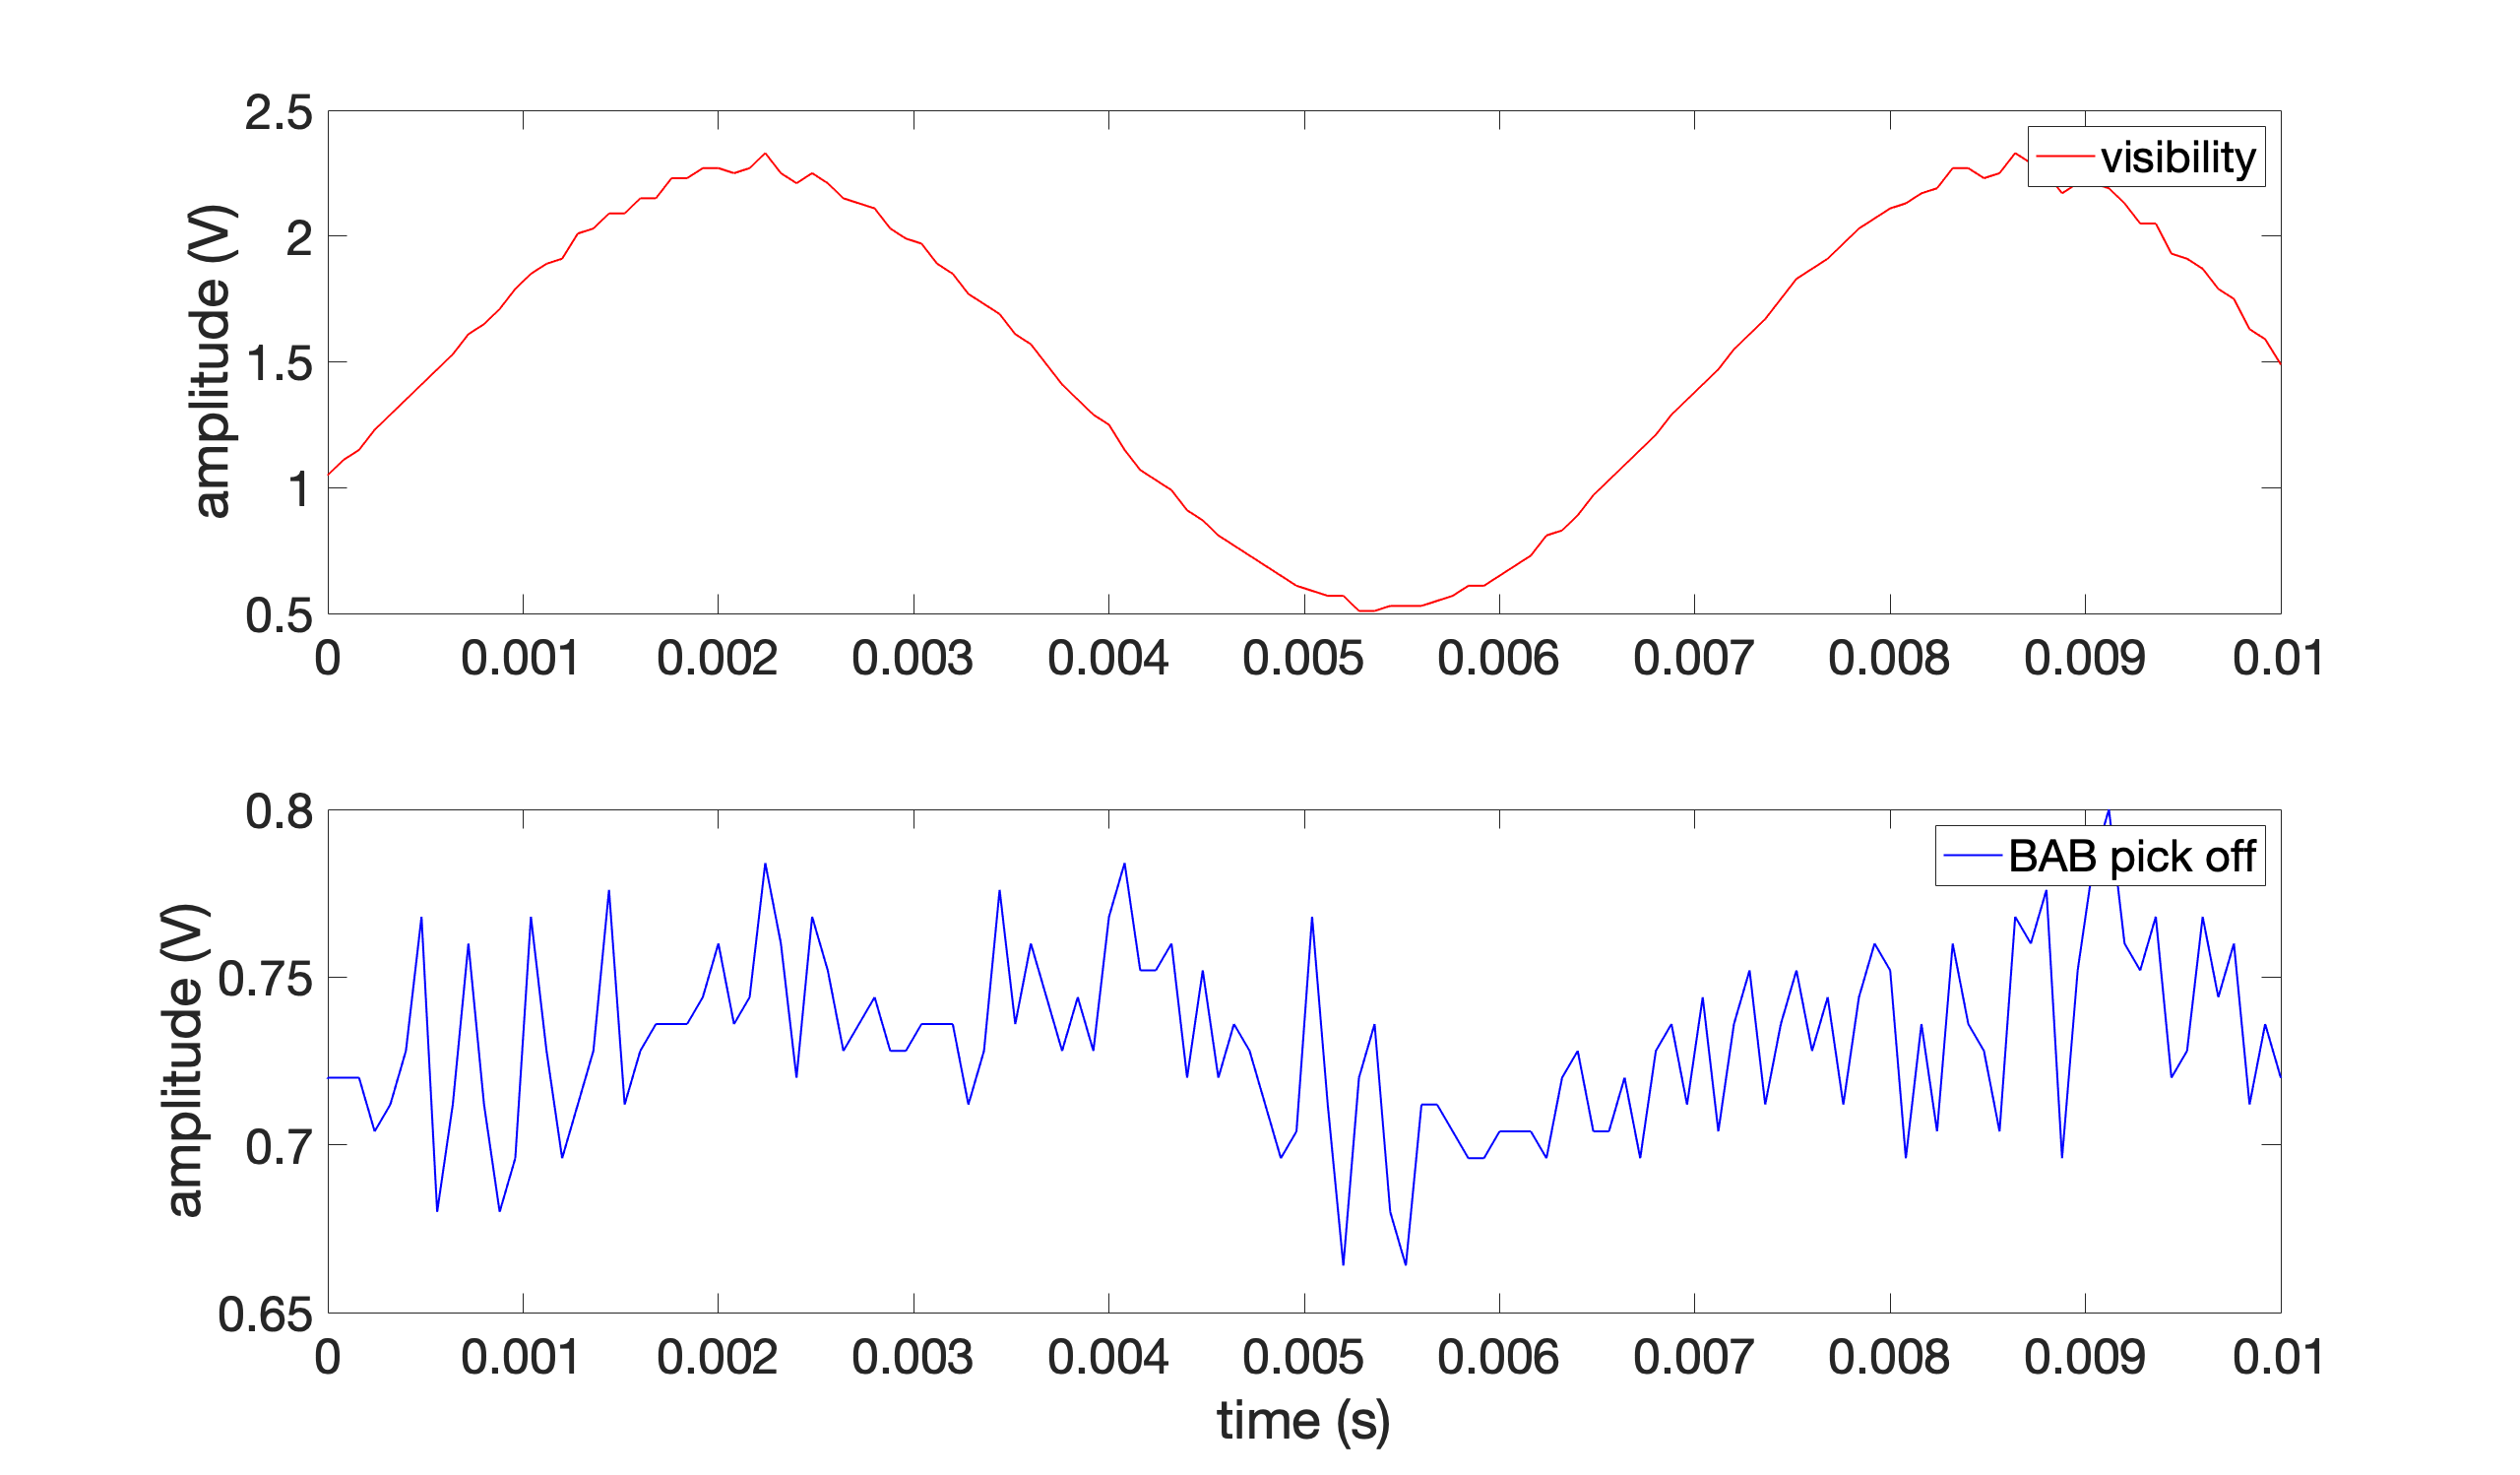
We measured the visibility between LO and BAB reflected from FC for 10s. The BAB was half detuned.
To know the BAB power during the measurement, we also measured the BAB pick off power in CCFC port. Fig 1 shows the BAB power before AMC and the BAB pick off power. From this measurement, we can know the calibration factor from the BAB pick off power to the BAB power before AMC (bottom plot in Fig 1). The calibration factor is 0.246. The LO power was 1.16V. The offset of visibility was 9mV and the offset of pick off was 5.8mV. Note that the offset subtraction is important for visibility calculation.
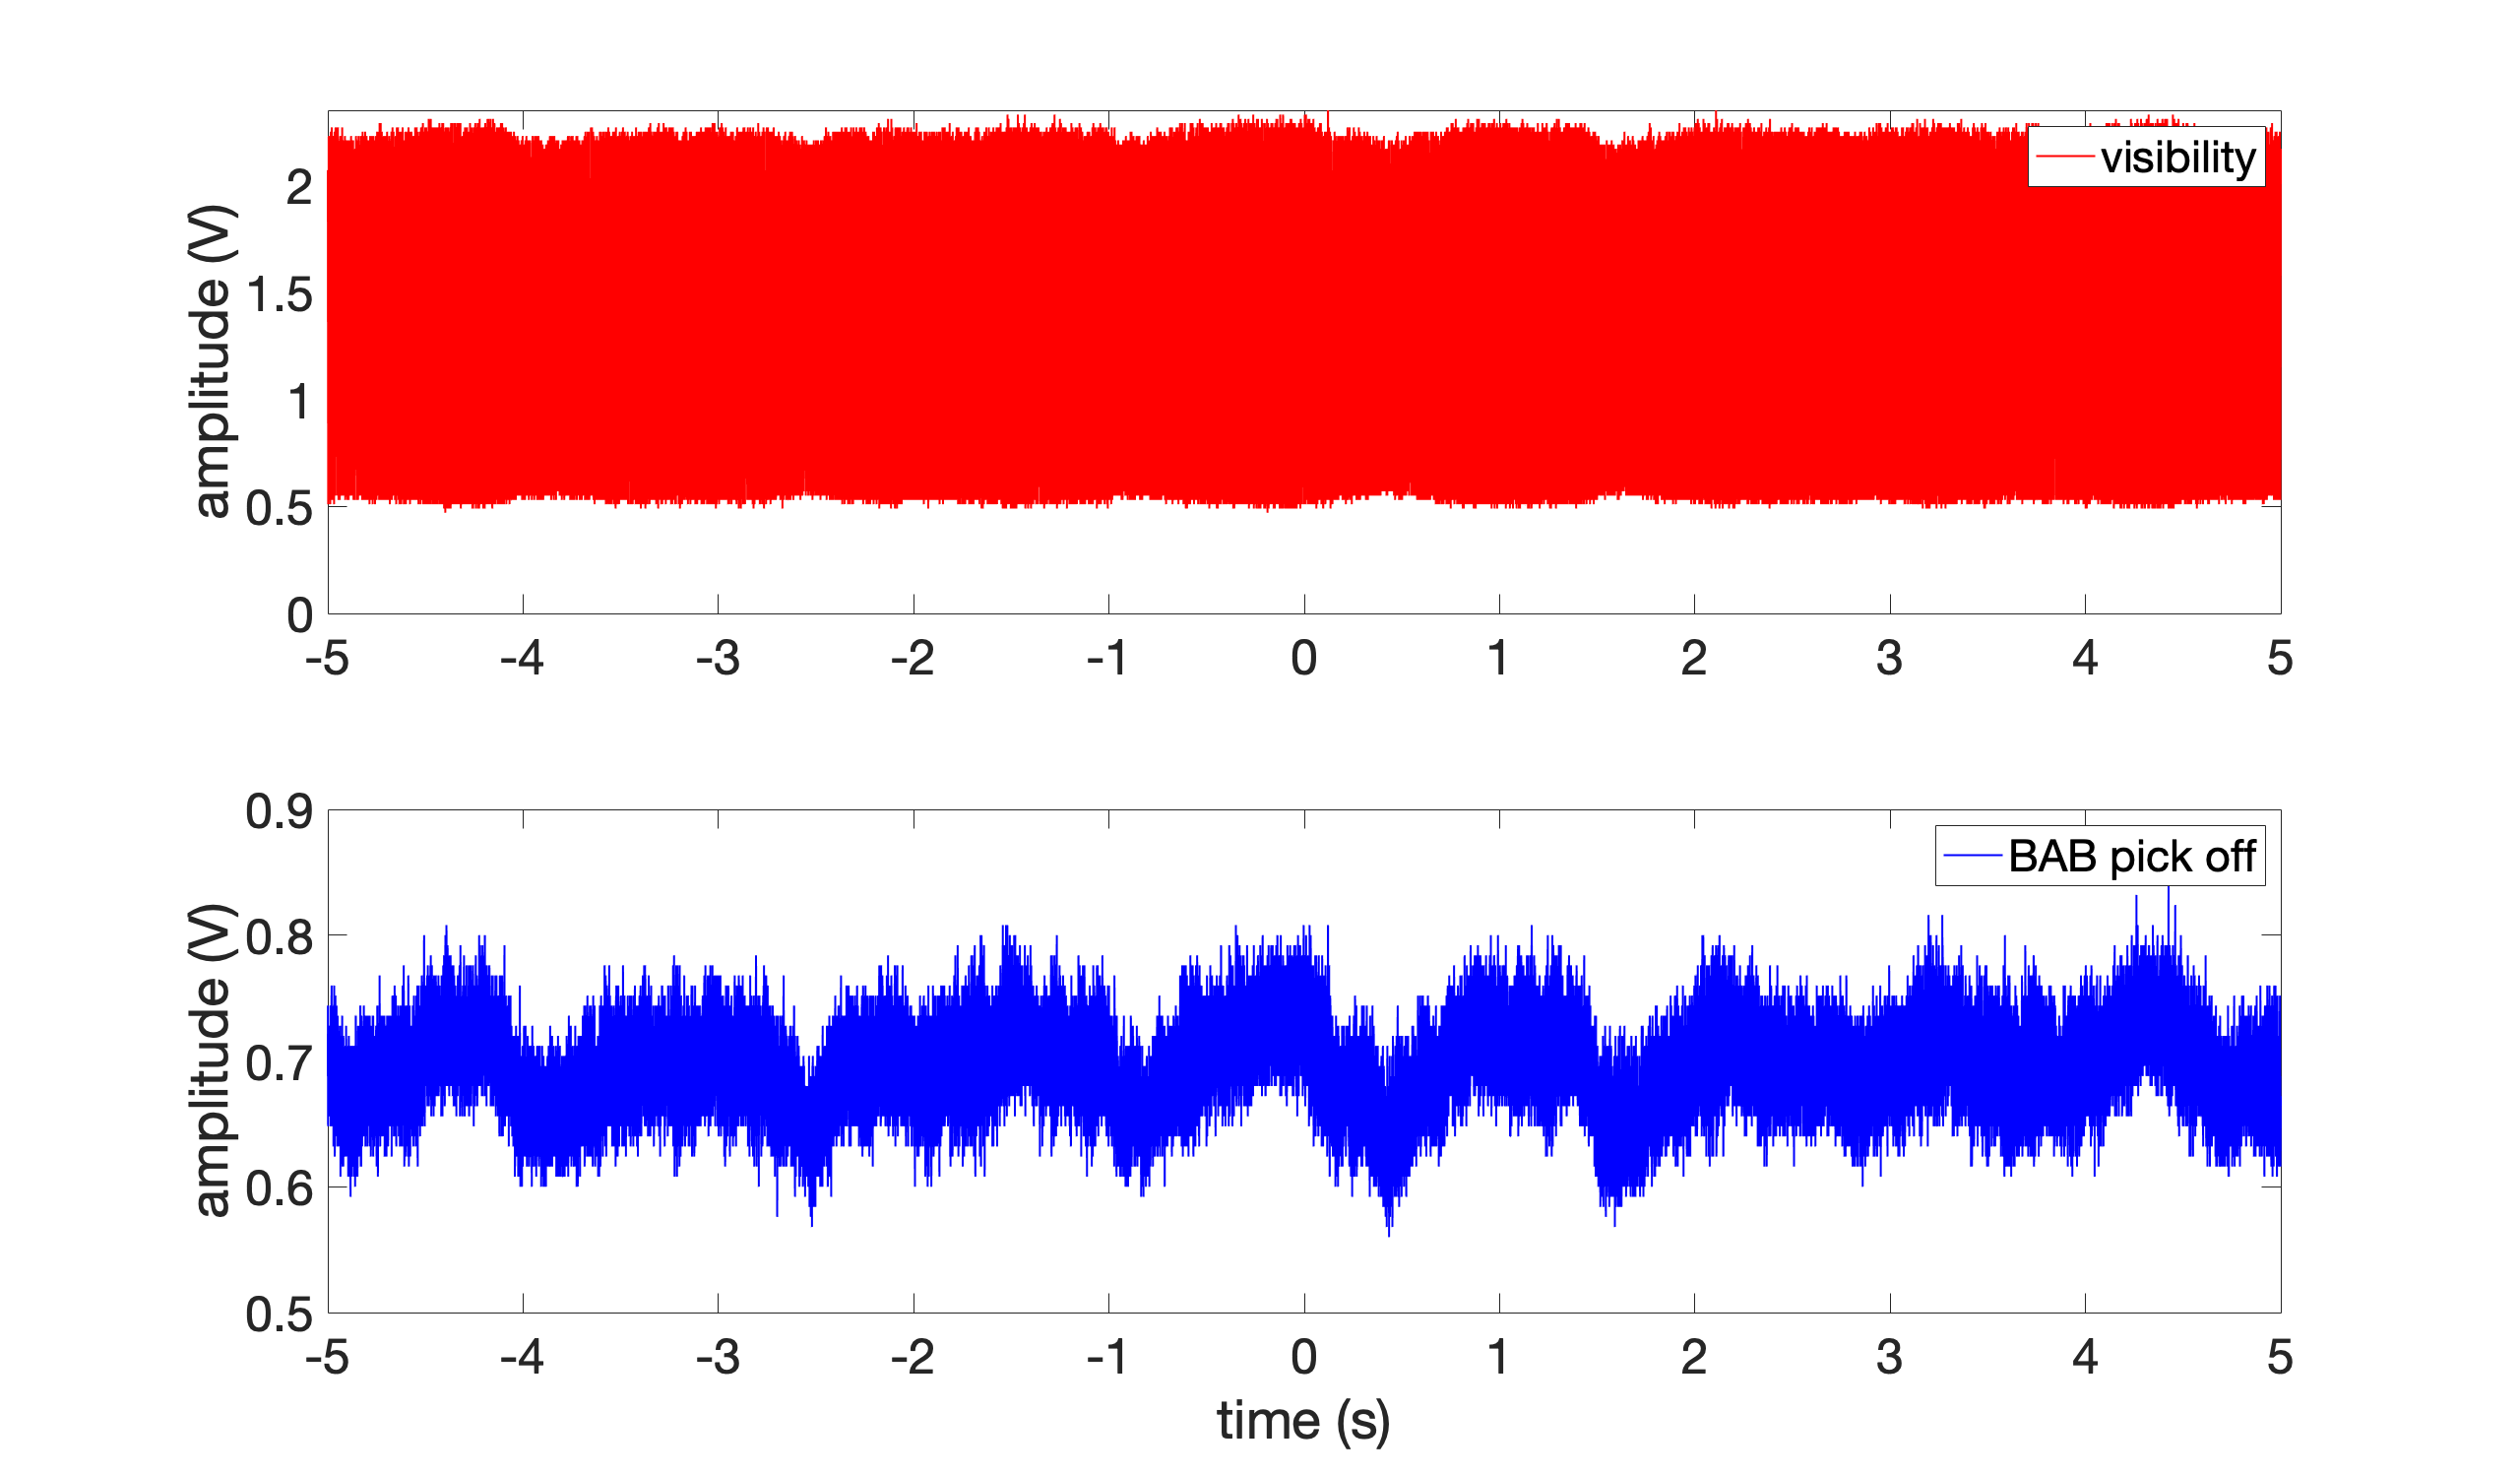
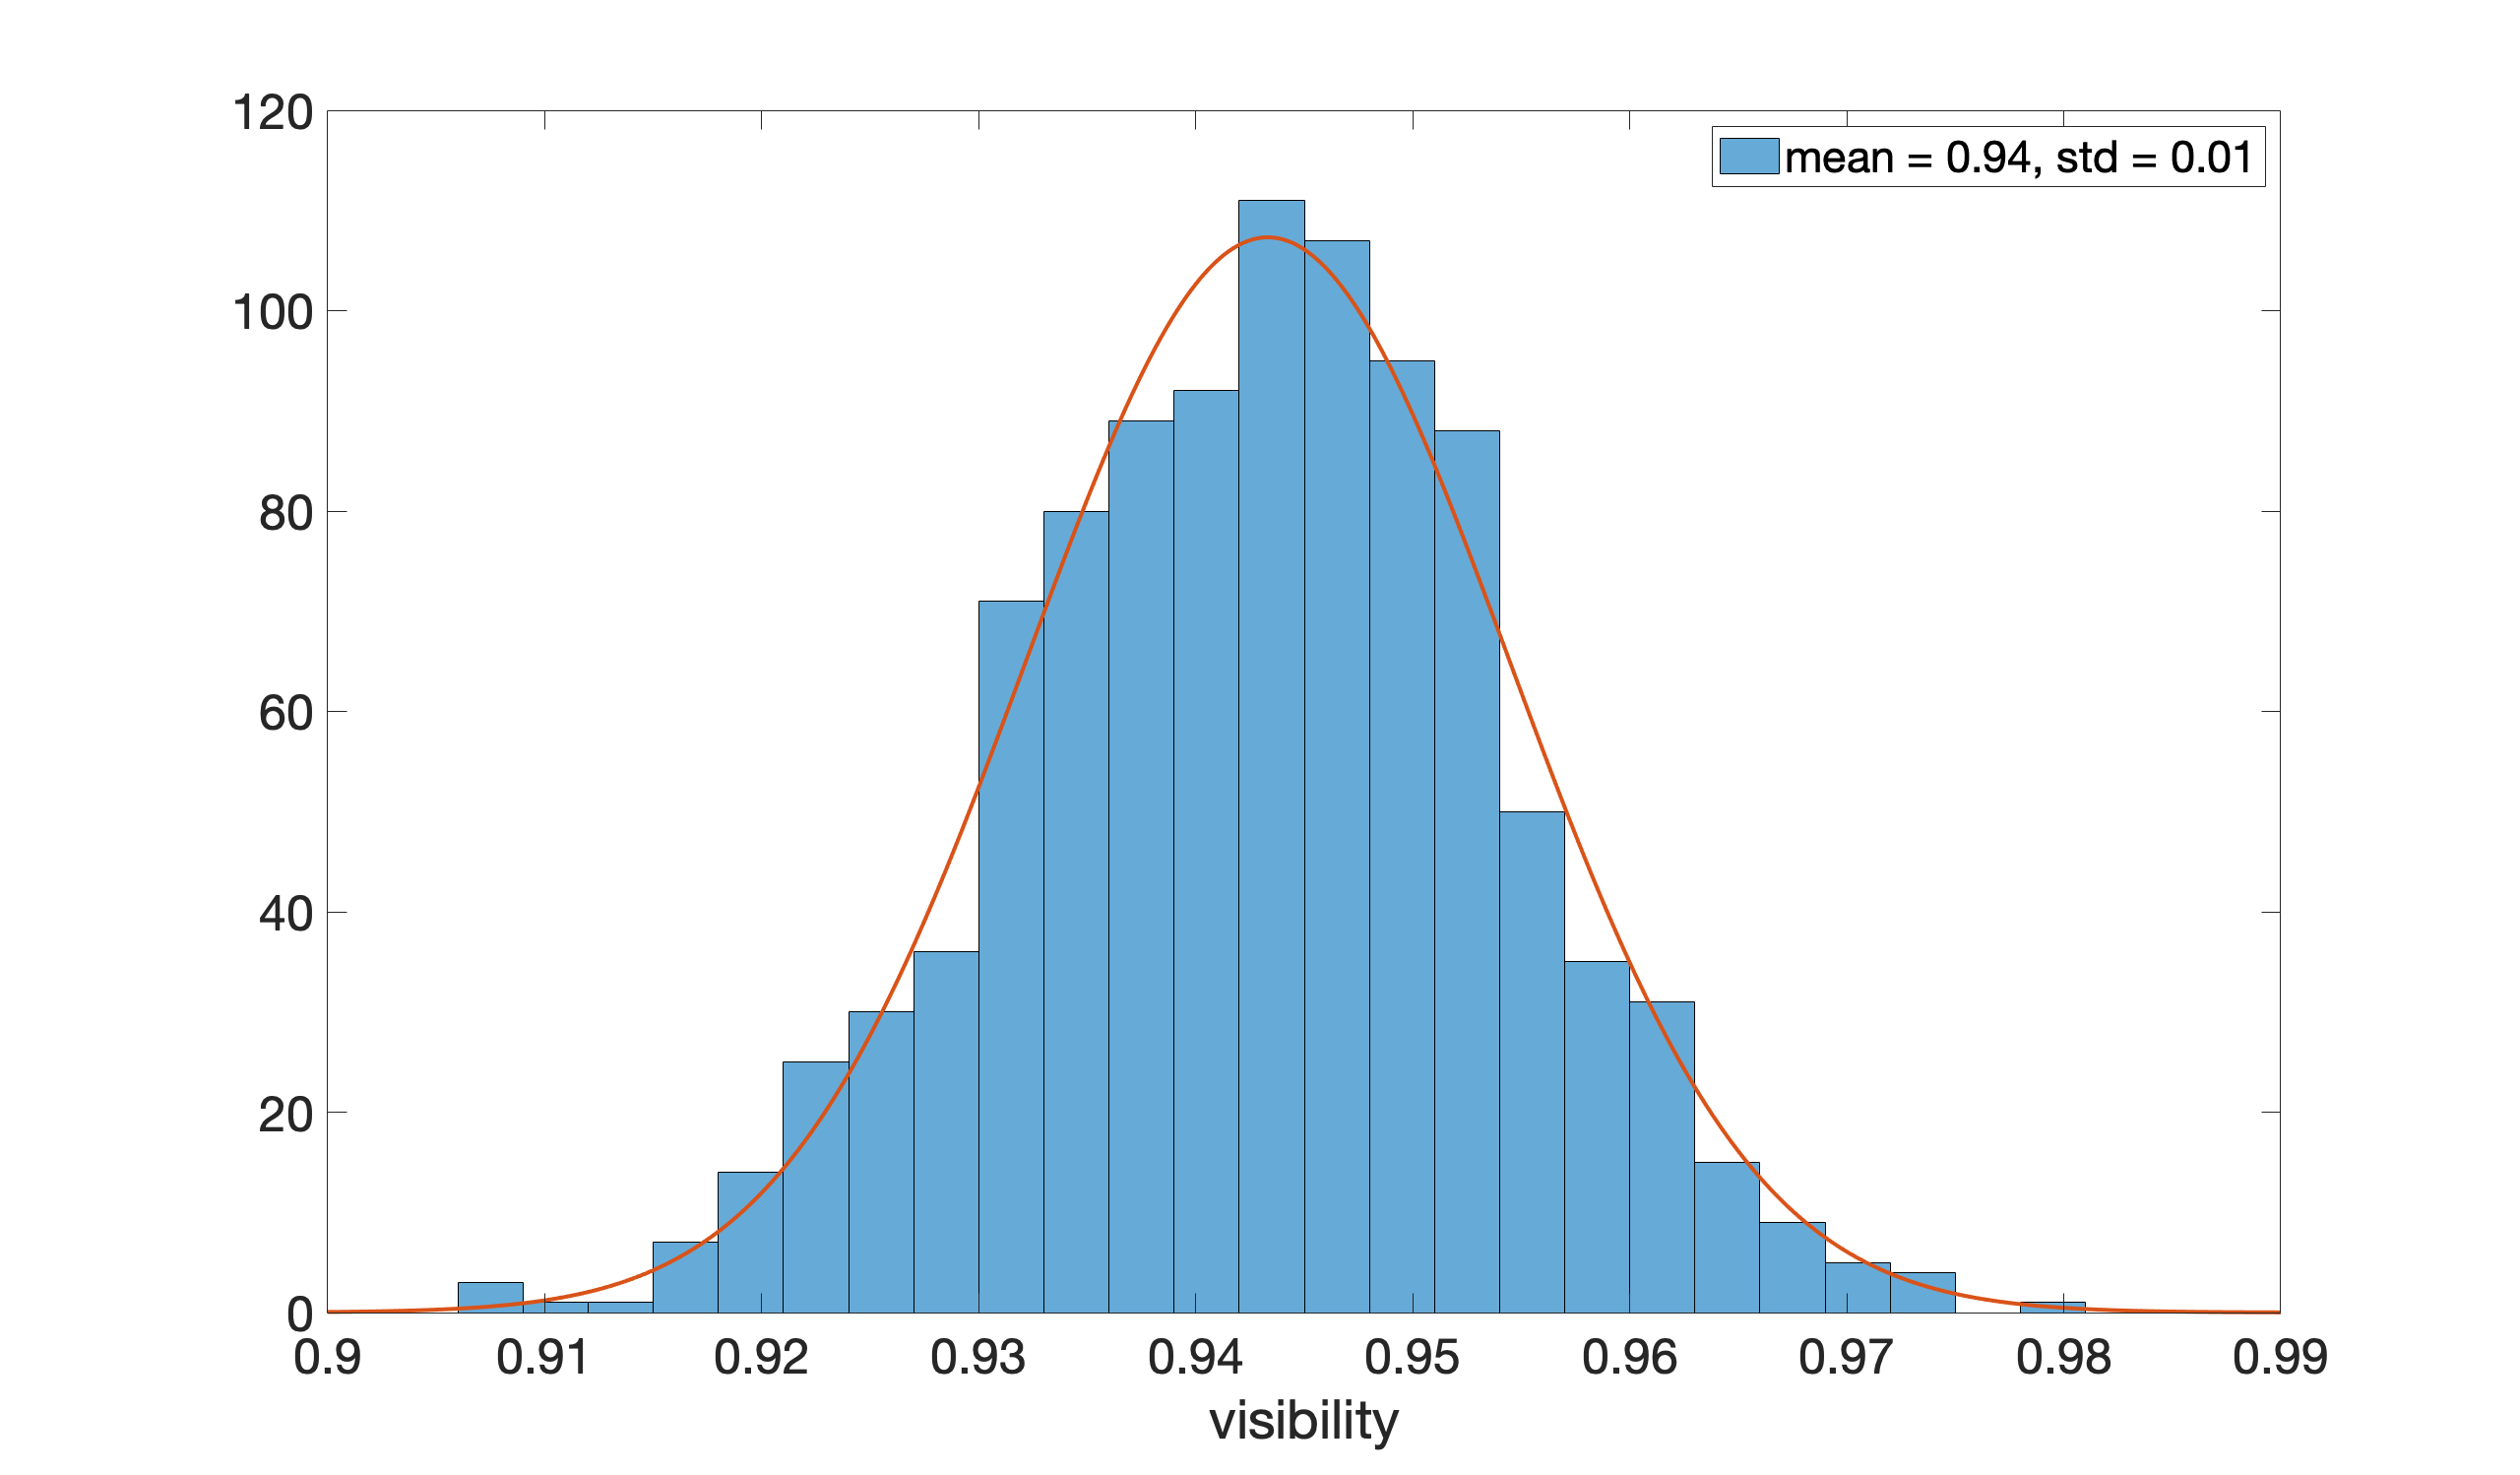
The measured visibility and BAB pick off are shown in Fig 2. The 10Hz modulation was applied to IR phase shifter. As you can see, both of visibility and BAB pick off are fluctuating. To calculate the visibility, we divided this data into 1000 segments with 0.01s step (Fig 3) and calculated the visibility in each segment (Fig 4). From the histogram, the visibility is 0.94(1) which corresponds to optical loss of 12(2)%.
In FDS measurement in PRL paper, we assumed that the visibility is 0.98 which corresponds to optical loss of 4%. It seems that the visibility got worse and we have 8% more loss than before...
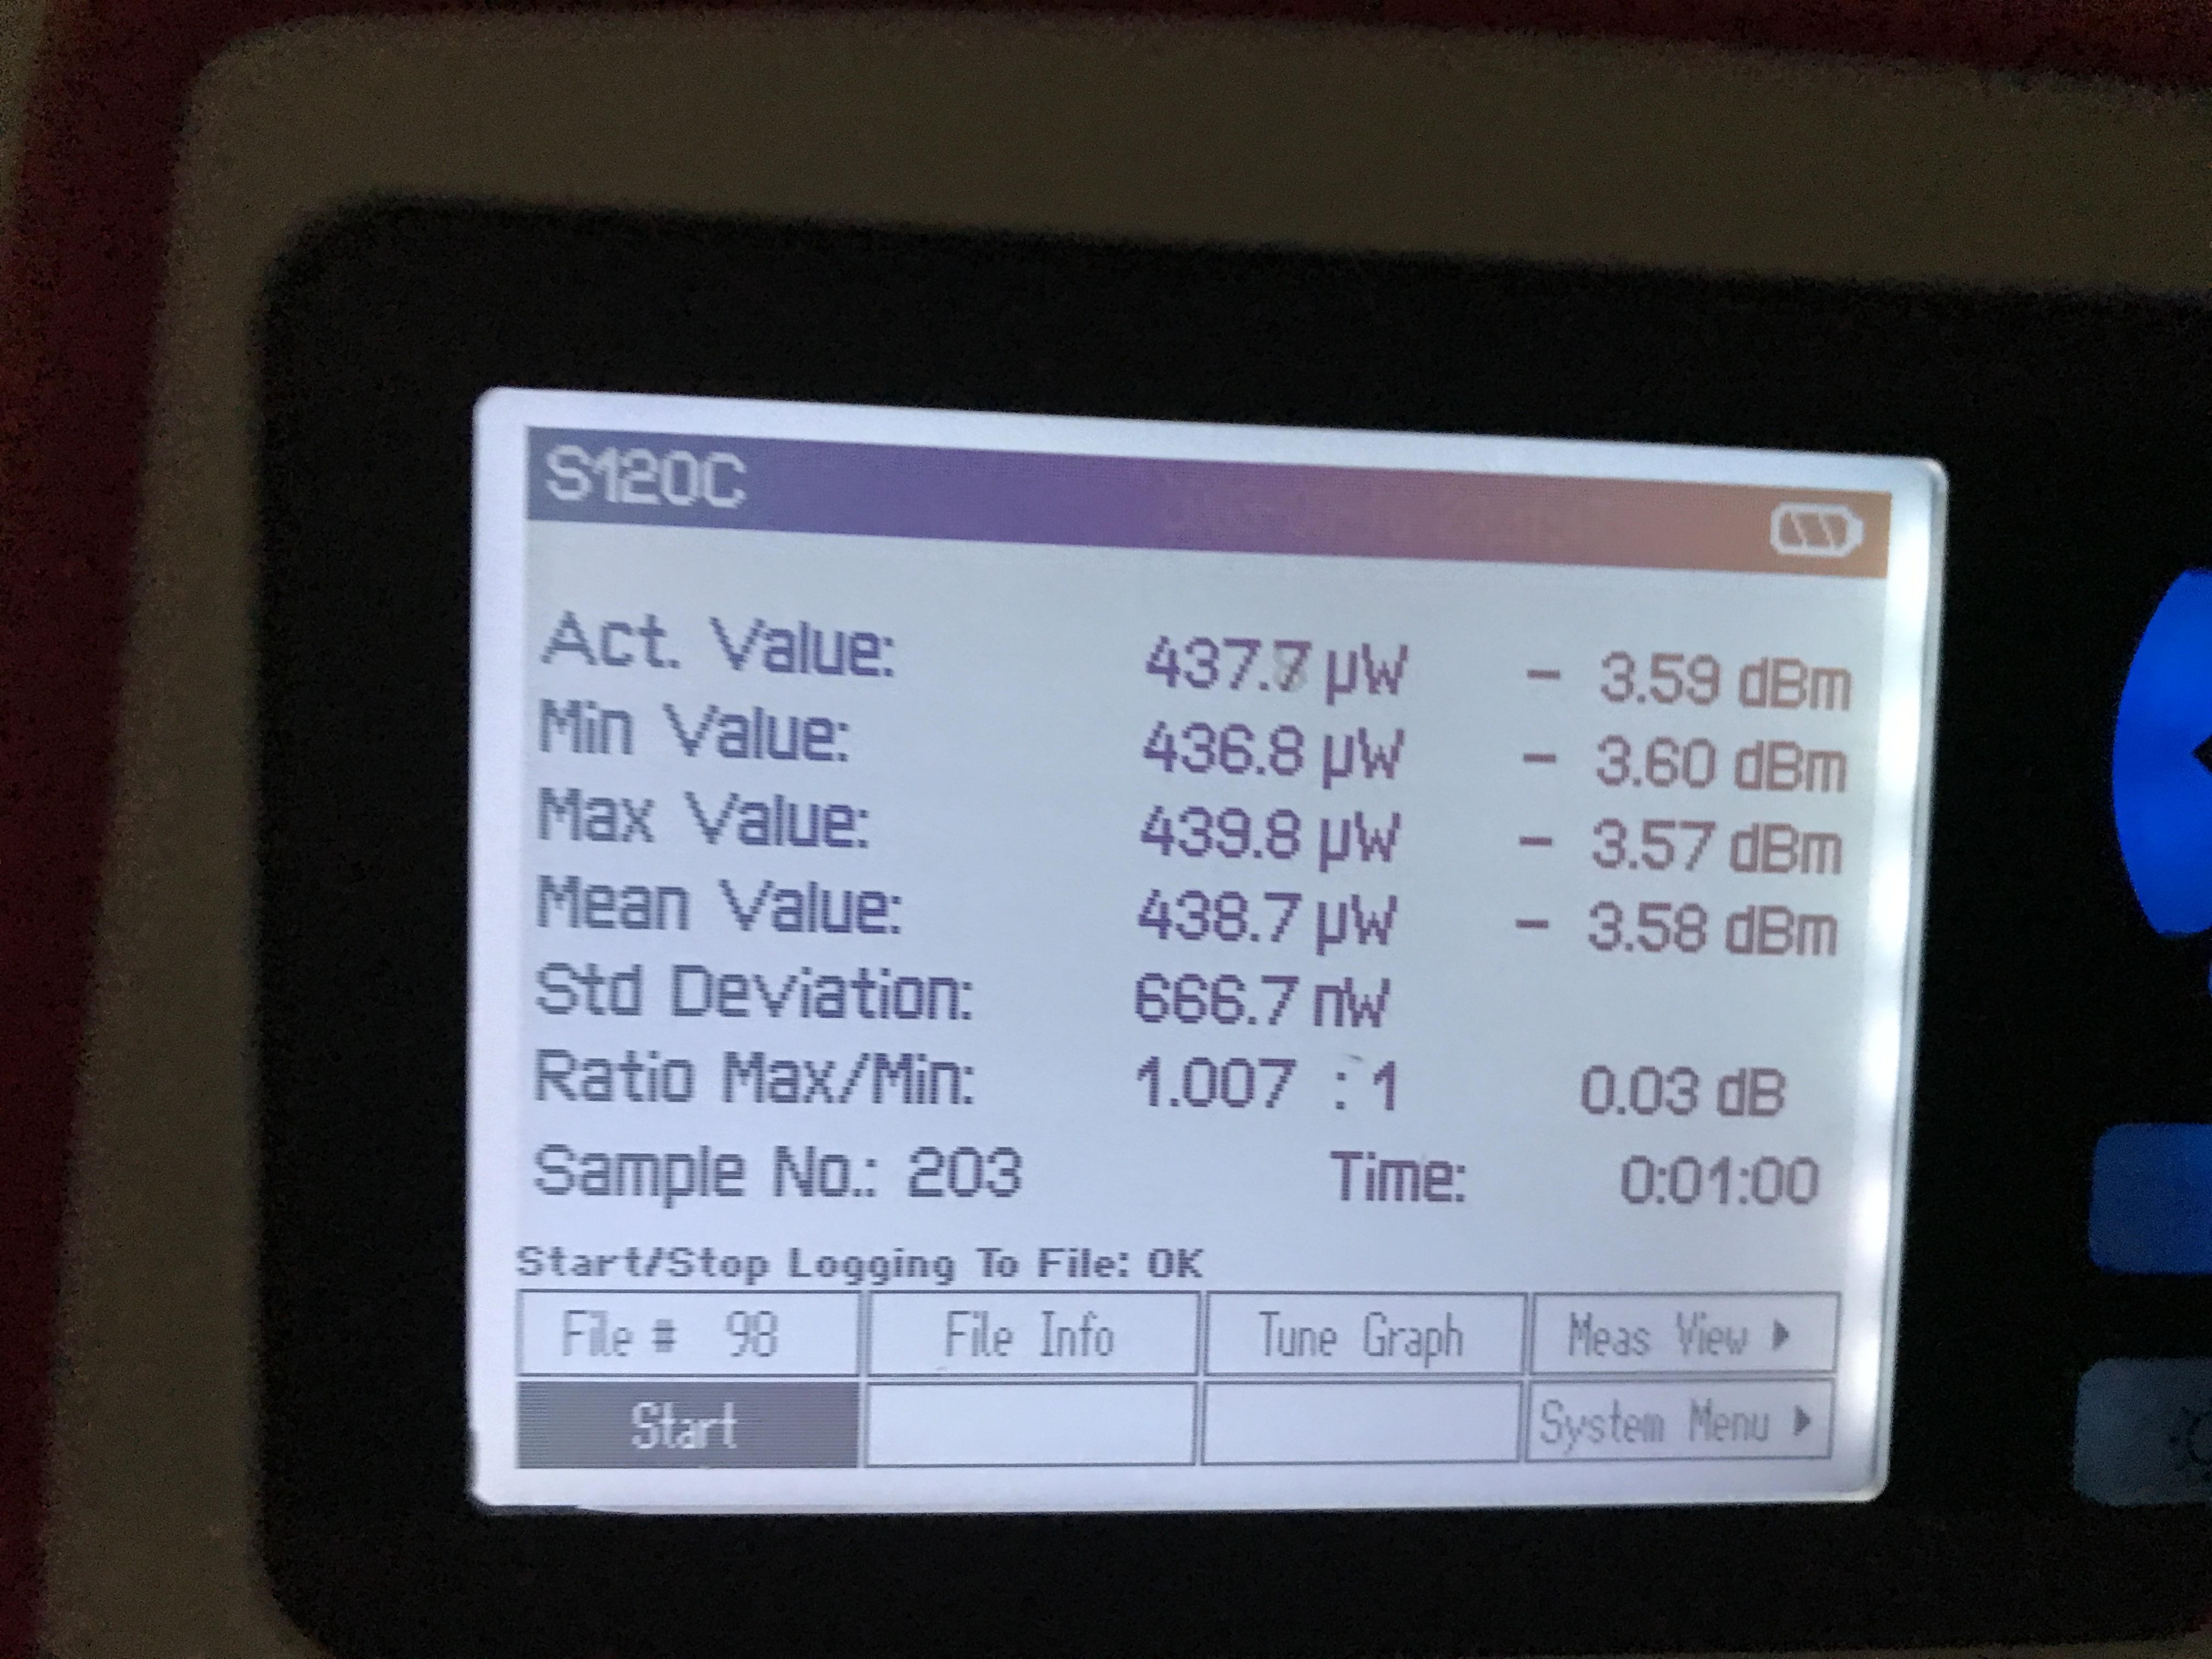
I measured BAB power fluctuation after OPO for one minute (attached picture). The BAB power fluctuation is 0.7% (Ratio of Max/Min = 1.007).
Aritomi and Yuhang
In the past few weeks, we measured homodyne shot noise few times, we found the shot noise level changes from -133.2dB to -133.7dB.
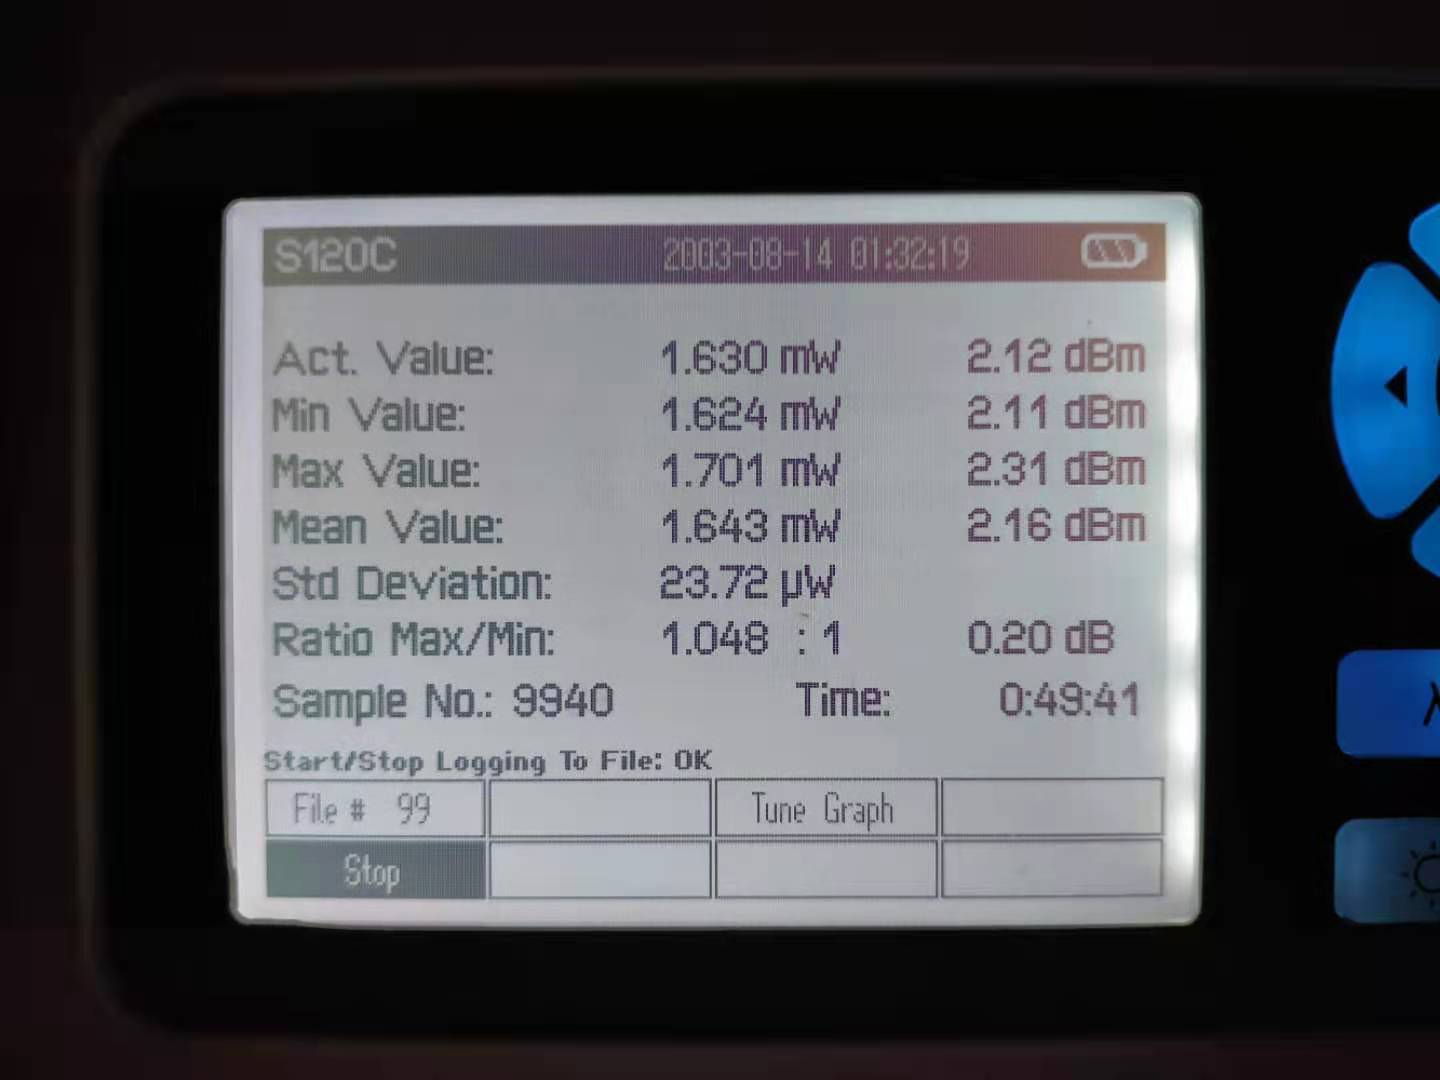
We monitor the BAB intensity for almost one hour on Monday this week. We found BAB intensity changed by about 5% during this time (attached figure 1). By doing 20*log10(sqrt(1.05))-20*log10(sqrt(1)), we found this can introduce 0.2dB shot noise change.
Although BAB and LO both come directly from main laser, this is not a test done for a real LO. We decide to check the power of LO before and after IRMC soon.
Marc, Yuhang
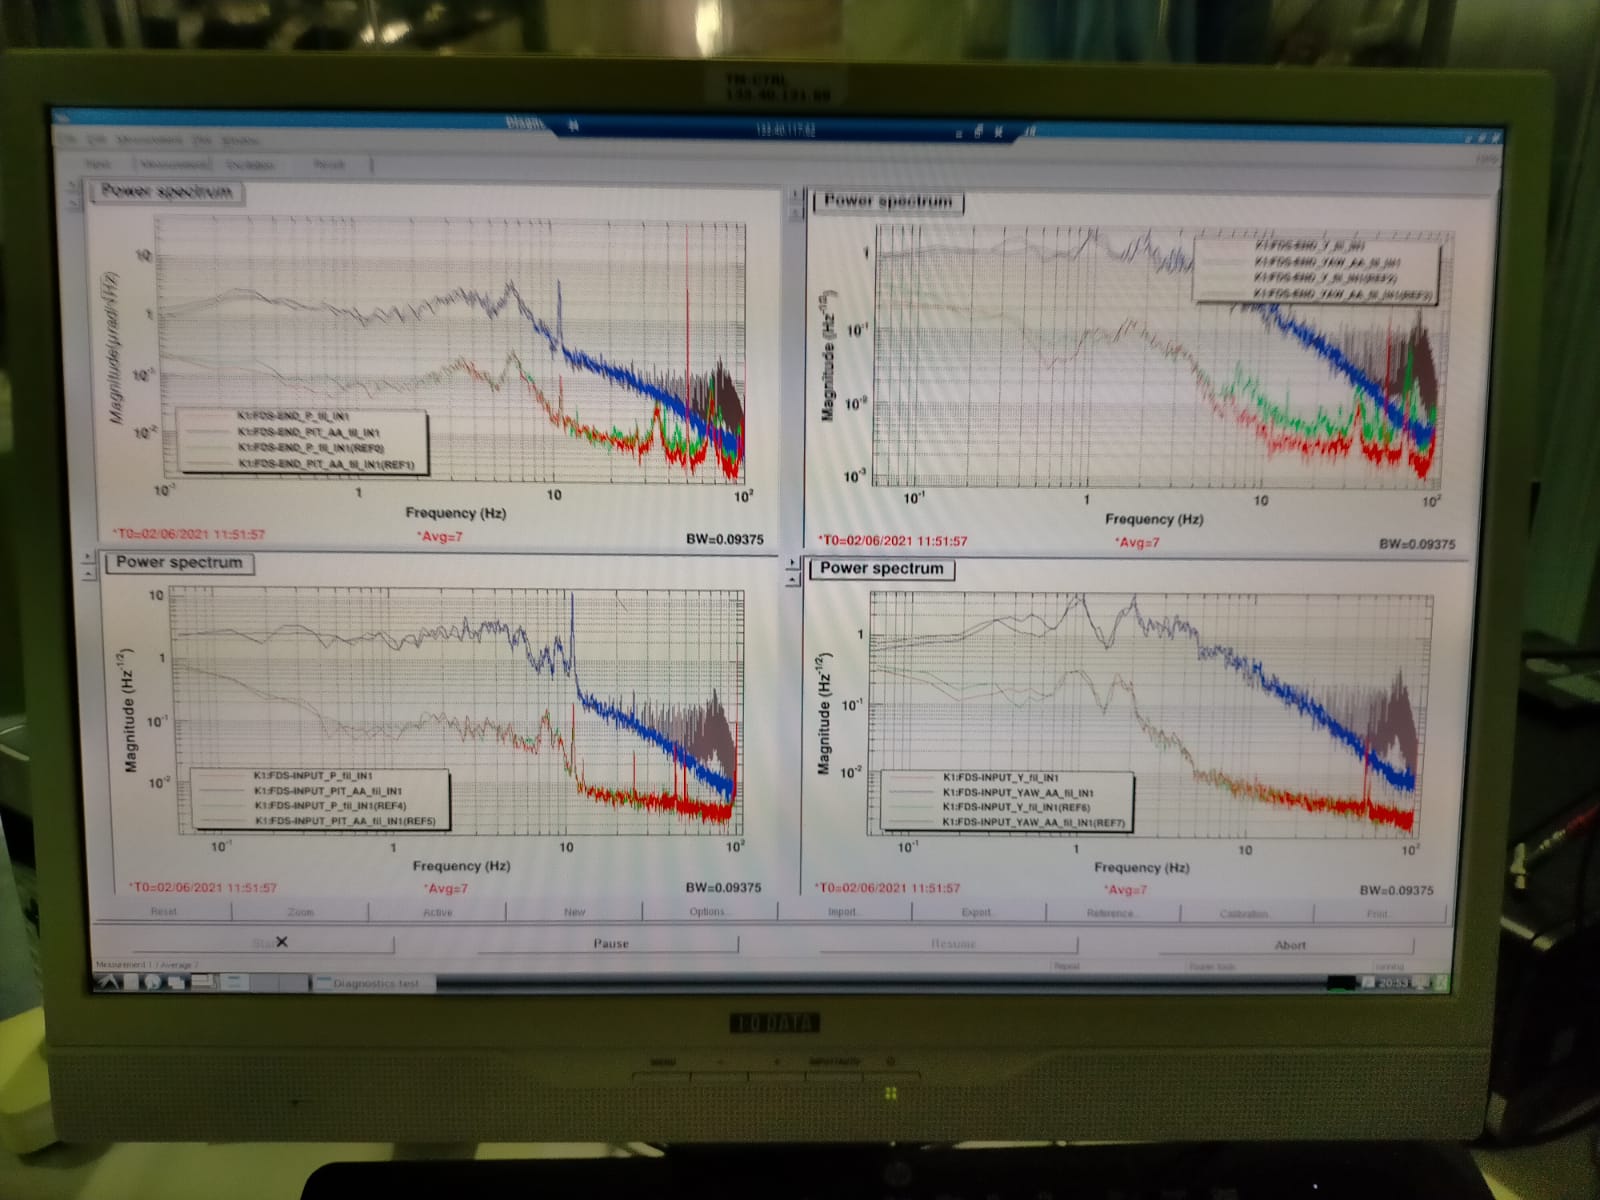
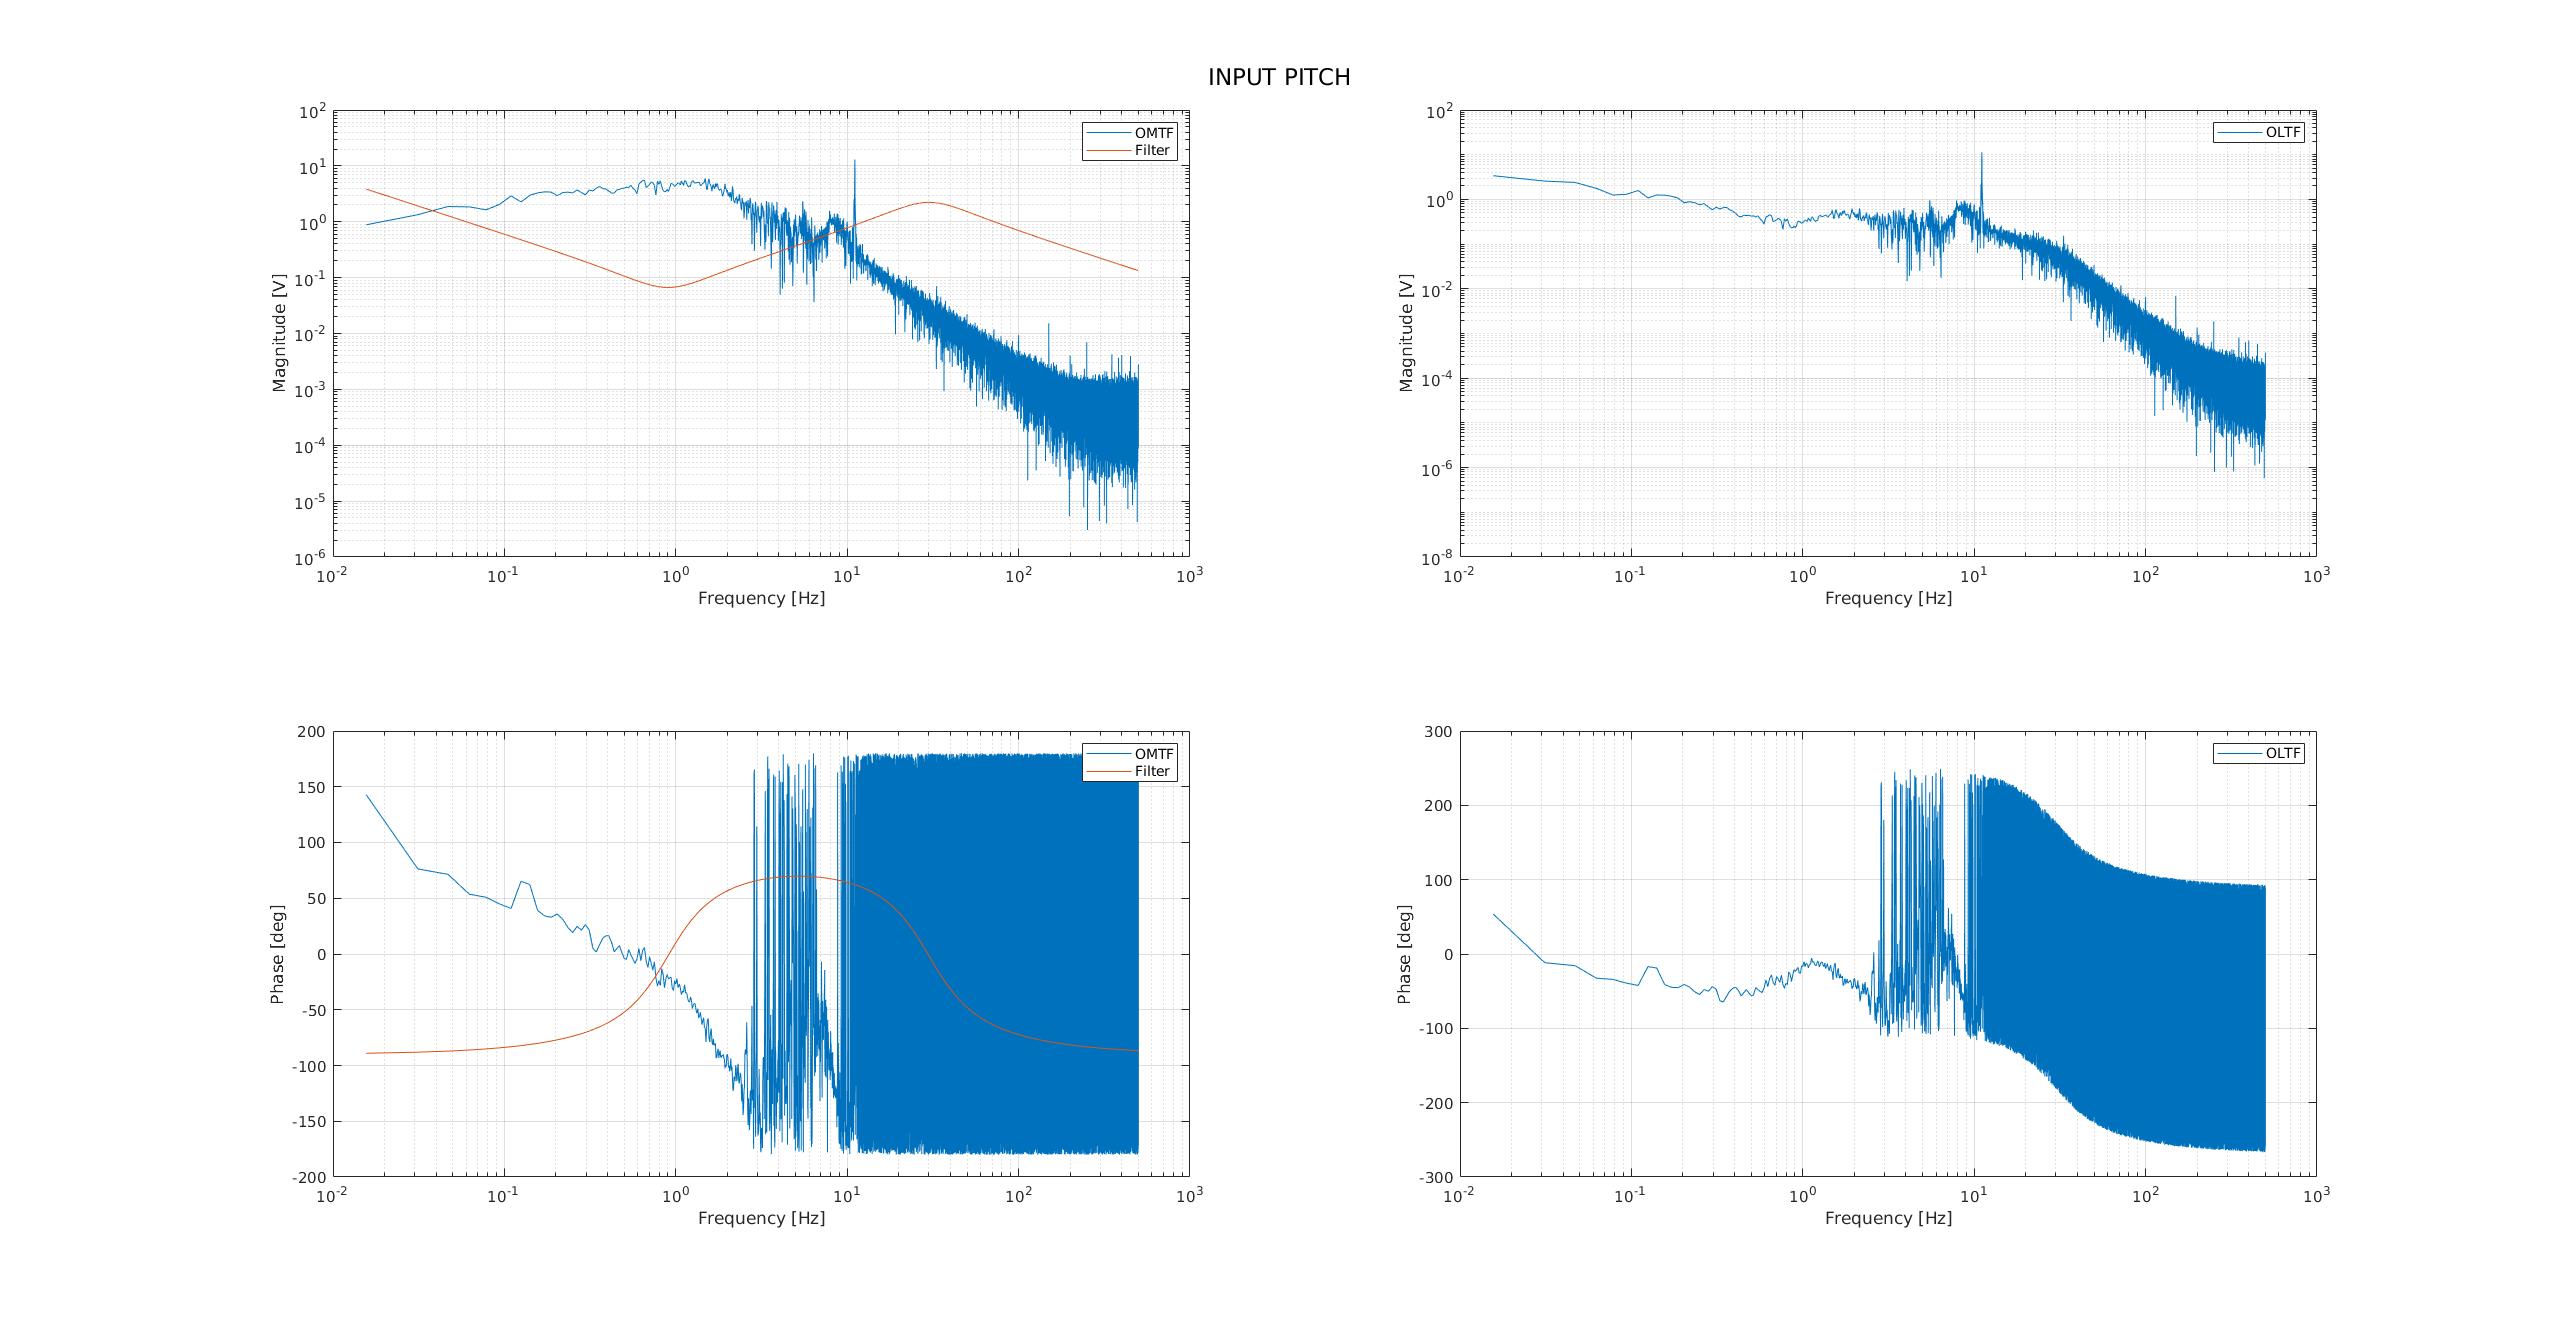
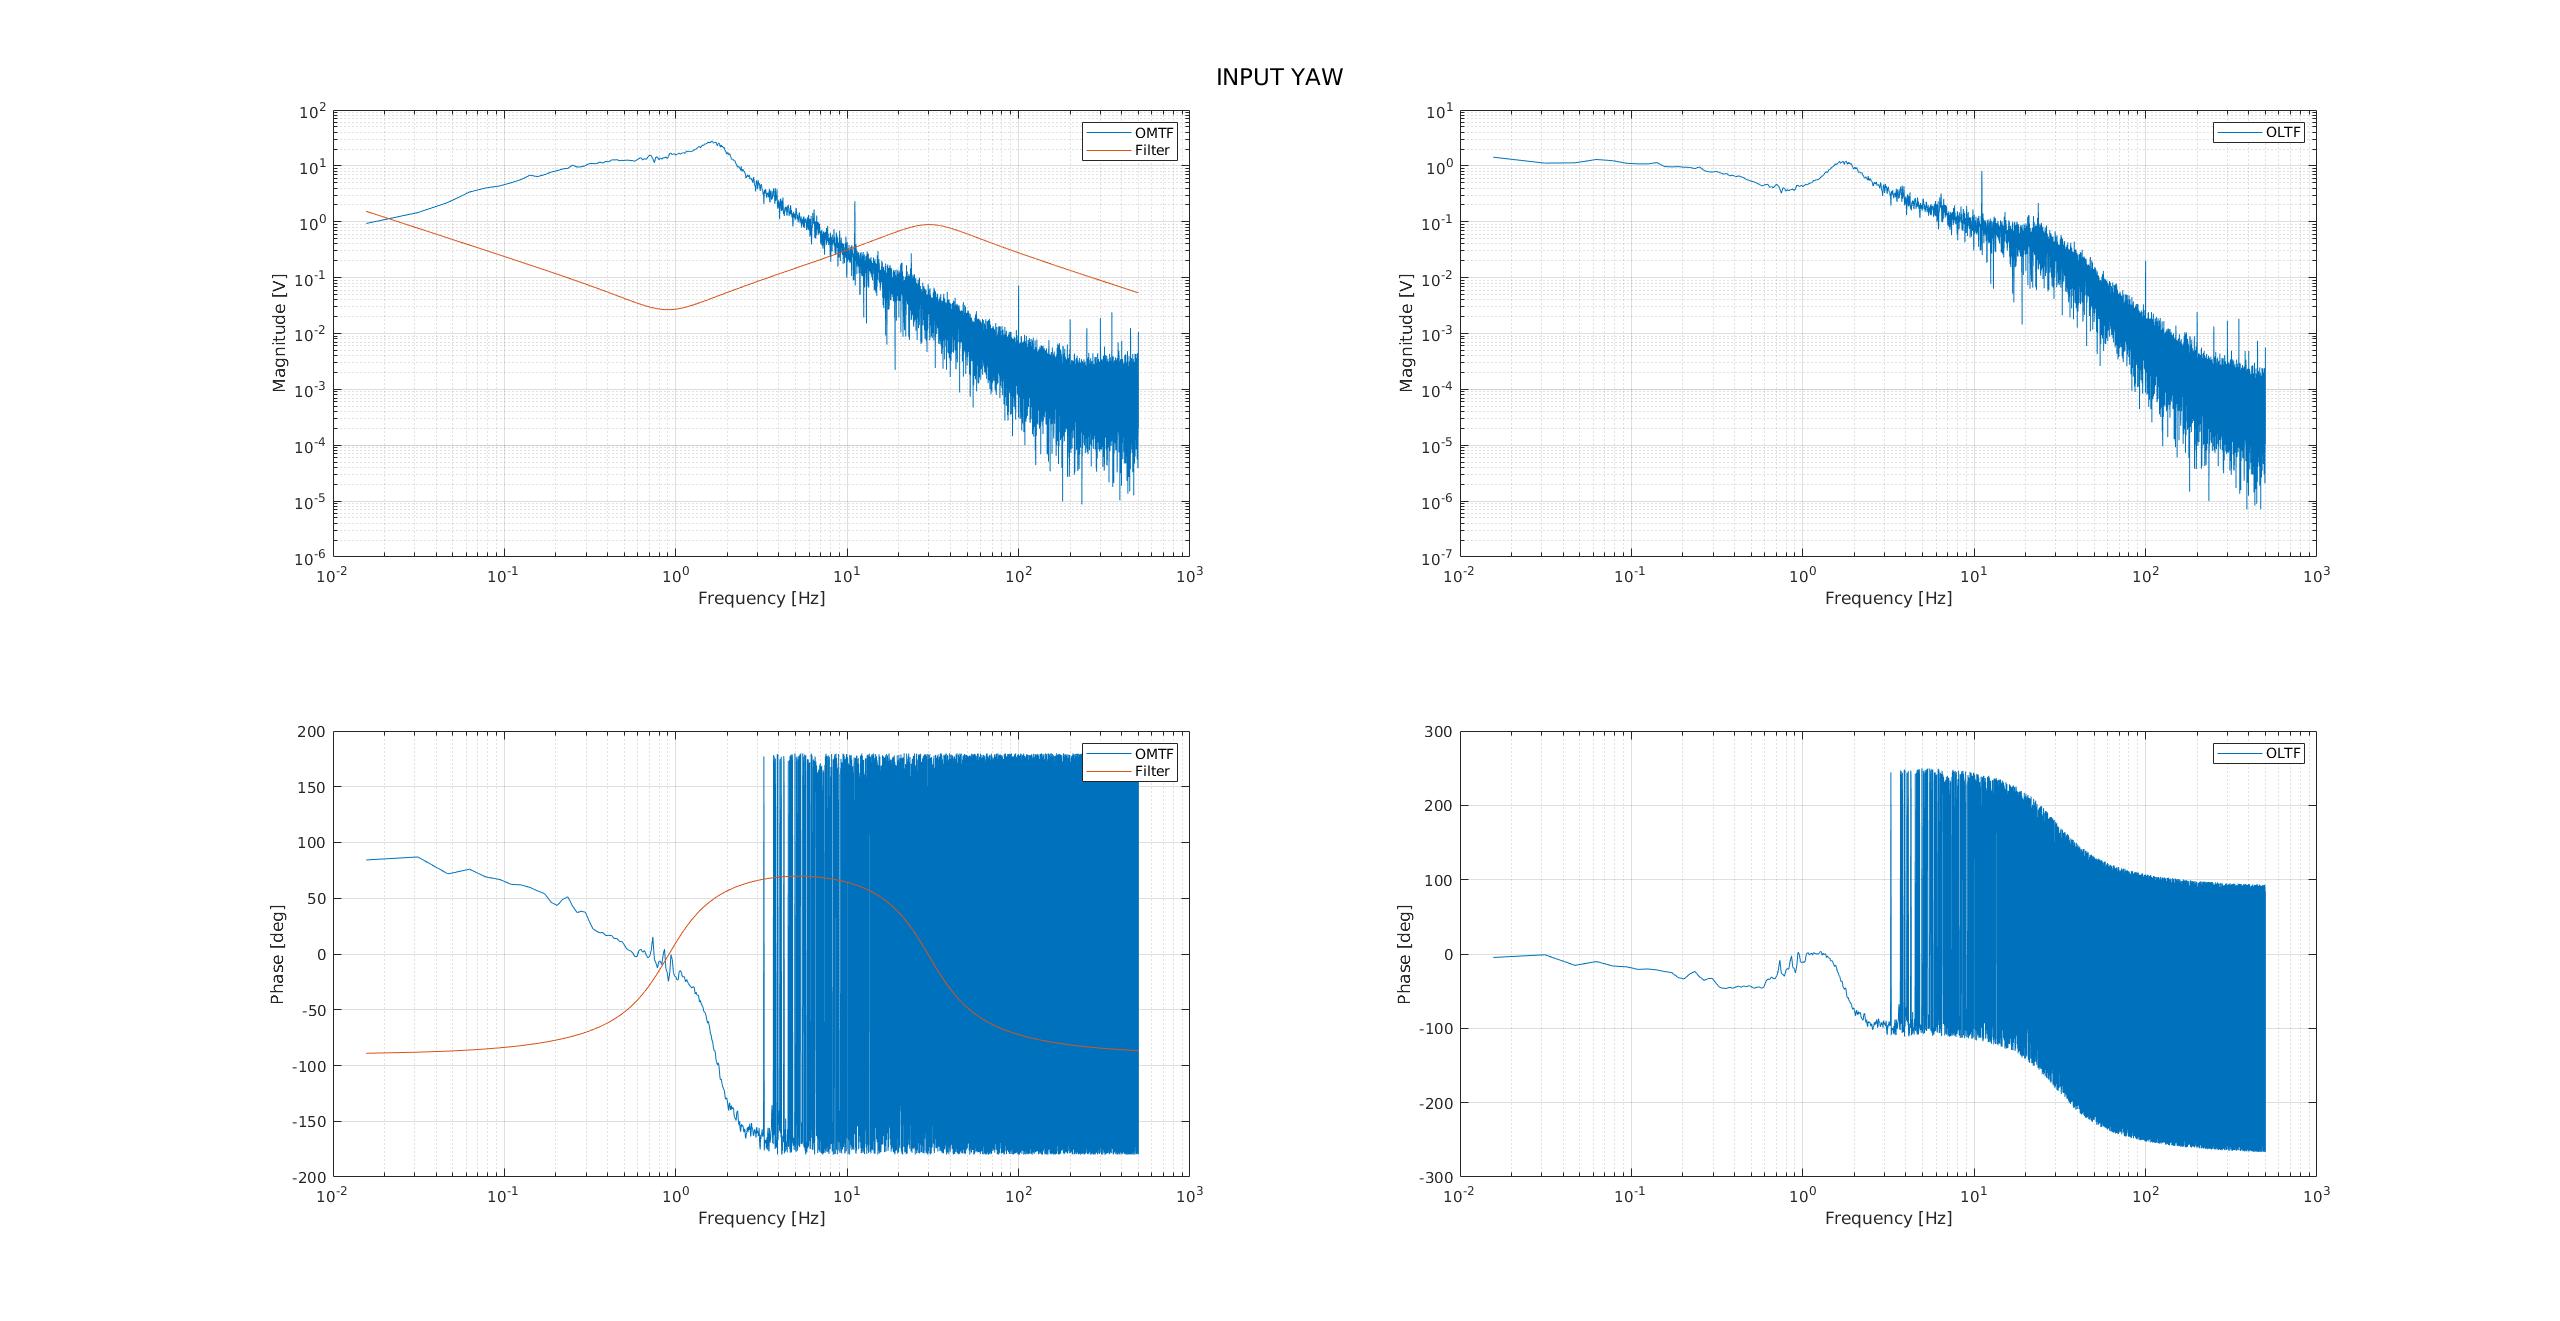
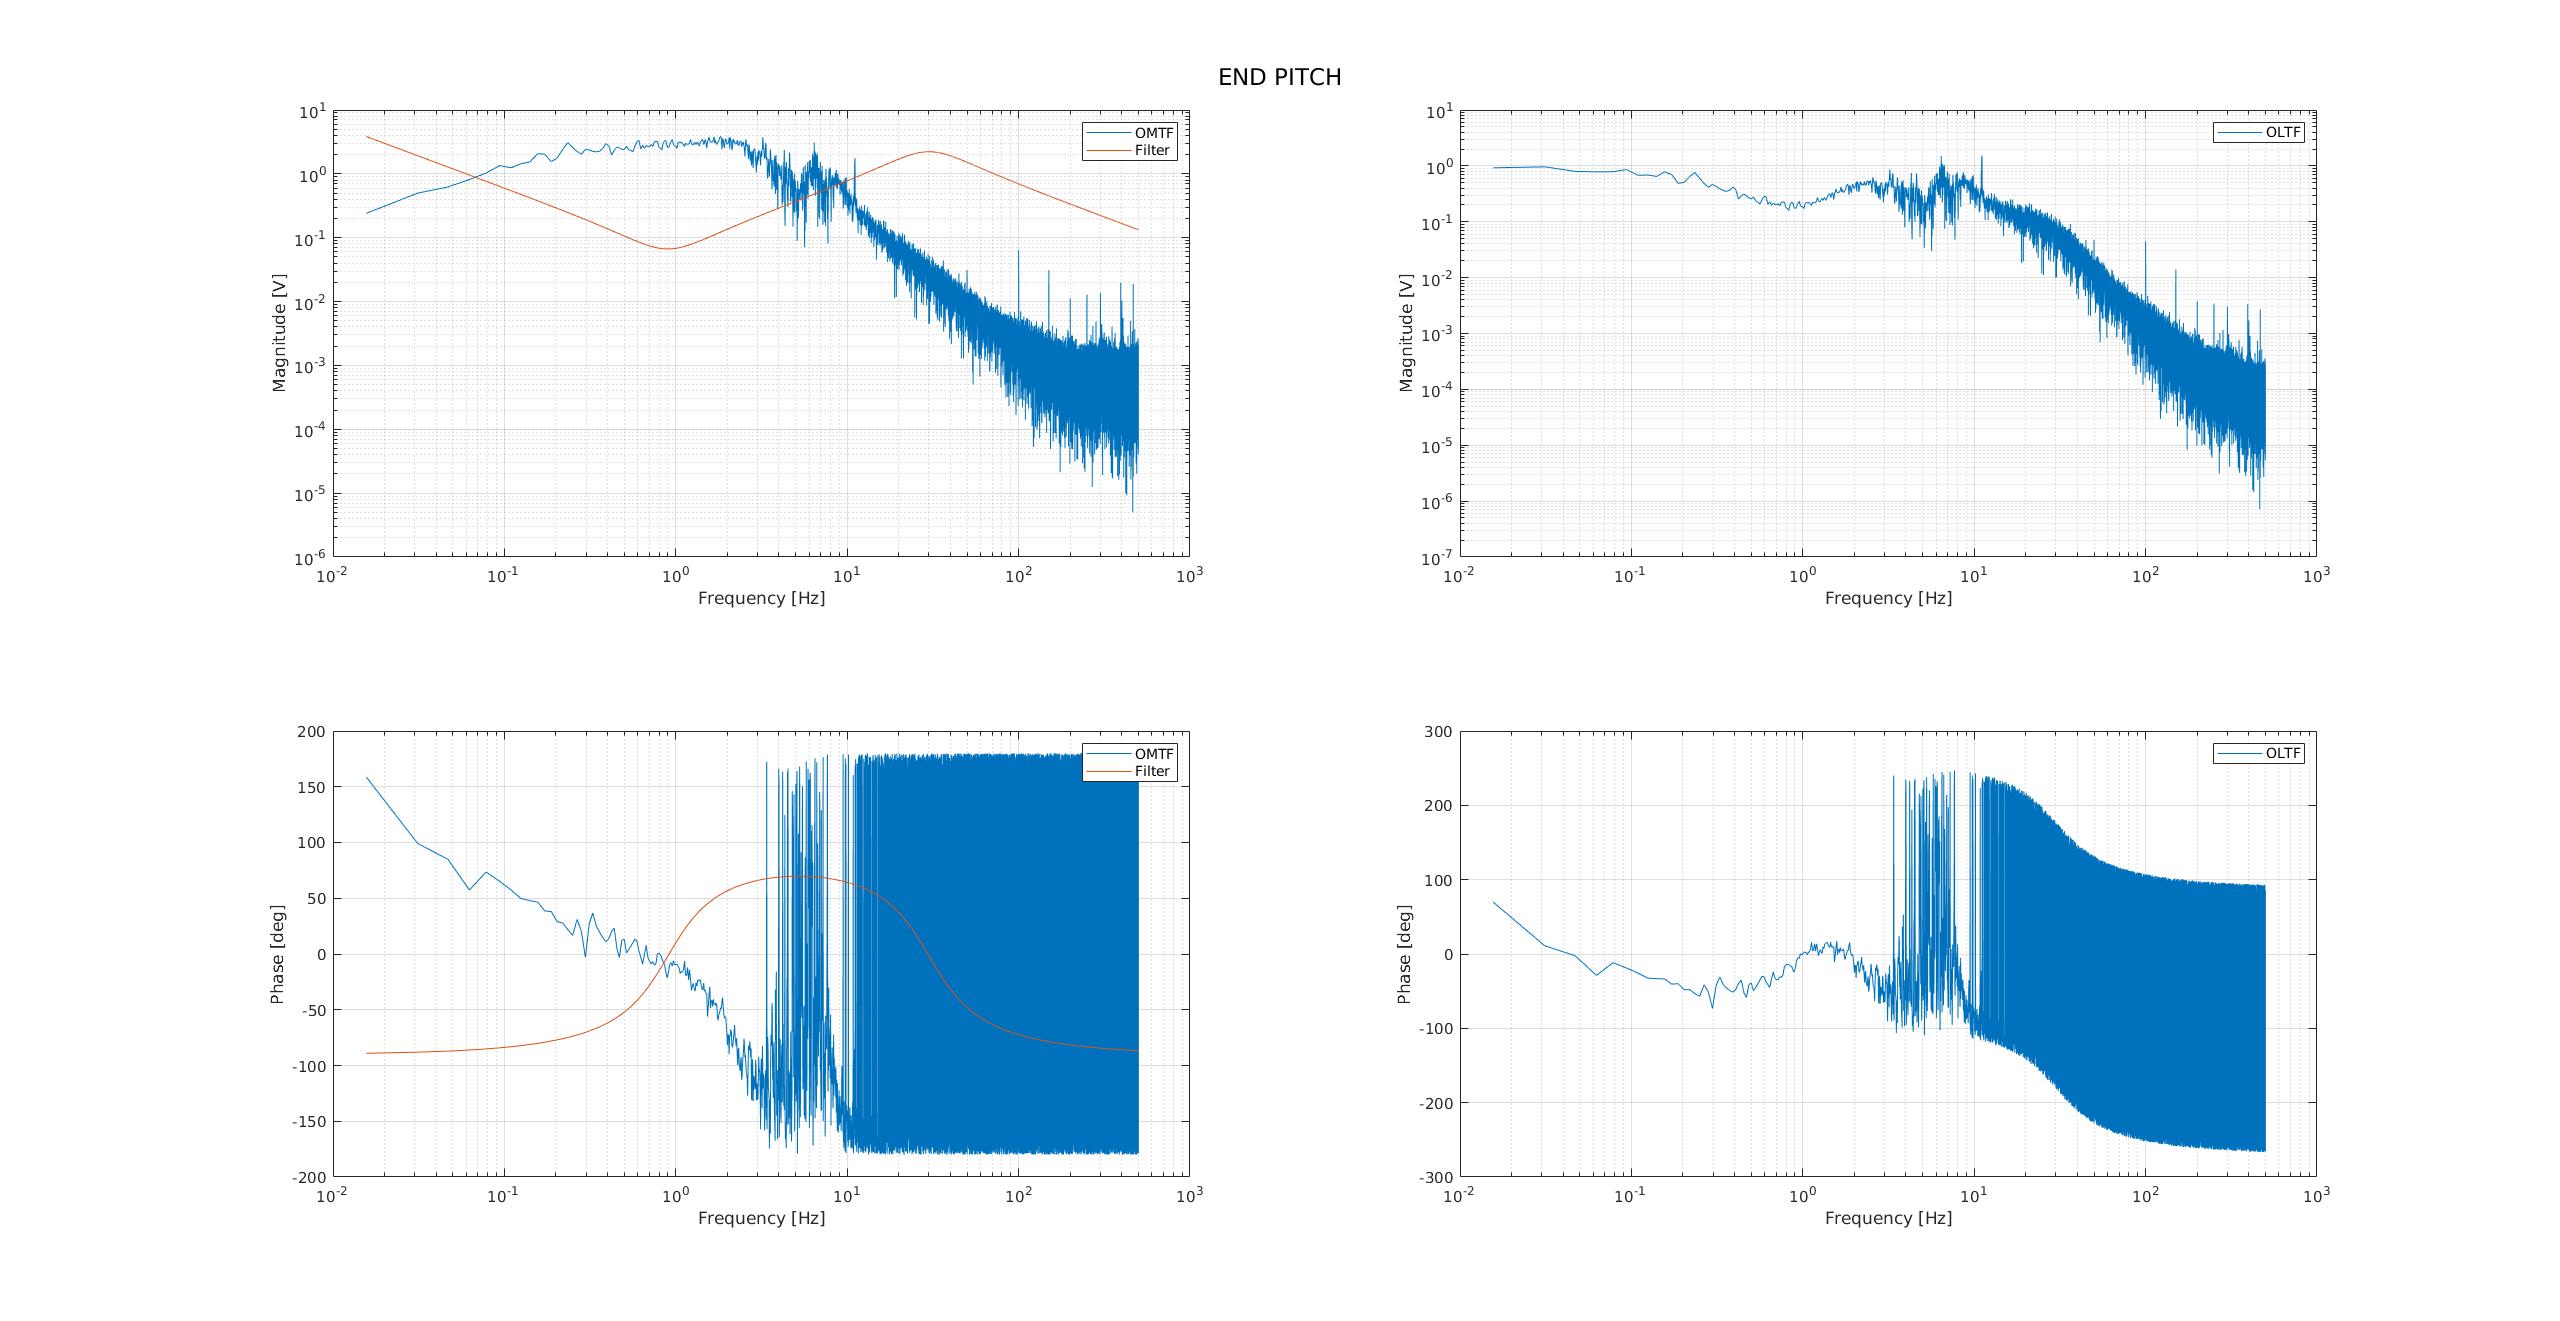
In entry 2545 the filter was not exported properly and was actually just a gain...
This time we used the proper filter and got the correct 4 open loop transfer functions of automatic-alignment as shown in the 4 attached figures.
It seems that for input & end pitch, the 11 Hz resonance is really too close to unity gain.
And the frequencies around 1 Hz have similar behavior.
We'll tune the filter in order to reduce this effect.

| green power (mW) | OPO temperature (kOhm) | p pol PLL (MHz) | BAB maximum (mV) | nonlinear gain |
| 0 | 7.164 | 240 | 56.4 | 1 |
| 20 | 7.164 | 180 | 254 | 4.5 |
Marc, Michael, and Yuhang
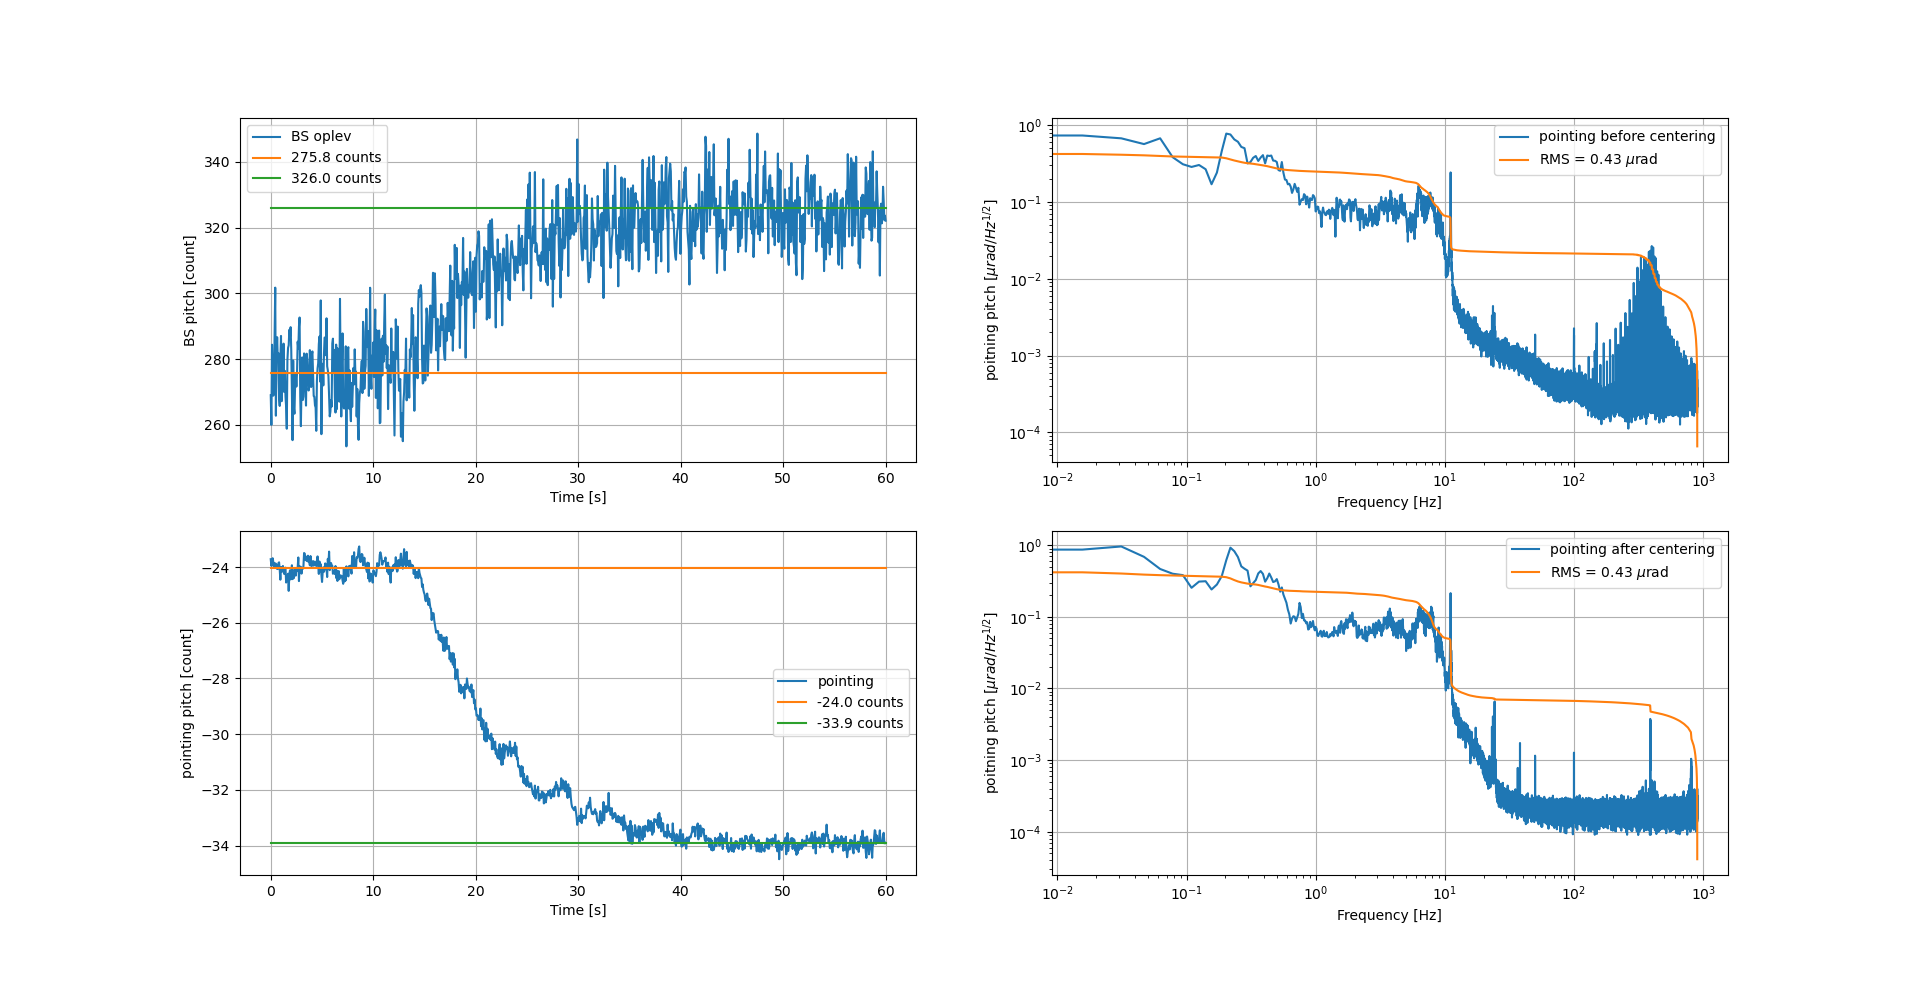
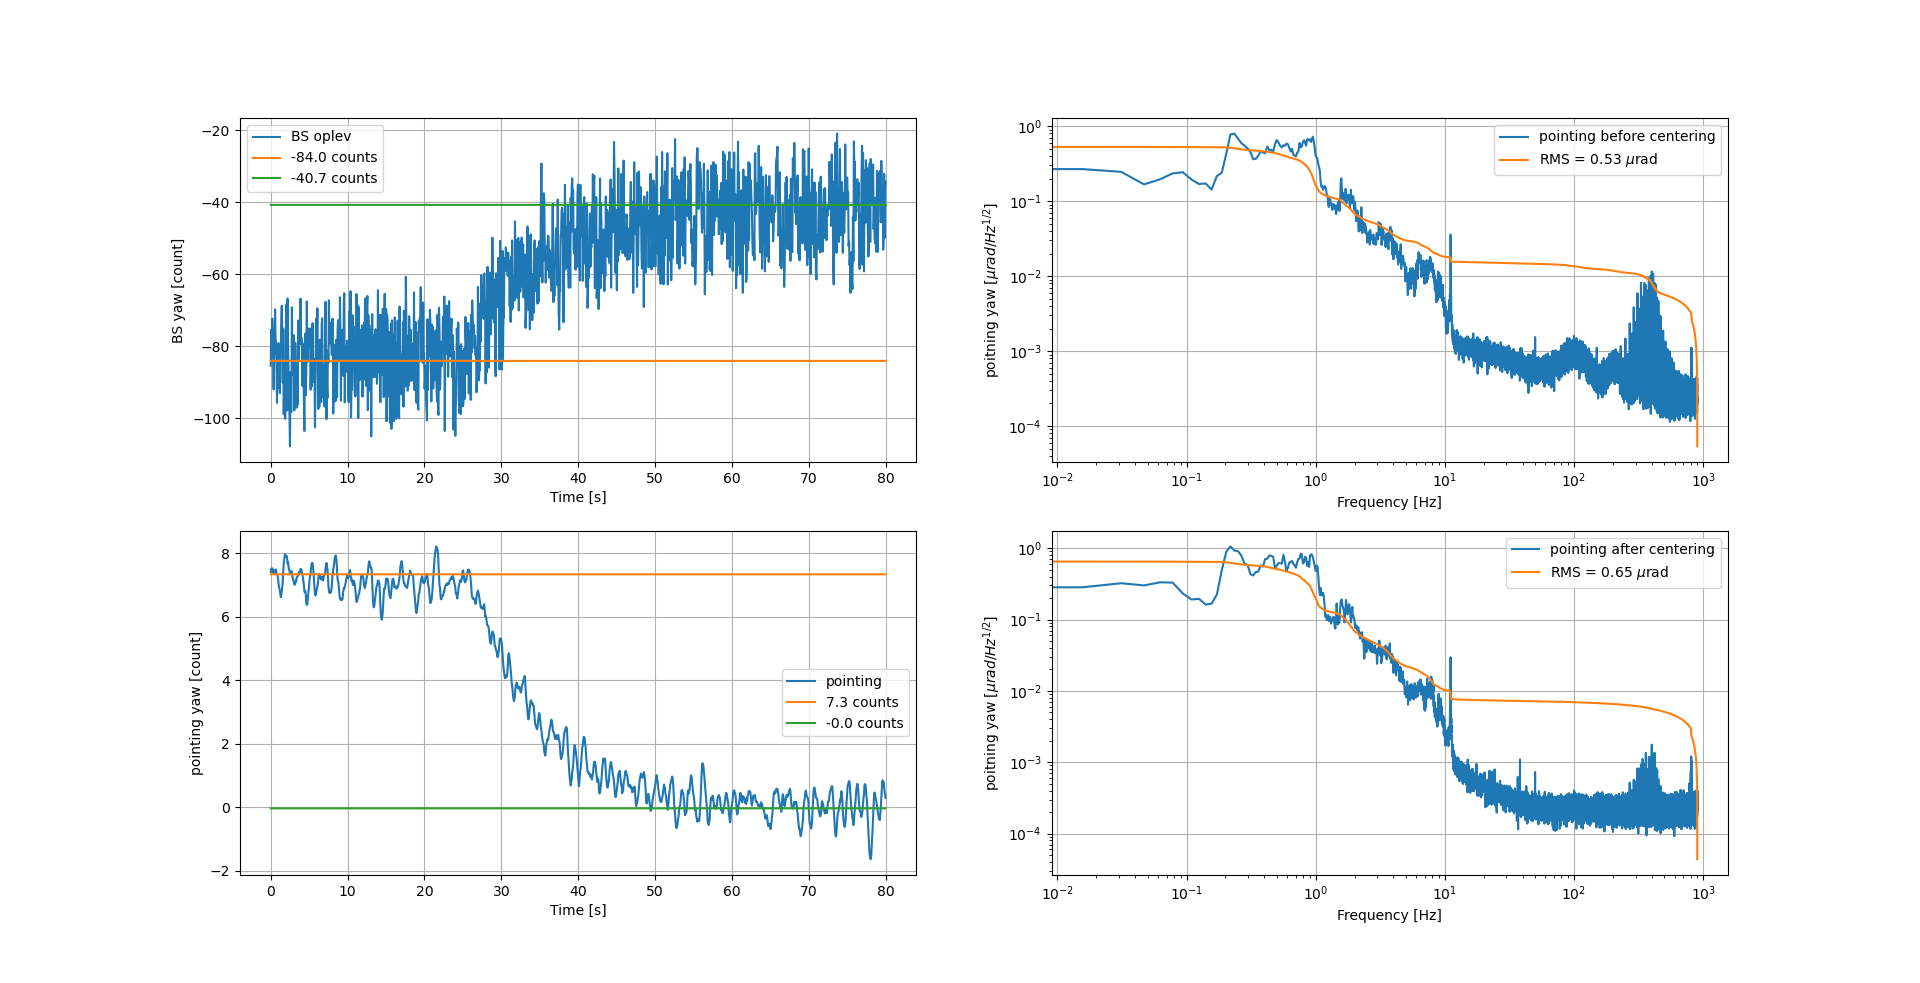
We have done a calibration for pointing loop with a new method. We move the locking point of pointing loop and check how much BS needs to compensate.
Pointing pitch:
we move pointing pitch, as attached figure 1 [1,0] subplot, from -24 to -34 [counts]. Then we found BS pitch, as attached figure 1 [0,0] subplot, needs to move from 275.8 to 326.0 [counts] to compensate. Taking into account the calbration of oplev, we got calibration factor for pointing loop on the base of BS.
The pointing precision was estimated by a RMS integral of pointing loop error signal spectra. We also found that high frequency spectrum can be better if we center beam on PSD, which is shown in attached figure 1 [0,1] and [1,1] subplots. However, the RMS of these two seneriaos are the same, which is reasonable since the dominating noise is at low frequency. In conclusion, we got pitch pointing precision as 0.43urad.
pitch pointing loop calibration factor 1.3 urad/count.
Pointing yaw:
We have done the pointing yaw calibration in the same manner with pointing pitch. The details can be found in attached figure 2. In conclusion, we got yaw pointing precision of 0.65urad.
yaw pointing loop calibration factor 1.5 urad/count.
Note: to take a quicker measurement, we have increased pointing loop gain by factors of 3 and 5 for pitch and yaw. So you can see the BS compensation finishes within 1 minute. We have also tested the spectrum of poiting pitch/yaw don't show difference when gains are increased.
I consulted with Takahiro Yamamoto-san about if it is OK to delete data from \full directory and he said there is not important setting but just saved data inside here.
So I deleted the data from 2020/07/30 to 2020/11/21.
Now we have 63% in use, which means 37% space is released.
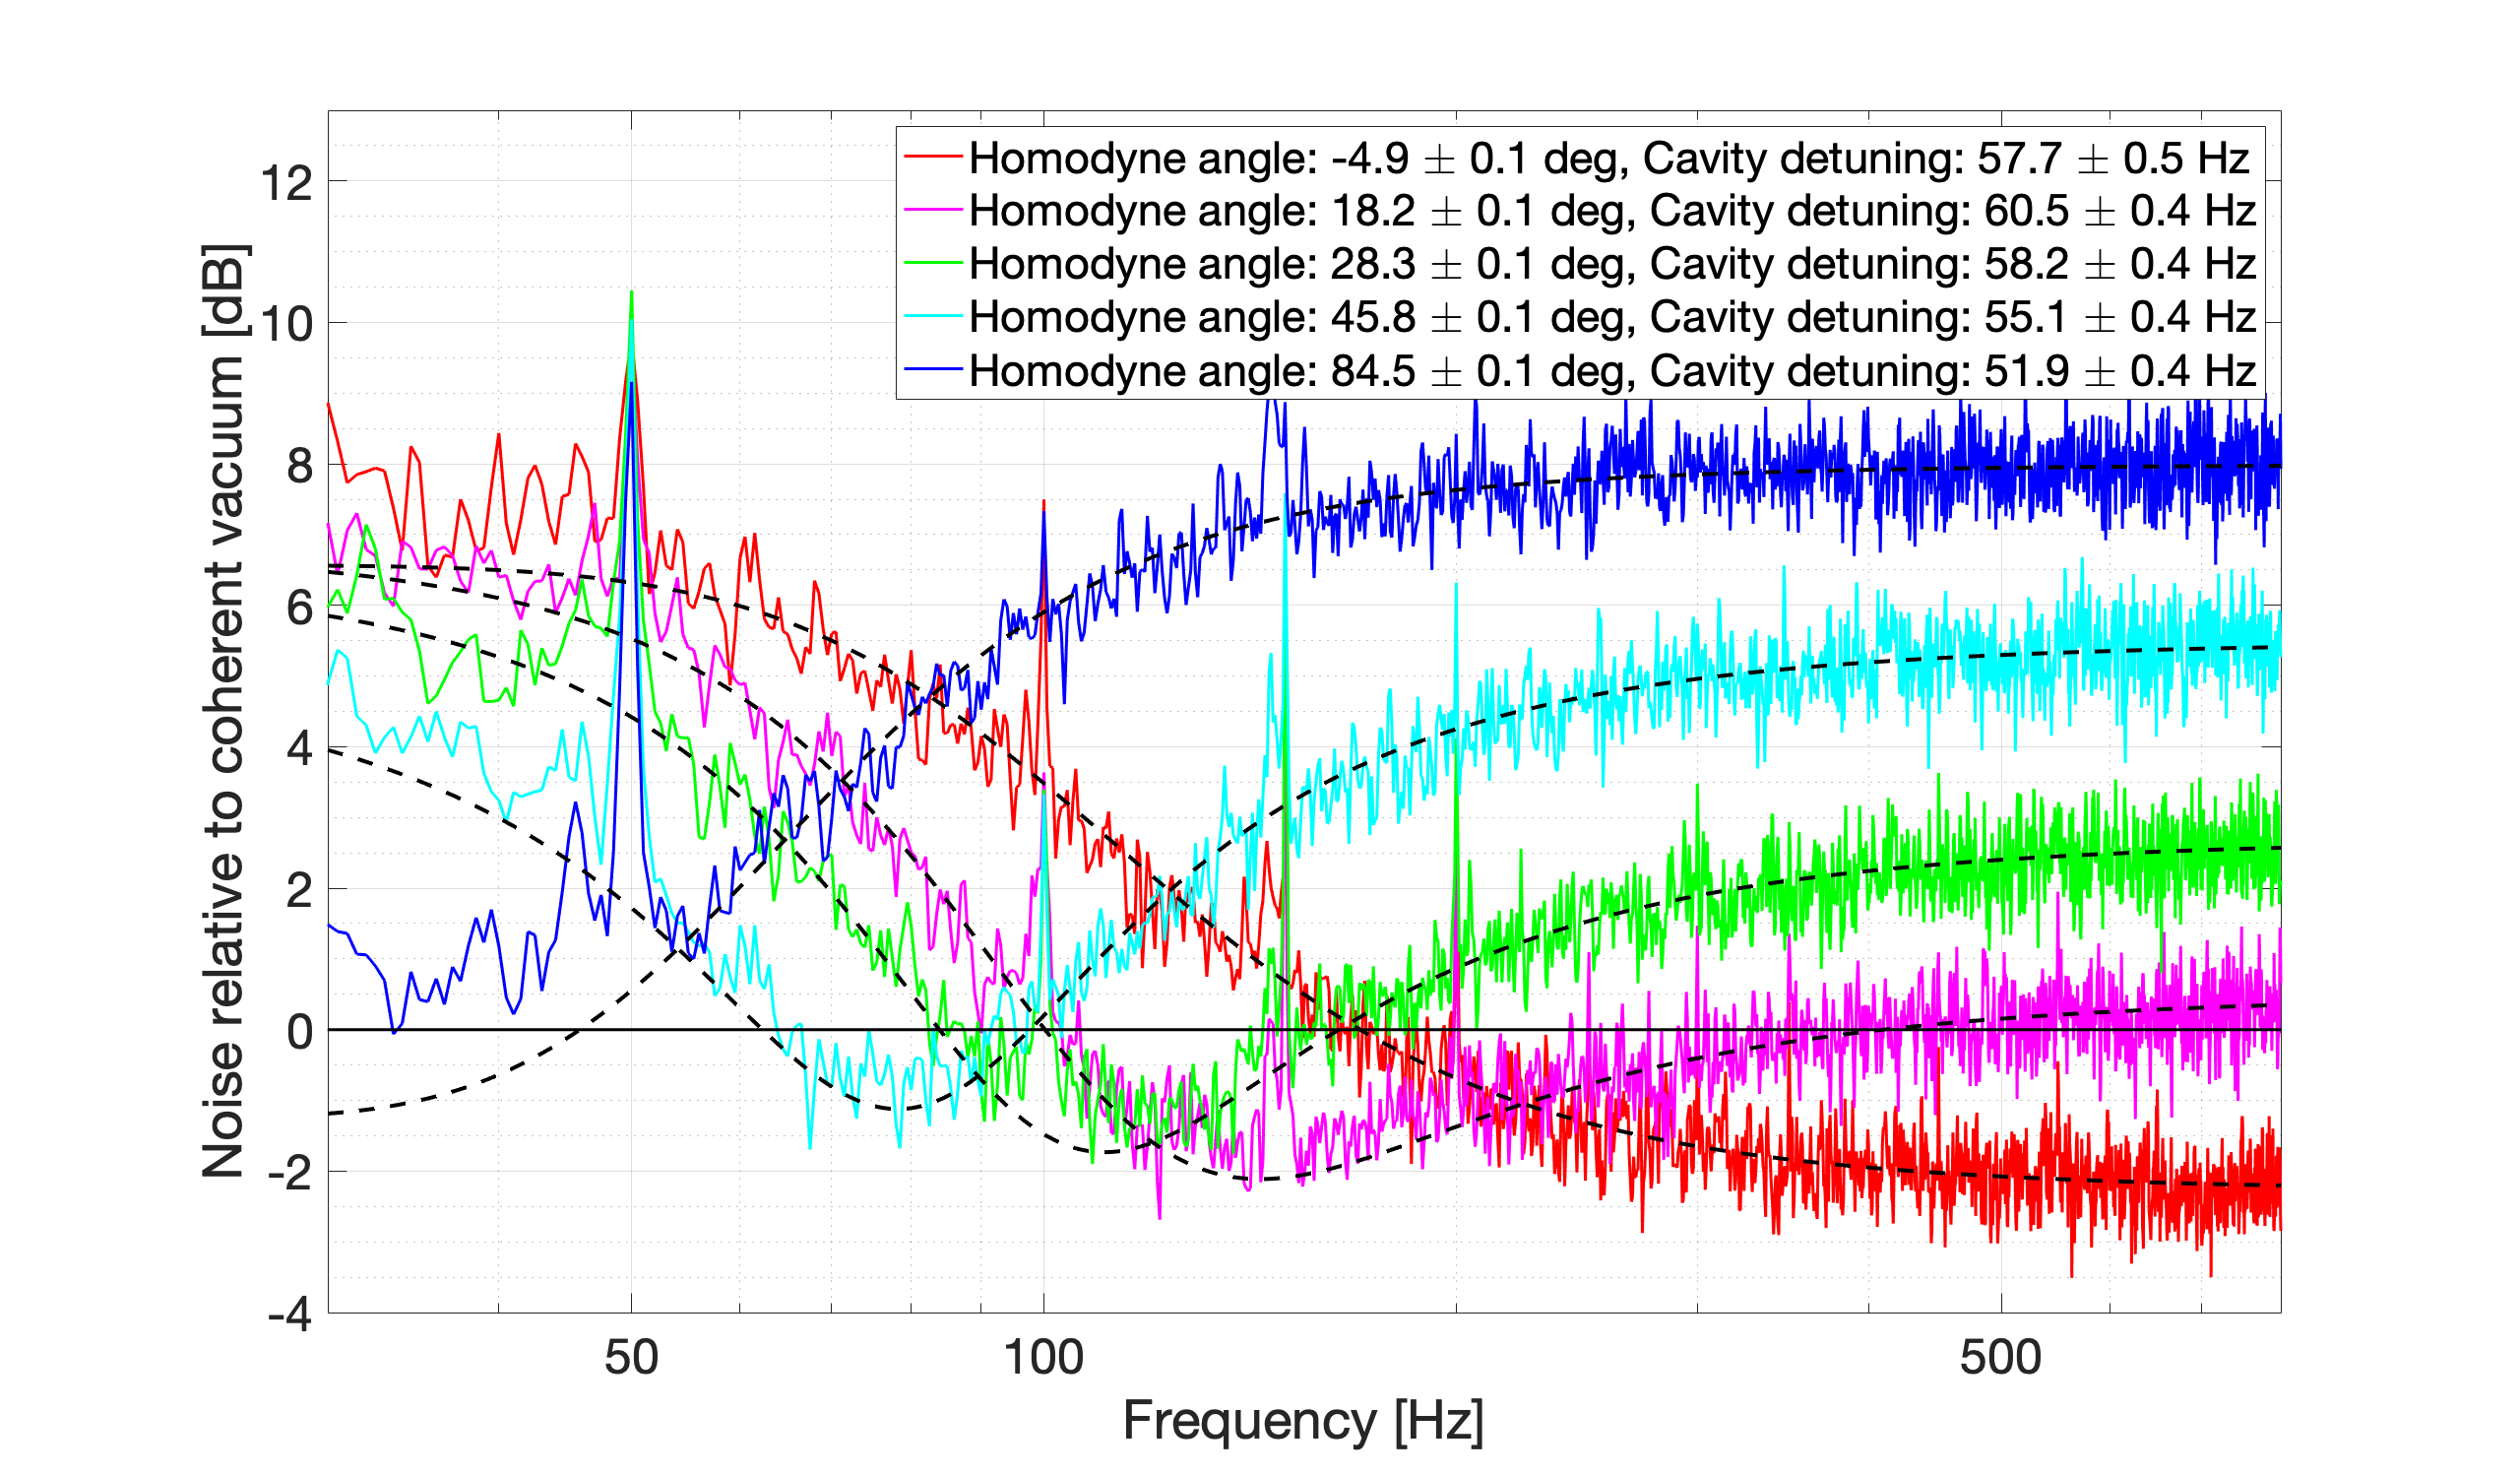
A similar measurement was done in elog2350, I and Michael got quite similar result even with a time scale of 1 hour. However, if I remember and understand well, Aso-san had a comment that different homodyne angle may affect our measurement, which is what we have seen. It seems important to understand why detuning becomes not so stable if we measure with different homodyne angle.
However, the same measurement may be interesting to be made for without CCFC but with AA/pointing.
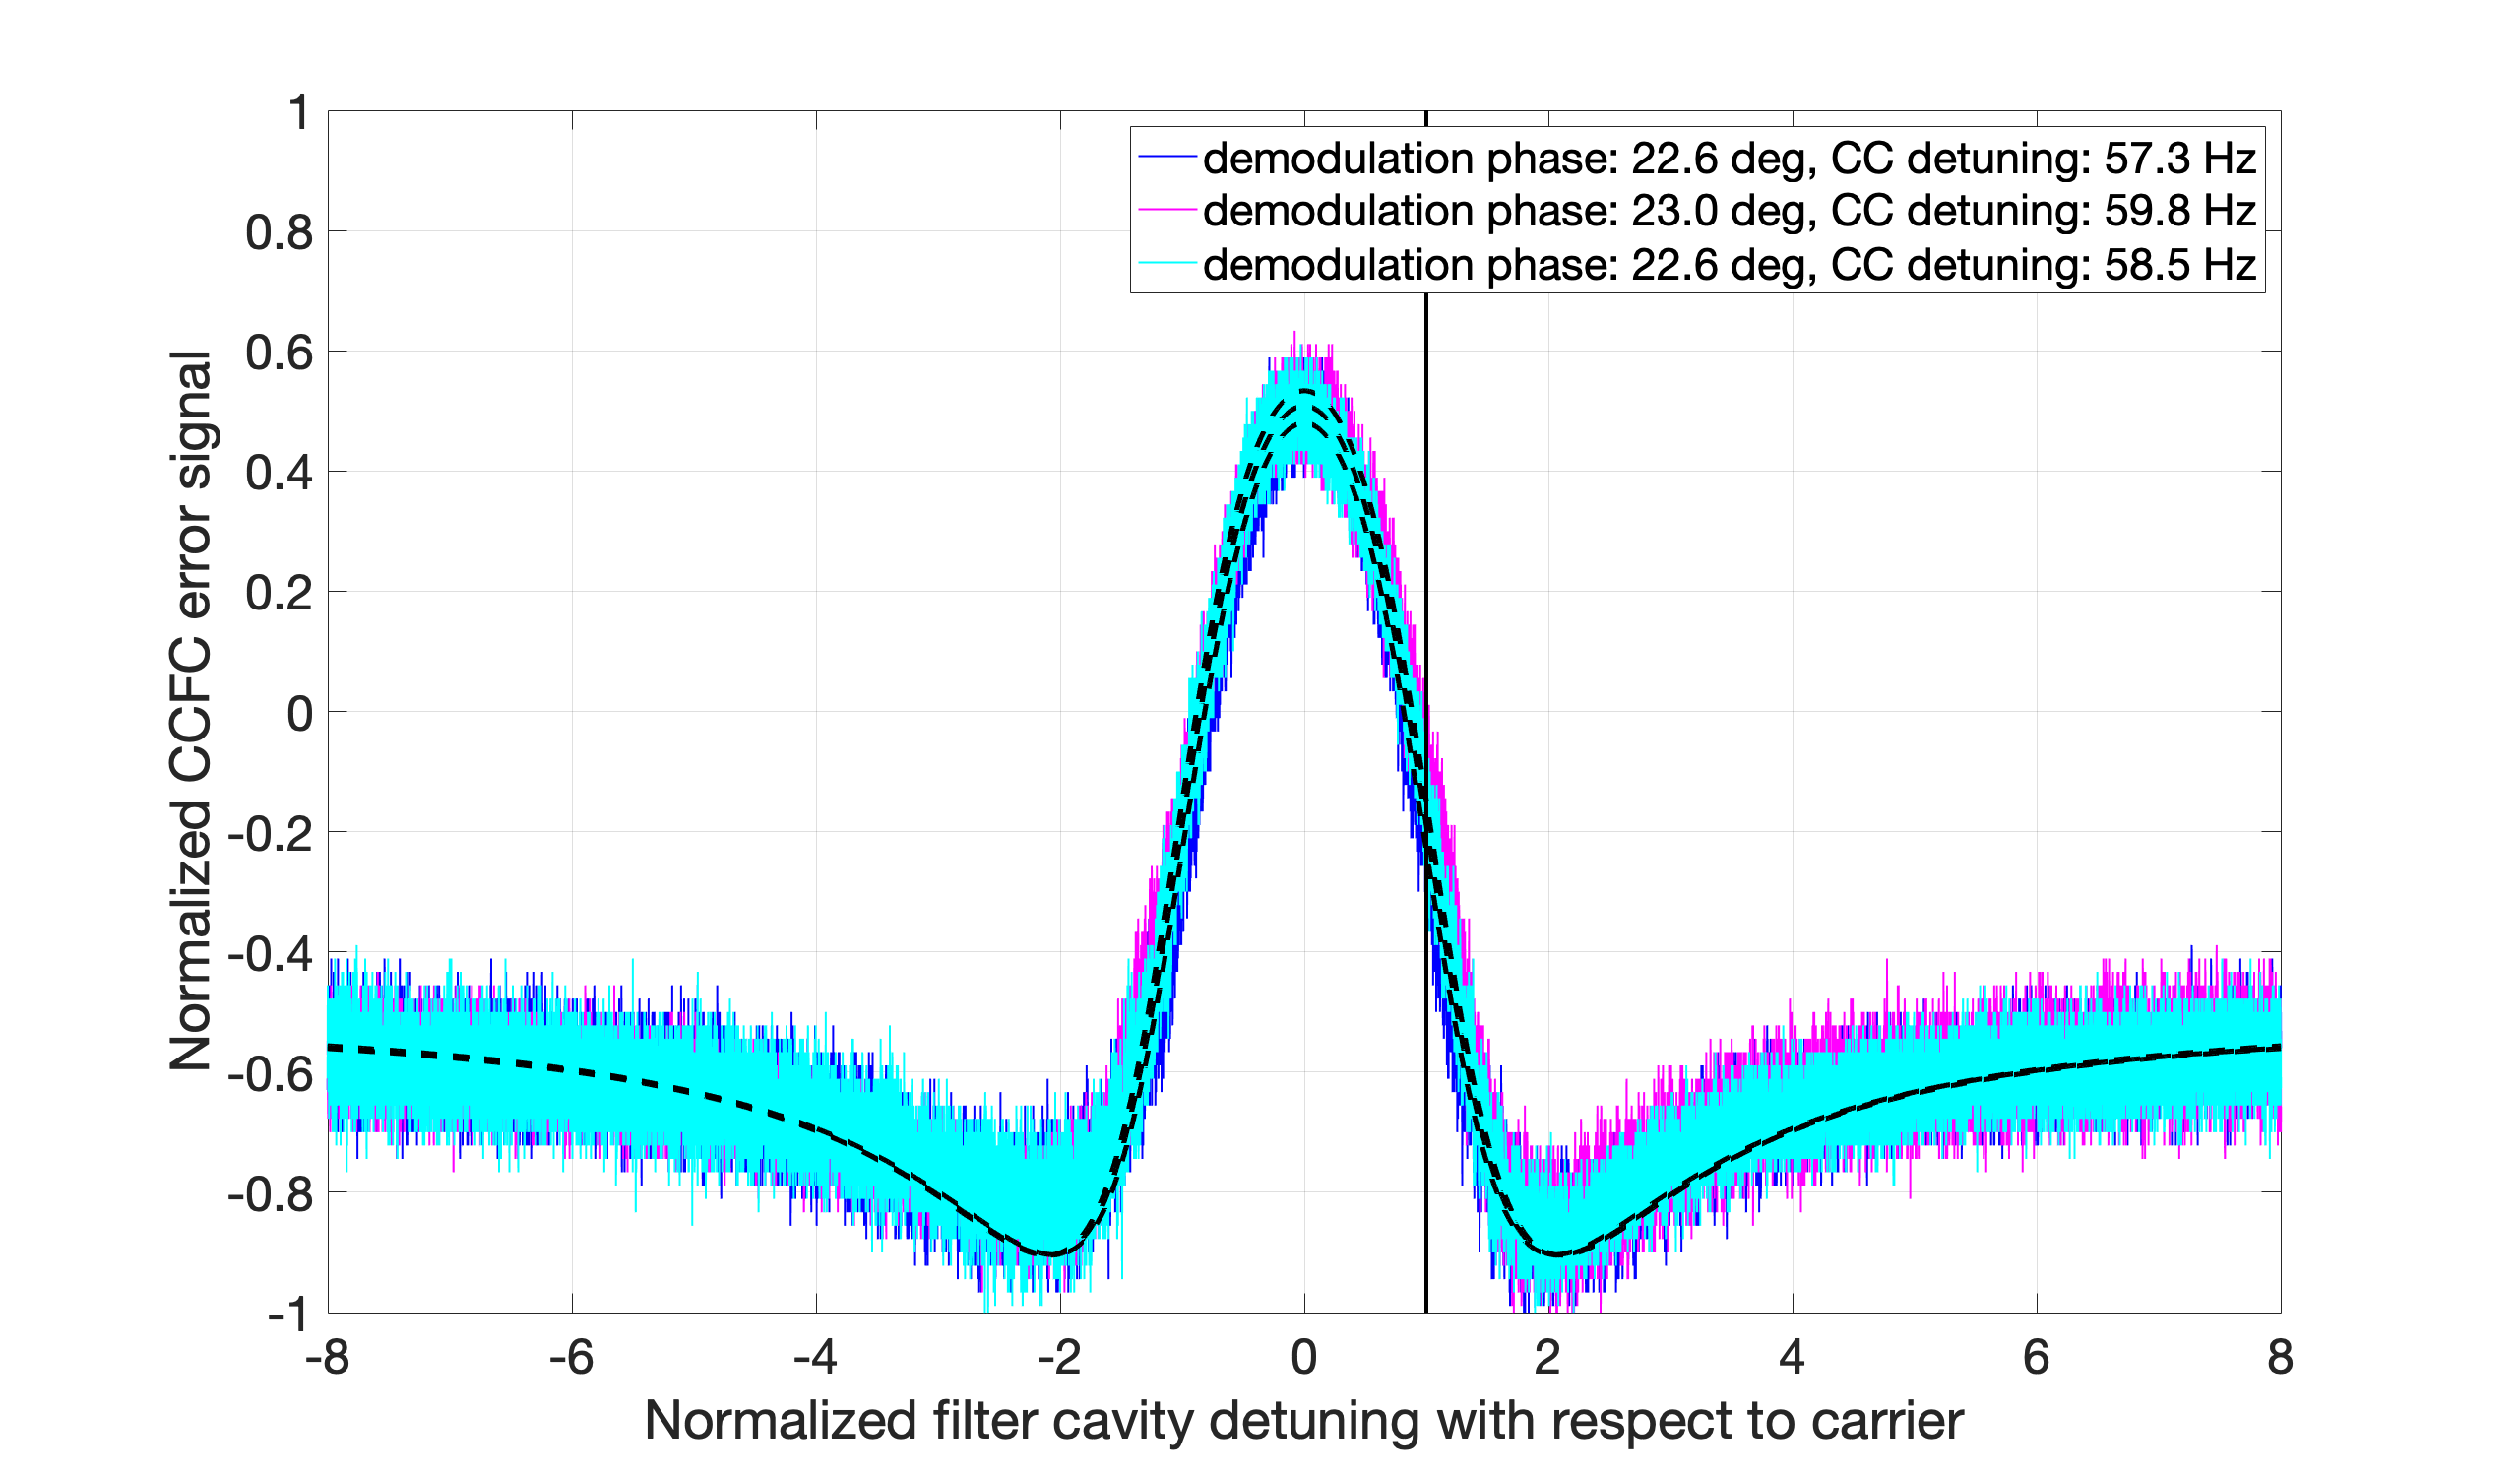
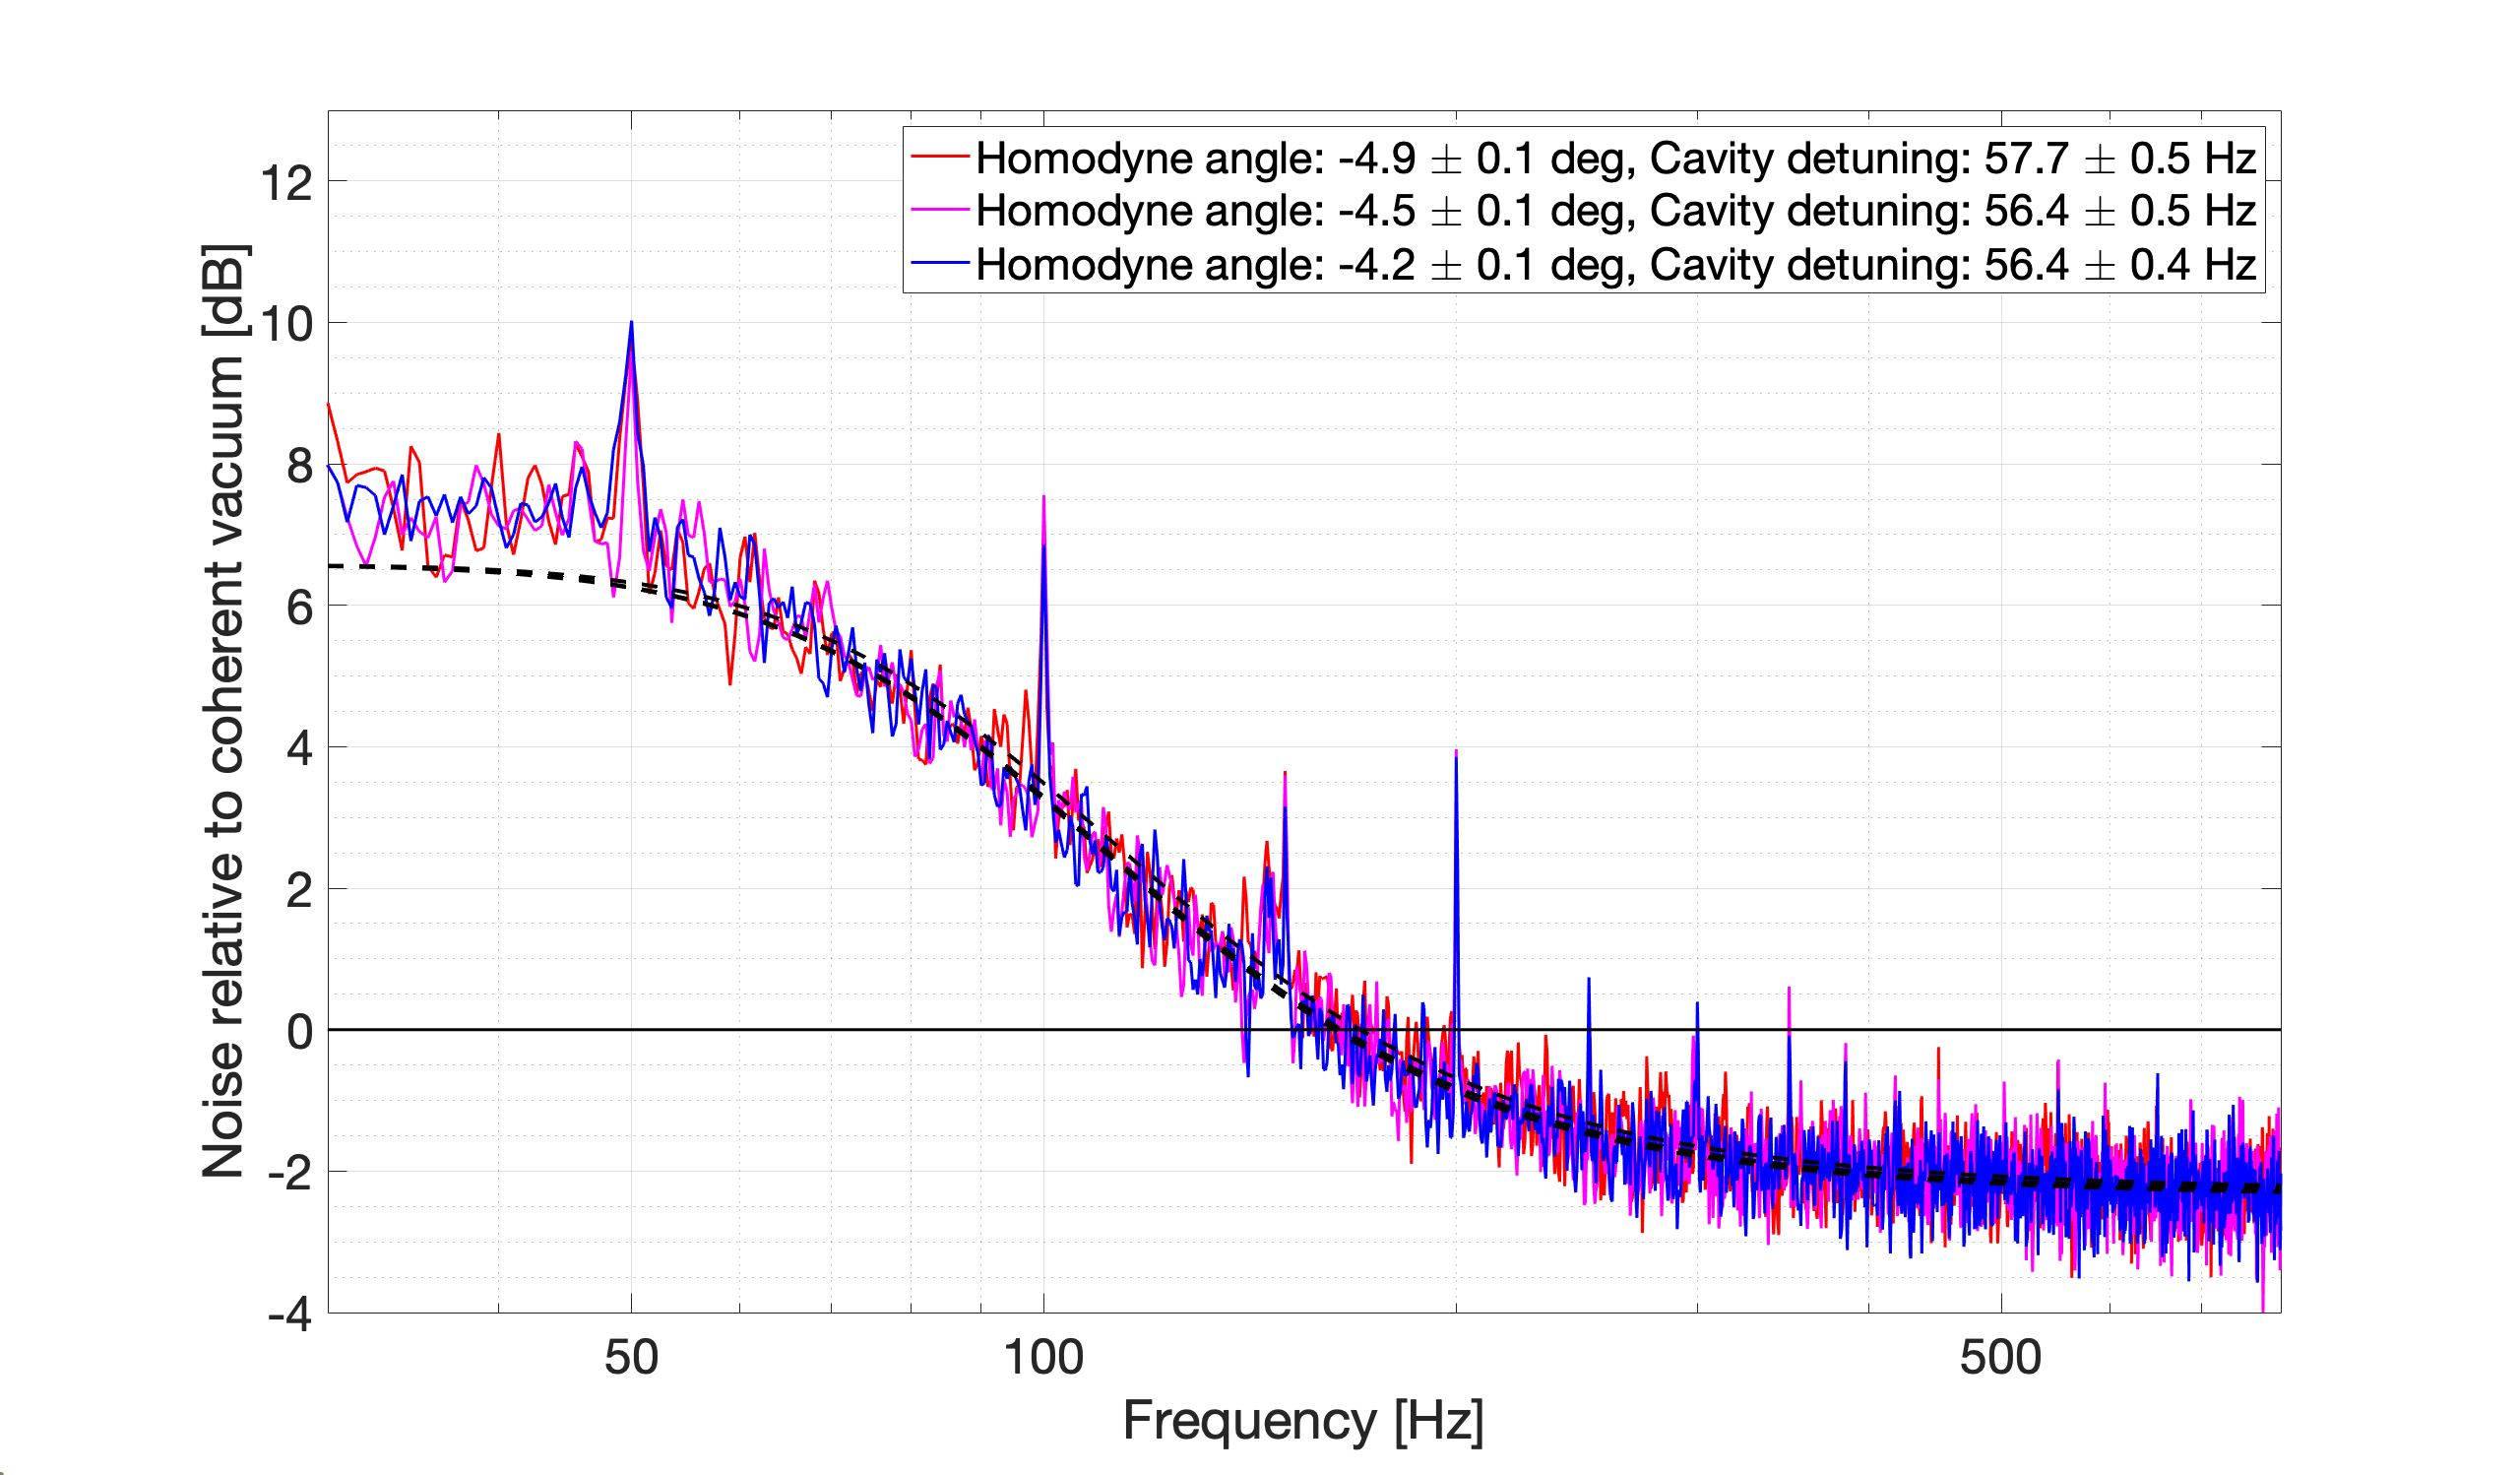
To investigate the detuning stability, we fixed the homodyne angle to squeezing quadrature and measured CCFC error signal and FDS three times with half an hour interval (attached figures). As you can see, the CCFC error signal and FDS are stable and the detuning fluctuation is ~2Hz.
The strange thing is that although the CC detuning is almost optimal, the CCFC error signal with demodulation phase of 23deg seems good detuning for FDS.
A similar measurement was done in elog2350, I and Michael got quite similar result even with a time scale of 1 hour. However, if I remember and understand well, Aso-san had a comment that different homodyne angle may affect our measurement, which is what we have seen. It seems important to understand why detuning becomes not so stable if we measure with different homodyne angle.
However, the same measurement may be interesting to be made for without CCFC but with AA/pointing.
This 15Hz peak can be also amplitude noise.
To better calibrate, probably we should move slowly the pointing loop offset and see how much BS oplev signal response.
In this measurement, PR pointing loop was used instead of BS pointing. The detuning fluctuation is still ~10Hz.
sqz_dB = 10.7; % produced SQZ (dB)
L_rt = 120e-6; % FC losses
L_inj = 0.31; % Injection losses
L_ro = 0.24; % Readout losses
A0 = 0.05; % Squeezer/filter cavity mode mismatch
C0 = 0.05; % Squeezer/local oscillator mode mismatch
ERR_L = 1e-12; % Lock accuracy (m)
ERR_csi = 30e-3; % Phase noise (rad)
Note: In this calculation, shot noise level is assumed to be -133.2 dBVrms/rtHz, but actually it was -133.7 dBVrms/rtHz. So the result in this log is wrong...
I analyzed again with correct shot noise level (-133.7dBVrms/rtHz) and 12% loss from visibility. The readout loss includes 12% loss from visibility, 2% loss from homodyne (dark noise, quantum efficiency, AR), and 20% loss from pick off BS.
sqz_dB = 11.8; % produced SQZ (dB)
L_rt = 120e-6; % FC losses
L_inj = 0.32; % Injection losses
L_ro = 0.31; % Readout losses
A0 = 0.05; % Squeezer/filter cavity mode mismatch
C0 = 0.06; % Squeezer/local oscillator mode mismatch
ERR_L = 1e-12; % Lock accuracy (m)
ERR_csi = 30e-3; % Phase noise (rad)
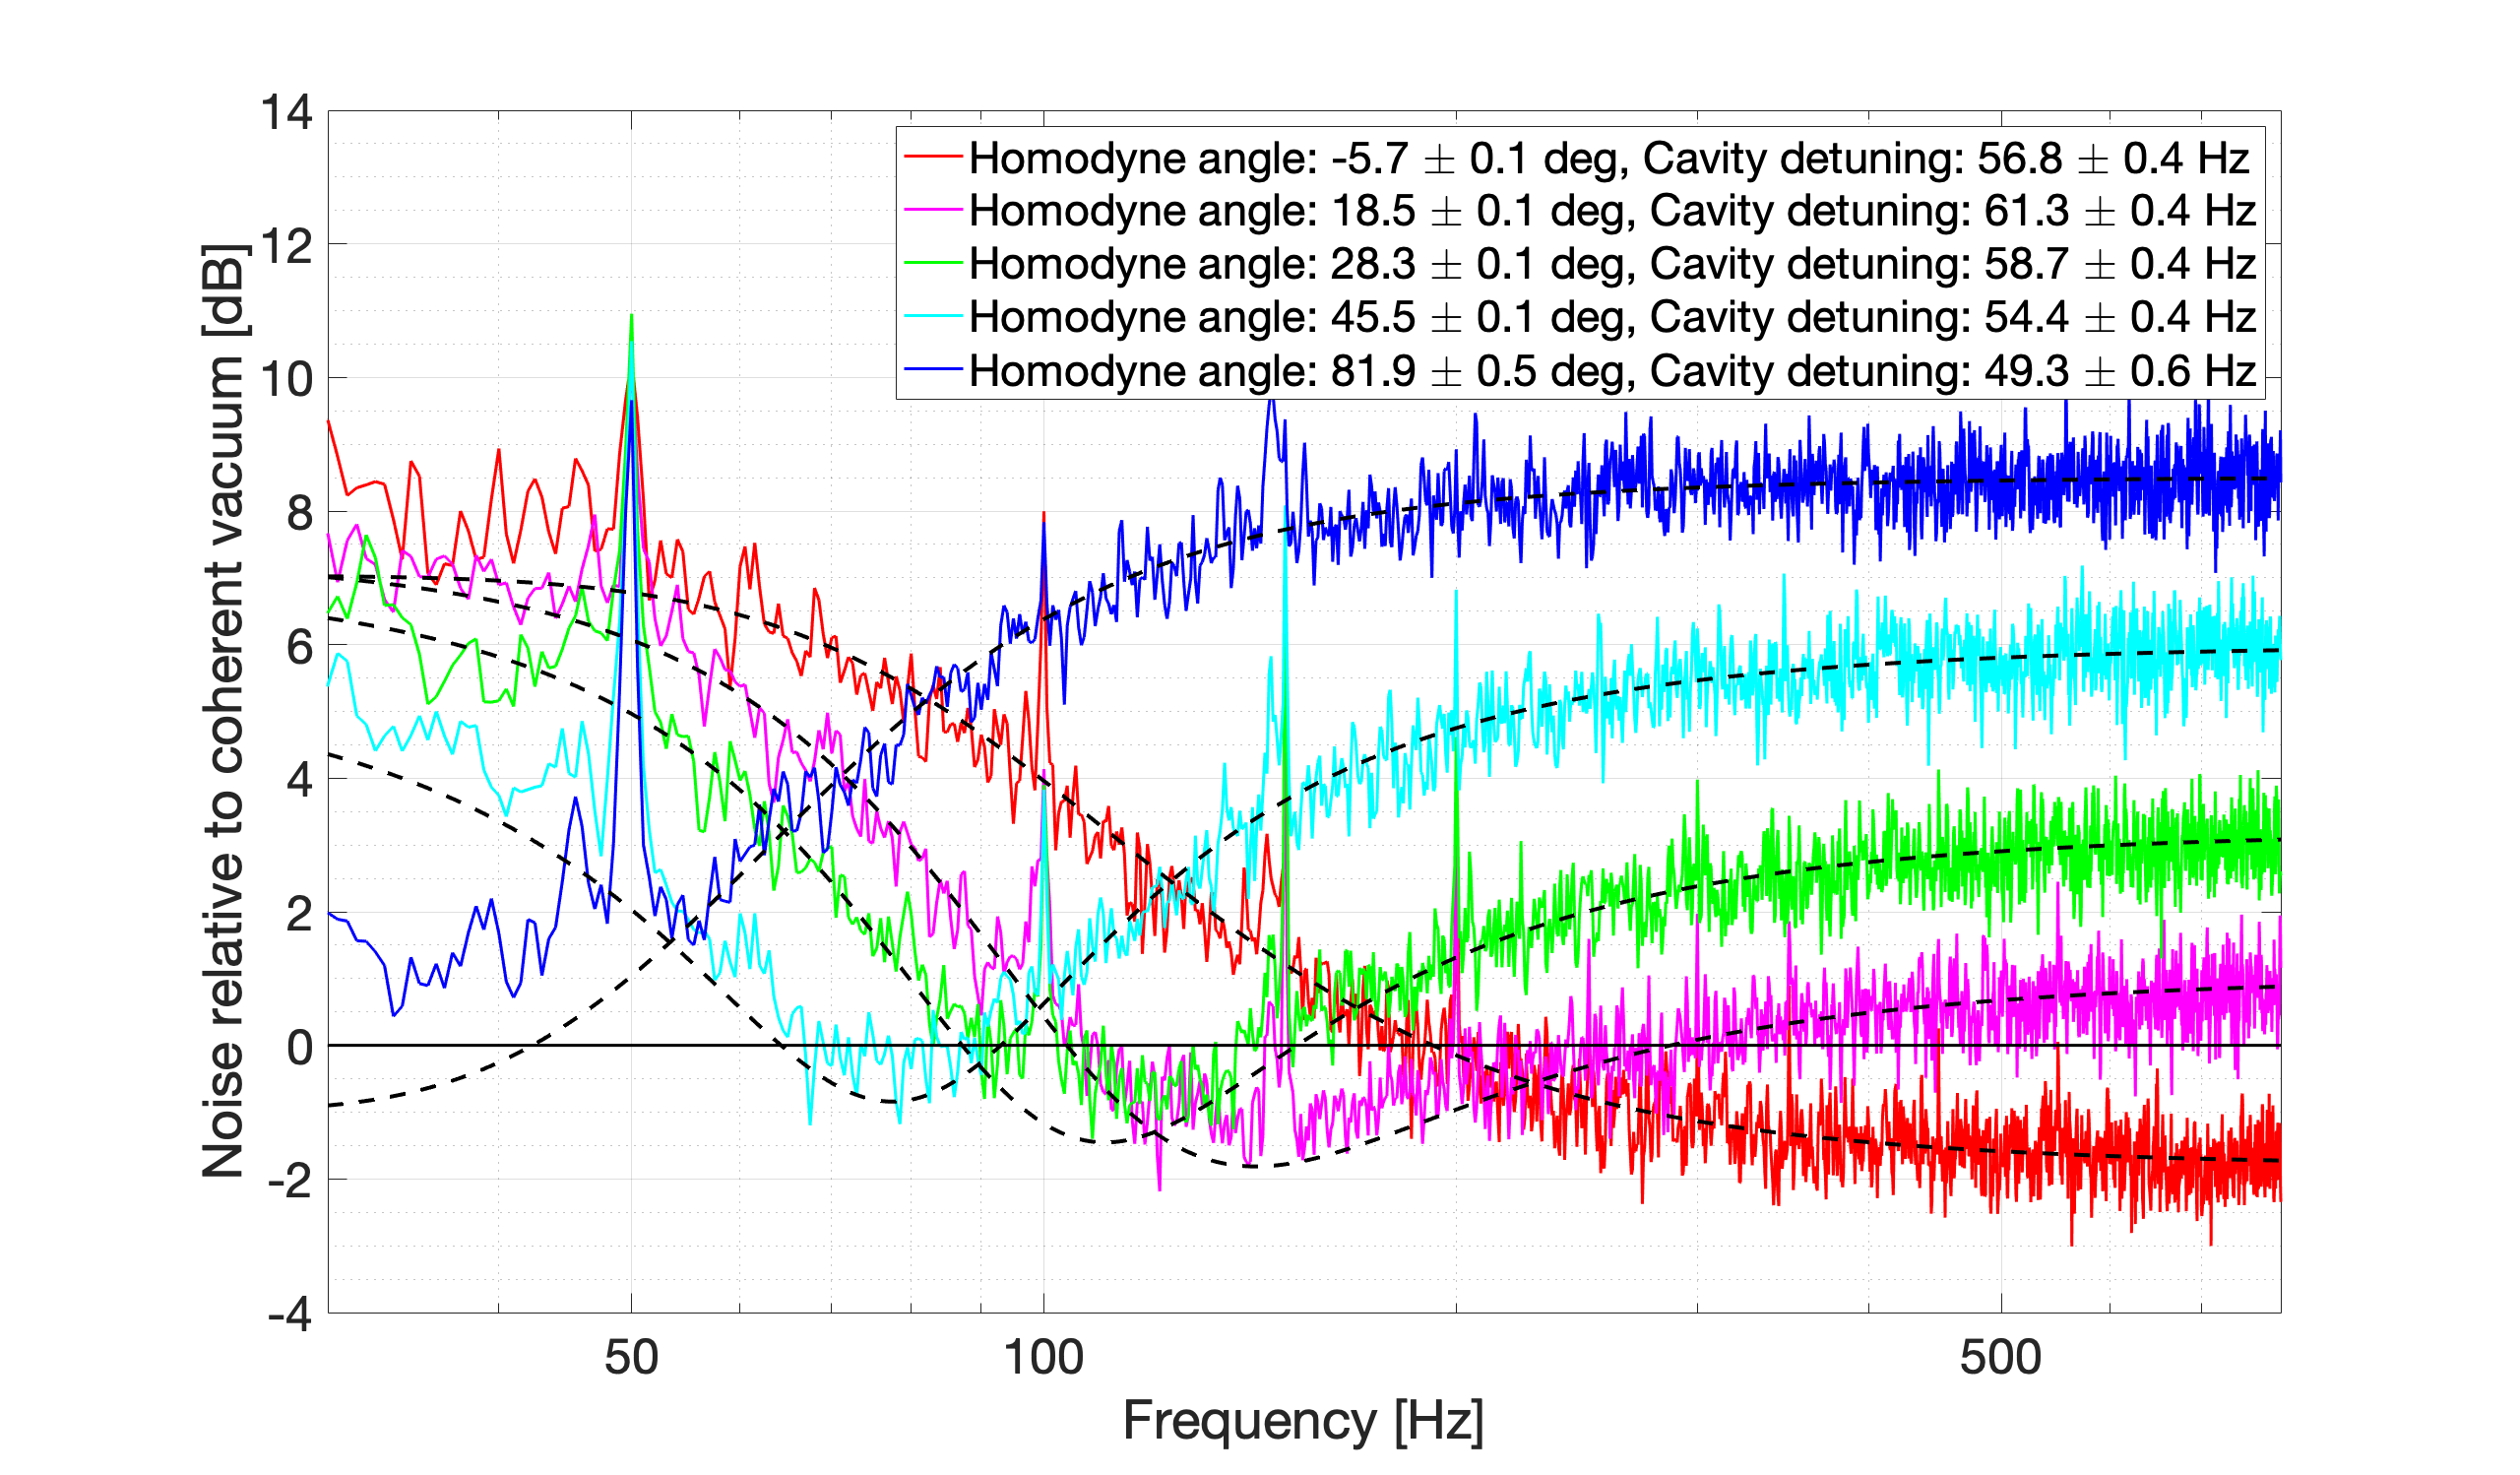
Yuhang and Michael fitted this data with mcmc. However, the detuning fluctuation is larger than that with least square... In this fit, the fit has been started from 60Hz and the detuning fluctuation could be smaller with higher fit starting frequency.
Left: mcmc (detuning: 50-68 Hz)
Right: least square (detuning: 49-61 Hz)
Marc, Michael and Yuhang
The pointing loop control precision is an important parameter, which tells us the light beam spot moving range on filter cavity end mirror. The beam pointing loop is a very slow loop. To measure this beam pointing precision, we need to measure the error signal of this loop.
1. Calibration
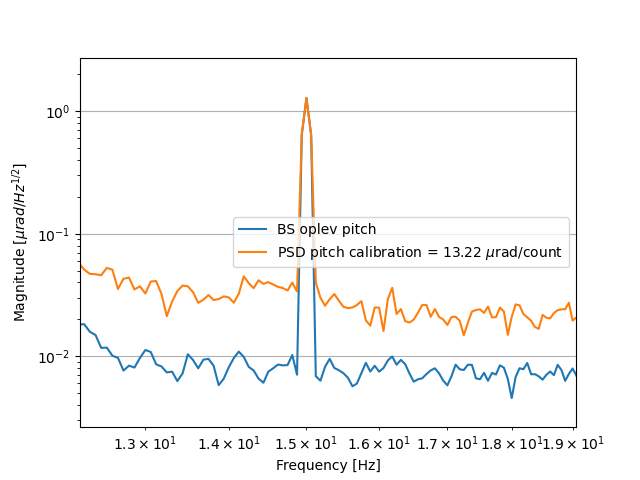
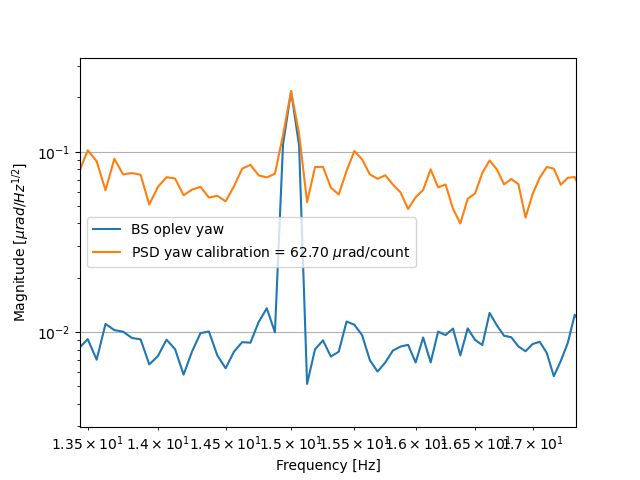
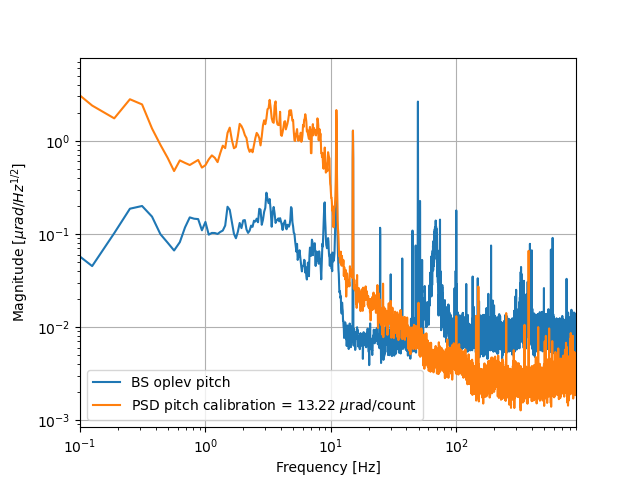
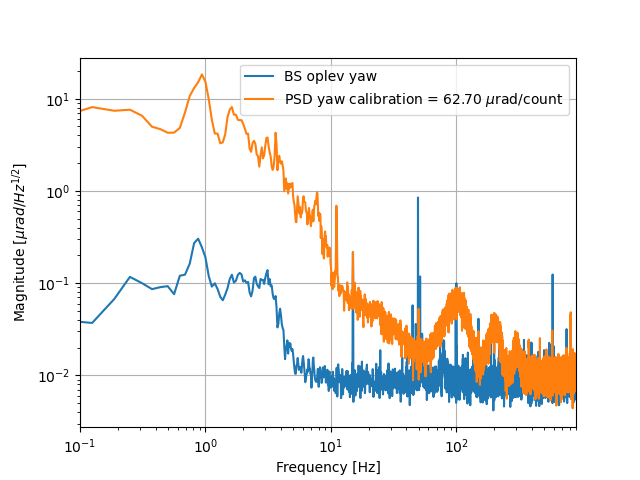
We did calibration by sending a line for BS pitch/yaw. By overlapping BS oplev signal line and FC transmission PSD line, we can calibrate PSD pointing to the base of BS. The BS oplev calibration is from Eleonora elog1874. Attached figure 1 and 2 show this overlap and the calibration factor of PSD.
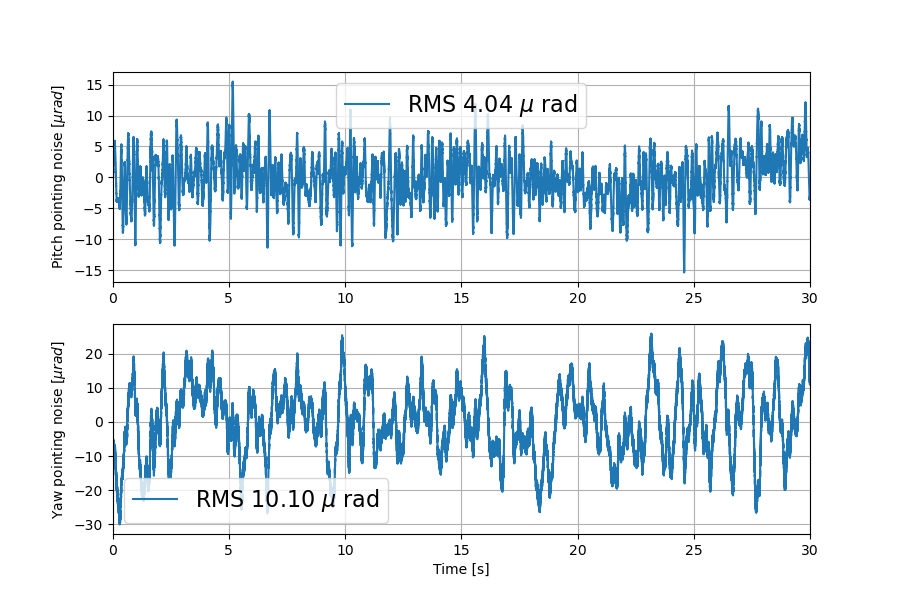
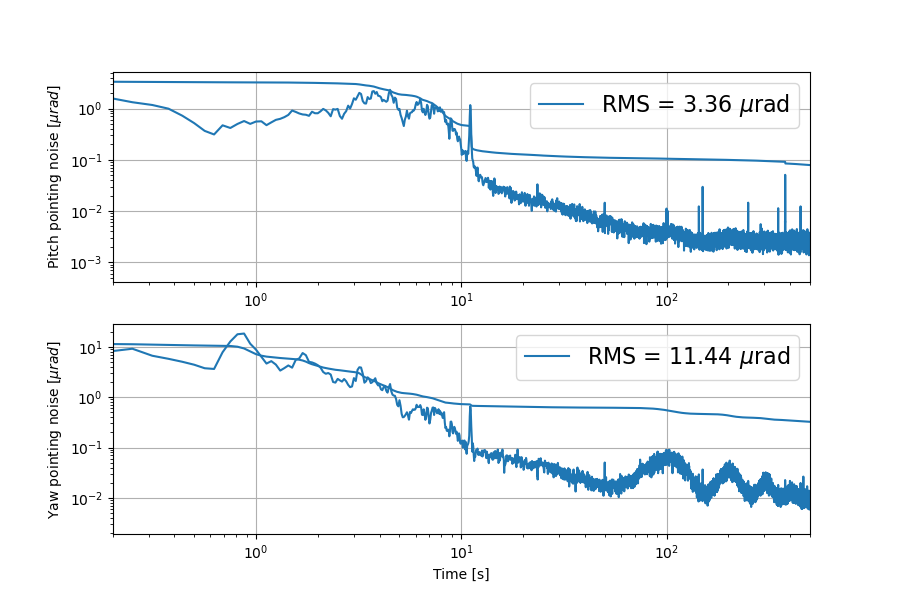
2. Pointing precision
We took time series and spectrum of pointing loop error signal. By using calibration factor, we found our pointing precision for pitch is 4.04urad, for yaw is 10.10urad (from time series measurement). From spectrum measurement, pitch precision is 3.36urad, yaw precision is 11.44urad.
Remarks:
1. This measurement is done with PR and BS oplev open. Now the PR/BS oplevs are noisy above 10Hz, the closing of oplev loop may introduce noise but the resonance peak should be anyway reduced. It will be interesting to compare the pointing noise when PR/BS oplev is on/off.
2. This measurement is doen when BS pointing is closed. It has been found that pointing introduces noise for BS oplev when pointing loop acts on BS. So it will also be interesting to do the same measurement when pointing loop acts on PR.
3. Attached figure 5 and 6 show the comparison of BS oplev pitch/yaw and FC transmission PSD pitch/yaw. We can see PSD signal is higher than oplev after calibration, which means there are other noise sources are dominating PSD signal instead of BS pointing.
This 15Hz peak can be also amplitude noise.
To better calibrate, probably we should move slowly the pointing loop offset and see how much BS oplev signal response.
Marc, Michael, and Yuhang
We have done a calibration for pointing loop with a new method. We move the locking point of pointing loop and check how much BS needs to compensate.
Pointing pitch:
we move pointing pitch, as attached figure 1 [1,0] subplot, from -24 to -34 [counts]. Then we found BS pitch, as attached figure 1 [0,0] subplot, needs to move from 275.8 to 326.0 [counts] to compensate. Taking into account the calbration of oplev, we got calibration factor for pointing loop on the base of BS.
The pointing precision was estimated by a RMS integral of pointing loop error signal spectra. We also found that high frequency spectrum can be better if we center beam on PSD, which is shown in attached figure 1 [0,1] and [1,1] subplots. However, the RMS of these two seneriaos are the same, which is reasonable since the dominating noise is at low frequency. In conclusion, we got pitch pointing precision as 0.43urad.
pitch pointing loop calibration factor 1.3 urad/count.
Pointing yaw:
We have done the pointing yaw calibration in the same manner with pointing pitch. The details can be found in attached figure 2. In conclusion, we got yaw pointing precision of 0.65urad.
yaw pointing loop calibration factor 1.5 urad/count.
Note: to take a quicker measurement, we have increased pointing loop gain by factors of 3 and 5 for pitch and yaw. So you can see the BS compensation finishes within 1 minute. We have also tested the spectrum of poiting pitch/yaw don't show difference when gains are increased.
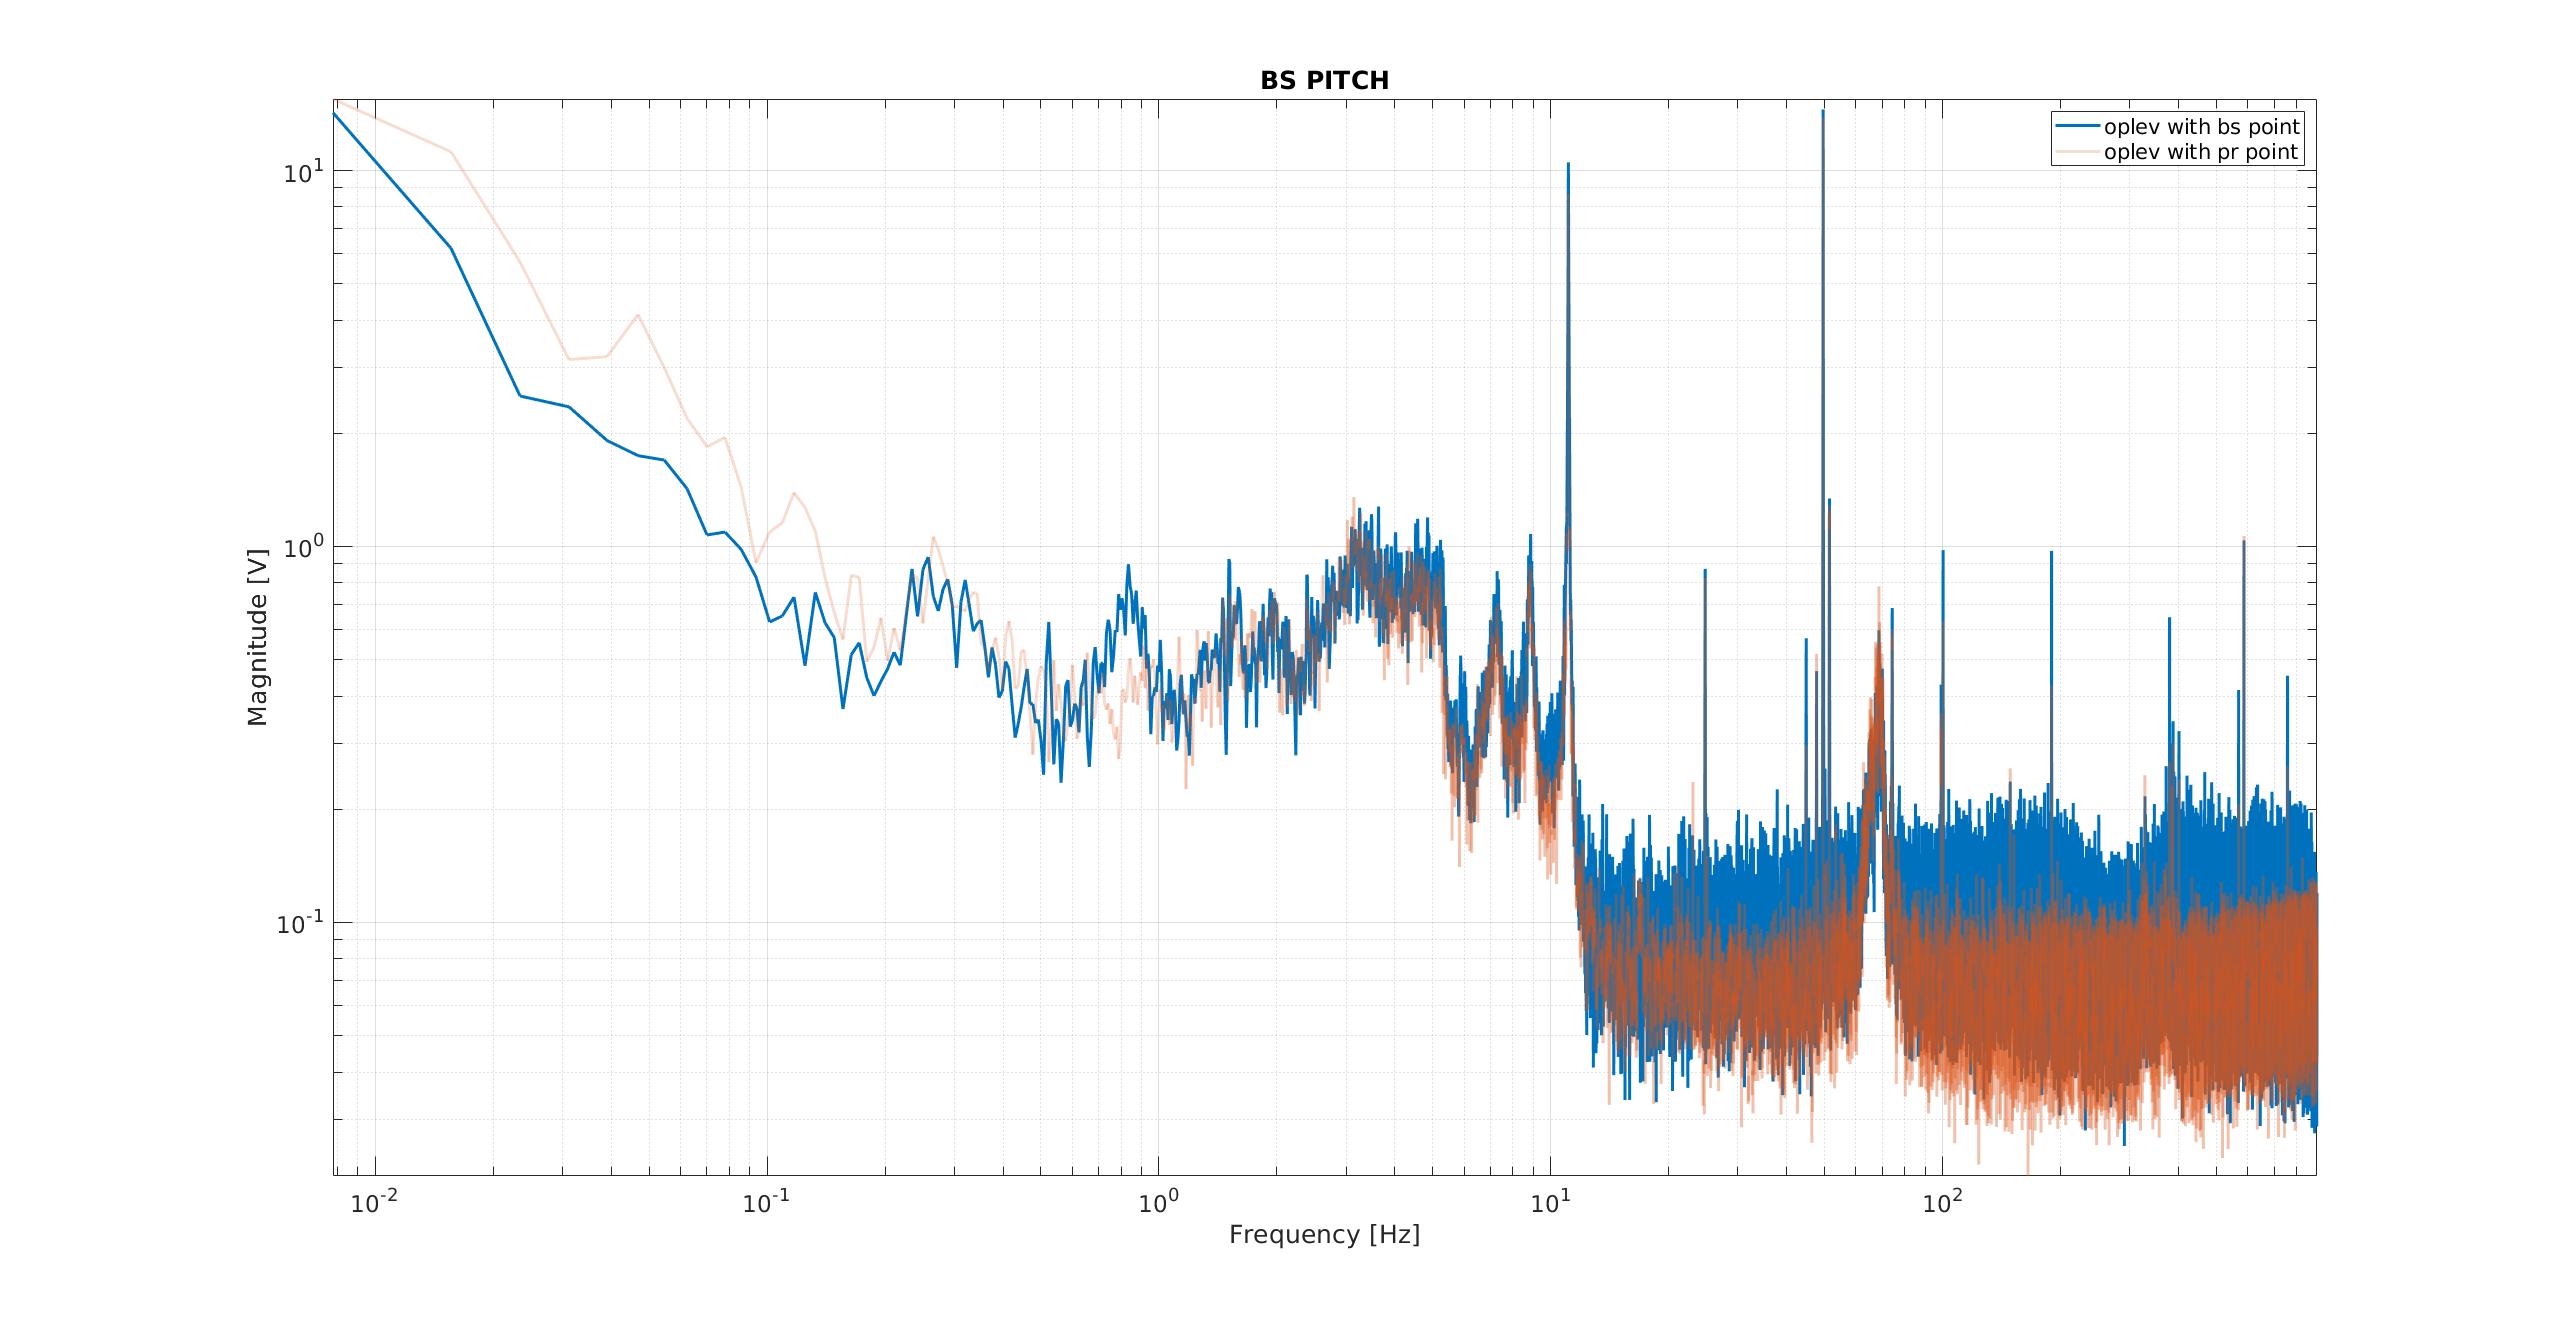
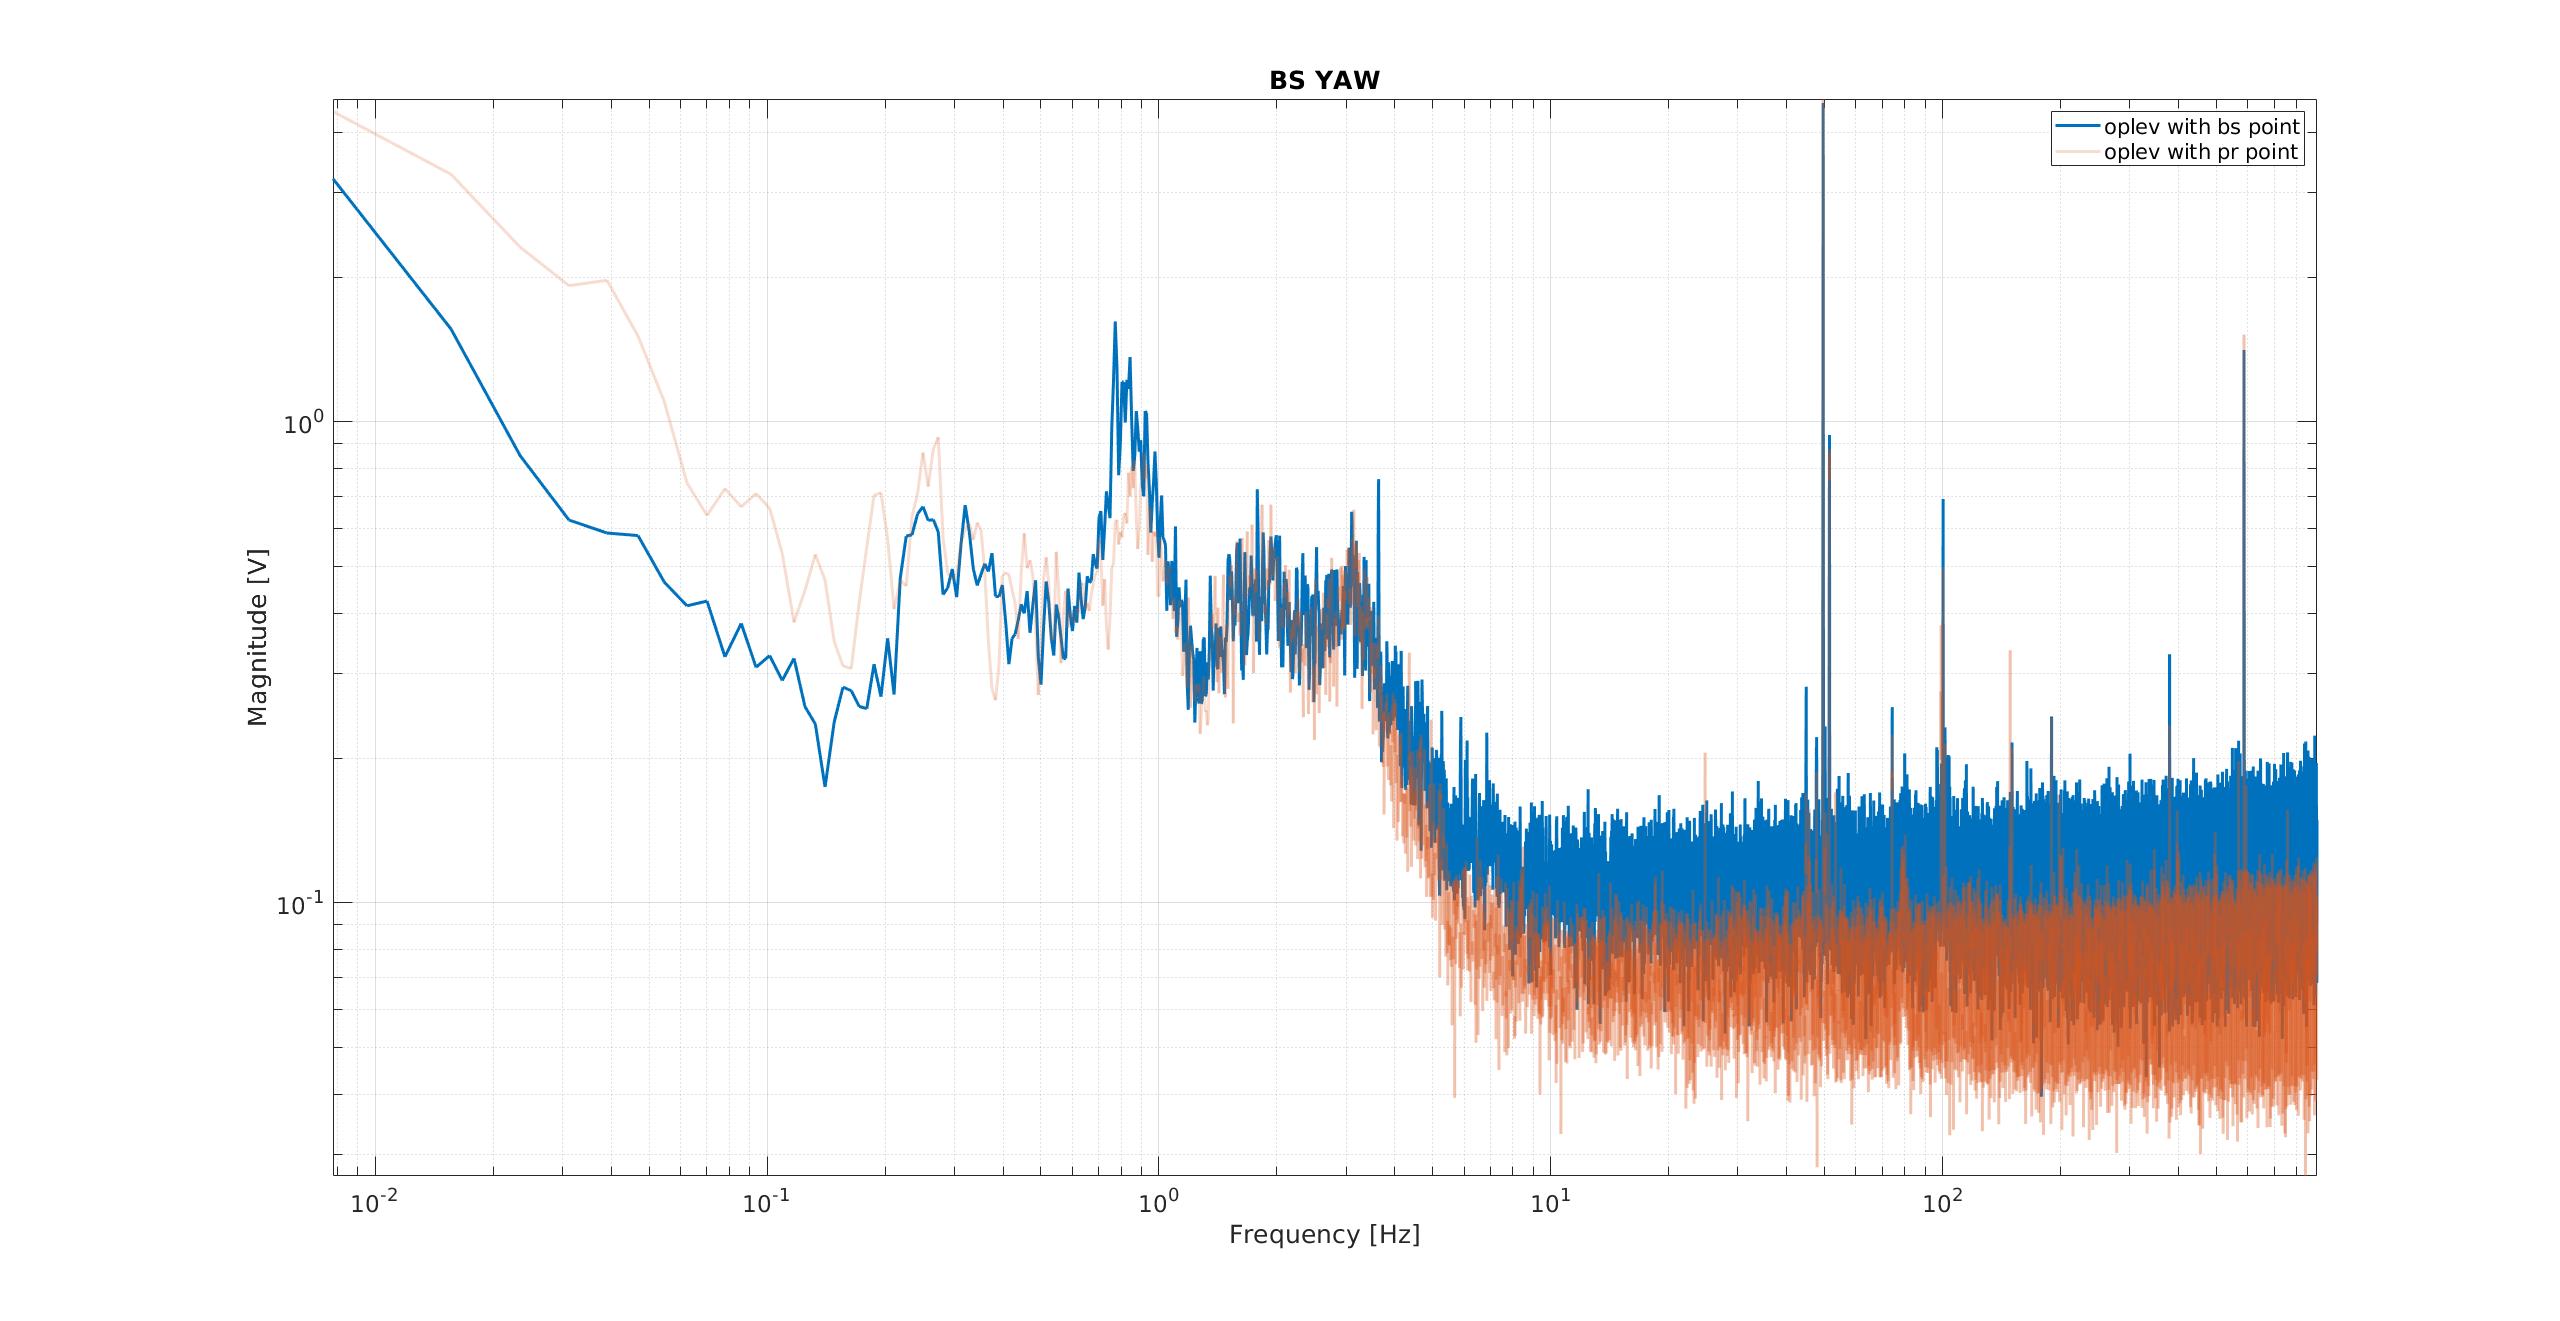
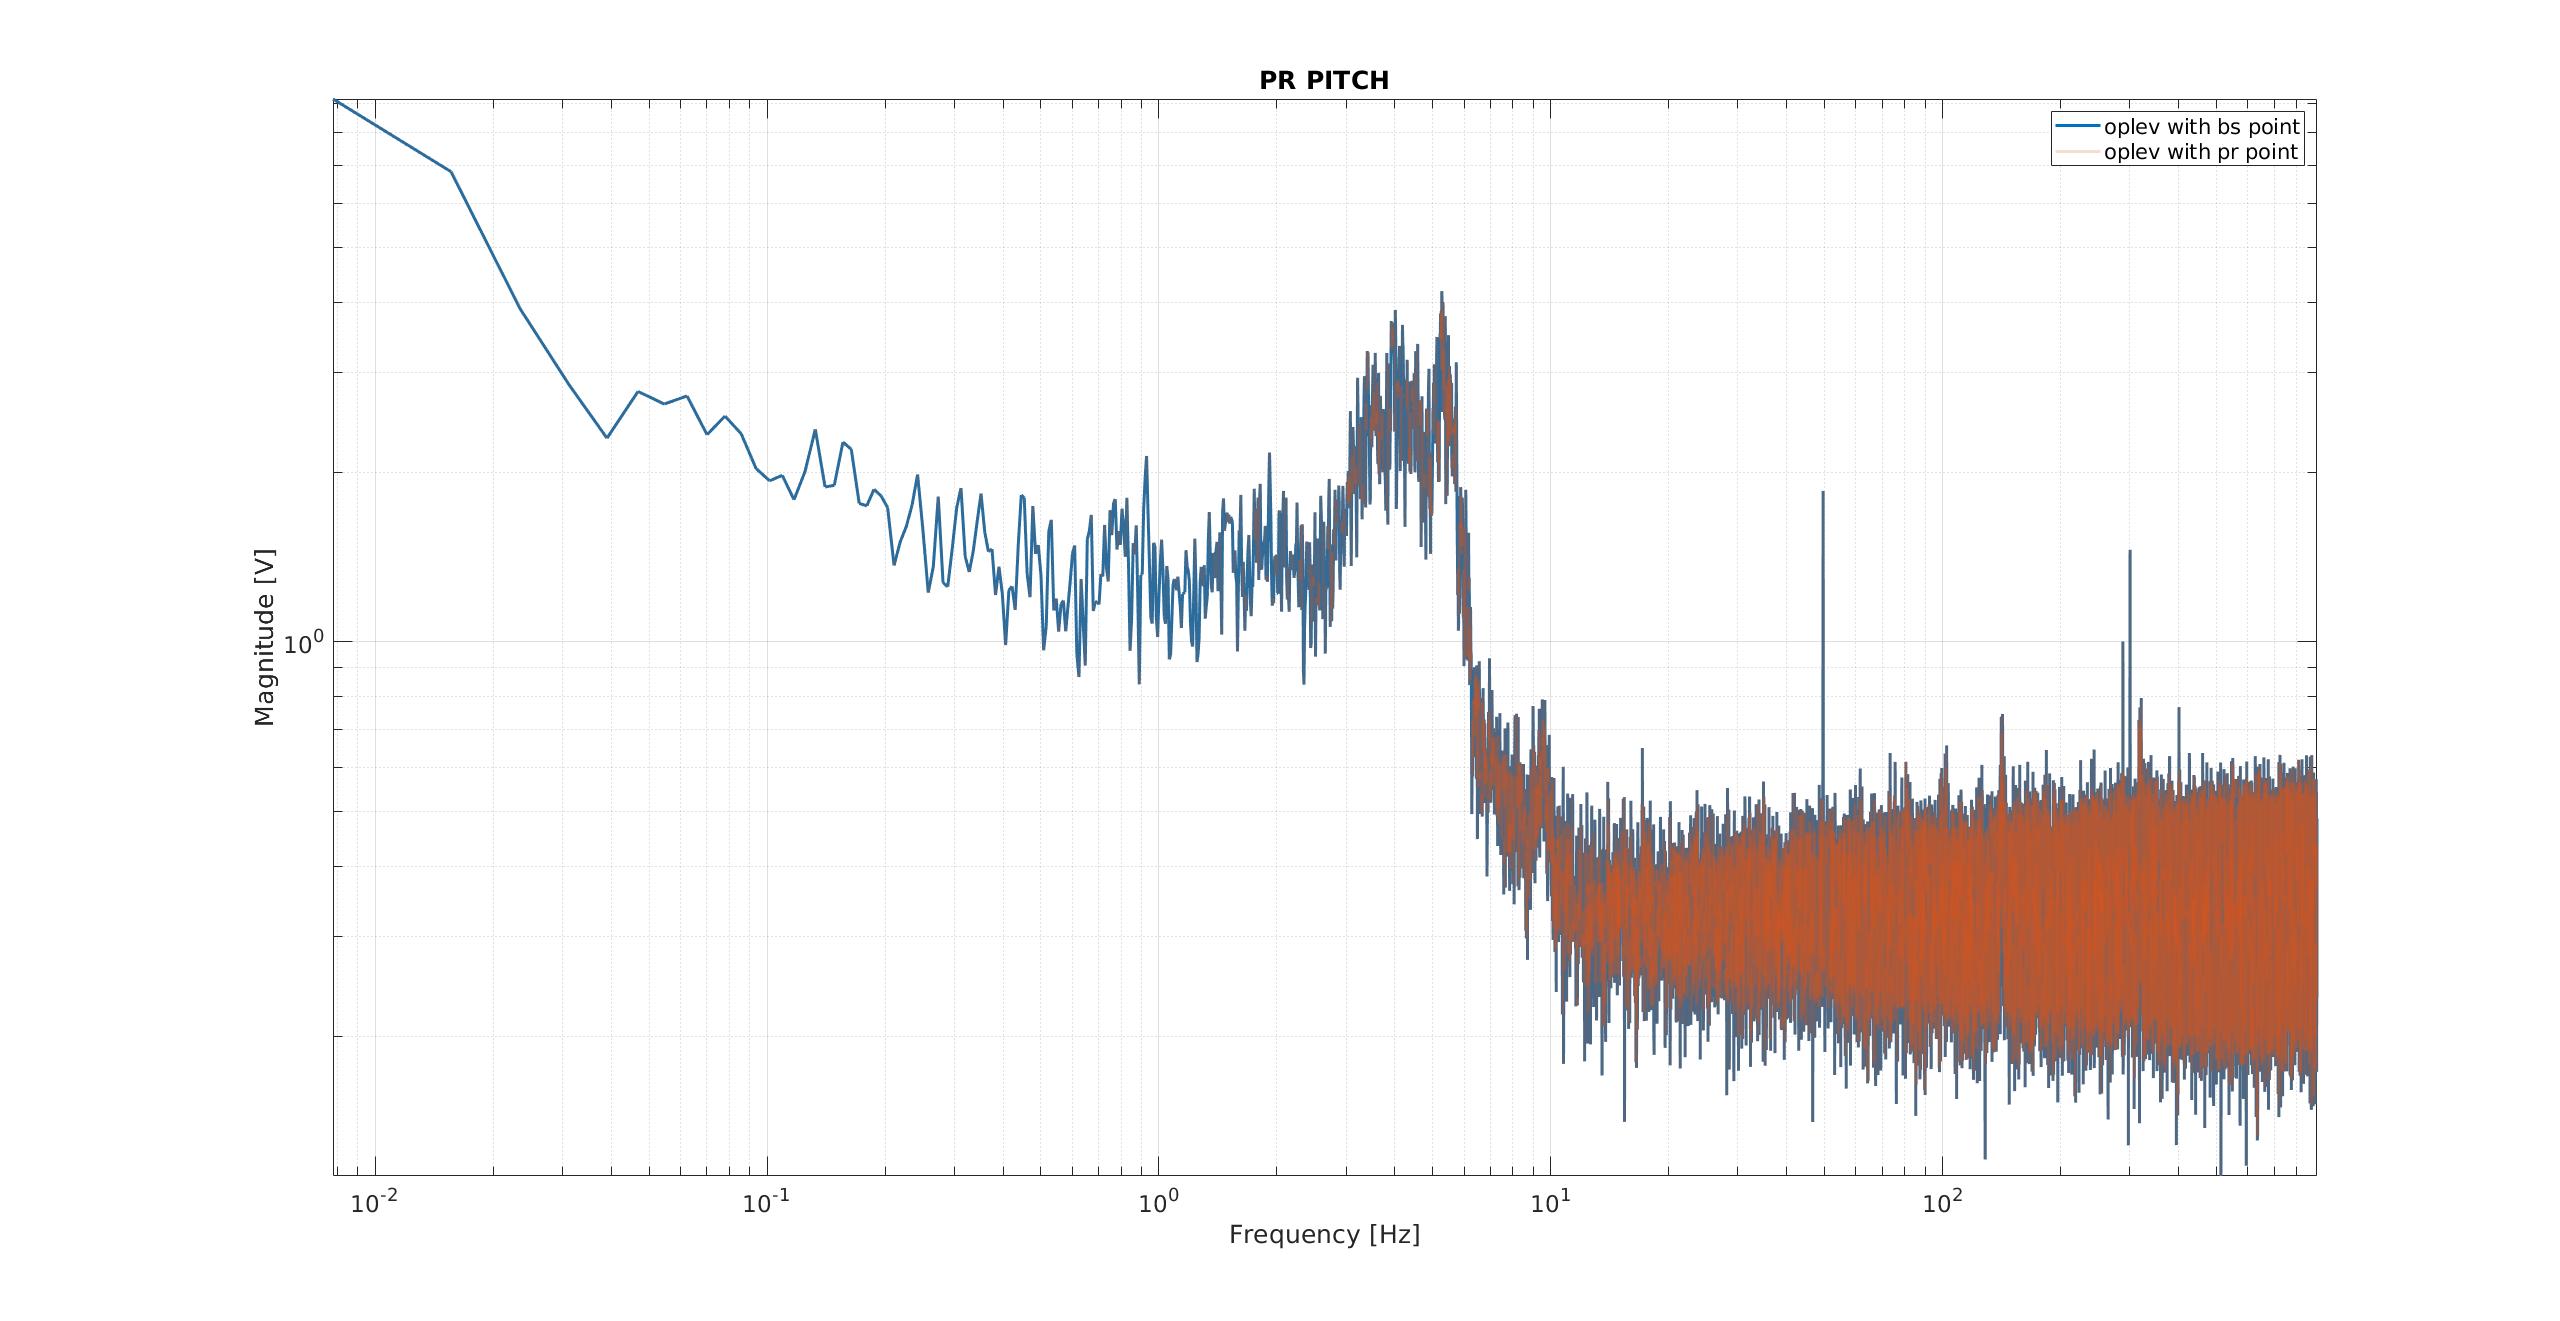
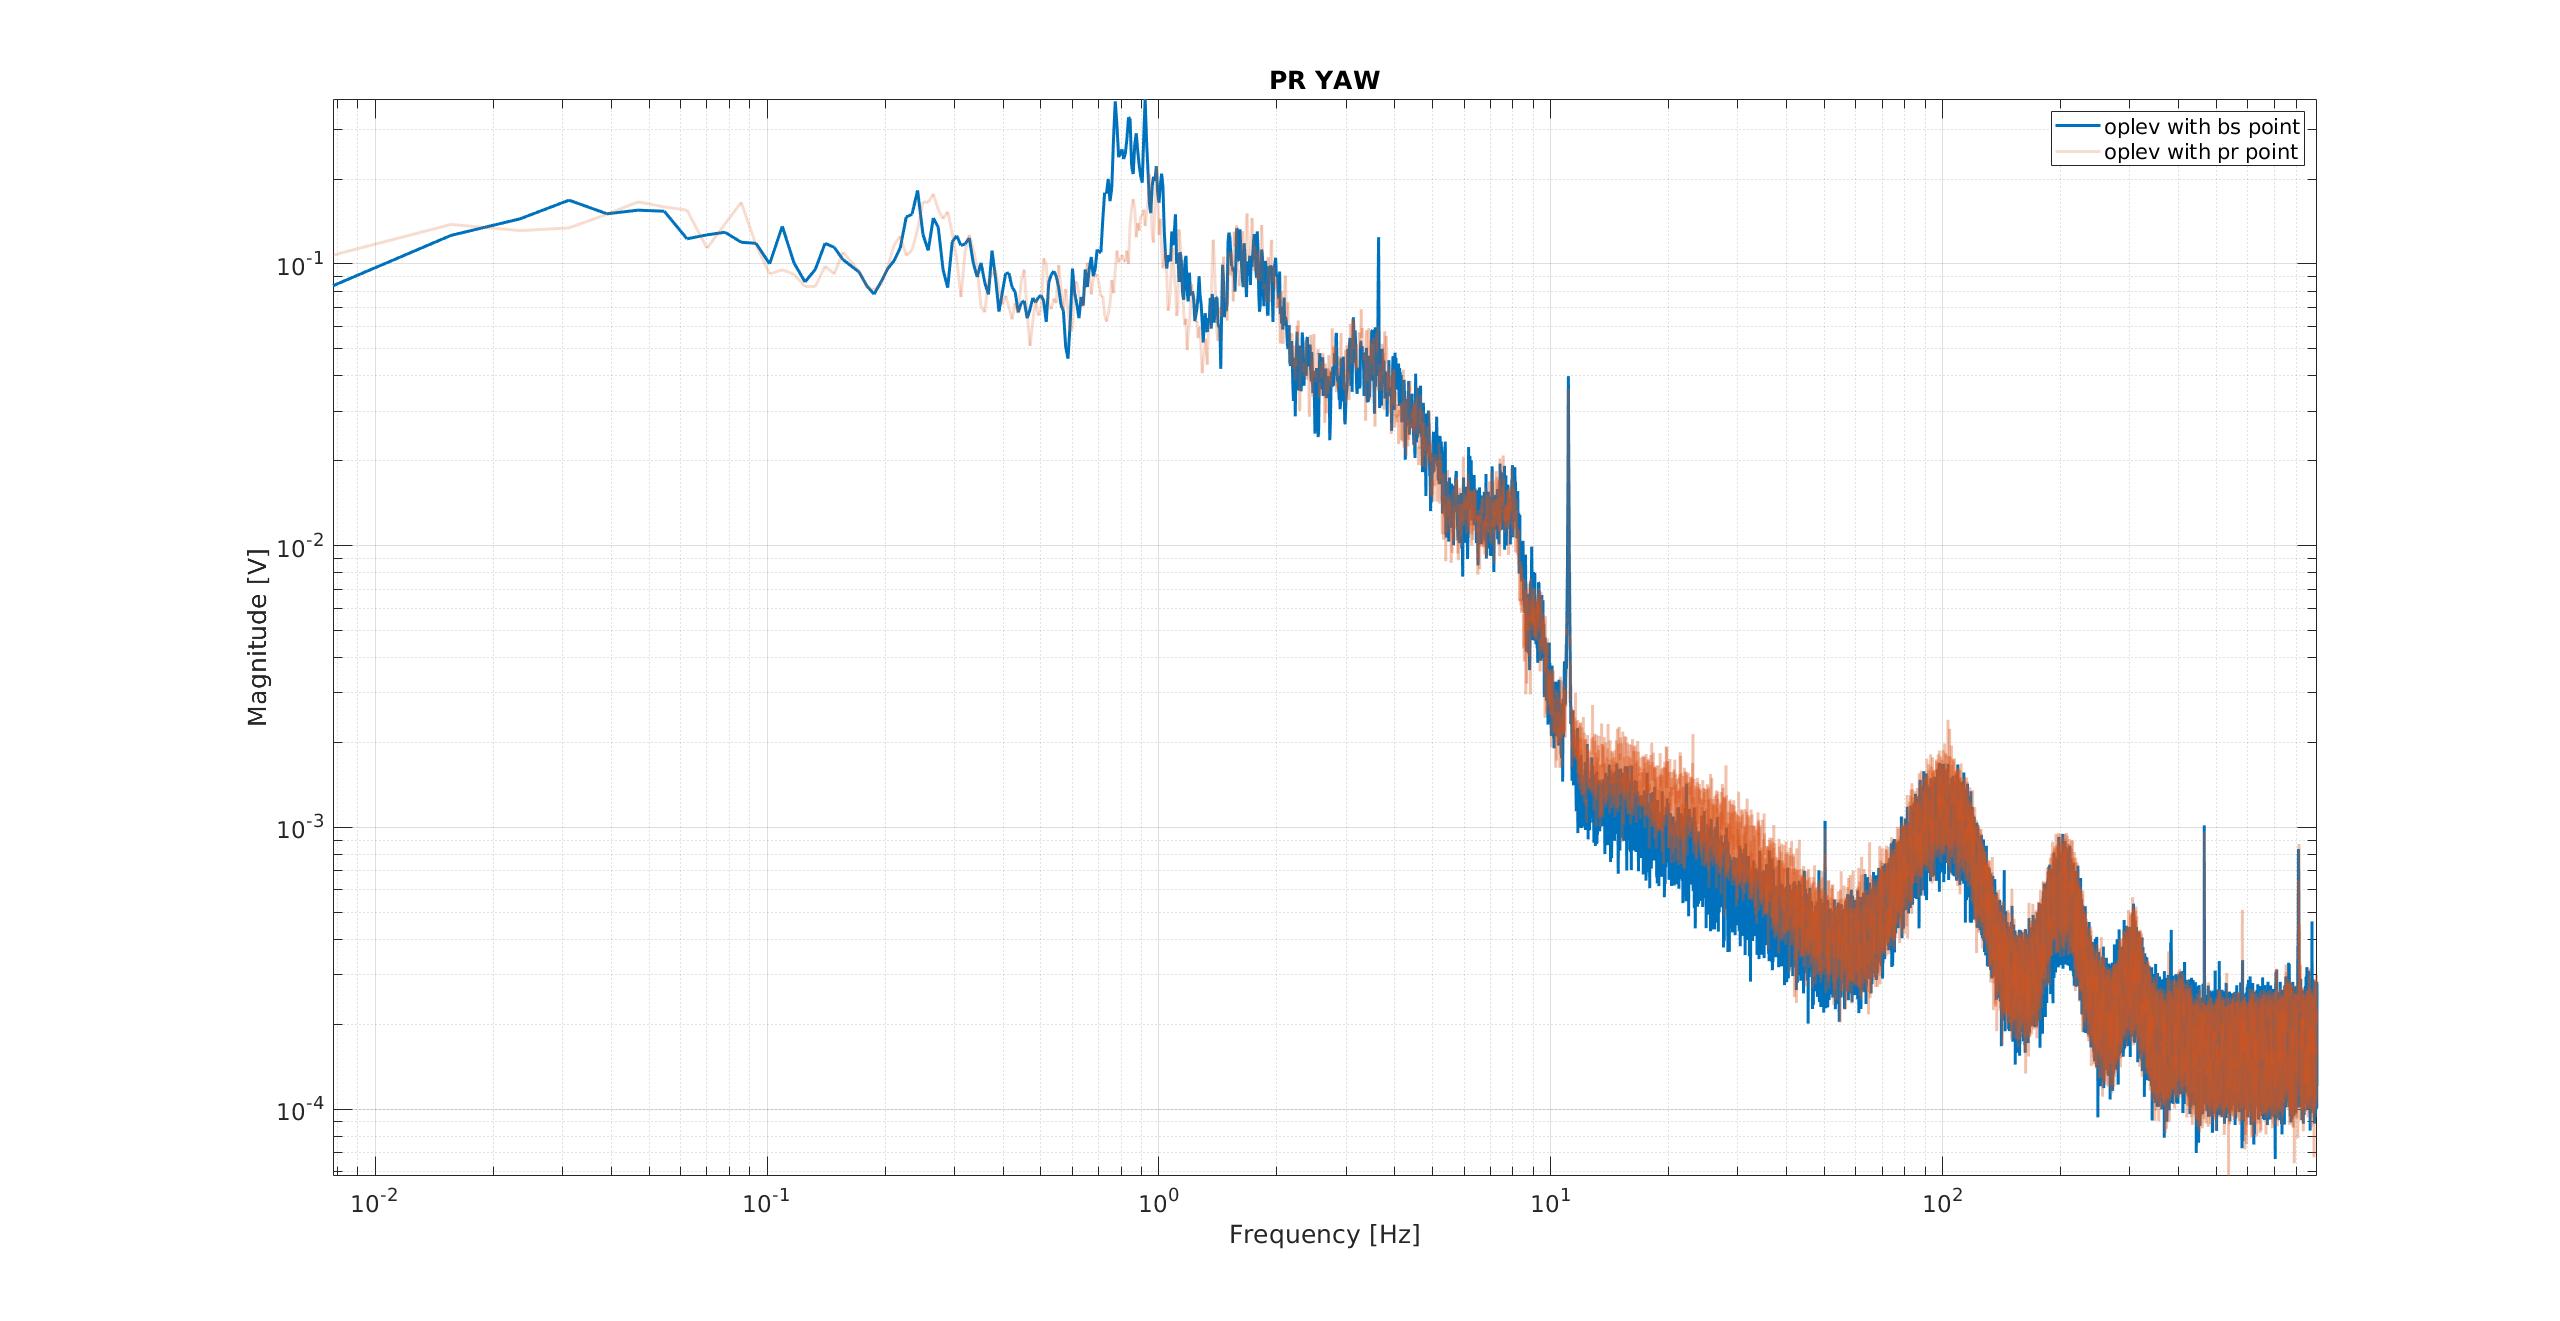
I compared the BS and PR pitch and yaw oplev while either closing the pointing loop on BS or on PR.
It seems that closing the loop on BS is introducing noise on BS pitch and yaw above ~4Hz.
On the other hand, the pointing loop closed on PR only slightly increases PR yaw noise between 1 and 6 Hz.
Therefore it seems better to close the pointing loop on PR from now on.
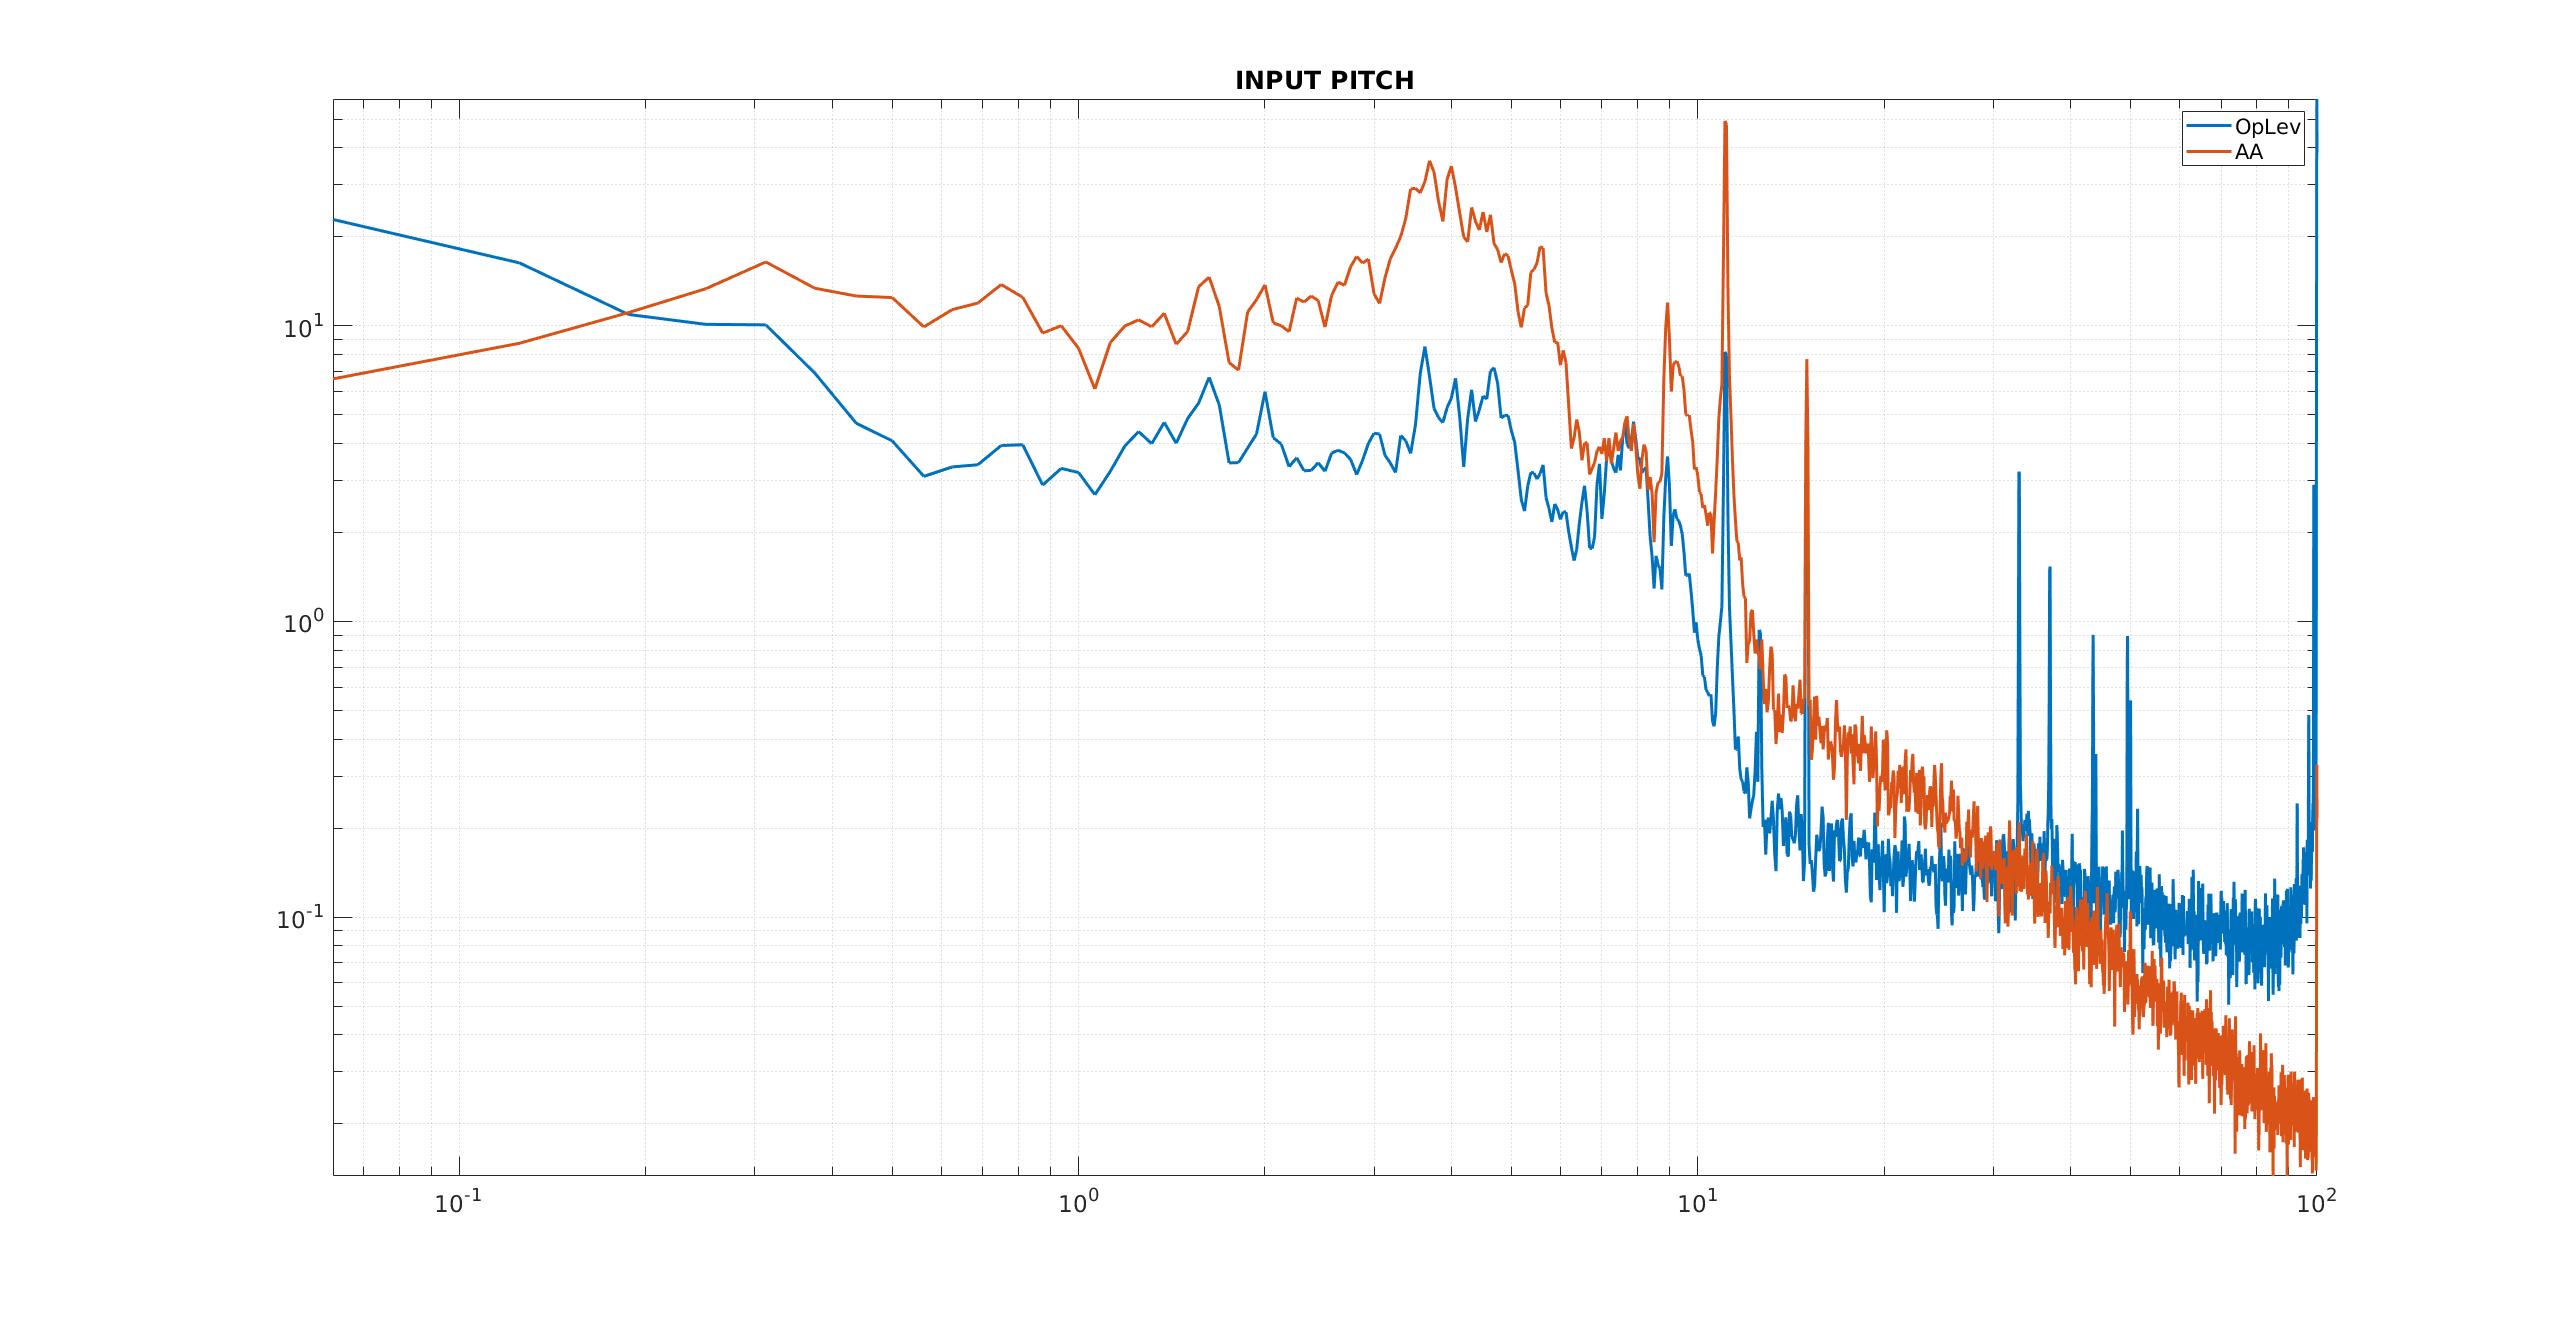
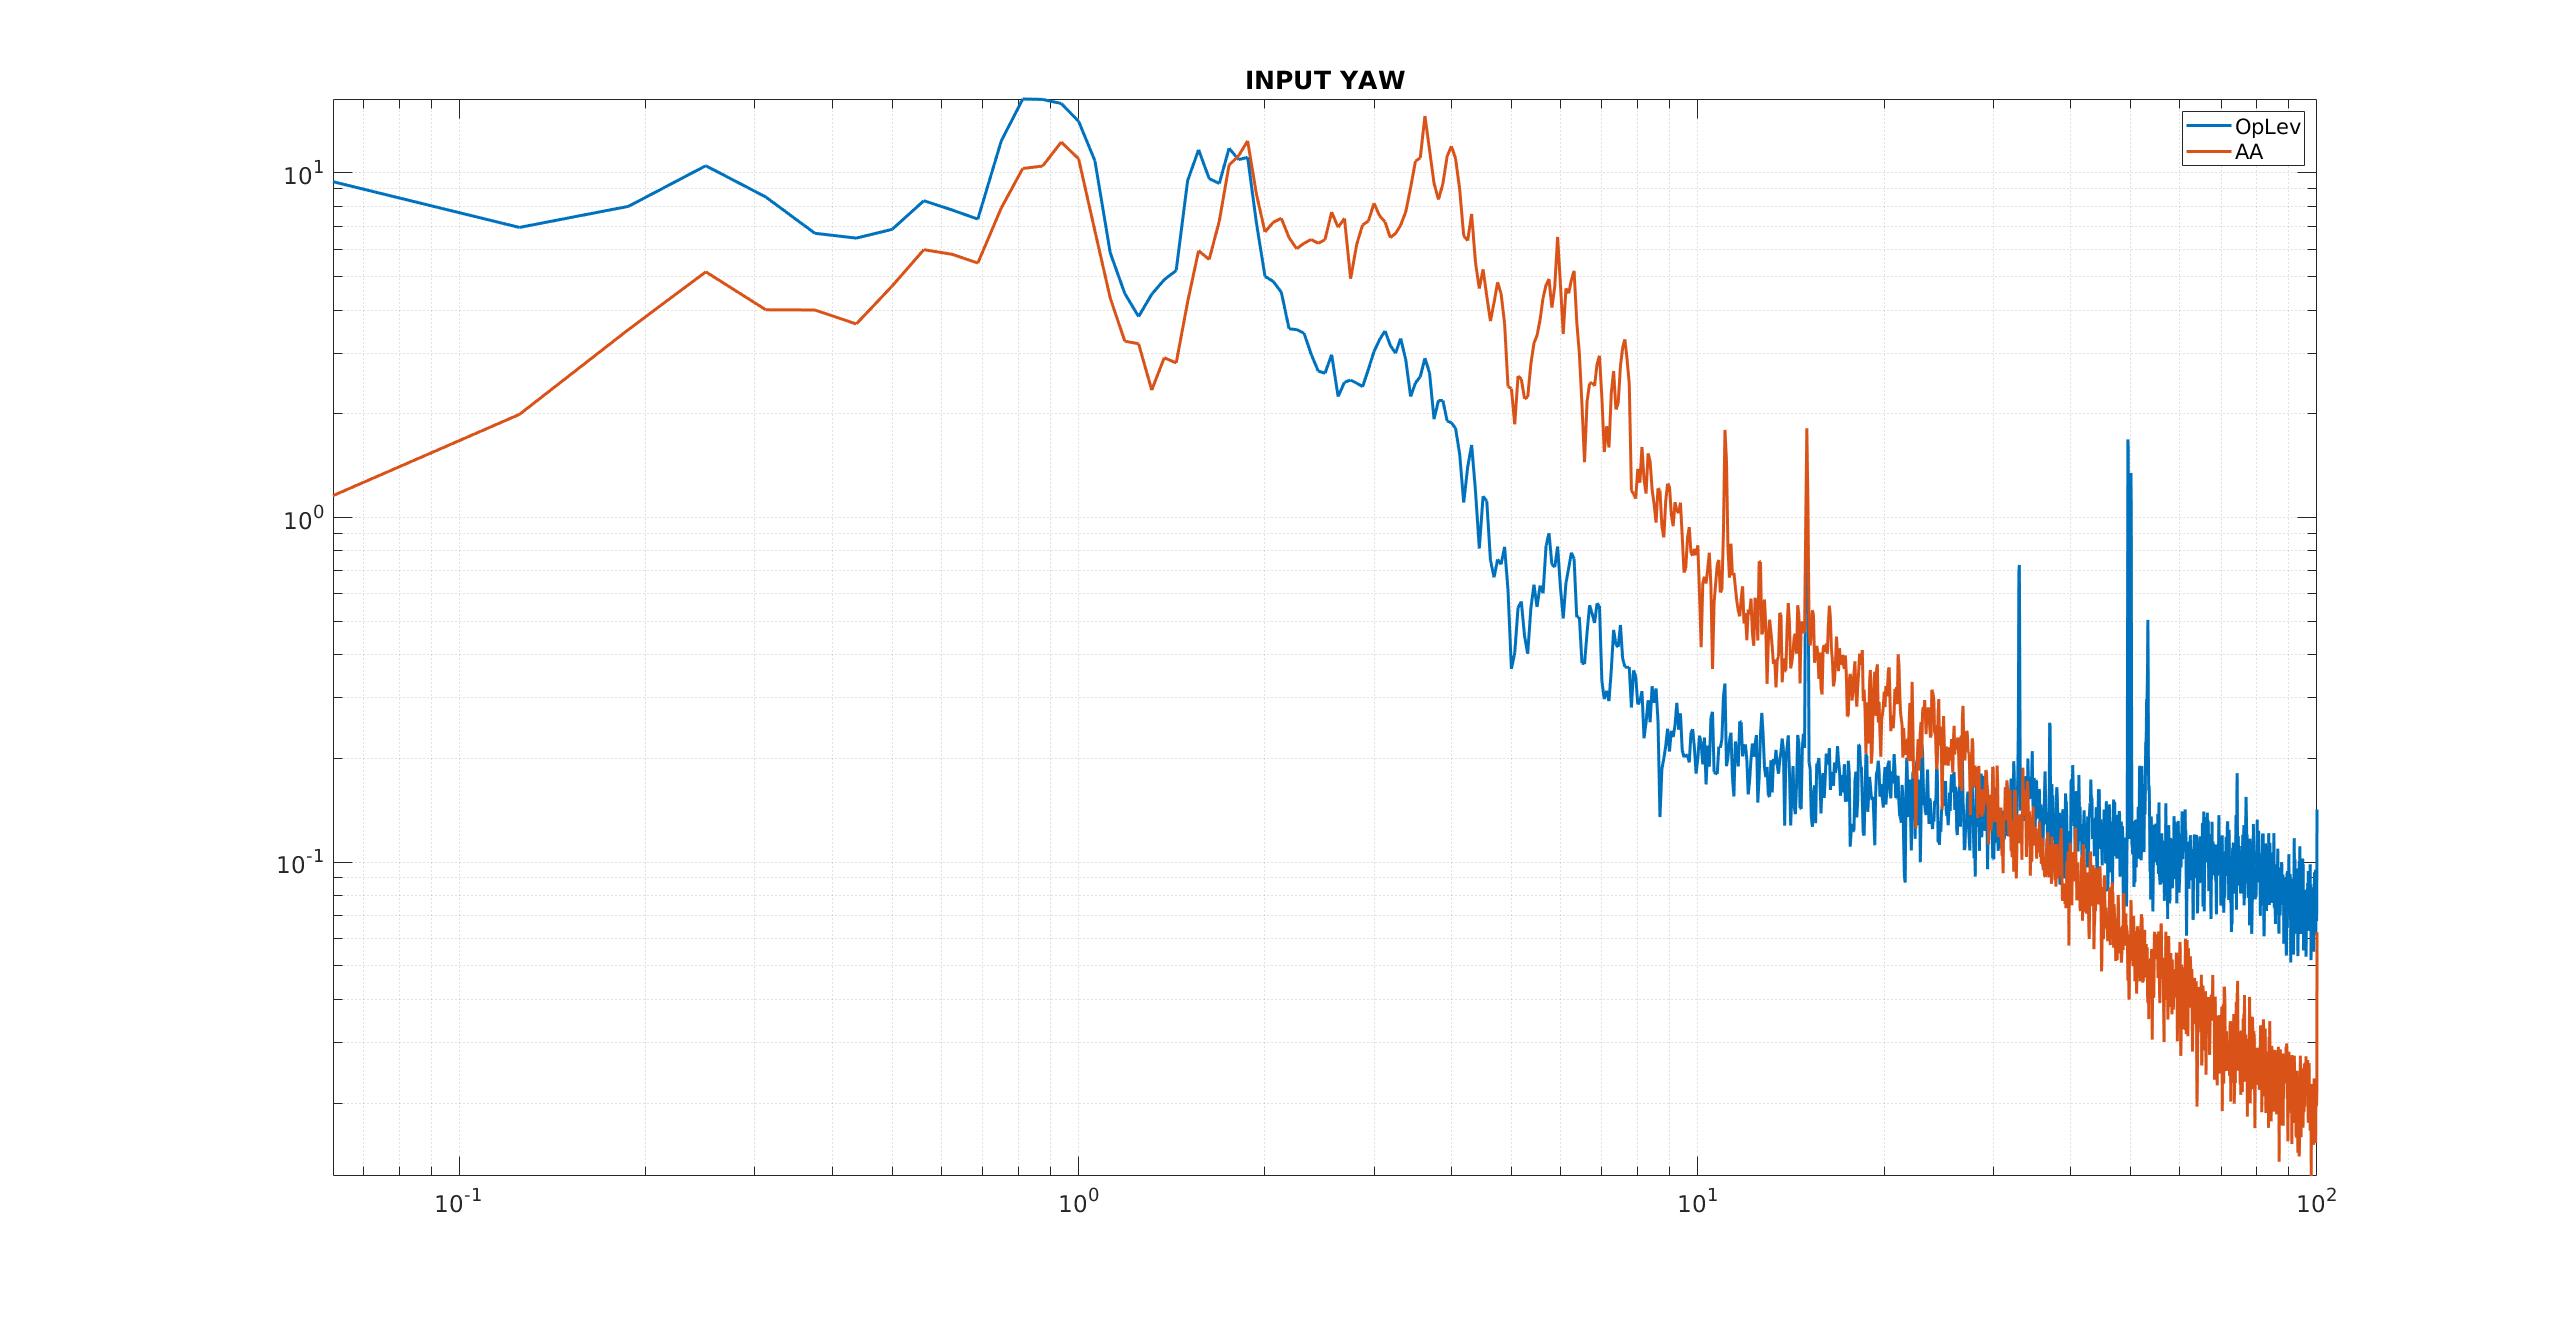
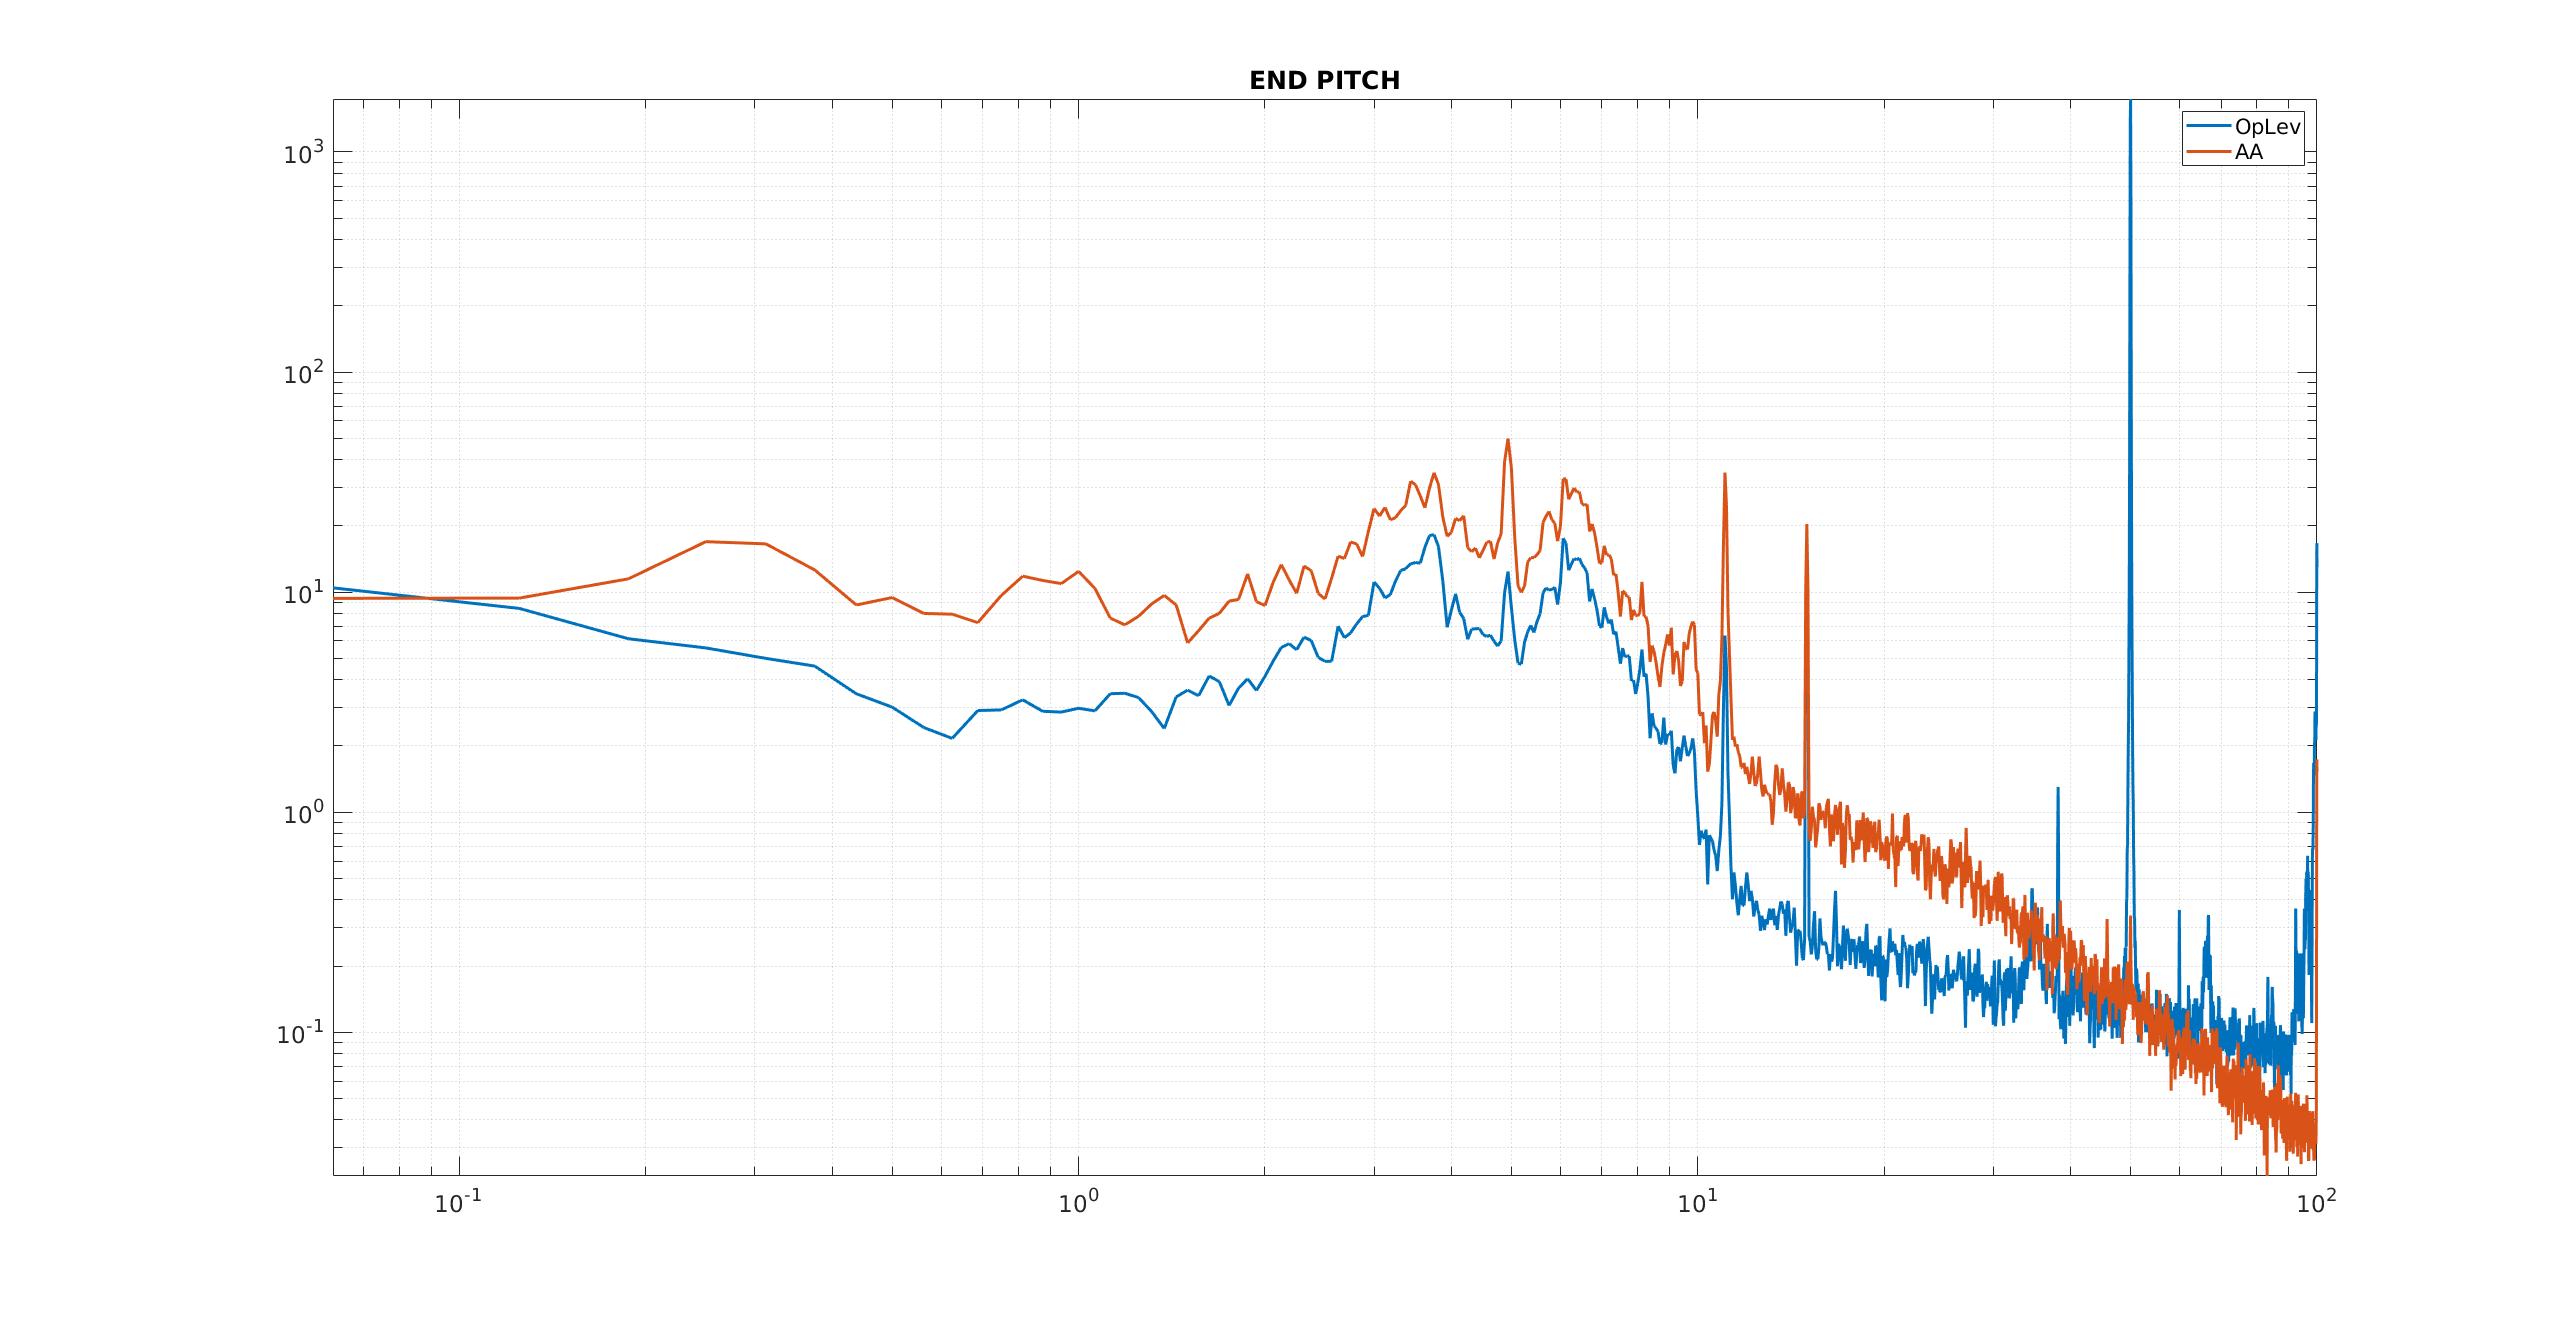
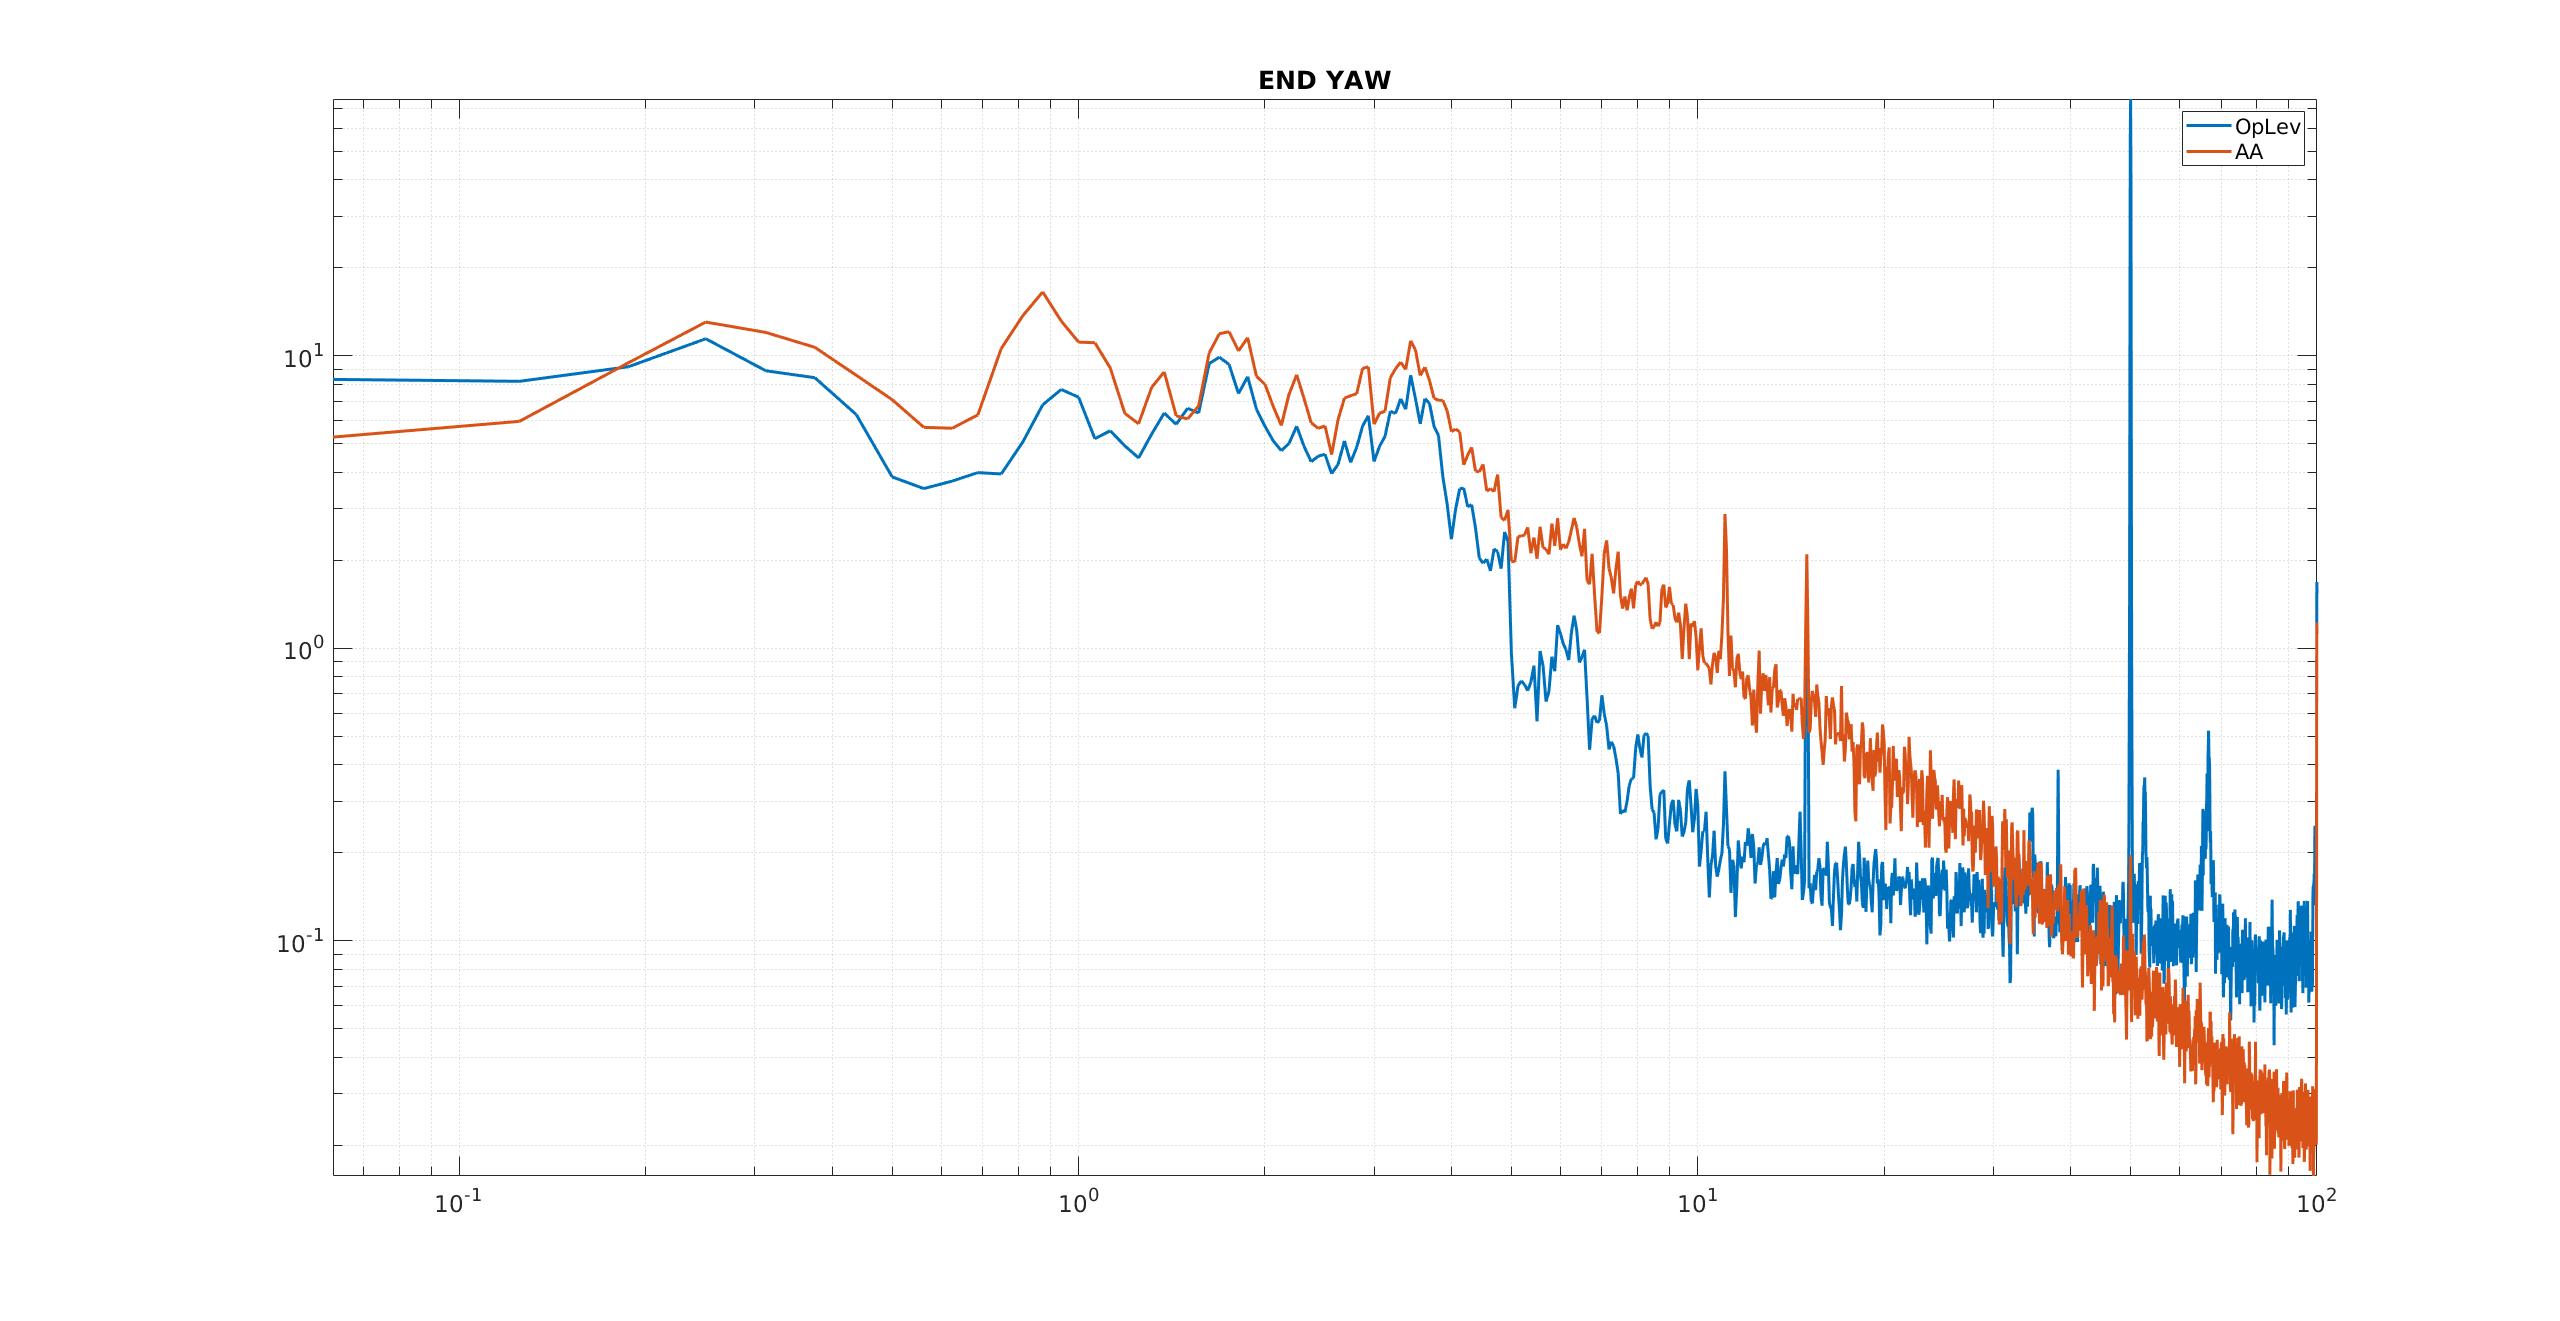
Today I sent 15 Hz line on input and end mirrors pitch and yaw to calibrate the AA signals.
The 4 attached figures show the comparison of Oplev signal with calibrated AA signals.
This line can also be used to estimate the SNR of both Oplev and AA signals.
| INPUT PITCH | INPUT YAW | END PITCH | END YAW | |
| Oplev | 17 | 3 | 23 | 3 |
| AA | 47 | 11 | 54 | 6 |
Marc, Michael, Yuhang
Today we wanted to do 2 activities in parallel :
1 compare the oplev and AA snr
2 measure the OPO NL gain.
We locked the FC with all loops on green for activity 1 and locked OPO while sending 10 Hz line with 1 Vpp on GR phase shifter for activity 2.
We found out that this caused an increase of Oplev (especially end mirror) and AA noises level as shown in figure 1. The green and brown reference curves are without beam dump, the blue and red are with deam dump and have the expected noise level.
By moving a beam dump from in-between the GR phase shifter and the GRMC to just before the OPO we could remove this new noise.
Therefore it seems that the green back-scattered light is the culprit.
We'll do further check to understand the coupling path and mechanism of this noise.