NAOJ GW Elog Logbook 3.2

I measured the visibility between LO and BAB with improved reflection mode matching and new beam spot. The measurement method is same as the previous measurement.
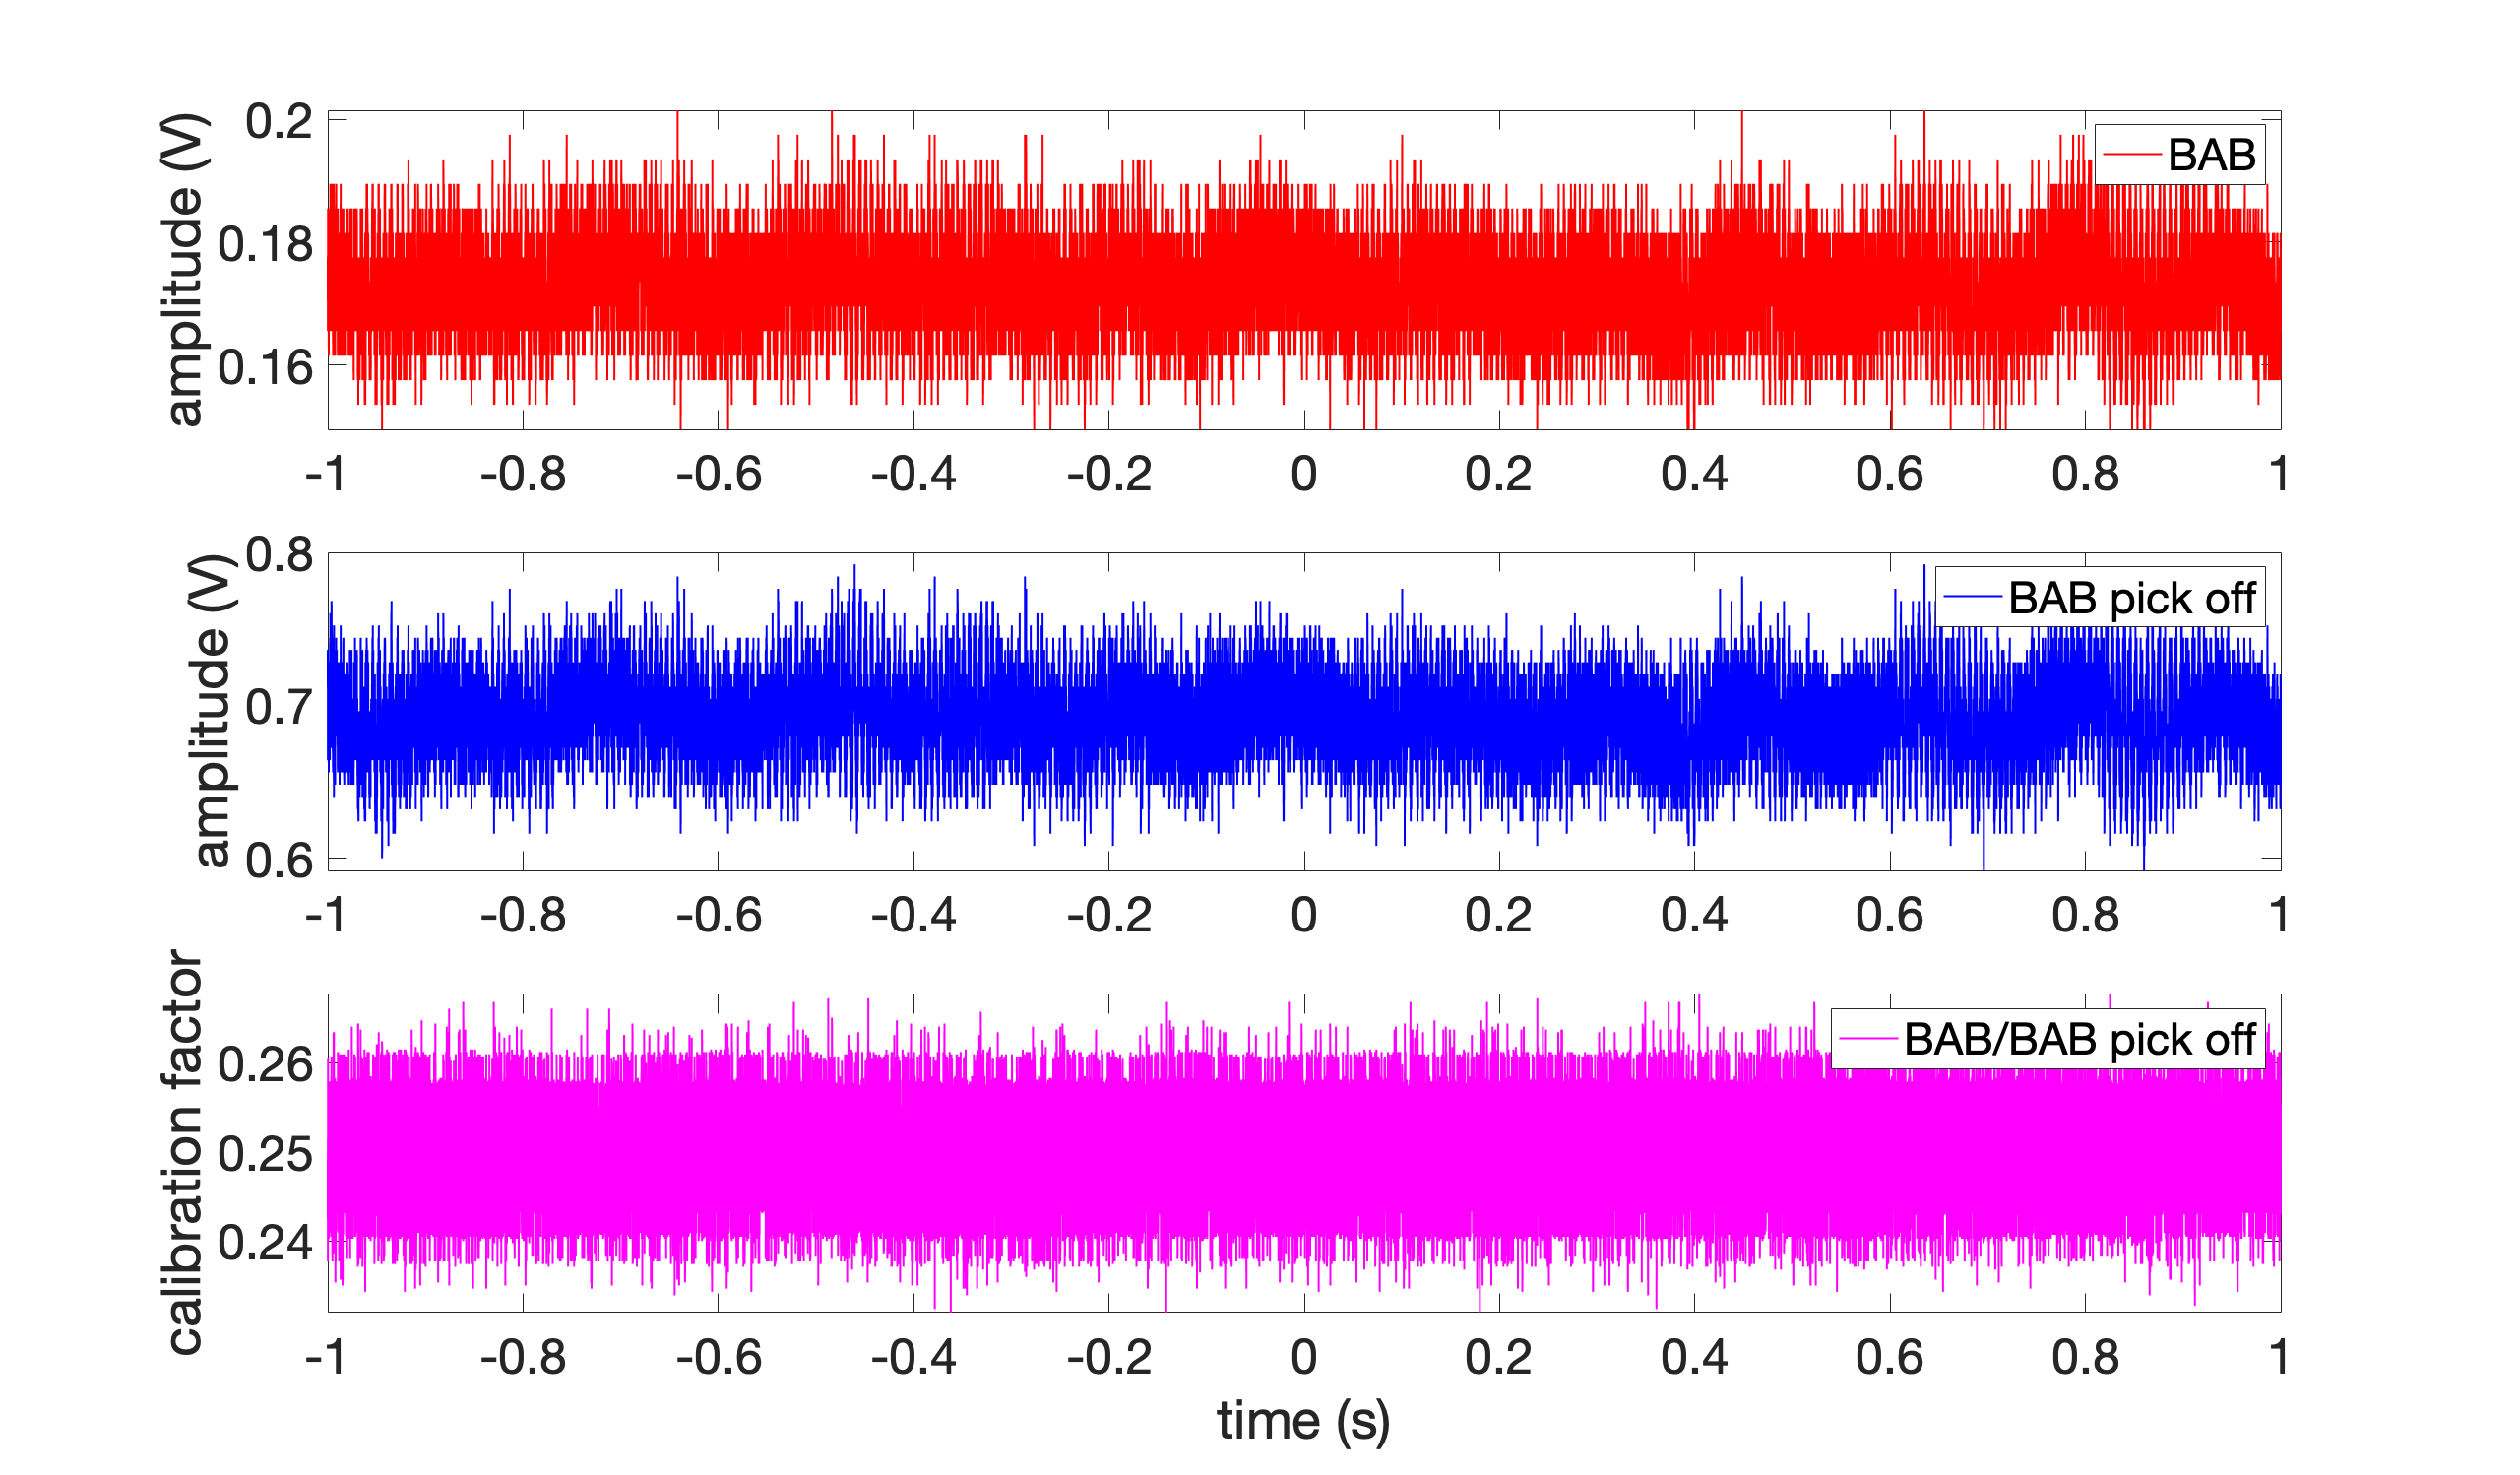
To know the BAB power during the measurement, BAB pick off power was also measured in CCFC port. Fig 1 shows the BAB power before AMC and the BAB pick off power. From this measurement, we can know the calibration factor from the BAB pick off power to the BAB power before AMC (bottom plot in Fig 1). The calibration factor is 0.25. The LO power was 1.21V. The offset of visibility was 8.5mV and the offset of pick off was 3.8mV.
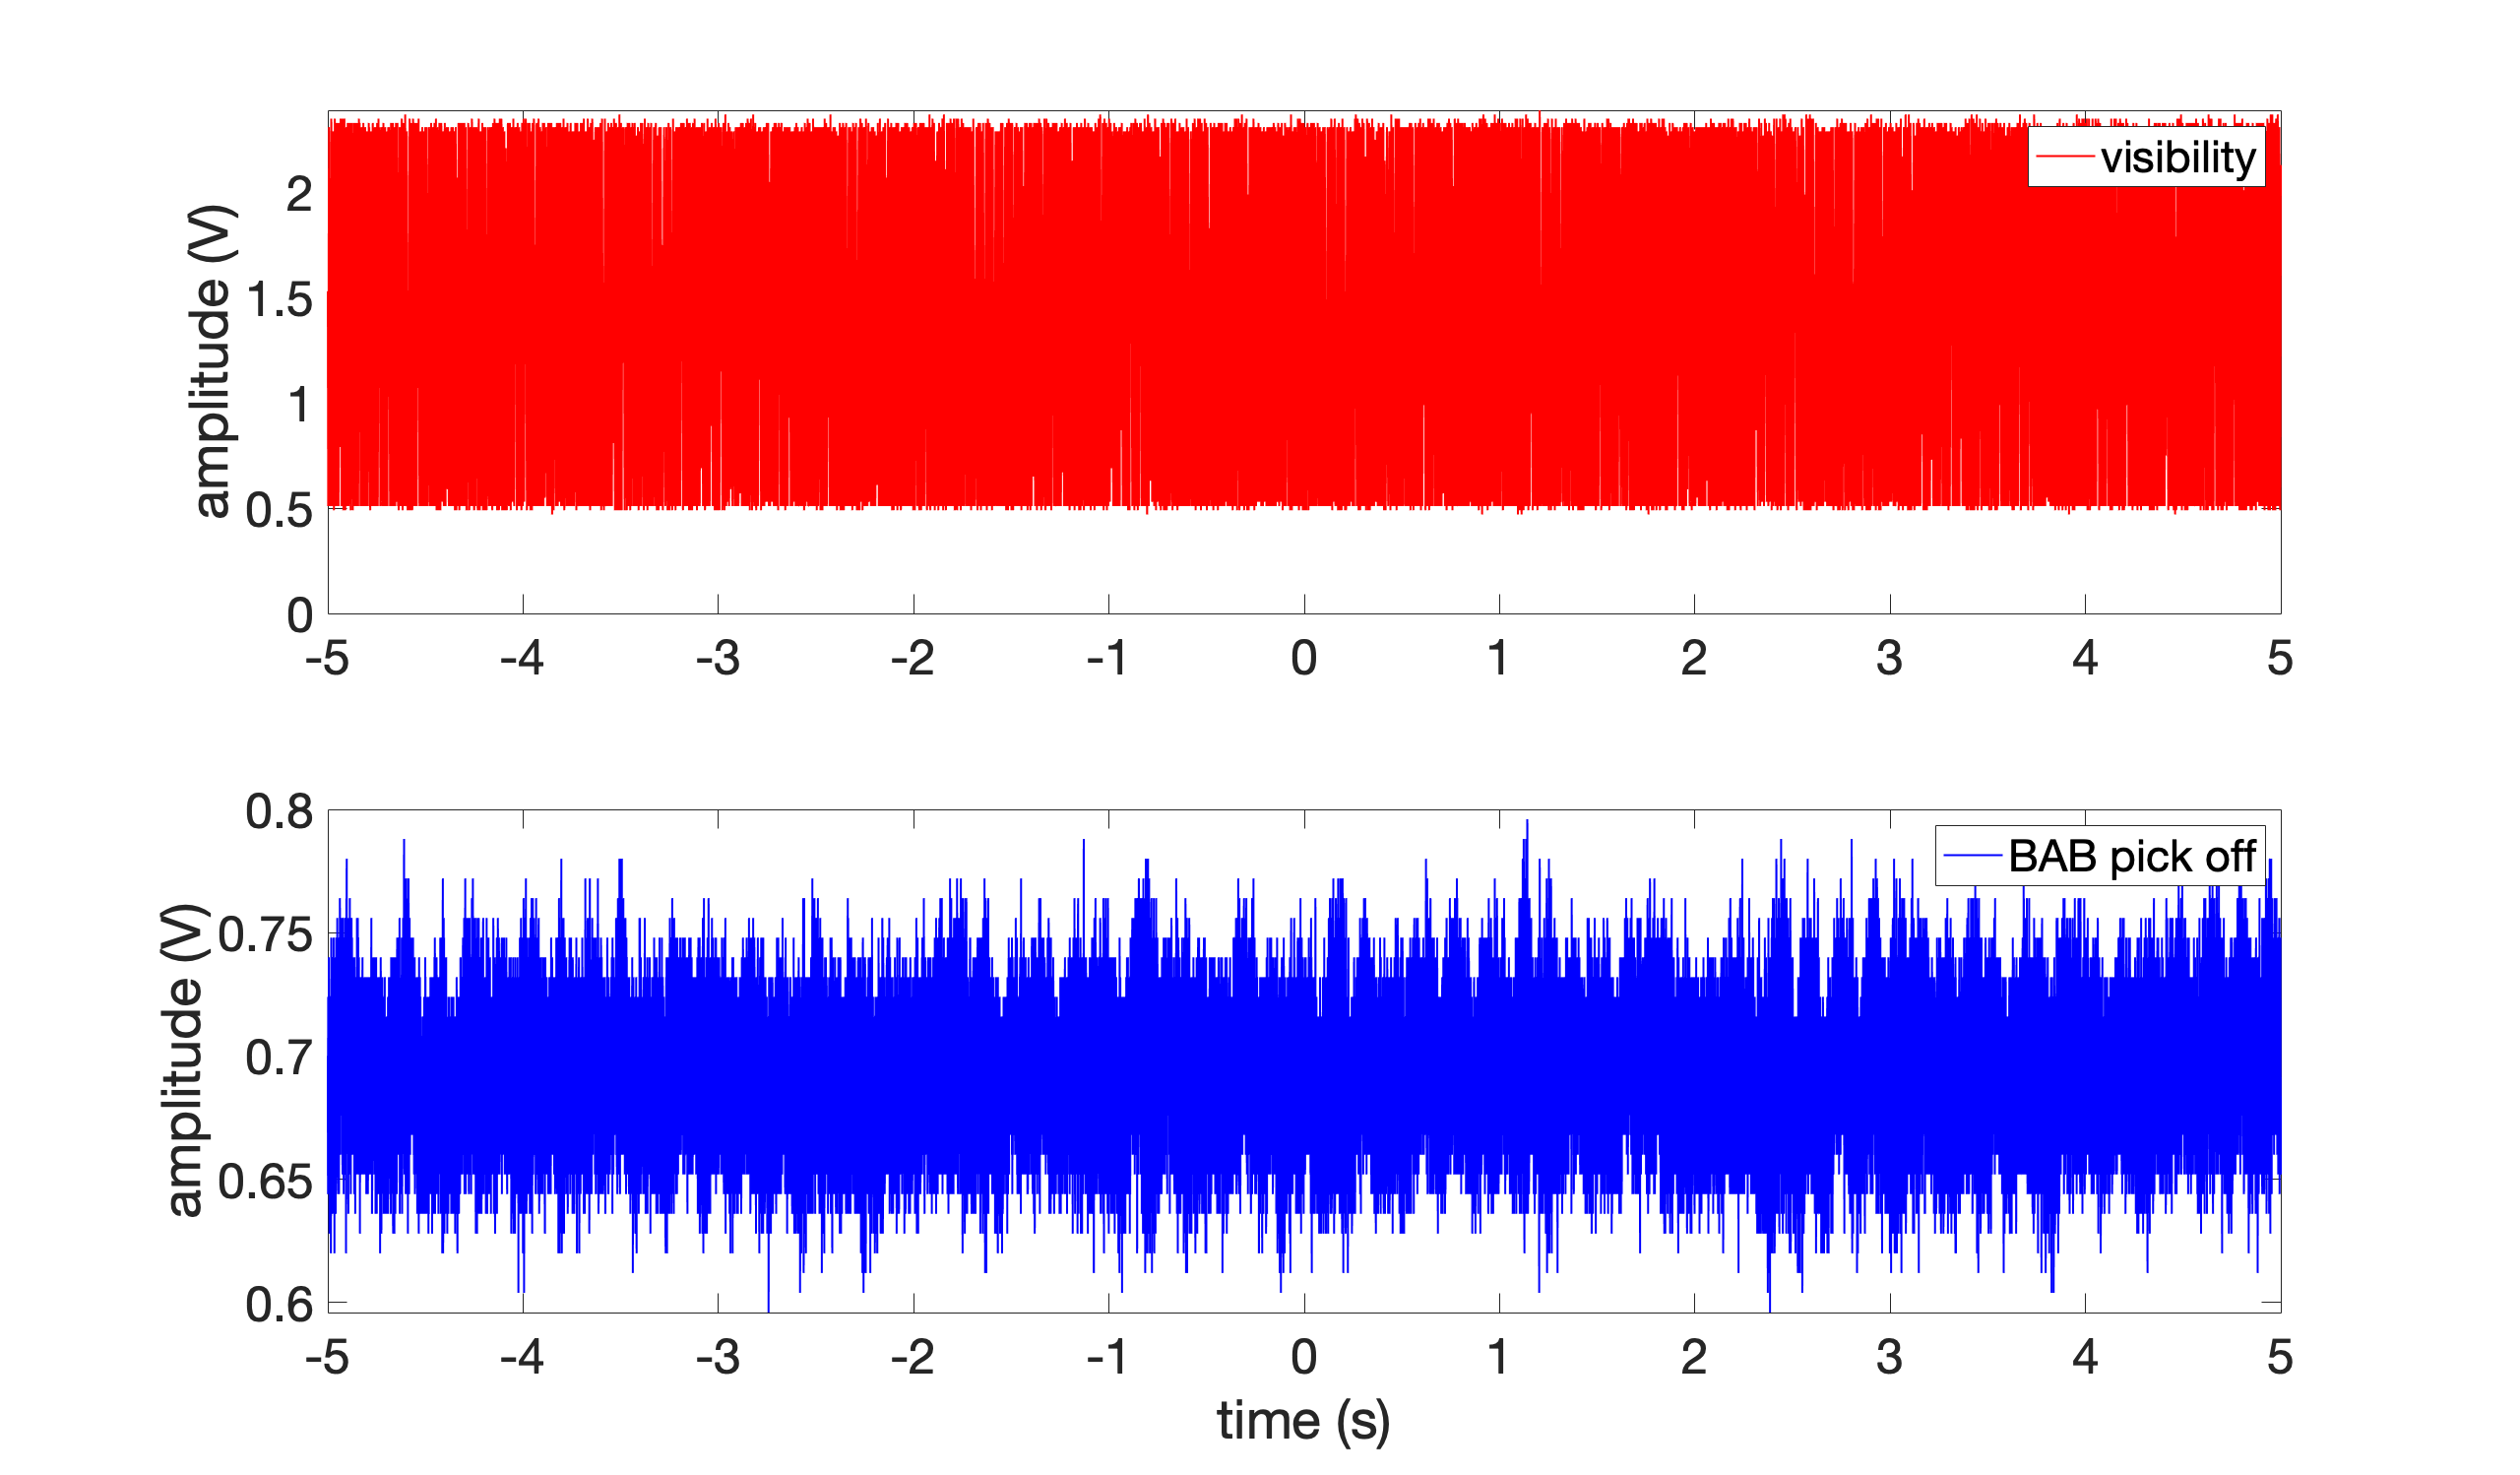
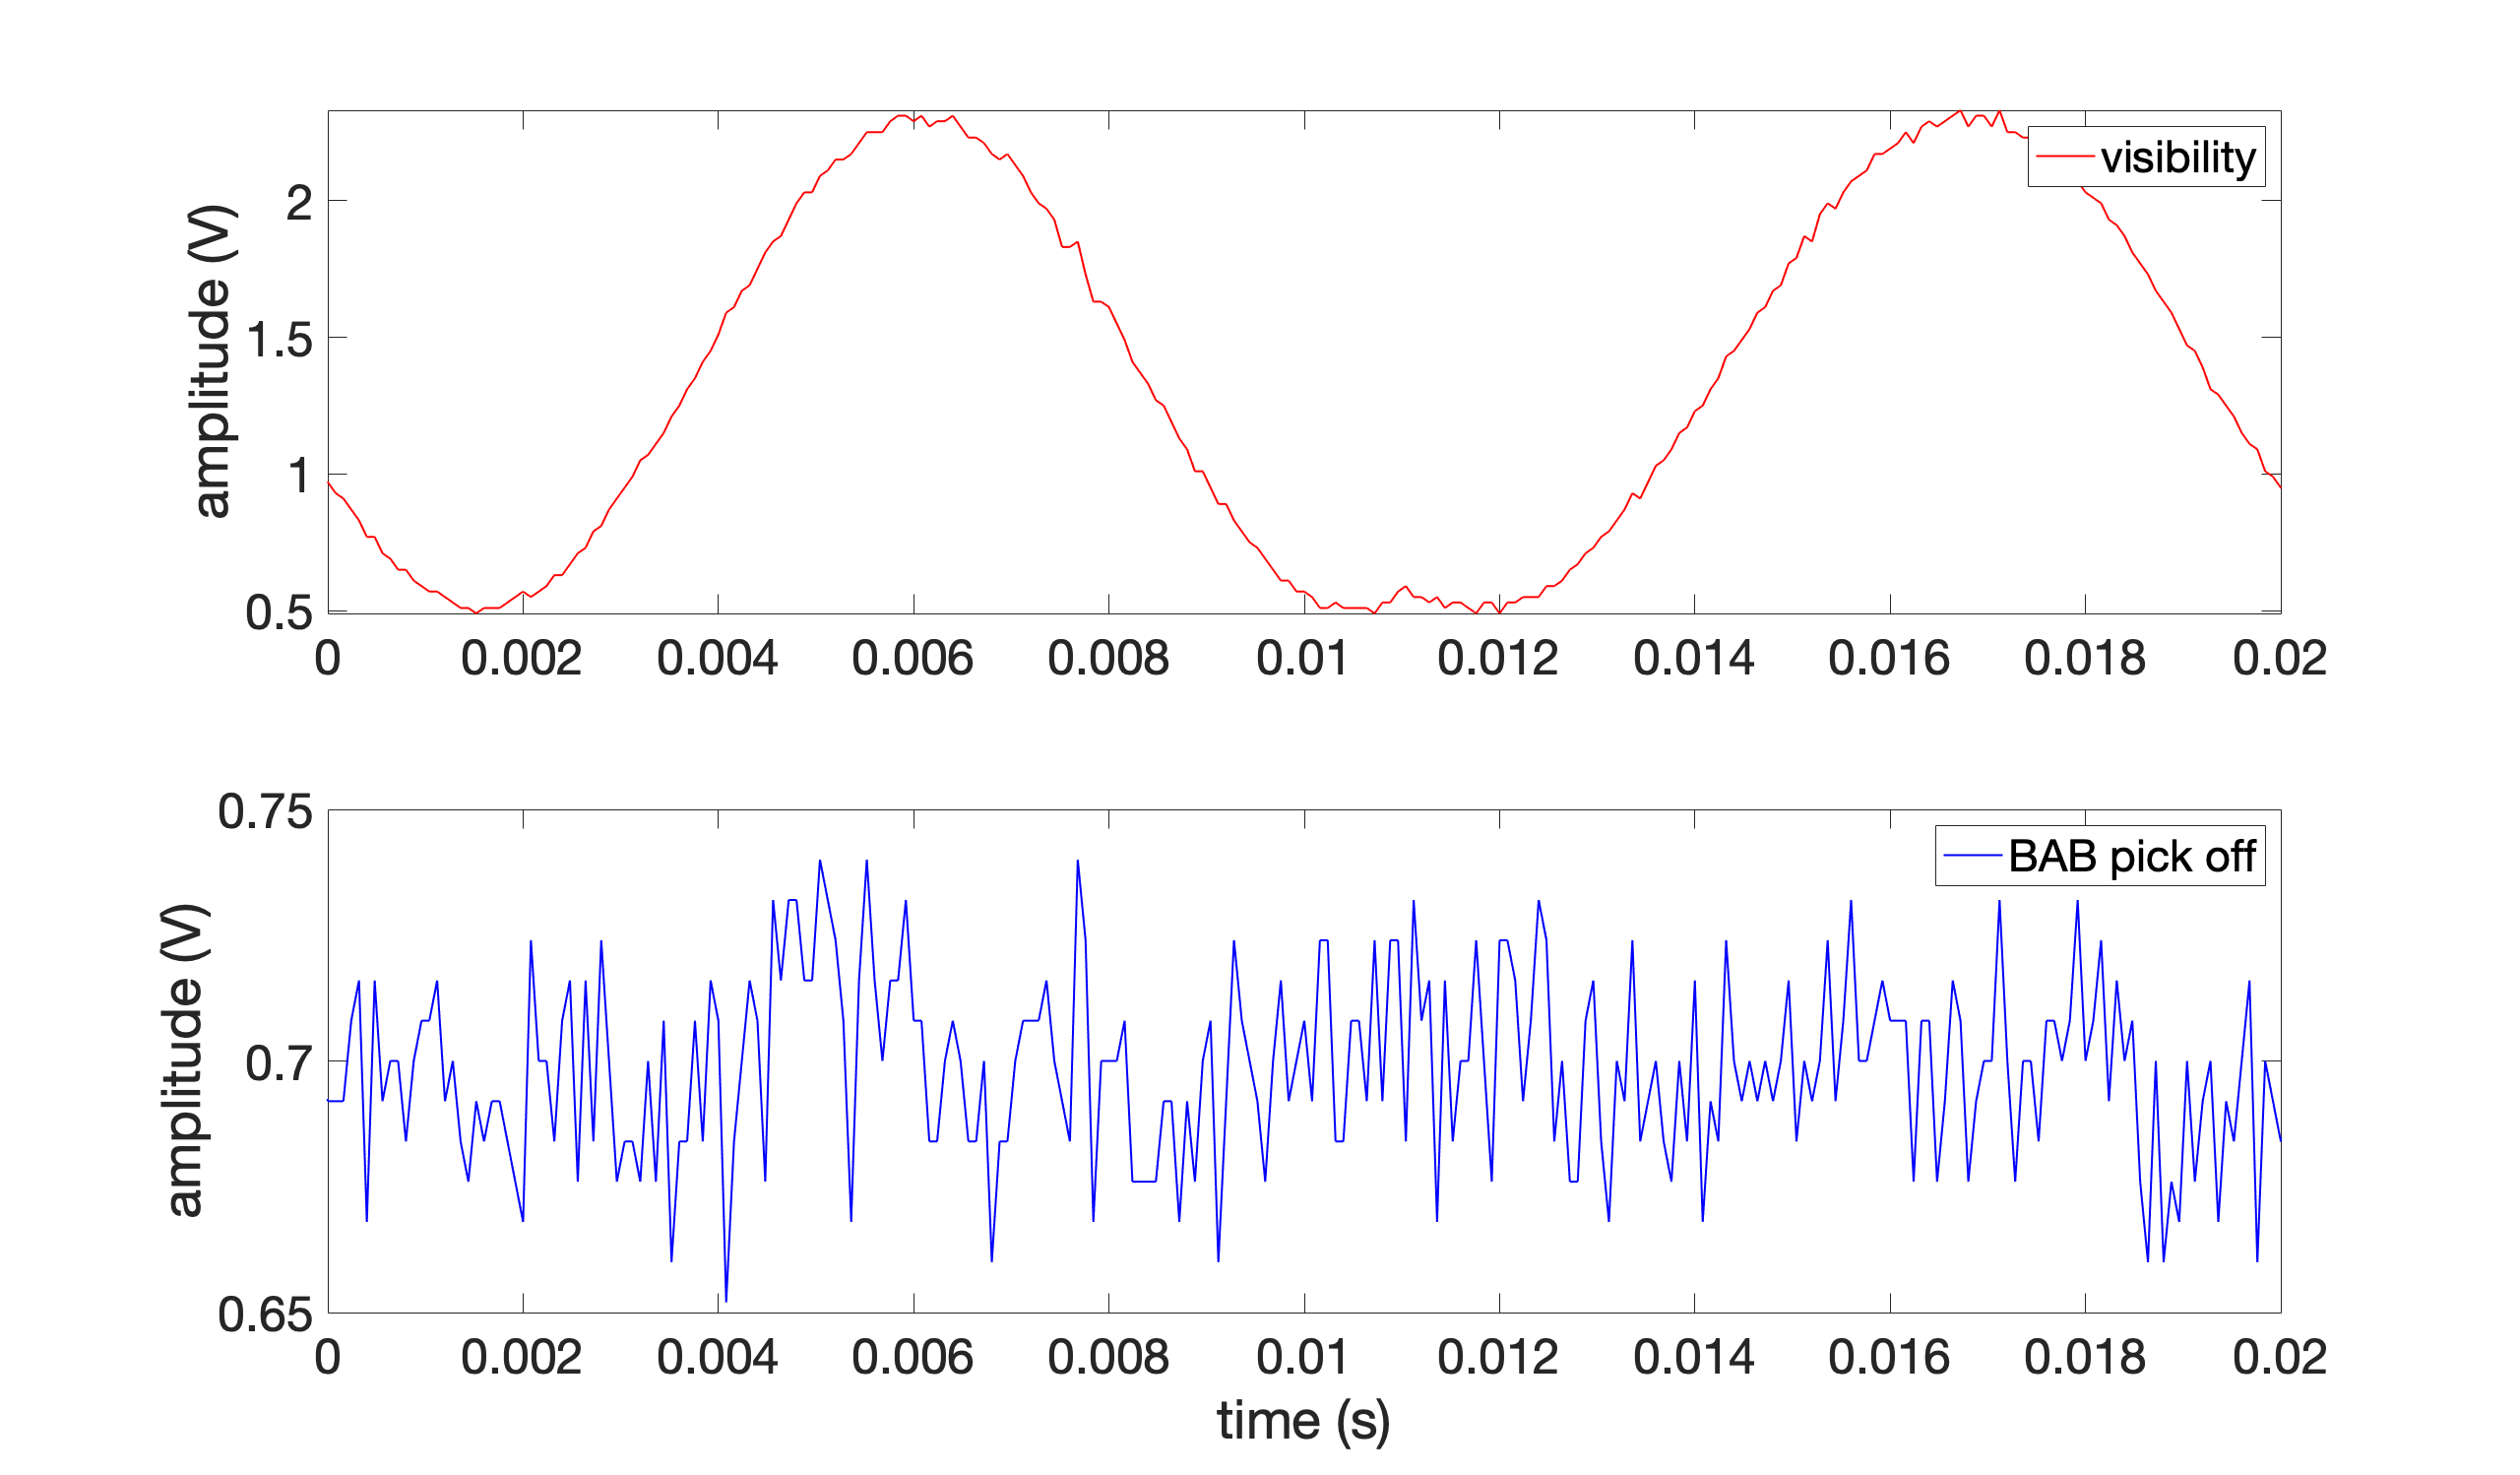
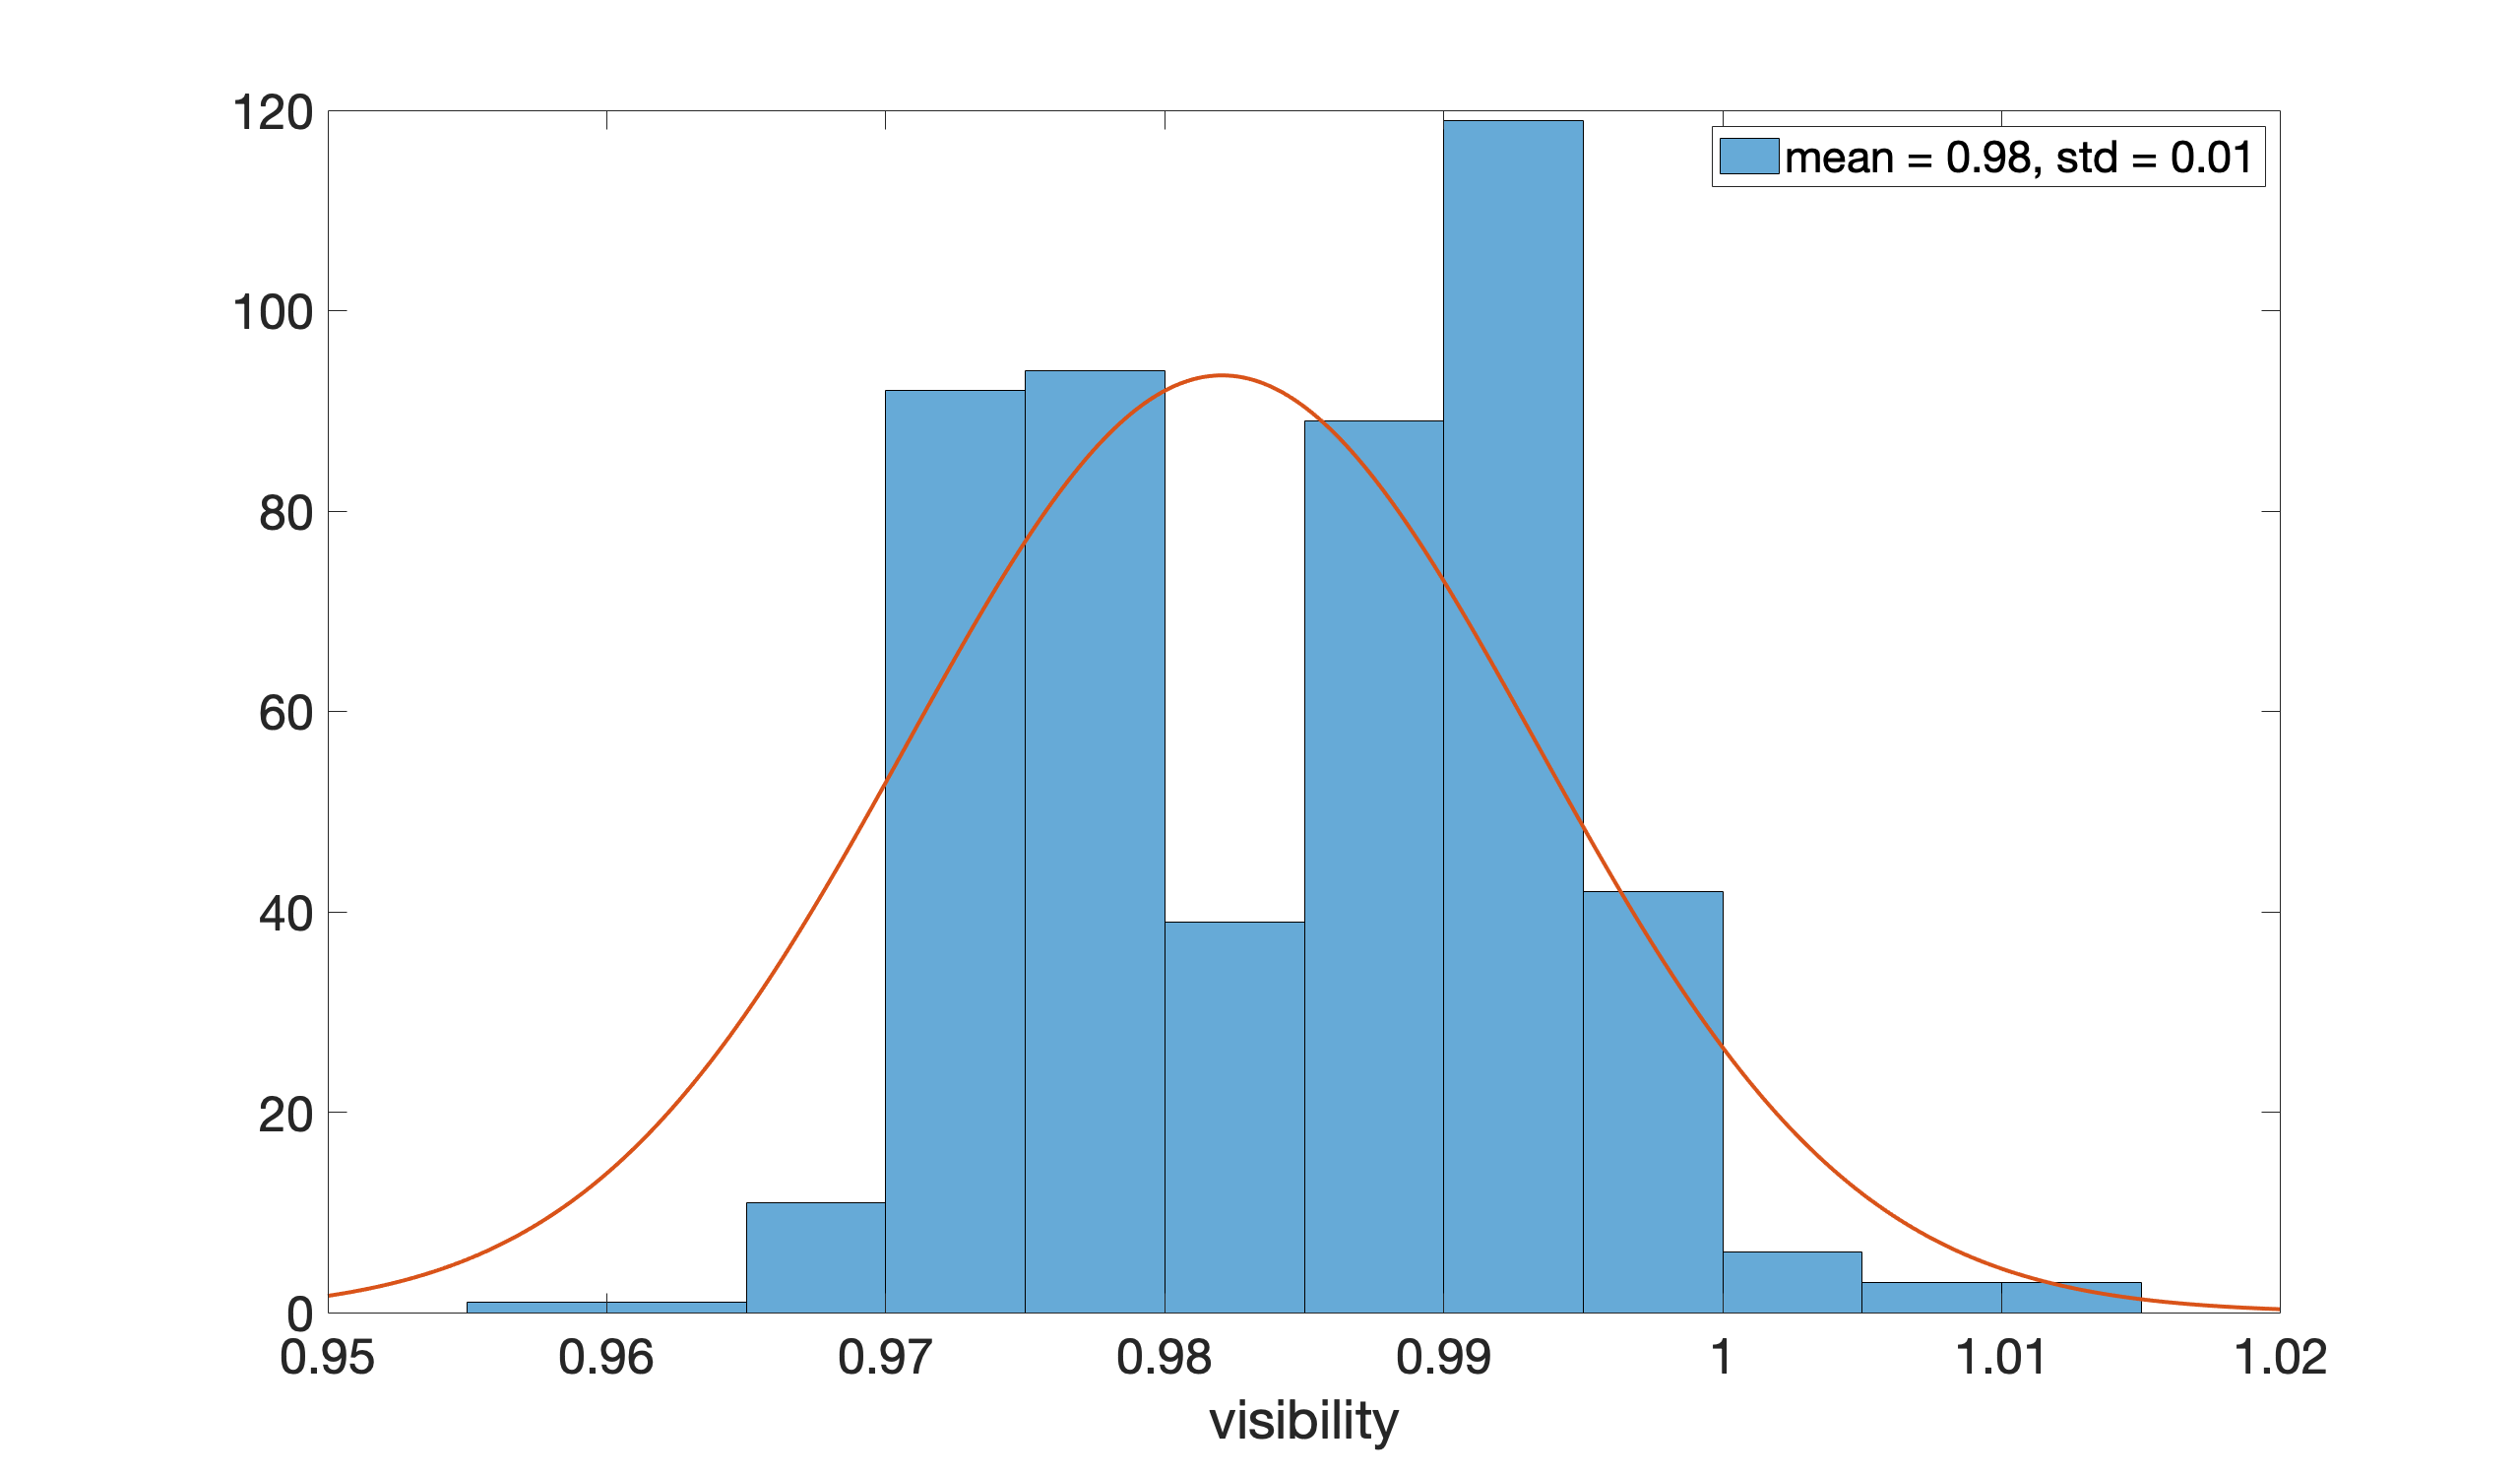
The measured visibility and BAB pick off are shown in Fig 2. The 10Hz modulation was applied to IR phase shifter. To calculate the visibility, I divided this data into 500 segments with 0.02s step (Fig 3) and calculated the visibility in each segment (Fig 4). From the histogram, the visibility is 0.98(1) which corresponds to optical loss of 4(2)%. We could recover the good reflection alignment!
[Aritomi, Yuhang, Michael]
First we replaced mirrors and mirror mounts in the IR reflection and LO path.
We replaced 1 mirror mount (FMD MM1000S) and 3 mirrors (layertec) in the reflection path. We also replaced 2 mirror mounts (FMD MM1000S) in the LO path.
Then we moved a lens in the reflection path to improve the reflection mode matching. We moved a lens which is closer to homodyne in the reflection path.
Before moving the lens, we checked reflection alignment with AMC. TEM00 was 872mV and mode mismatch was 54.4mW, which means mode matching without misalignment is 94%. This value is consistent with the previous visibility measurement.
We moved the lens and reduced the mode mismatch from 54.4mV to 4mV as follows.
| lens position (mm) | mode mismatch (mV) |
| 40 | 54.4 |
| 38 | 32 |
| 36 | 15.2 |
| 34 | 4 |
Now the effect of mode mismatch is only 0.5% and the misalignment is larger than the mode mismatch.
| green power (mW) | 0 | 20 |
| p pol PLL (MHz) | 245 | 185 |
| OPO temperature (kOhm) | 7.164 | 7.164 |
| BAB maximum (mV) (power meter range (mW)) | 536 (1.6) | 278 (16) |
| nonlinear gain | 1 | 5.2 |
I checked the IR injection alignment. At the begining of today, the mode matching was 92.1% as follows. The IR injection was 455uW.
| Mode | IR transmission |
| TEM00 | 480 |
| migalignment 1 | 105 |
| migalignment 2 | 100 |
| LG | 105 |
| offset | 94 |
Note that the misalignment 1 means top left and bottom right are bright and the misalignment 2 means top right and bottom left are bright.
Then I aligned the IR injection. The mode matching became 94.4% as follows. The IR injection was 442uW.
| Mode | IR transmission |
| TEM00 | 470 |
| misalignment 1 | 100 |
| misalignment 2 | 100 |
| LG | 105 |
| offset | 94 |
Abe, Marc
On Friday we inspected the spare viewport with a green light.
By eye it is really hard to see remaining stains but we could see few dust particles. We tried to remove them with an air duster but at least one remained quite close to the viewport center.
Then we started again absorption measurement (radius 30mm and step size 2 mm) looking carefully at the lockin saturation.
We used Pin = 0.0308 W (ie HWP = 39 degrees) and started with lockin sensitivity of 100 uV.
There was 2 positions with saturation : (X=349.8mm,Y = 125mm) and (X = 315mm,Y = 126.6 mm).
We increased the lockin sensitivity to 500 uV (still saturating) and finally 2mV where no more saturation was visible.
The absorption map with this last setting is reported in figure 1. We can see that the maximal AC value of these two spots is ~ 700 uV which corresponds to absorption of ~ 300 ppm.
With this low power, it is still not possible to see the absorption (except at the 2 dirty spots) so we increased the laser power to Pin = 90.6 mW (HWP = 41 degrees) and sensitivity to 5 mV.
Still no absorption visible.
We are not sure how to estimate the 'damage threshold' of this dust so we decided to take absorption measurements slightly shifted (X_center = 360.5 mm) with a smaller radius (21 mm) in order to avoid these dirty spots. We increased the laser power to Pin = 0.2392 W (HWP = 44 degrees) and sensitivity = 20 mV.
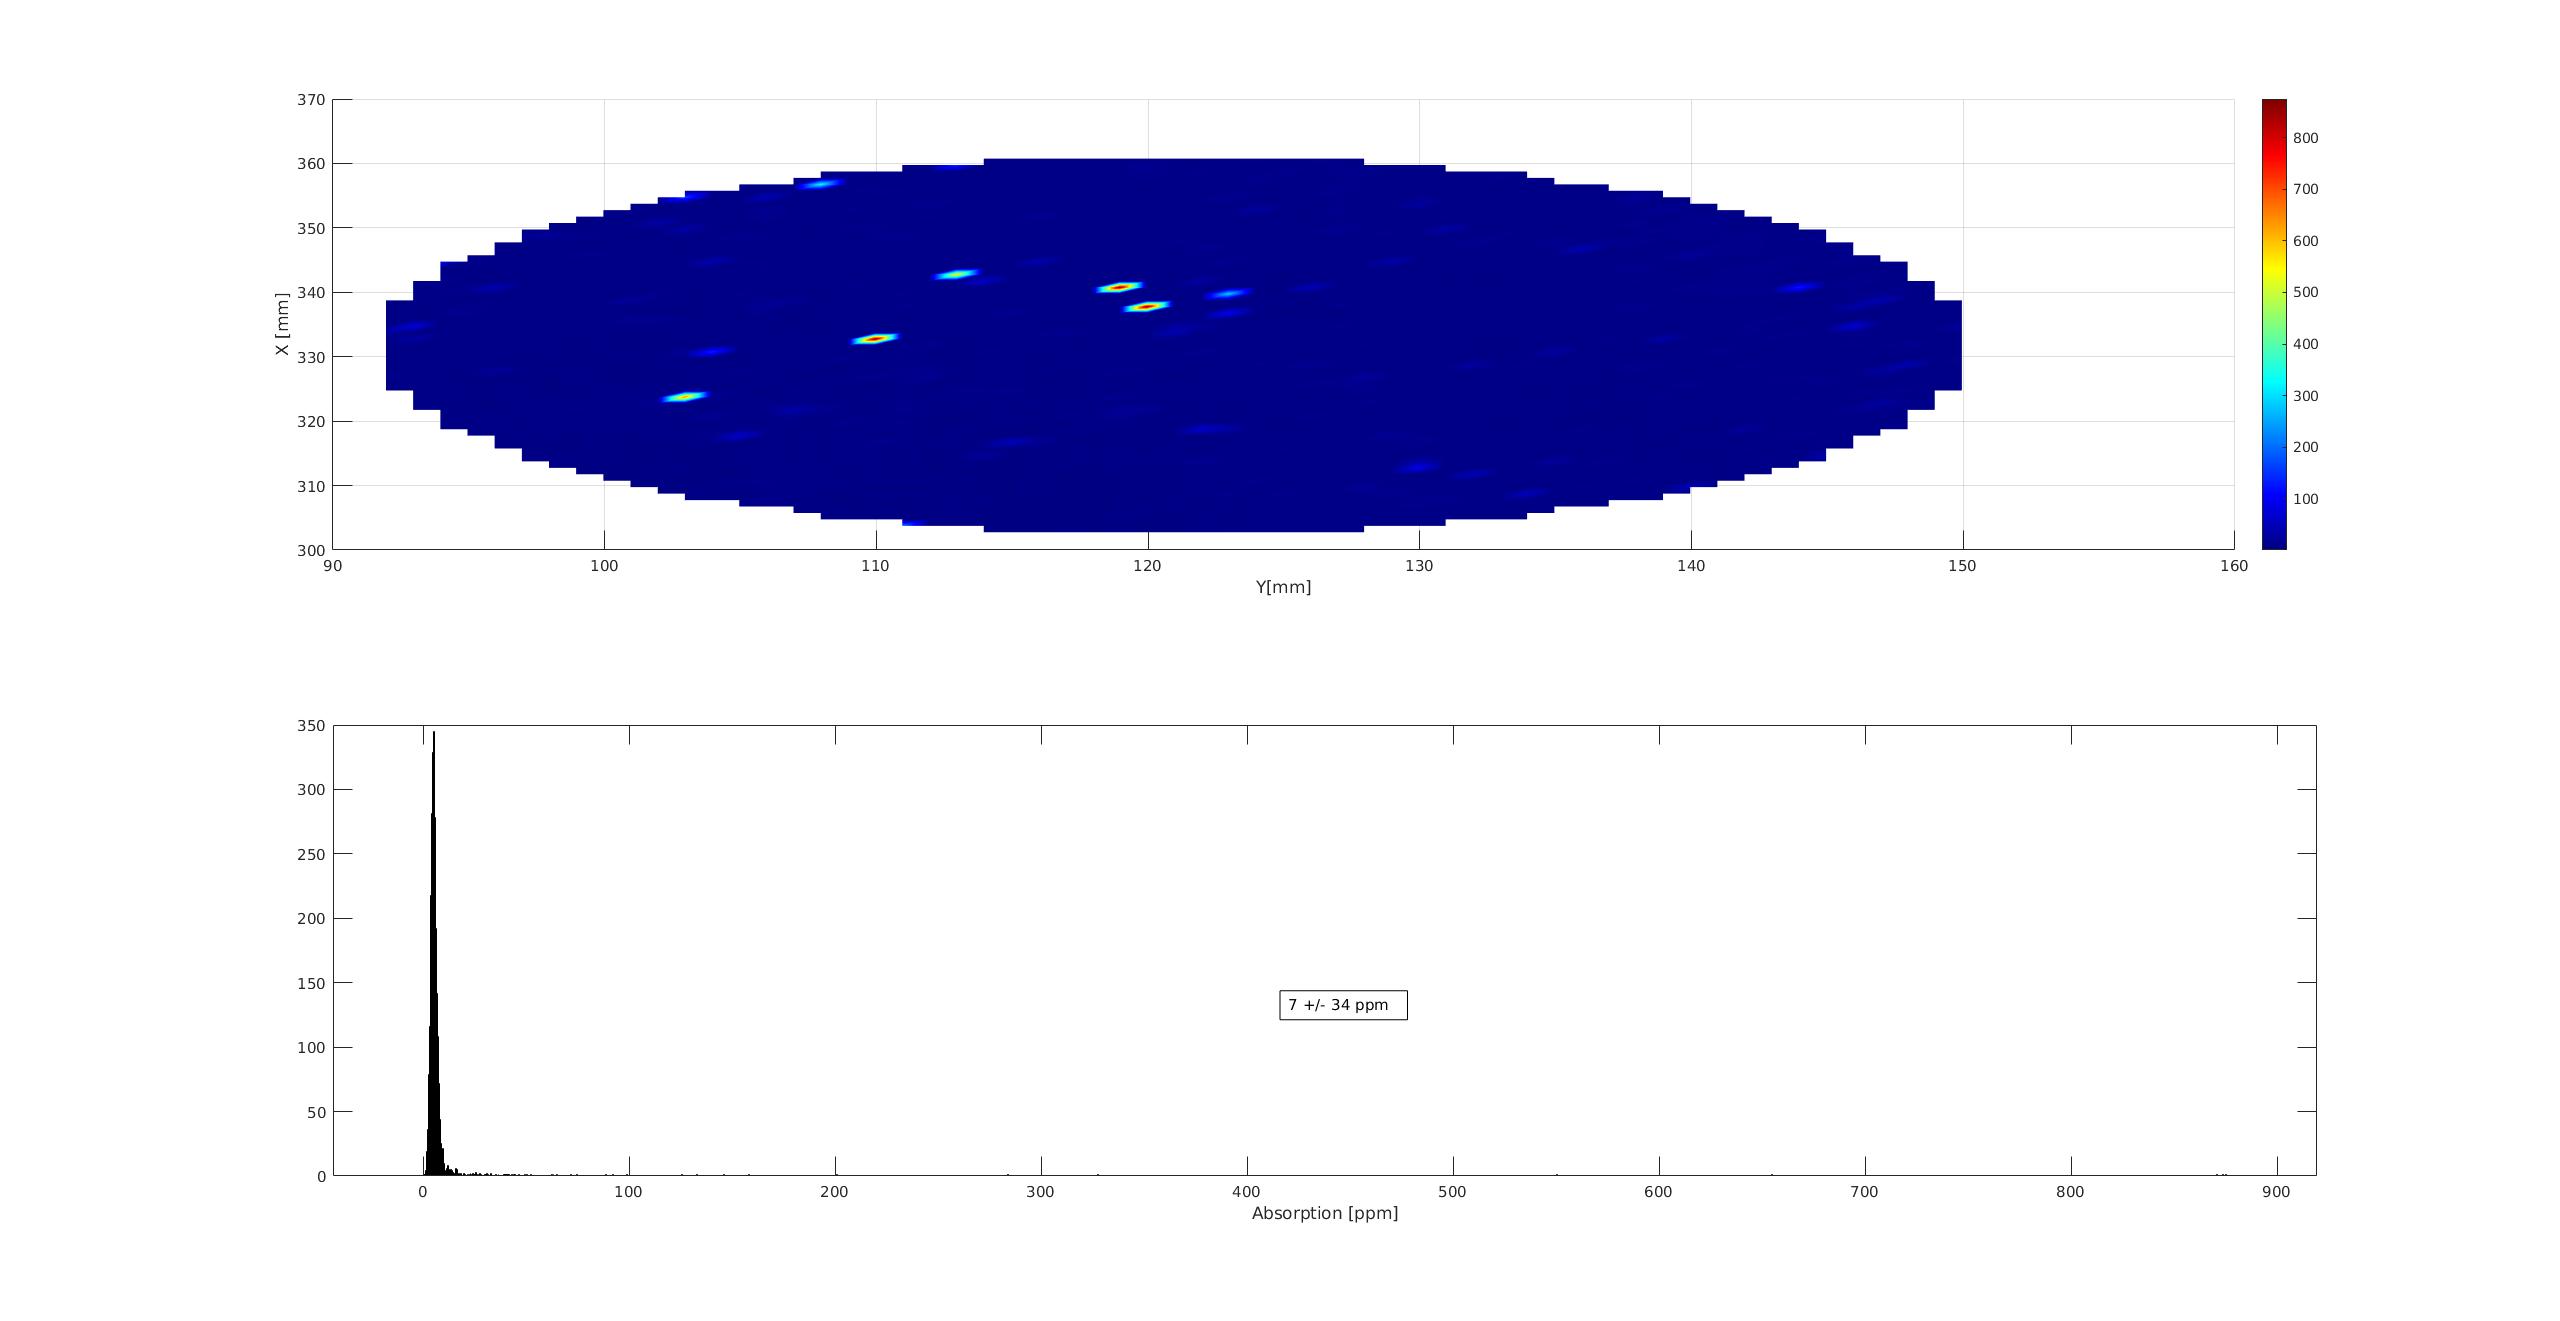
This absorption map is reported in figure 2.
We can see higher level of absorption at the edge of the map which corresponds actually roughly to 1 cm of the edge of the viewport.
This is reasonable if the cleaning was not performed at the edge of the viewport.
For further measurement, we would need to reduce further more the map radius to be sure to avoid burning the stains.
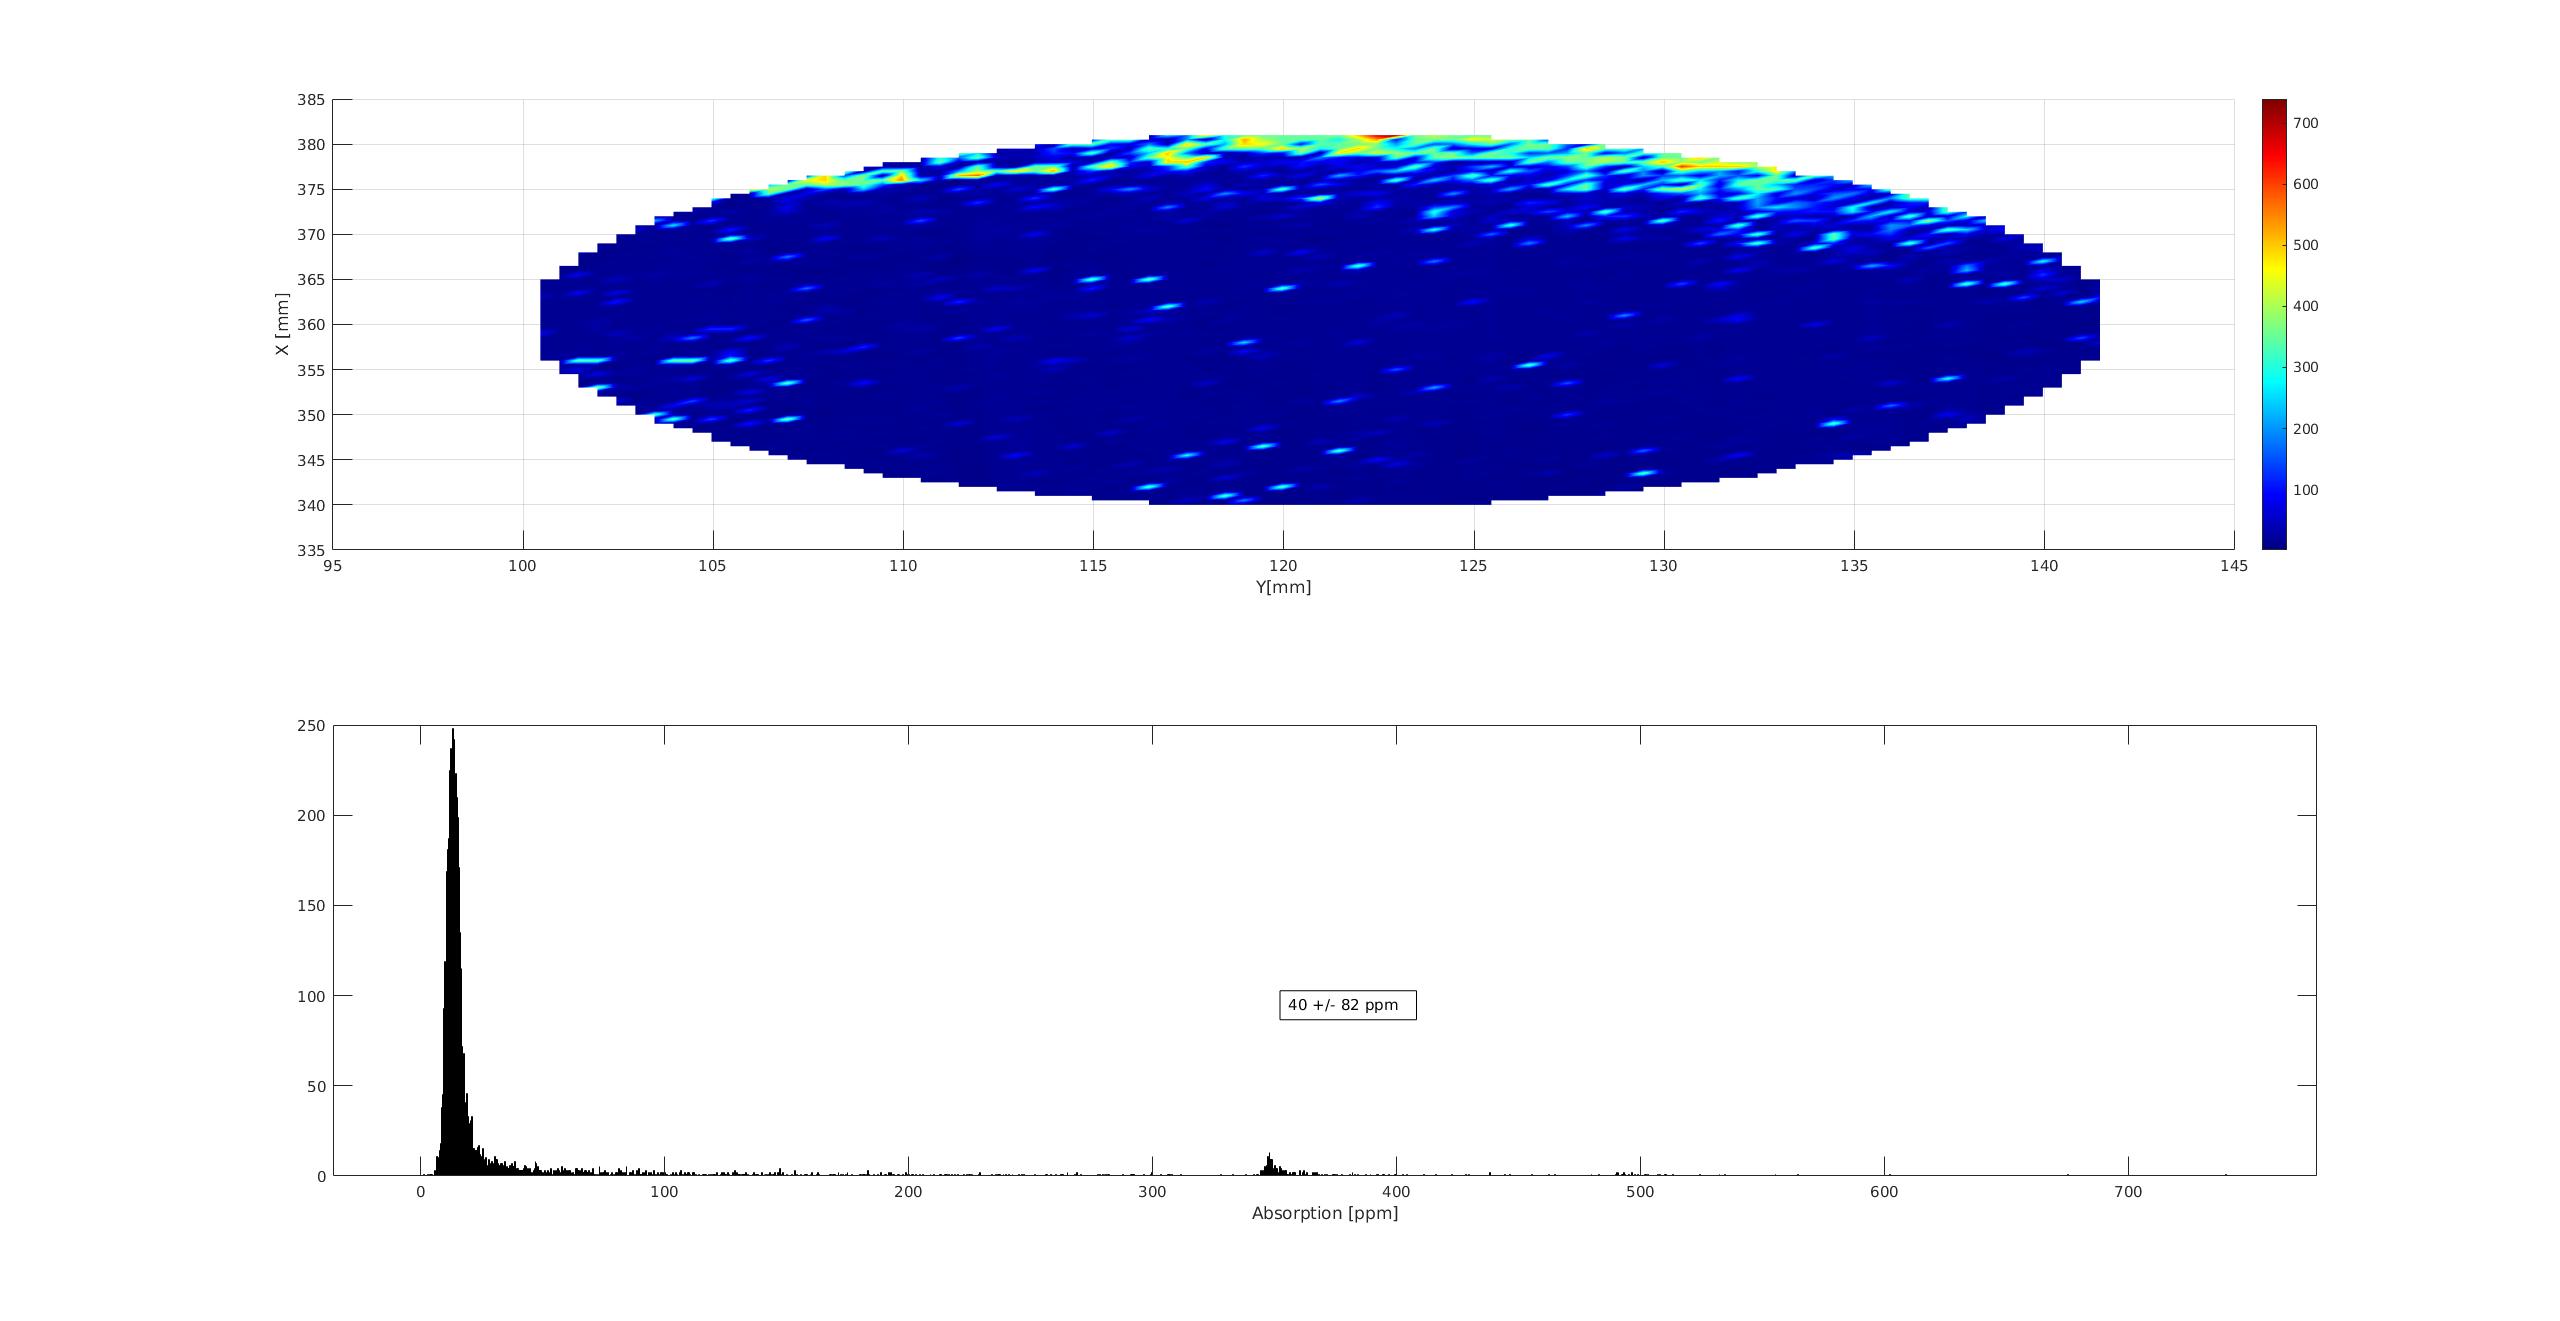
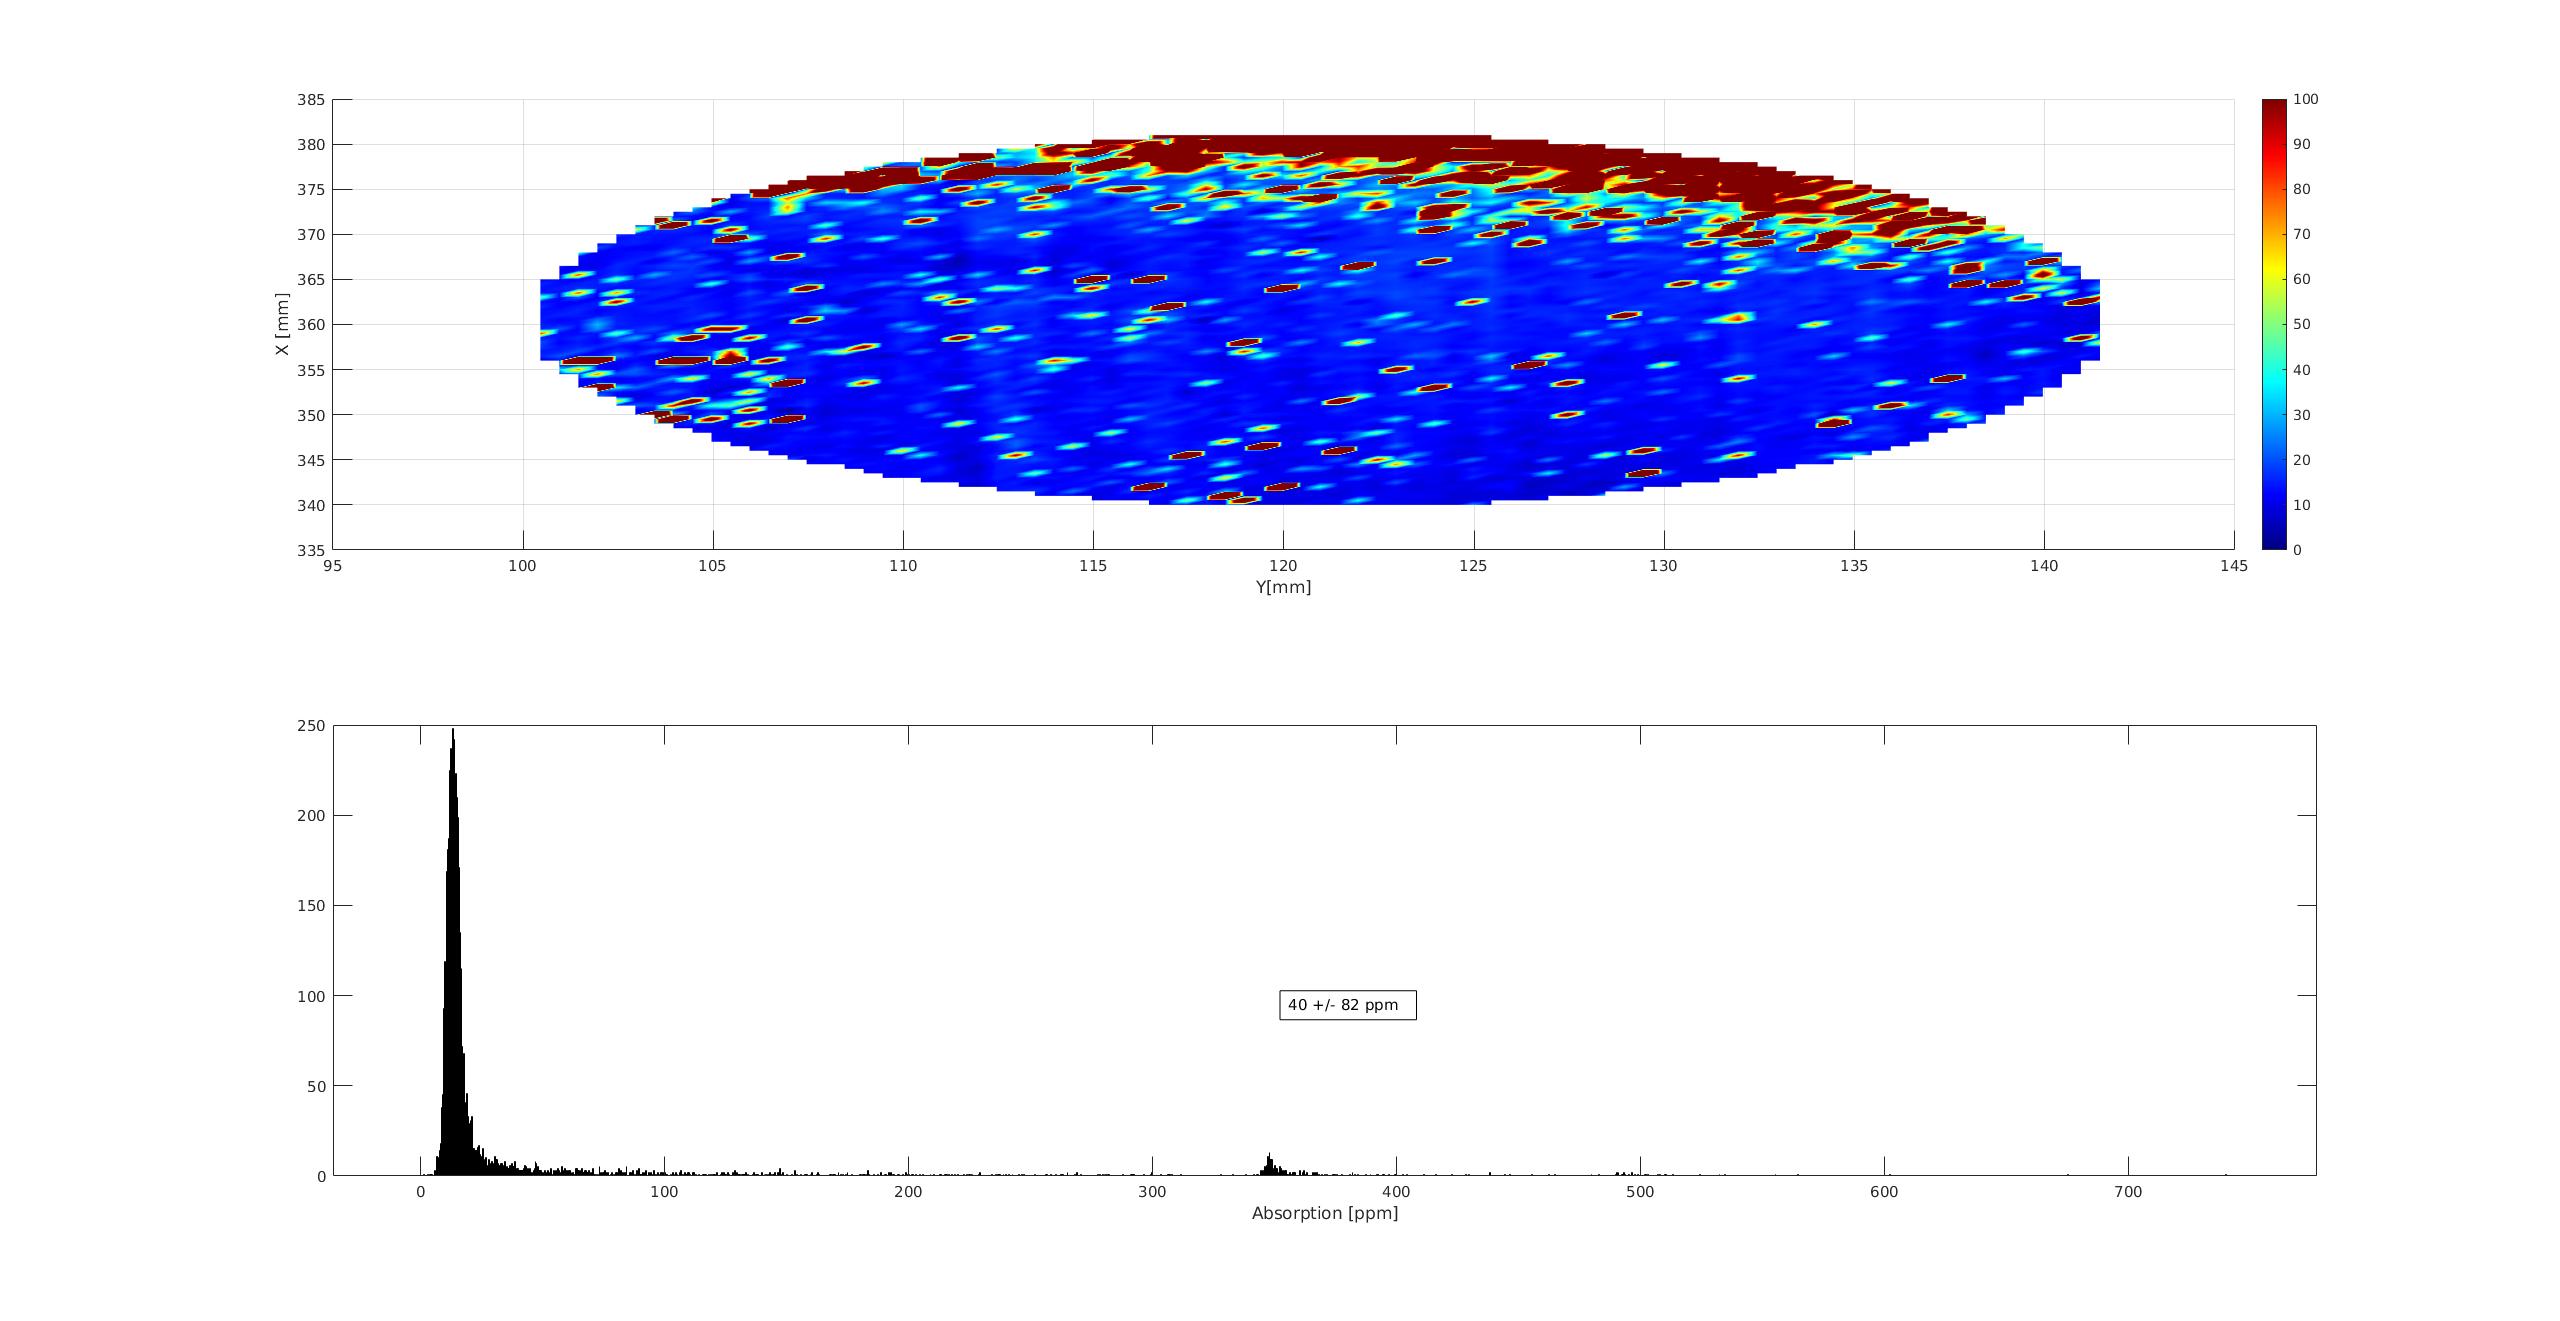
However, as seen in figure 3 (same measurement as in figure 2 but with constrained colorscale limits), there seems to be absorption spots with absorption > 100 ppm appearing in this area..
To understand how stable the GR lock can provide for the detuning, I would propose the record AOM frequency few times one day. And up to few days or weeks at least.
Note: we should try to not change alignment condition and use the same pointing.
1. 2021/06/20 12:10 109.538080MHz
2. 2021/06/21 09:20 109.538070MHz
3. 2021/06/21 14:21 109.538070MHz
4. 2021/06/21 21:37 109.538060MHz
5. 2021/06/22 09:27 109.538070MHz
6. 2021/06/22 13:29 109.538075MHz
7. 2021/06/22 15:53 109.538065MHz
8. 2021/06/23 09:07 109.538055MHz
9. 2021/06/23 13:27 109.538055MHz
10. 2021/06/23 21:40 109.538064MHz
11. 2021/06/24 09:53 109.538066MHz
12. 2021/06/24 13:53 109.538070MHz
13. 2021/06/24 20:02 109.538060MHz
14. 2021/06/25 16:06 109.538060MHz
15. 2021/06/25 19:02 109.538050MHz
16. 2021/06/26 10:37 109.538047MHz
17. 2021/06/26 20:06 109.538040MHz
18. 2021/06/27 11:04 109.538045MHz
19. 2021/06/27 19:21 109.538030MHz
20. 2021/06/28 10:01 109.538050MHz
21. 2021/06/28 15:00 109.538020MHz
22. 2021/06/28 22:00 109.537910MHz
23. 2021/06/29 15:59 109.538030MHz
24. 2021/06/30 09:56 109.538070MHz
25. 2021/06/30 20:19 109.538060MHz
26. 2021/07/1 11:01 109.538065MHz
27. 2021/07/1 20:12 109.538065MHz
28. 2021/07/2 08:54 109.538060MHz
29. 2021/07/2 20:06 109.538030MHz
30. 2021/07/3 07:06 109.538024MHz
31. 2021/07/4 09:29 109.538060MHz
32. 2021/07/5 16:37 109.538050MHz
33. 2021/07/6 10:23 109.538030MHz
In the last week, resonant condition between GR and IR changed by around 20Hz.
To check if there is any correlation with suspended mirrors, I checked the oplev signal of all mirrors. Basically all mirrors are staying in the same orientiation, but end mirrors have quite obvious drift during the last week. In fact, this drift seems to be not really because we are not really correcting it by the coils. So we need to investigate why end mirror oplev is behaving like this.
Yesterday, the IR transmission was more than 400, but it was only ~200 today. Although we could recover the IR transmission more than 400 easily, the stability of injection alignment might not be good even with new mirror mounts. According to Yuhang, the alignment can be changed just after the new mirror mounts are placed. Let's see the long term stability.
We recovered the IR injection alignment. The IR injection power was 430uW. The mode matching is 94.3%. Note that the misalignment is combination of pitch and yaw (top right and bottom left sides are bright).
| AOM frequency (MHz) | Mode | IR transmission |
| 109.53807 | TEM00 | 460 |
| 109.93560 | misalignment | 105 |
| 110.33163 | LG | 105 |
| offset | 94 |
I brought in PCI the cleaned viewport. Aso-san helped me confirm that the cleaned surface is the one where there is no more indium at the edge.
I installed this viewport on the holder with the correct surface facing the lasers.
I realigned DC and started the measurement.
The procedure I'm planning to do is to start from 28 mW and increase step by step up to 600 mW (eg 100,200,30, etc..)
I did the first measurement with 28 mW and got the result attached in figure 1.
It seems that we don't have clear signal on most of the map. But there are few points where the absorption seems quite high.
Sadly I was not present in the PCI during this measurement so I can not confirm that there was no saturation of the lockin so these maximal values of absorption are not reliable.
A possibility for further inspection is to repeat this measurement with same power but only around the dirty spots and make sure that the lockin is not saturating.
Depending on the absorption value of these spots, include them or not in the maps with higher laser power.
I got a bit sceptical of the spare viewport measurement reported in entry 2580.
Indeed the absorption seems too uniform with really low value..
- Discussing with Matteo, a possibility could be that the spare viewport is tilted (indeed it is placed inside a tama size holder with the addition of 2 spacers to compensate the 1 cm thickness of the viewport). That would make the surface calibration not reliable.
So I reinstalled spare viewport and aligned the DC with Pin = 0.6248W.
First, I checked the tilt of the viewport by doing Z scan and checking the the Z center of the absorption (computed from the 2 positions where the phase is 0 deg) .
| X [mm] | Y [mm] | Z center [mm] | screenshot time | |
| top | 301.75 | 120.95 | 73.6 | 18h39 |
| bottom | 361.75 | 120.95 | 73.25 | 18h42 |
| left | 331.75 | 90.95 | 73.45 | 18h45 |
| right | 331.75 | 150.95 | 73.35 | 18h47 |
| center | 331.75 | 120.95 | 73.4 | 18h35 |
From these measurements, it seems that the difference of the Z center over the radius of the absorption map is ~0.35 mm. This is far smaller than the interaction length ~2 mm (see Manuel PhD).
So we can conclude that there is negligeable tilt with this holder.
- Another possibility could be that the lockin sensitivity was saturating at a low value, making a constant noise level fakes an absorption signal.
However, an easy check is to double the power and check if the AC signal is also doubled. That would confirm that the signal we are seeing is coming from absorption.
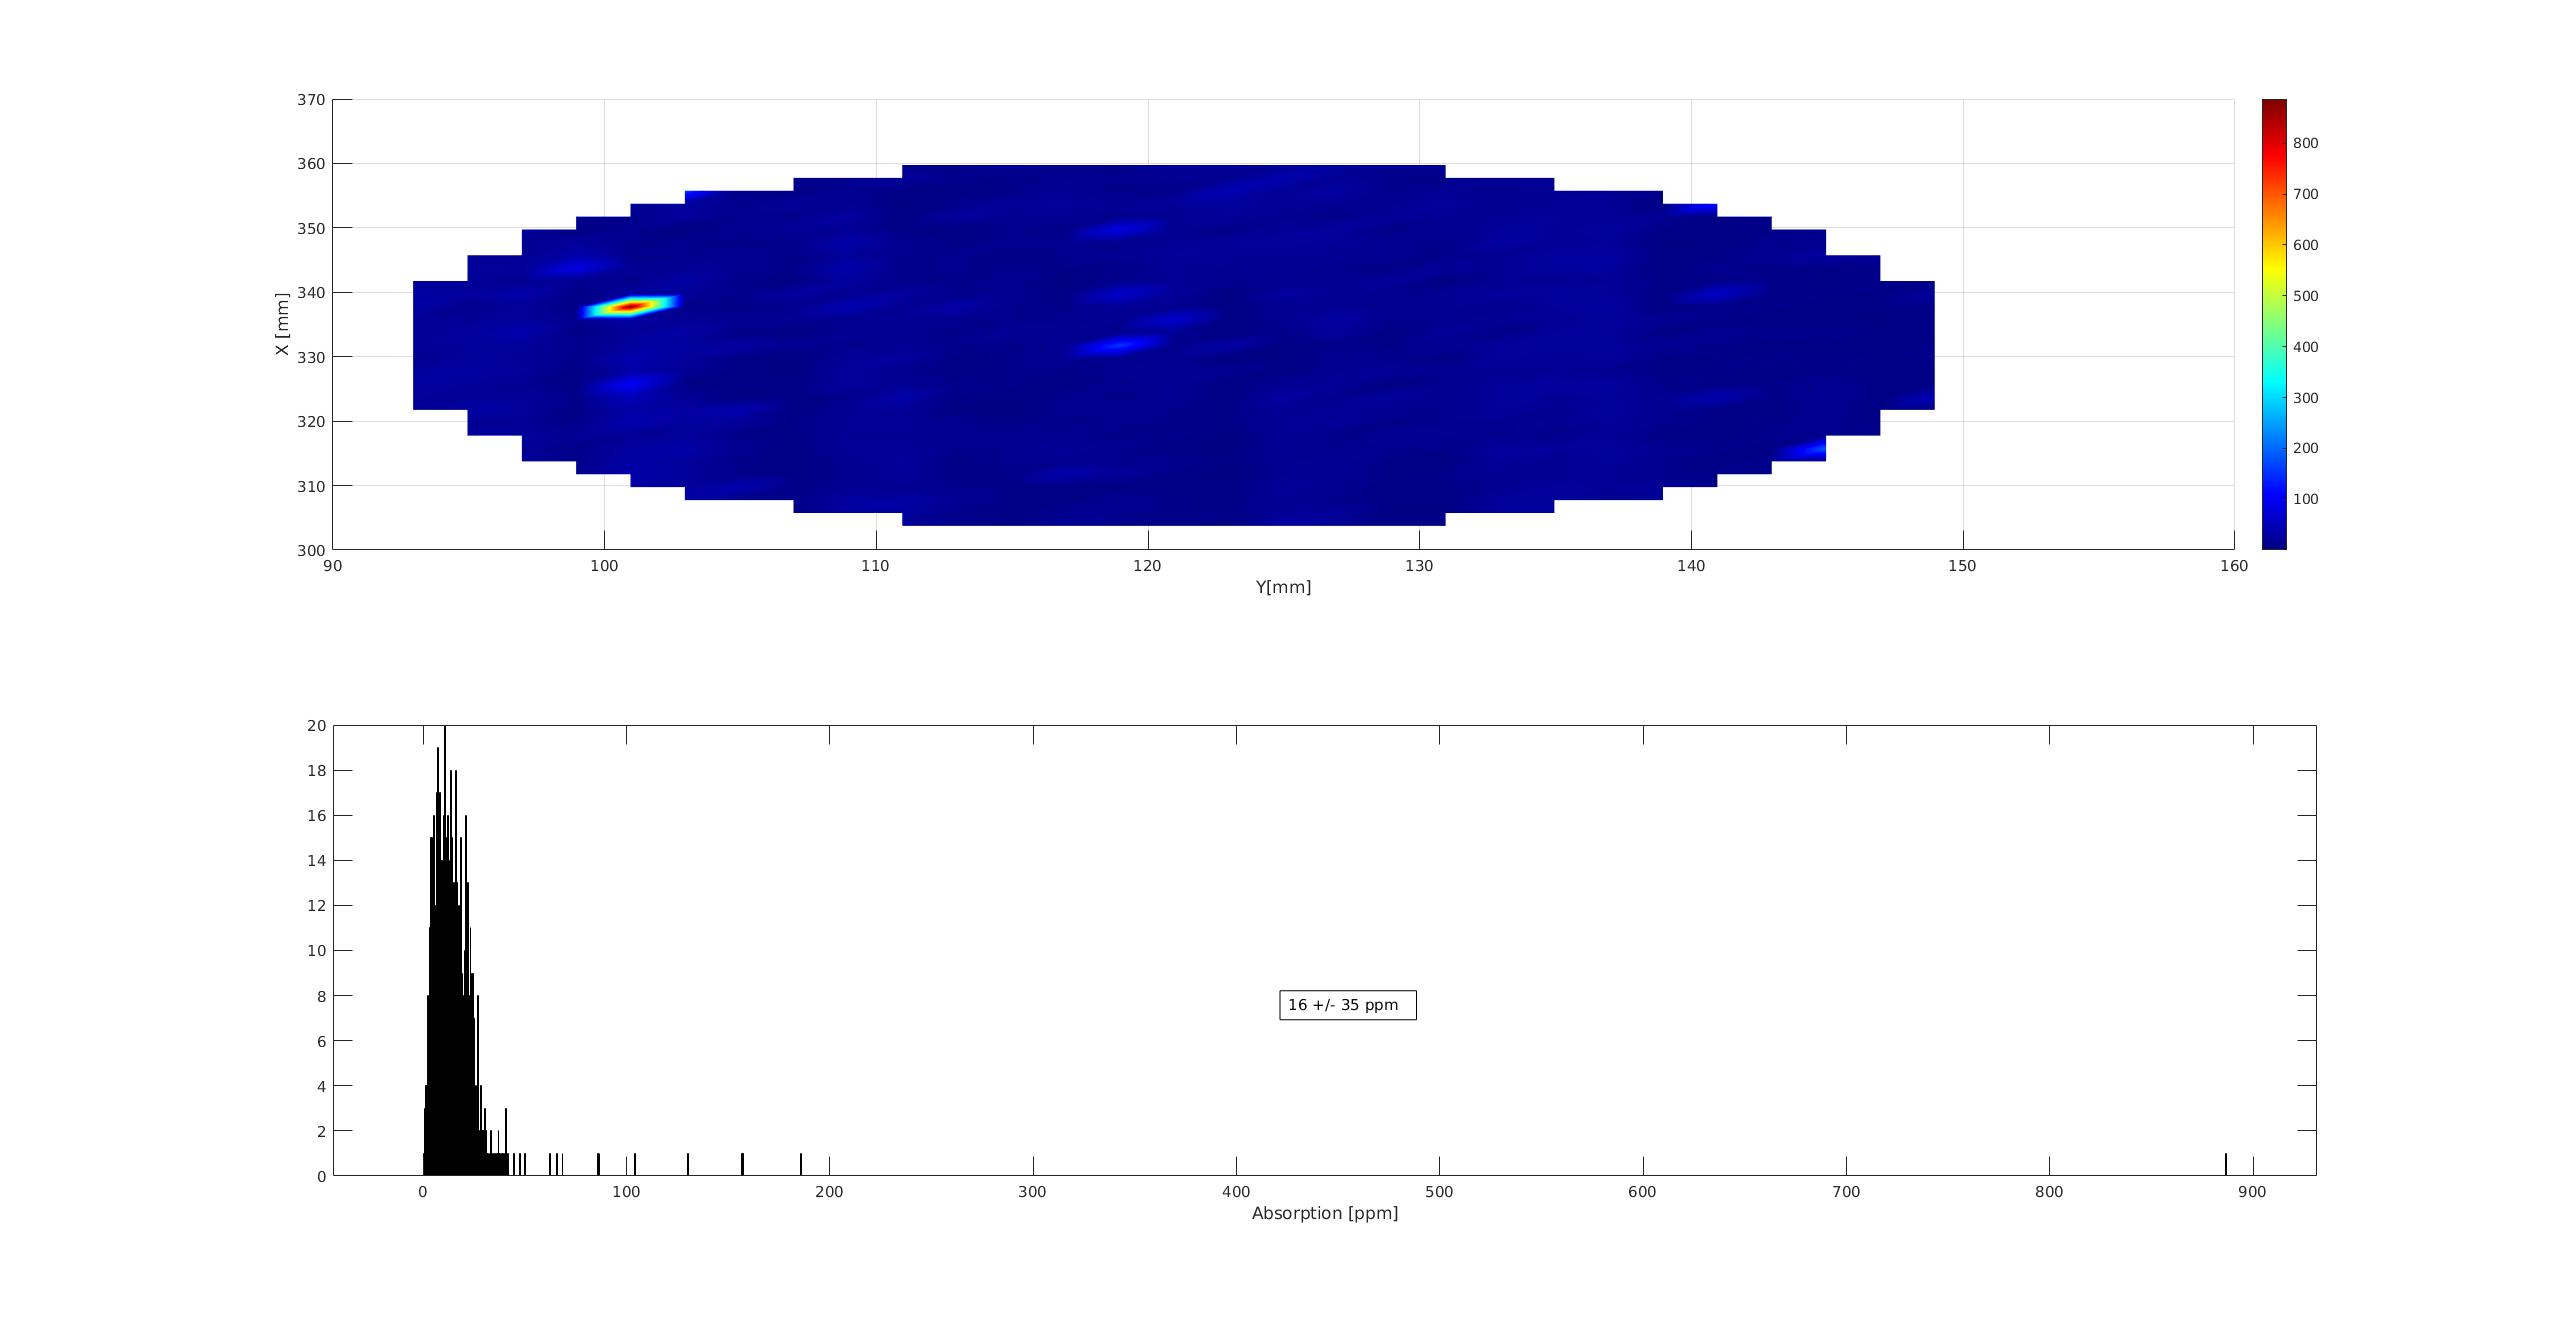
Therefore, I decided to do a new measurement with Pin = 1.2545 W (radius 30mm and step size 2 mm) which is roughly twice larger than the measurement reported in entry 2580.
The mean ac value went from 8.1 e-4 to 1.6e-3. This confirms that we are seeing absorption signal !
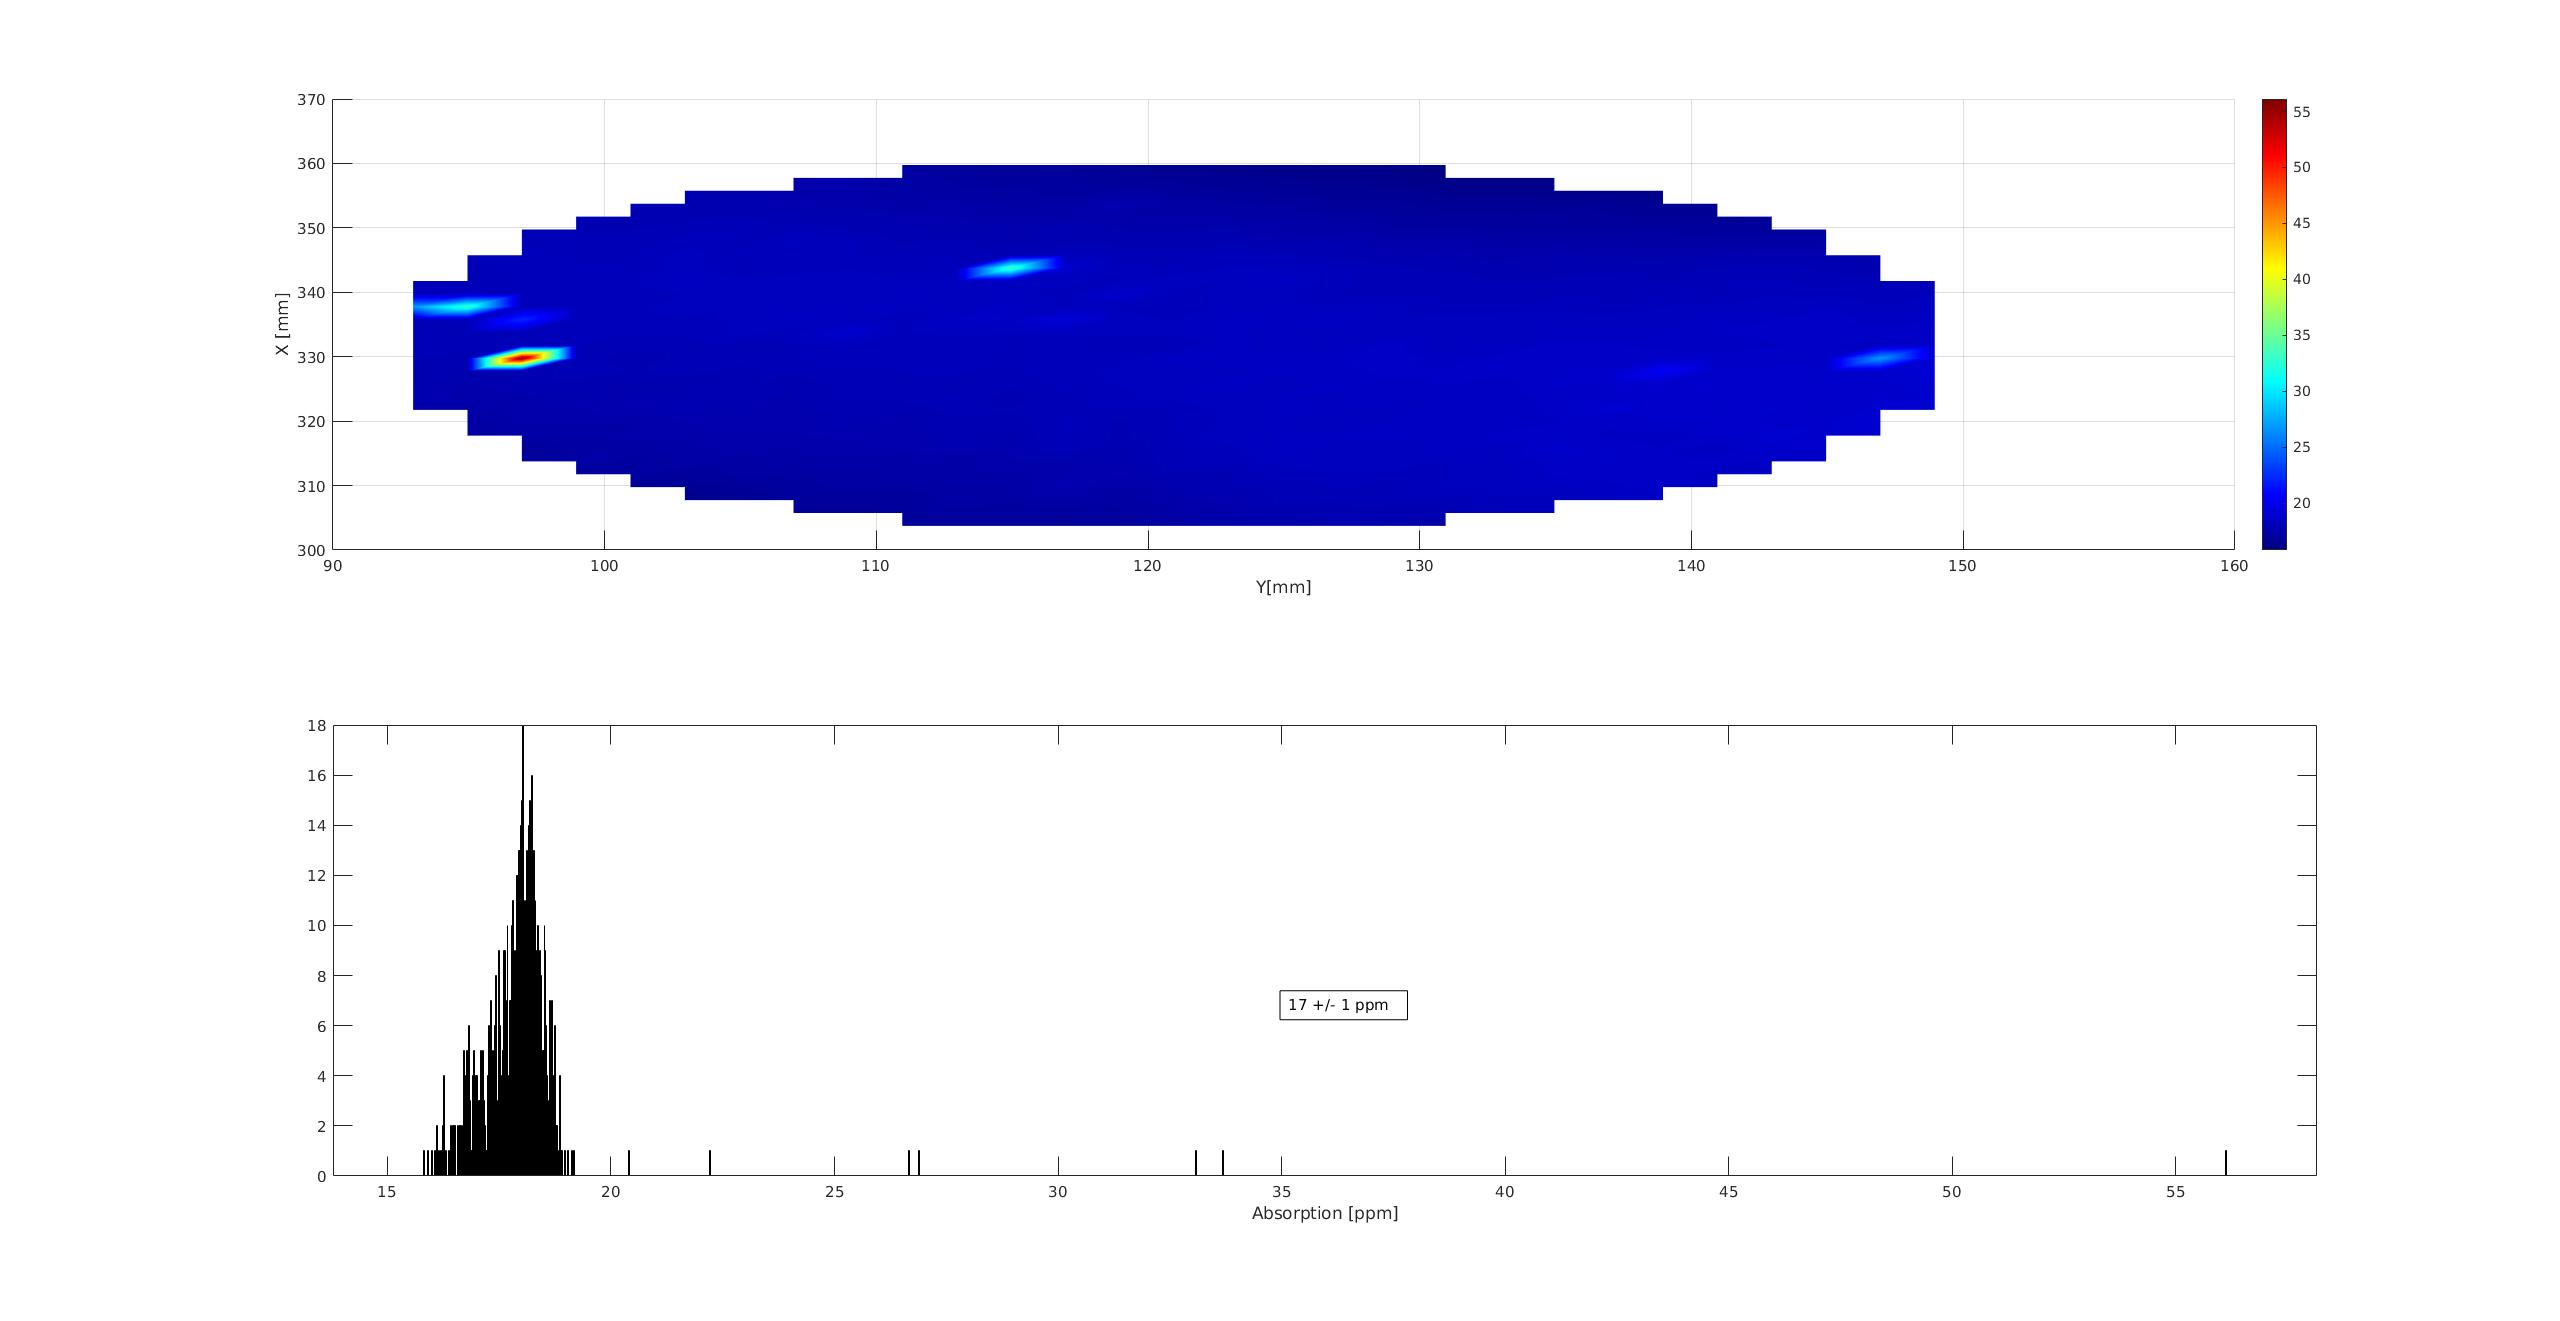
Finally I also took a new absorption map with this higher power as reported in figure 1.
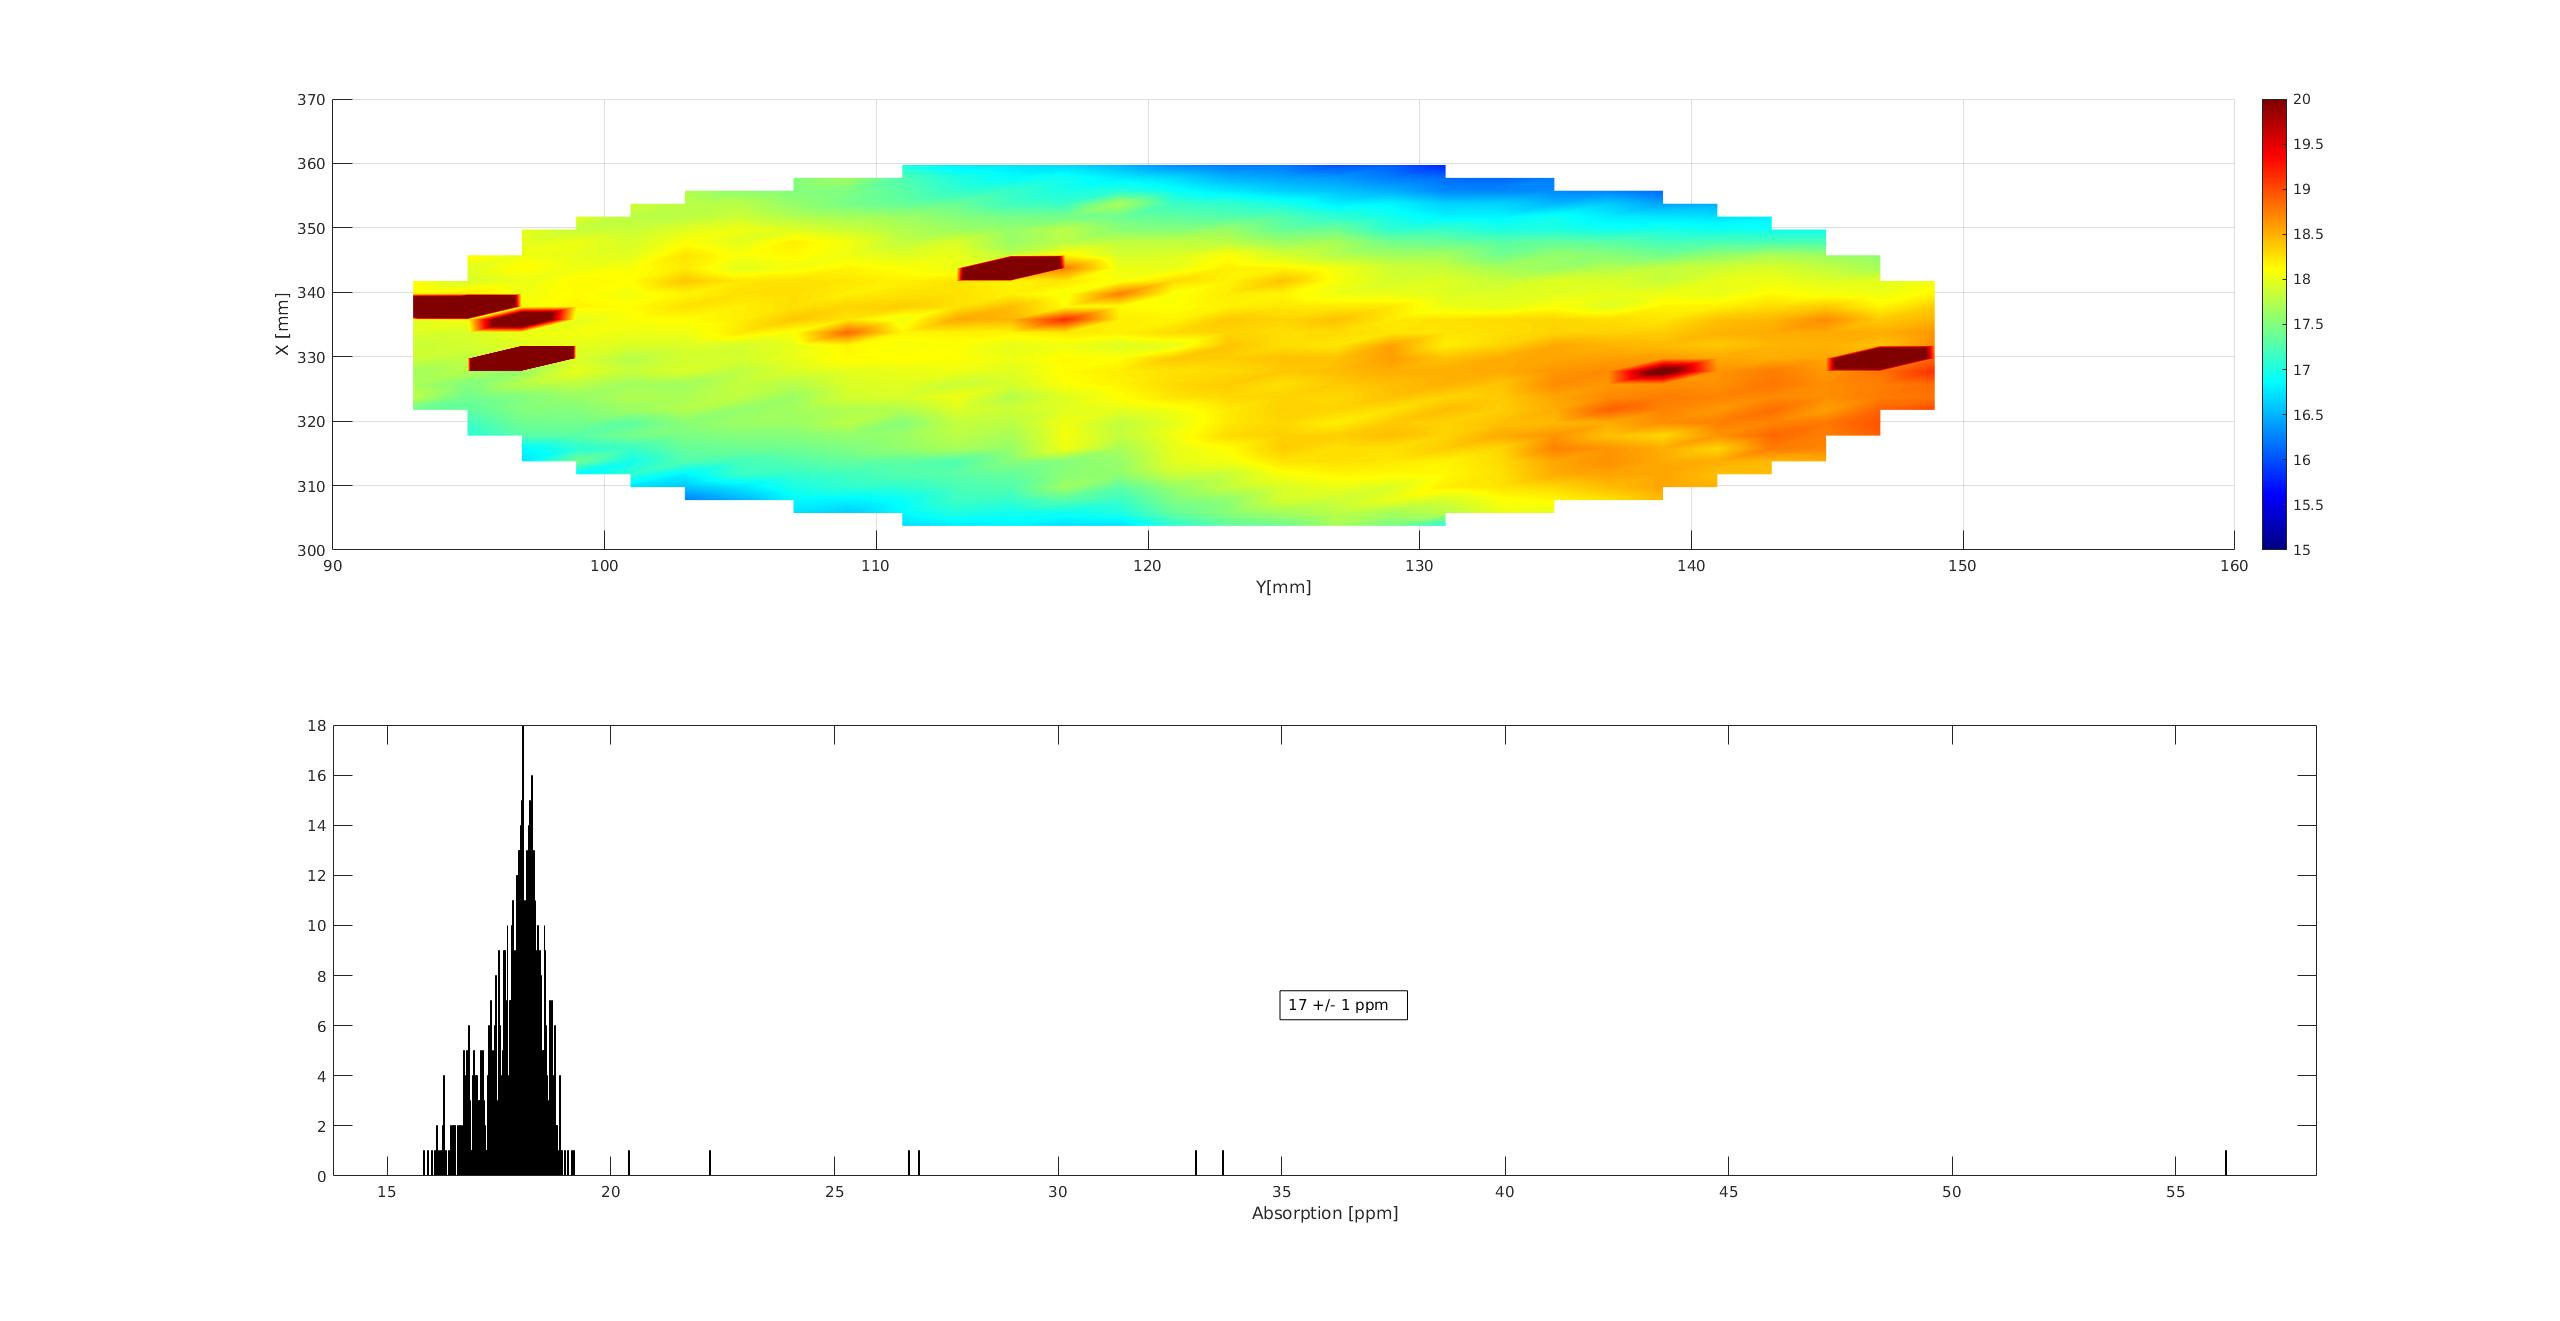
In figure 2, you can see the same map but with the colorscale constraint between 15 and 20 ppm and we can see the (small) non-uniformity of the viewport absorption.
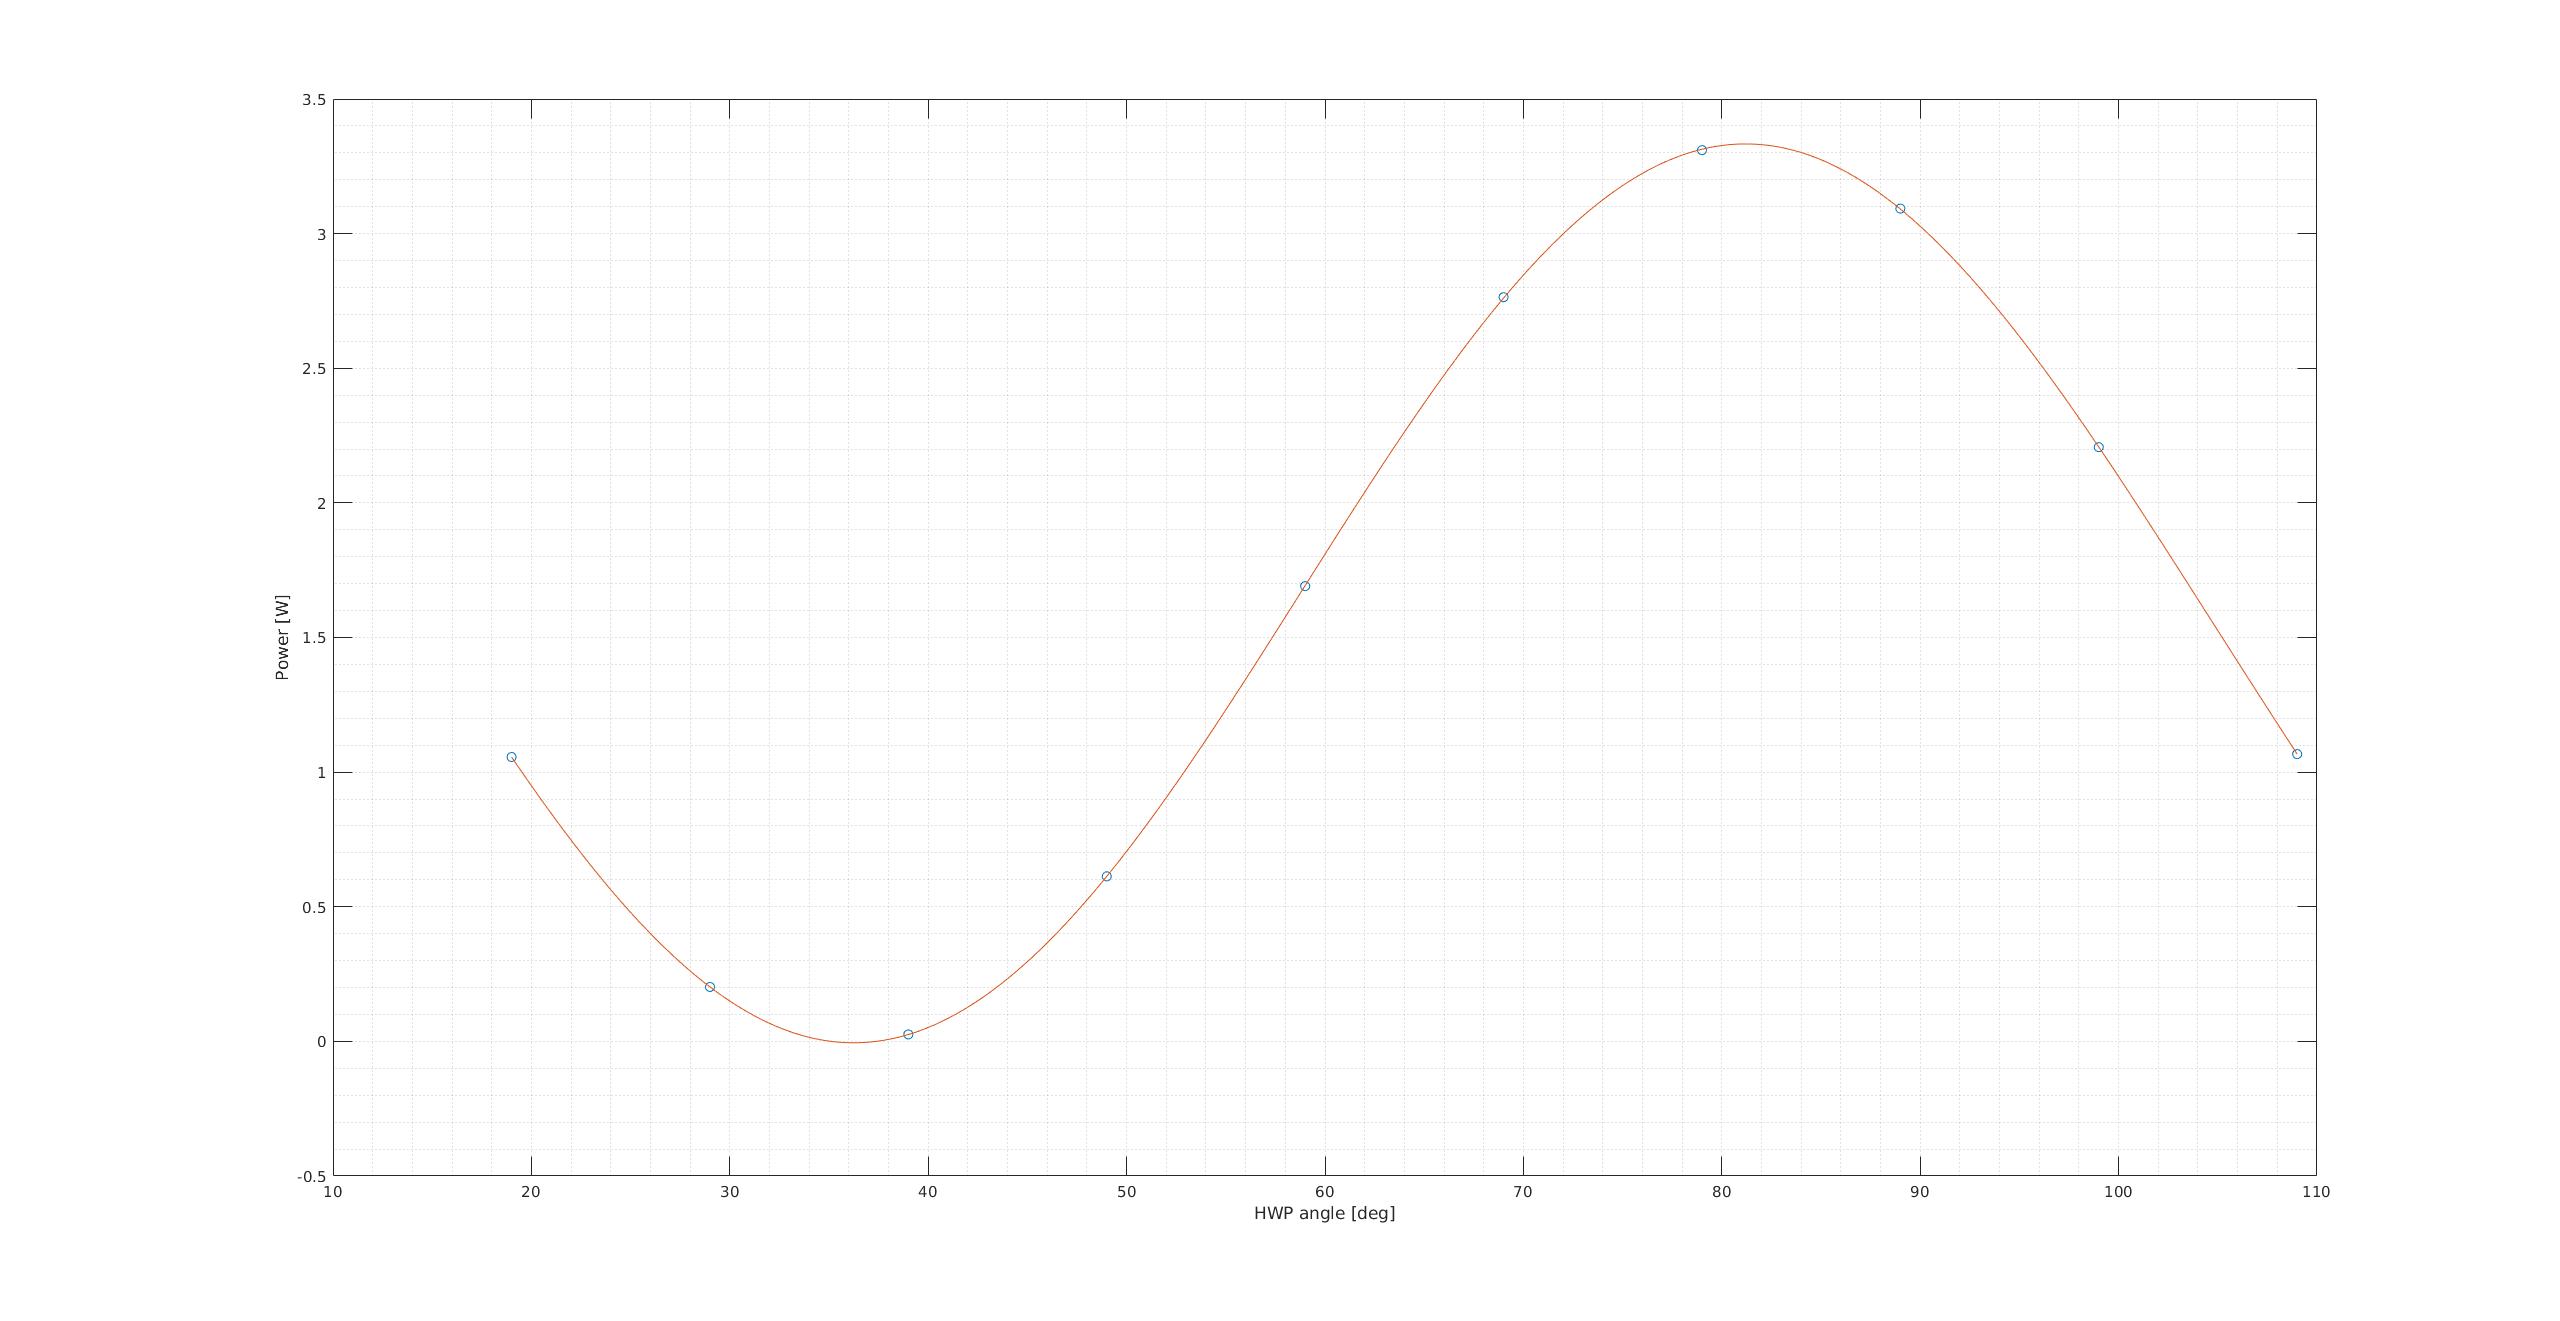
I fitted the power as a function of the HWP angle.
Quite useful to know how to increase the power step by step.
[Aritomi, Yuhang, Michael, Marc]
Today the new mirror mounts (FMD MM1000S) arrived and we started the replacement work.
We replaced 1 mirror mount before AMC and 3 mirror mounts in IR injection path.
We also replaced 5 mirrors in the IR injection path with layertec mirror (106910) whose reflectivity is more than 99.9%.
While I mounted the mirror, I tightened the screw too much and broke one mirror...
After the replacement work, we completely lost the IR alignment, but we recovered it. Now the IR transmission is more than 400 with 450uW injection. The IR transmission should be more than 500 with 450uW injection, so we still need to optimize it.
From tomorrow, we will optimize the injection alignment and replace mirrors and mirror mounts in the reflection path and try to optimize the reflection mode matching.
[Aritomi, Michael]
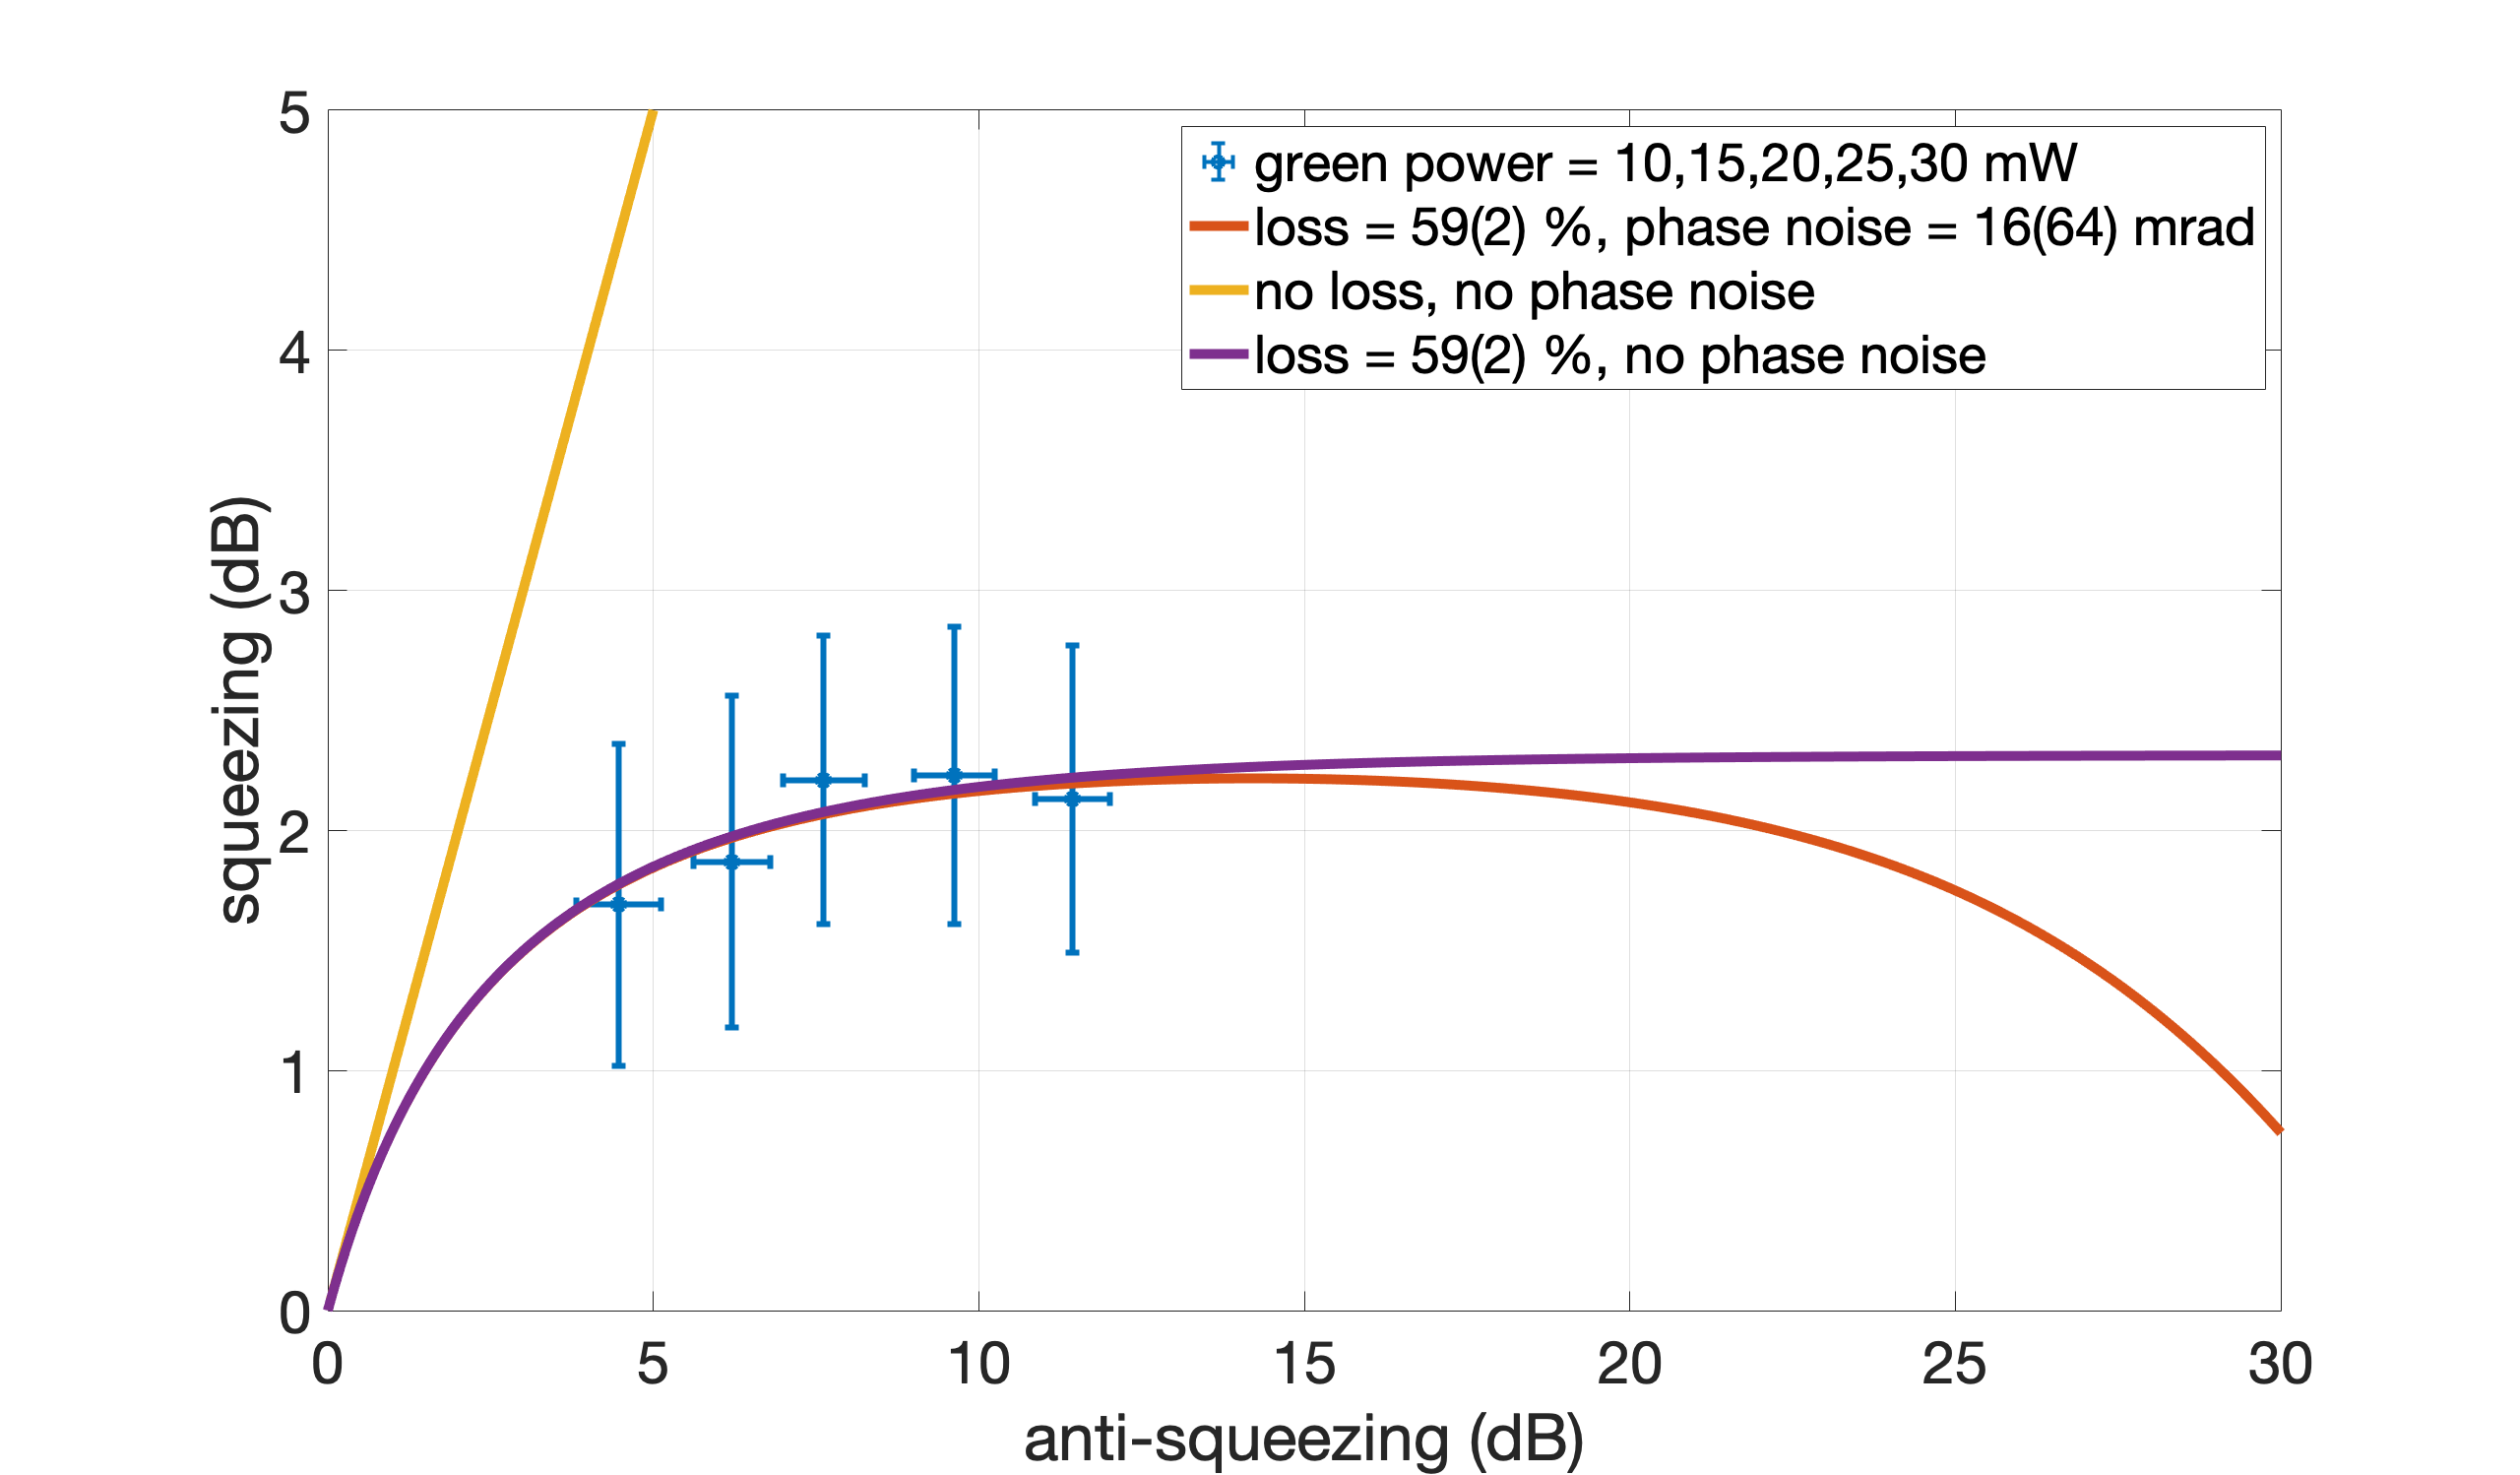
We measured squeezing and anti-squeezing for different green power with CCFC. We changed the green power from 10mW to 30mW with 5mW step. The OPO temperature and p pol PLL frequency are summarized in elog2577.
For green power larger than 40mW, we couldn't find squeezing (~ -130dBm at minimum) and the noise level suddenly changed from -130dBm to -110dBm...
The result is shown in the attached figure. Since we couldn't inject large green power, the phase noise information cannot be extracted.
I measured the round trip losses with new beam spot which has more stable IR transmission. The round trip losses are 139 ppm.
P_res = 245; % BAB reflection power on resonance (uW)
P_in = 362; % BAB reflection power off resonance (uW)
R_gamma = P_res/P_in;
gamma = 0.05; % uncoupled power to the cavity: 5% from mode mismatch
R = (R_gamma-gamma)/(1-gamma);
T = 0.00136; % input mirror transmissivity
L = (T/2)*(1-R)/(1+R) = 139 ppm
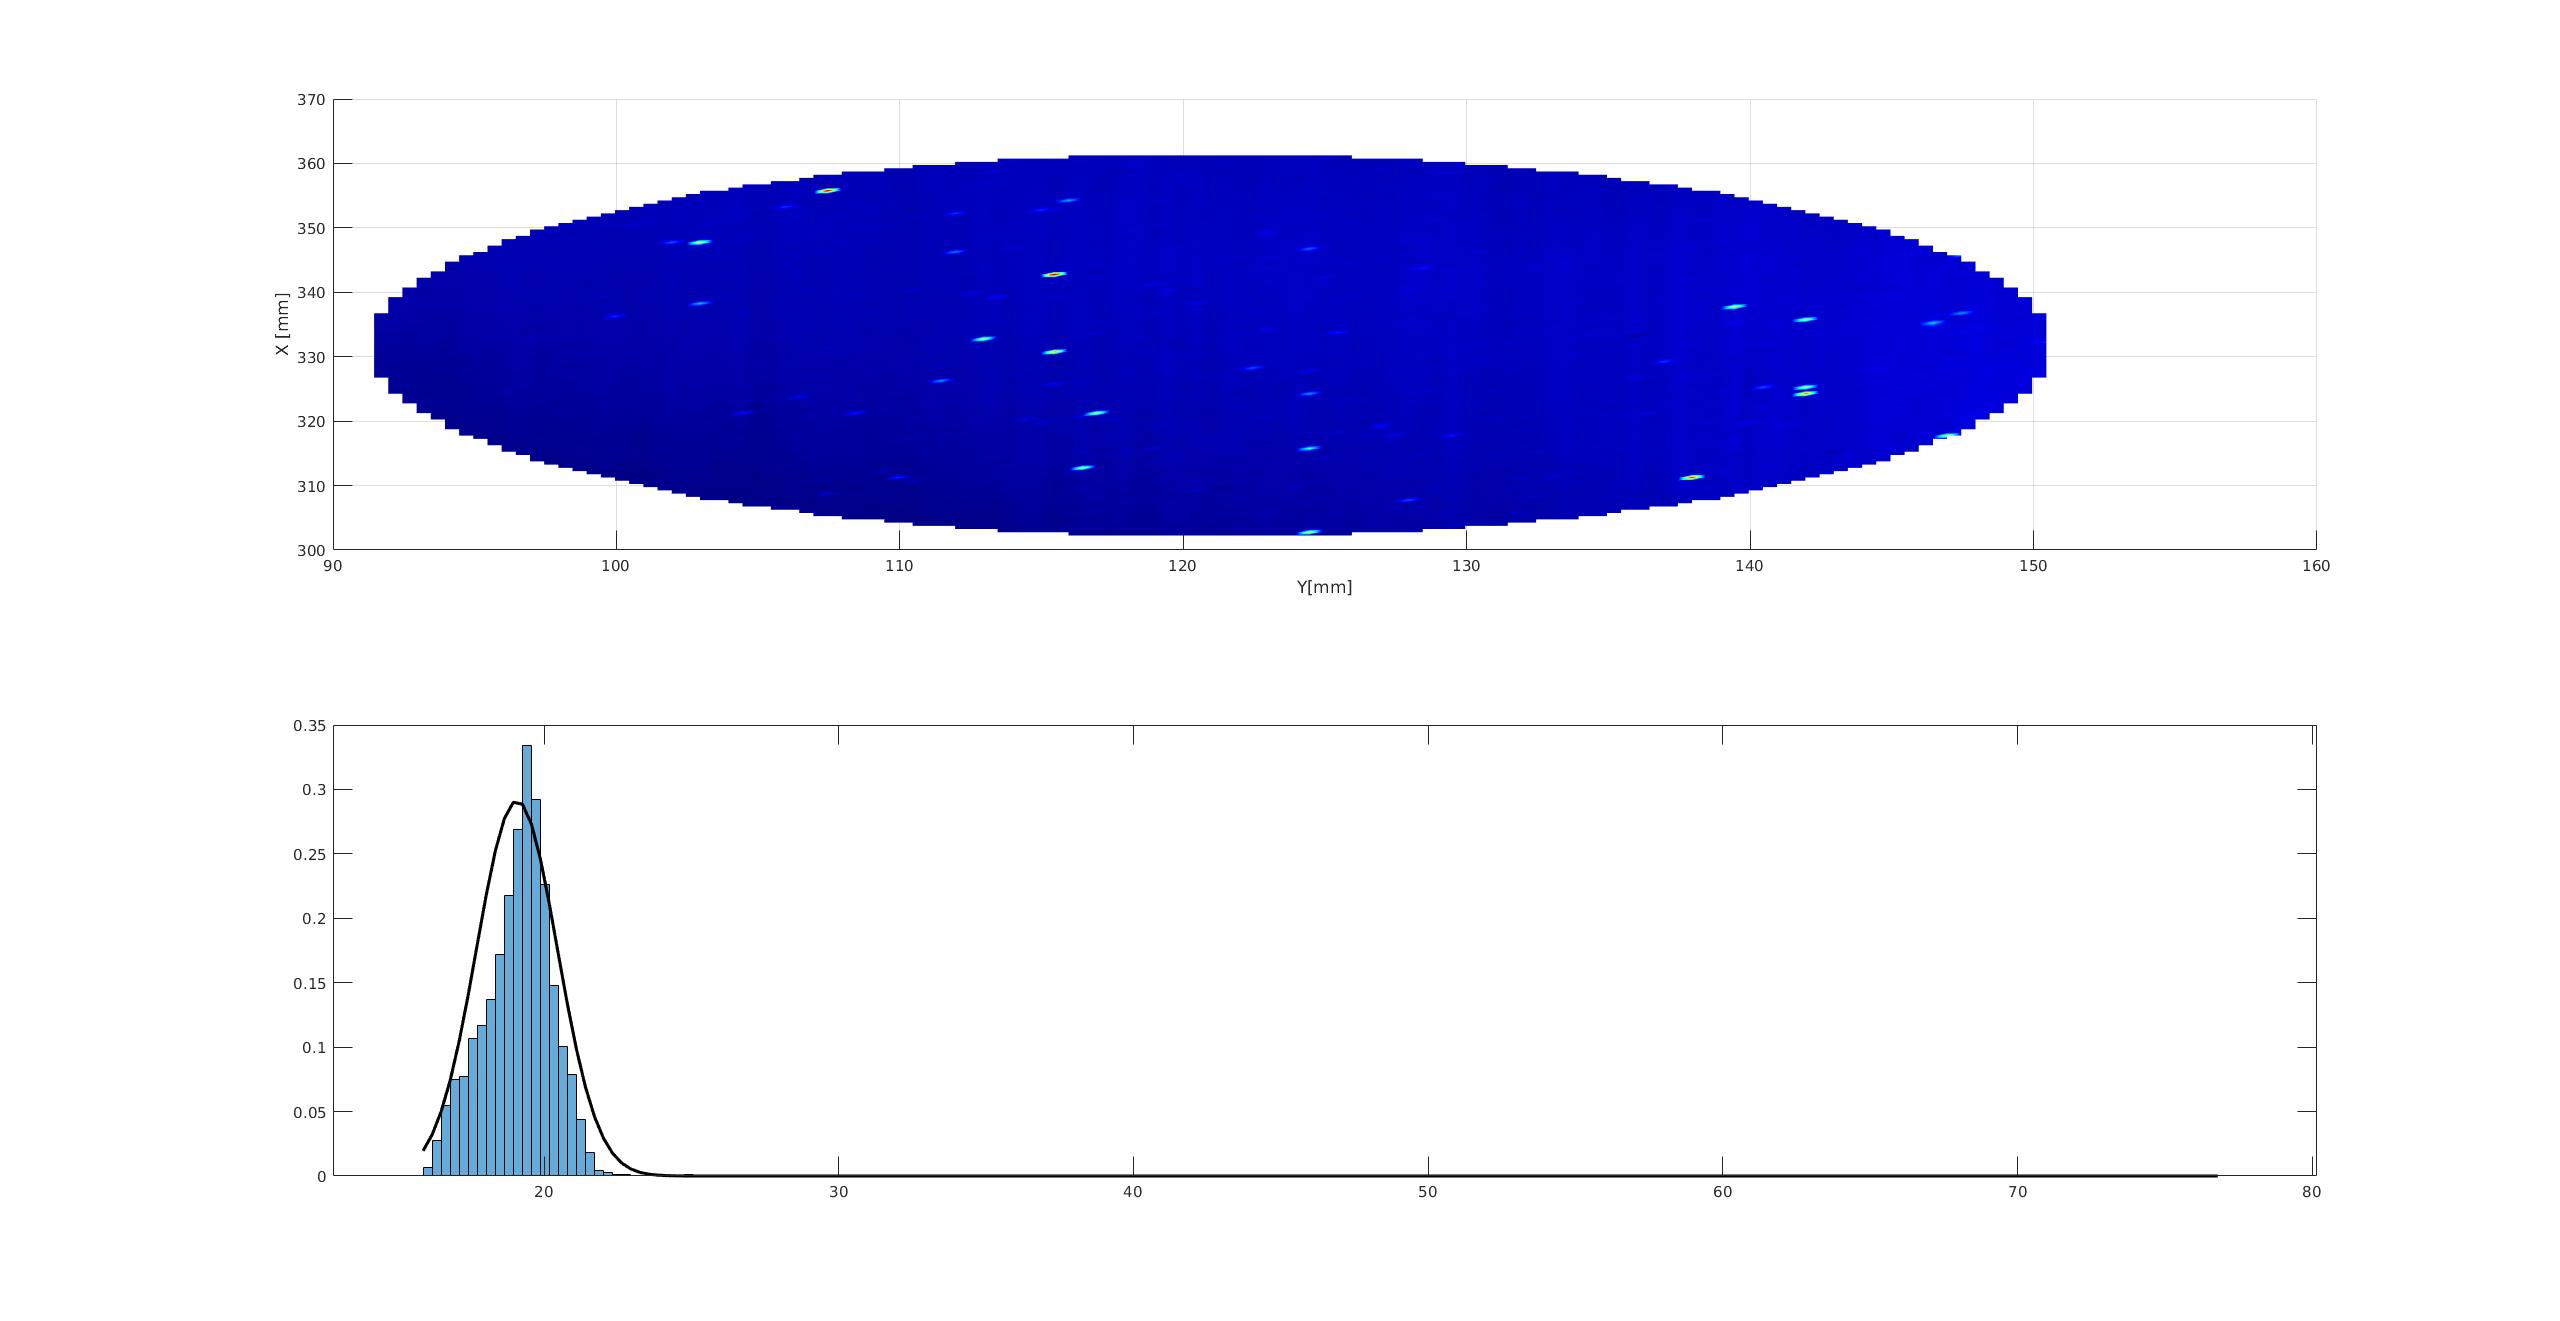
Despite 2 windows updates that turned off the computer I finally finished the measurement of the absorption map of the spare viewport (see fig 1).
In order to recover the lost time I changed the step size to 0.5 mm.
The mean absorption is at the order of 18 ppm while there is some dust/surface defects creating few spikes in the absorption.
Marc and Yuhang
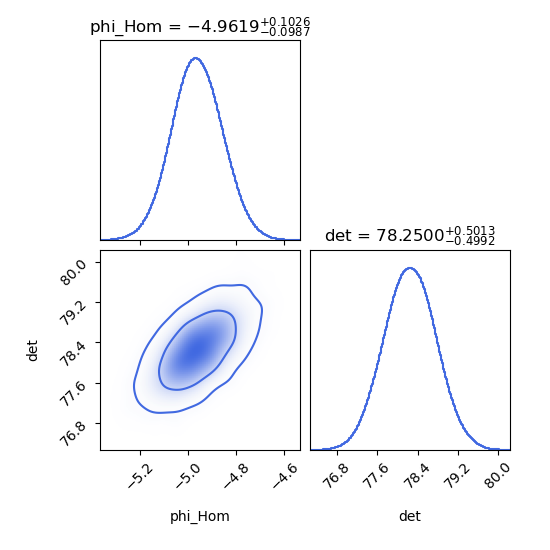
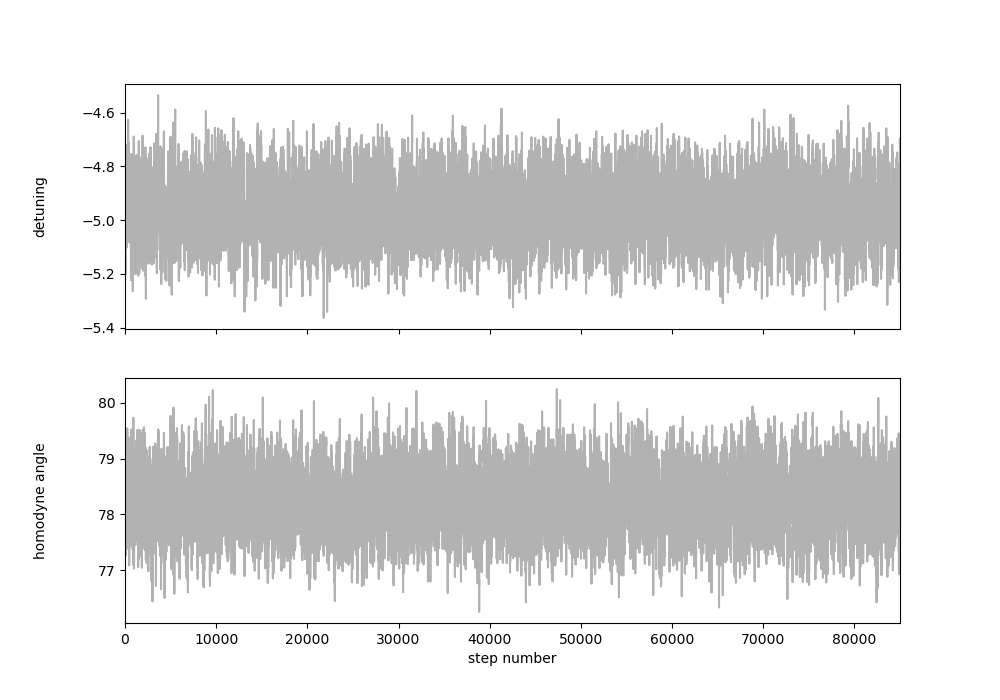
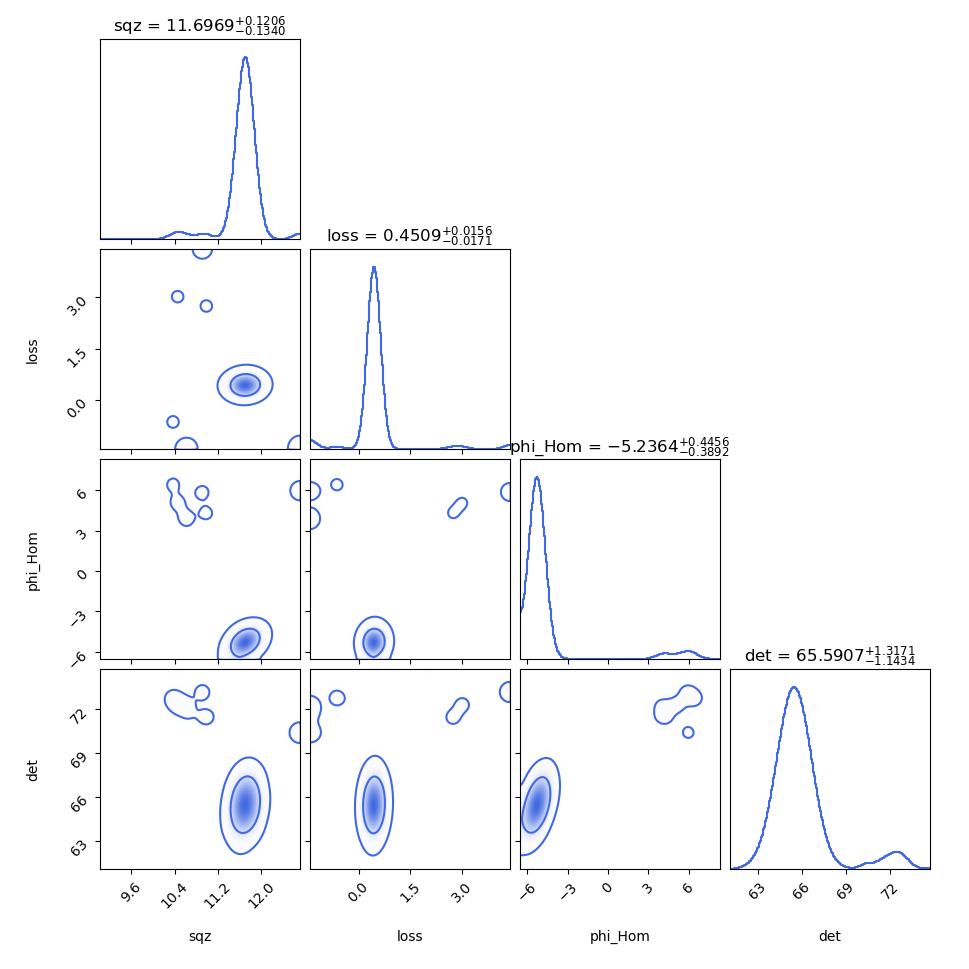
We ran mcmc fit of measurement in elog2546 based on the emcee pakage. This run took about 3 hours by using a computer with 20 cores, which is ten times faster than the time of 30 hours by using a single core. This time consuming is reasonable since there will be some overhead while using multiprocessing.
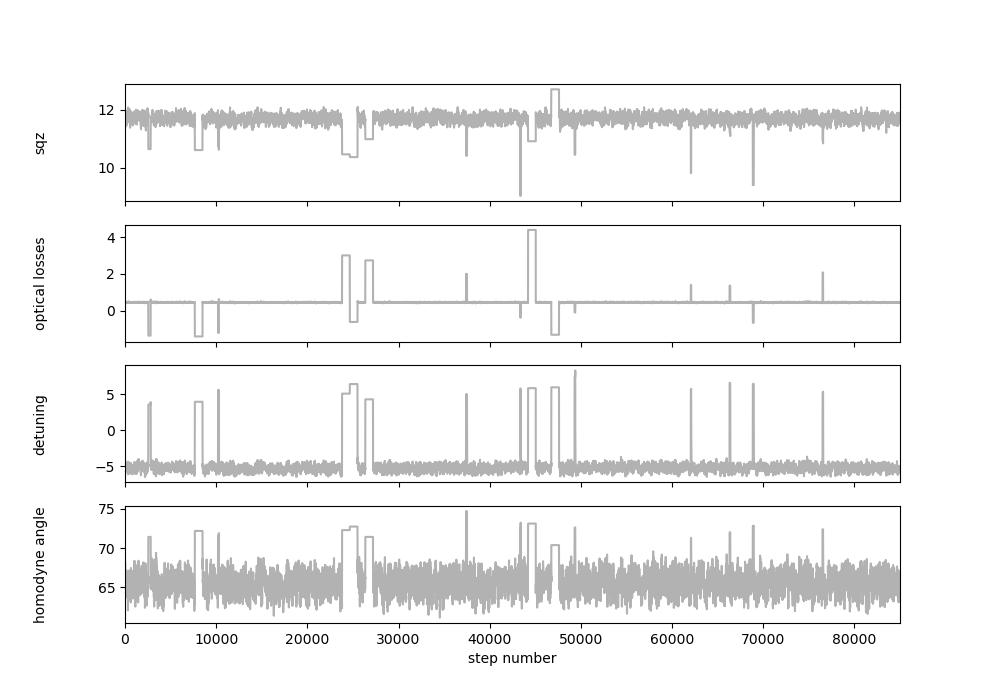
In this run, we tried two situations: two free parameters (detuning, homodyne angle), four free parameters (squeezing level, optical losses, detuning, homodyne angle).
The mcmc run for two free parameters is shown in attached figure 1 and 2. This run is very successful since we see a clear contour distribution in figure 1 and parameters are always in the stable region as figure 2.
| least square | mcmc | |
| homodyne angle | 5.3 +/- 0.2 | 4.9 +0.1026/-0.0987 |
| detuning | 72.1 +/- 0.6 | 78.25 + 0.5013/-0.4992 |
The mcmc run for four free parameters is shown in attached figure 3 and 4. This run needs some optimization.
I measured the IR injection mode matching with new beam spot which has more stable IR transmission.
First I optimized IR injection alignment with new beam spot. I checked the IR injection alignment by changing AOM frequency. The mode matching is 95.6%. Note that AA and BS pointing were engaged during this measurement.
After the IR injection alignment, IR transmission was 460 with 430uW injection. According to our experience, the IR transmission should be 490 with 430uW injection. The possible reason of the smaller IR transmission is that the IR transmission is off centered in transmission PD with new beam spot.
| AOM frequency (MHz) | mode | IR transmission |
| 109.53805 | TEM00 | 460 |
| 109.93494 | pitch | 100 |
| 110.33183 | LG | 105 |
| offset | 94 |
I recorded the thermistor (temperature) values that I used for the OPO nonlinear gain measurement.
Initially I searched in increments of +/- 0.01 kOhm on the thermistor, and then checked a bit within the optimal range. Perhaps there is further room for optimisation when zooming in on the oscilloscope though. At 100 mV/div ranges on the oscilloscope, the difference in voltage for thermistor change under 0.01 kOhm was hard to distinguish.
In the table I give the temperature, oscilloscope reading as well as the range value on the power meter - using a range of 1.6 mW on the power meter gives 10x more voltage on the oscilloscope than a range of 16 mW.
| green power [mW] | 0 | 10 | 15 | 20 | 25 | 30 | 35 | 40 | 50 | 60 |
| MZ offset | 3.9 | 4.0 | 4.1 | 4.2 | 4.3 | 4.4 | 4.5 | 4.7 | 4.9 | |
|
Amplification reading [mV] (power meter range [mW]) |
456 (1.6) | 1140 (1.6) | 1710 (1.6) | 234 (16) | 308 (16) | 408 (16) | 578 (16) | 816 (16) | ||
| De-amplification reading [mV] (power meter range [mW]) | 456 (1.6) | 240 (1.6) | 216 (1.6) | 192 (1.6) | 178 (1.6) | 166 (1.6) | 160 (1.6) | 152 (1.6) | ||
| Thermistor value [kOhm] | 7.137 | 7.147 | 7.165 | 7.173 | 7.185 | 7.196 | 7.203 | 7.215 | 7.215 | 7.225 |
| p pol PLL frequency [MHz] | 190 | 180 | 195 | 190 | 200 | 205 | 200 | 205 | 185 | 185 |
| Nonlinear gain | 1 | 2.5 | 3.8 | 5.1 | 6.8 | 8.9 | 12.7 | 17.9 |
Today I increased the laser diode current to 3A.
I also took compared the output power as a function of HWP angle :
| HWP angle [deg] | power [W] |
| 19 | 1.0561 |
| 29 | 0.2020 |
| 39 | 0.0258 |
| 49 | 0.613 |
| 59 | 1.691 |
| 69 | 2.764 |
| 79 | 3.310 |
| 89 | 3.093 |
| 99 | 2.207 |
| 109 | 1.067 |
I set the HWP to 49 degrees did a large z scan and could see some AC signal.
I checked the viewport center :
Z_center = 73.4 mm (from phase = 0)
Y_center = 120.95 mm (from ac/dc = 0)
X_center ~ 331.75 (one of the extrema was not possible to estimate because I placed a stop in Zaber to avoid burning the holder.
The X_center was estimated from the top X value of 383.9 mm and assuming a similar radius as the Y direction (52.15 mm)
I tuned the DC at this position and got as a preliminary absorption value :
corr = 1;
ac = 8e-4;
dc = 4.08;
Pin = 0.613;
R_surf = 17.033
absorption = ac/(dc*P_in*R_surf)*corr ~416 ppm 18 ppm (Edit : I took wrong power in previous estimation...)
The absorption map is now on-going with a 3 cm radius and 50 um step size.
I fitted the power as a function of the HWP angle.
Quite useful to know how to increase the power step by step.
This measurement was done on June 10th.
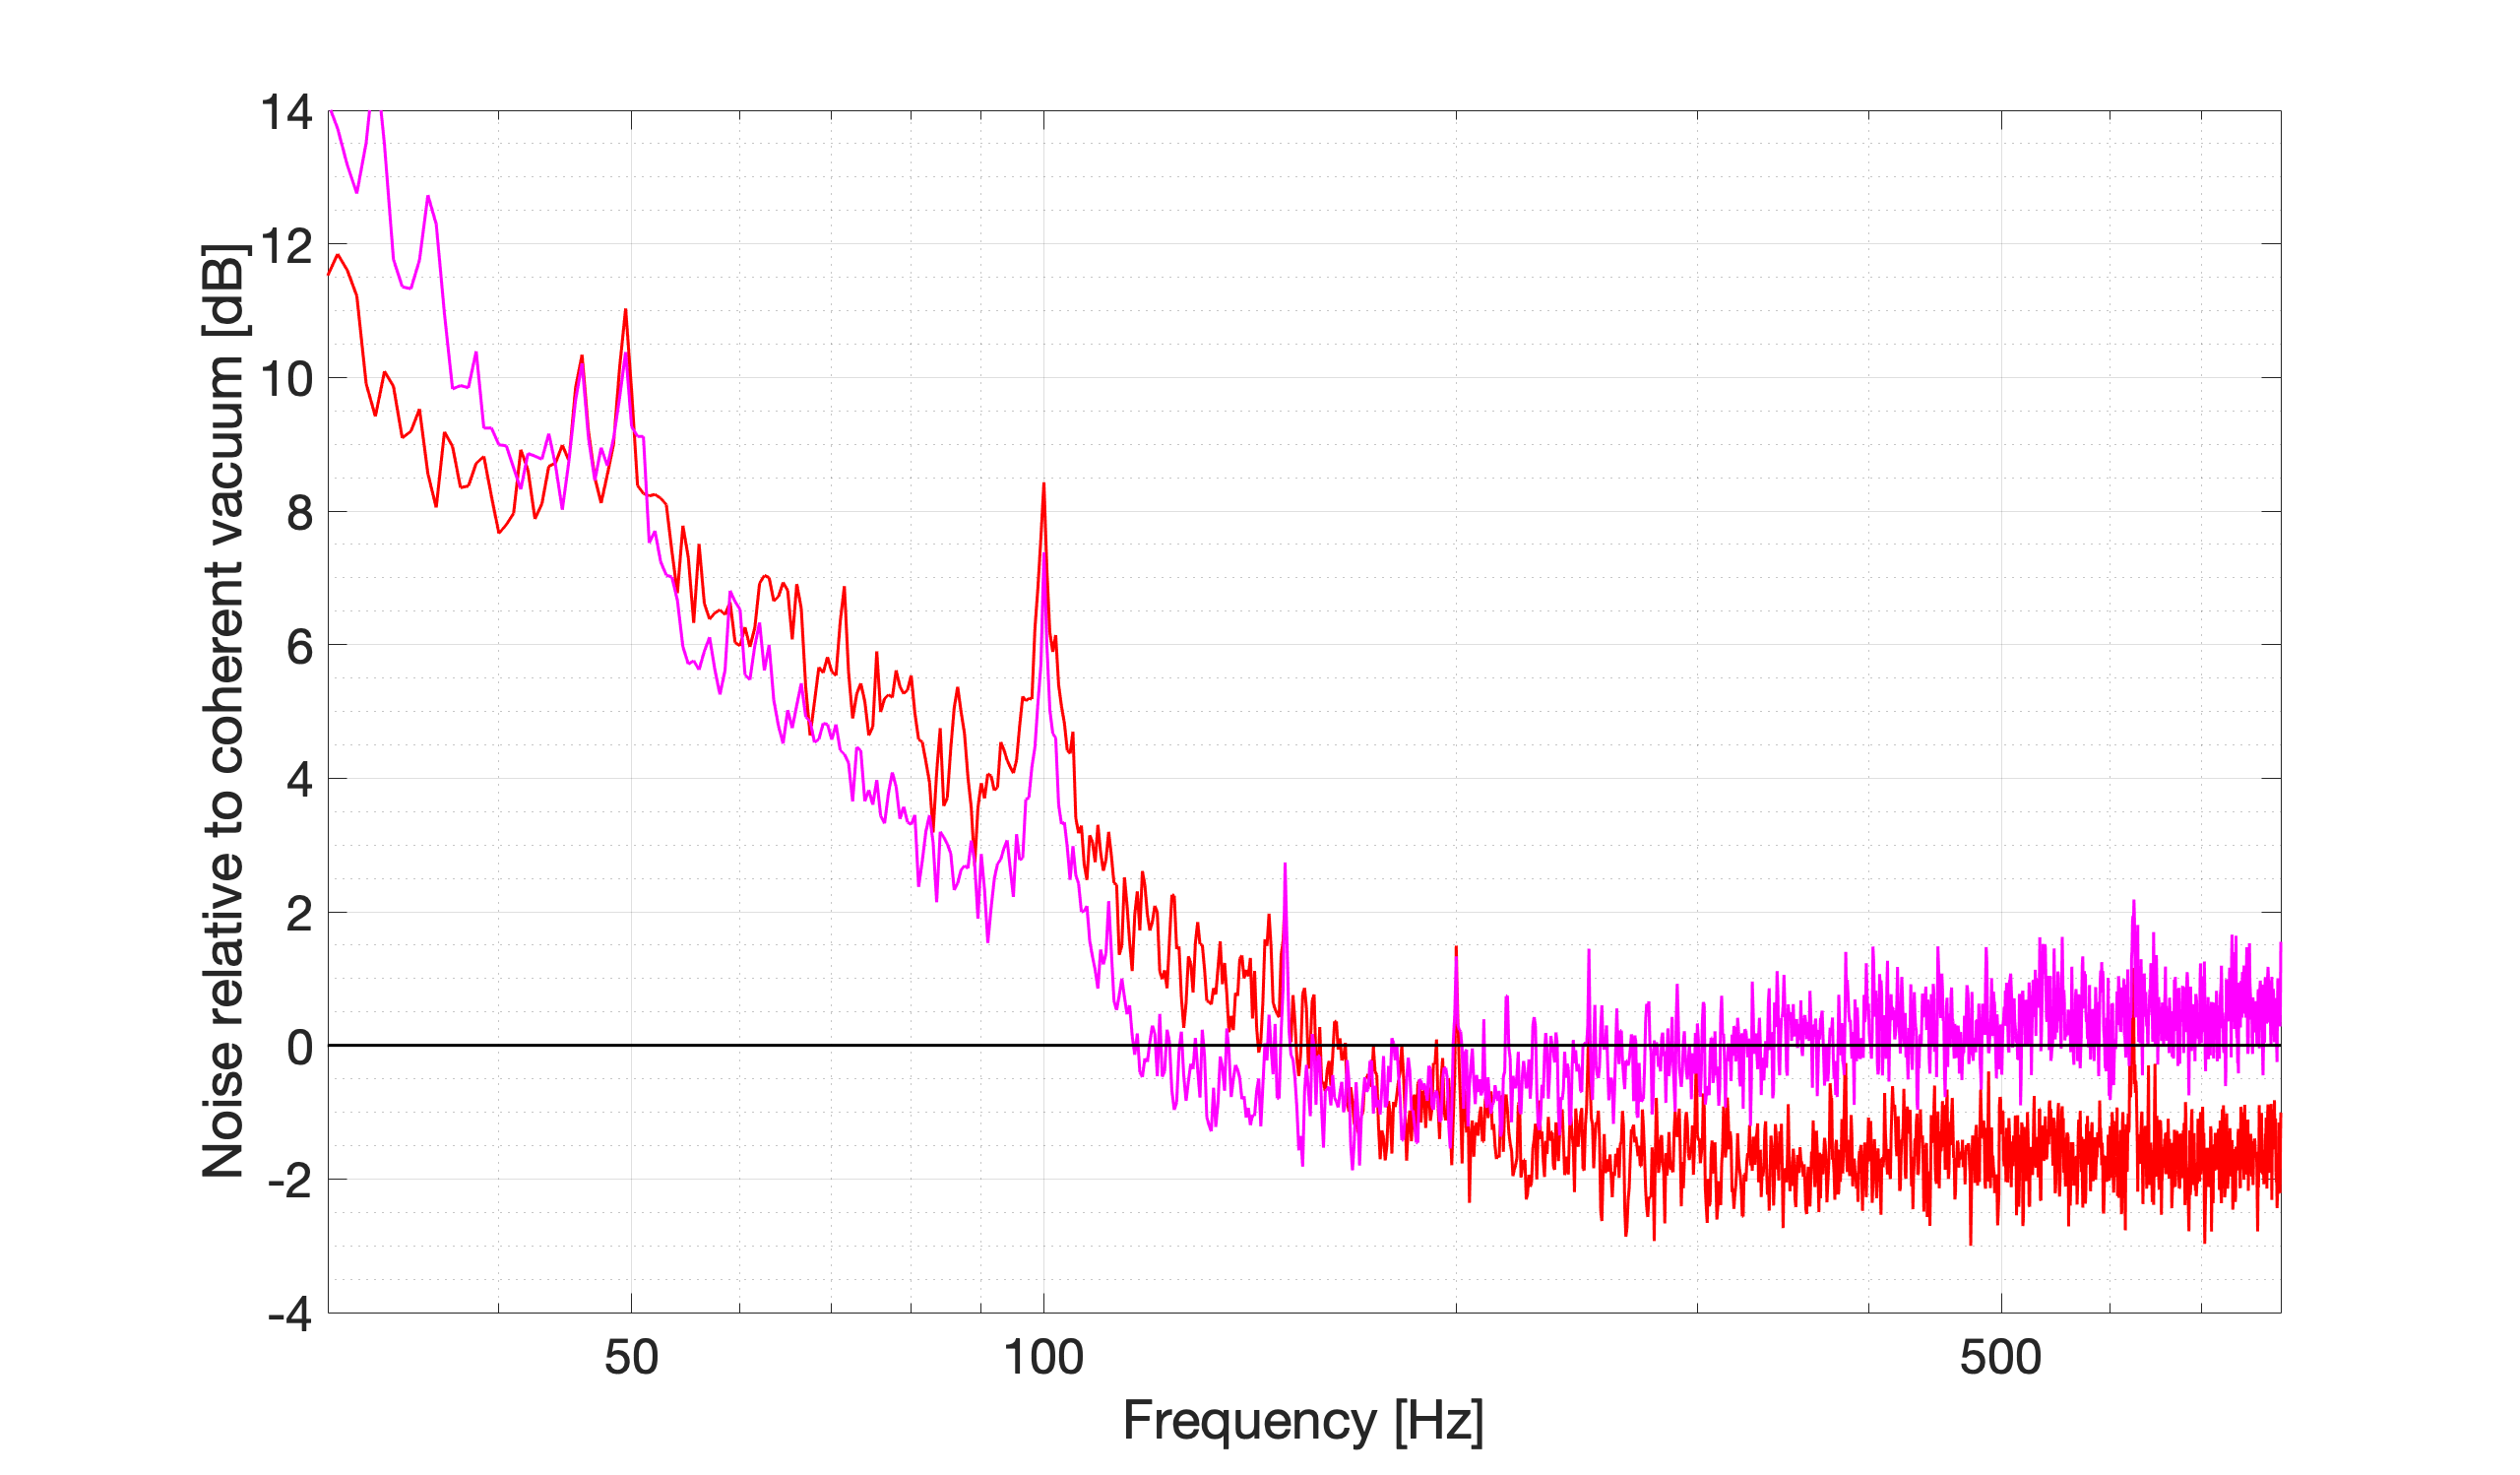
Recently the bump at 100Hz came back as shown in an attached figure.