NAOJ GW Elog Logbook 3.2

Marc, Yuhang, Michael
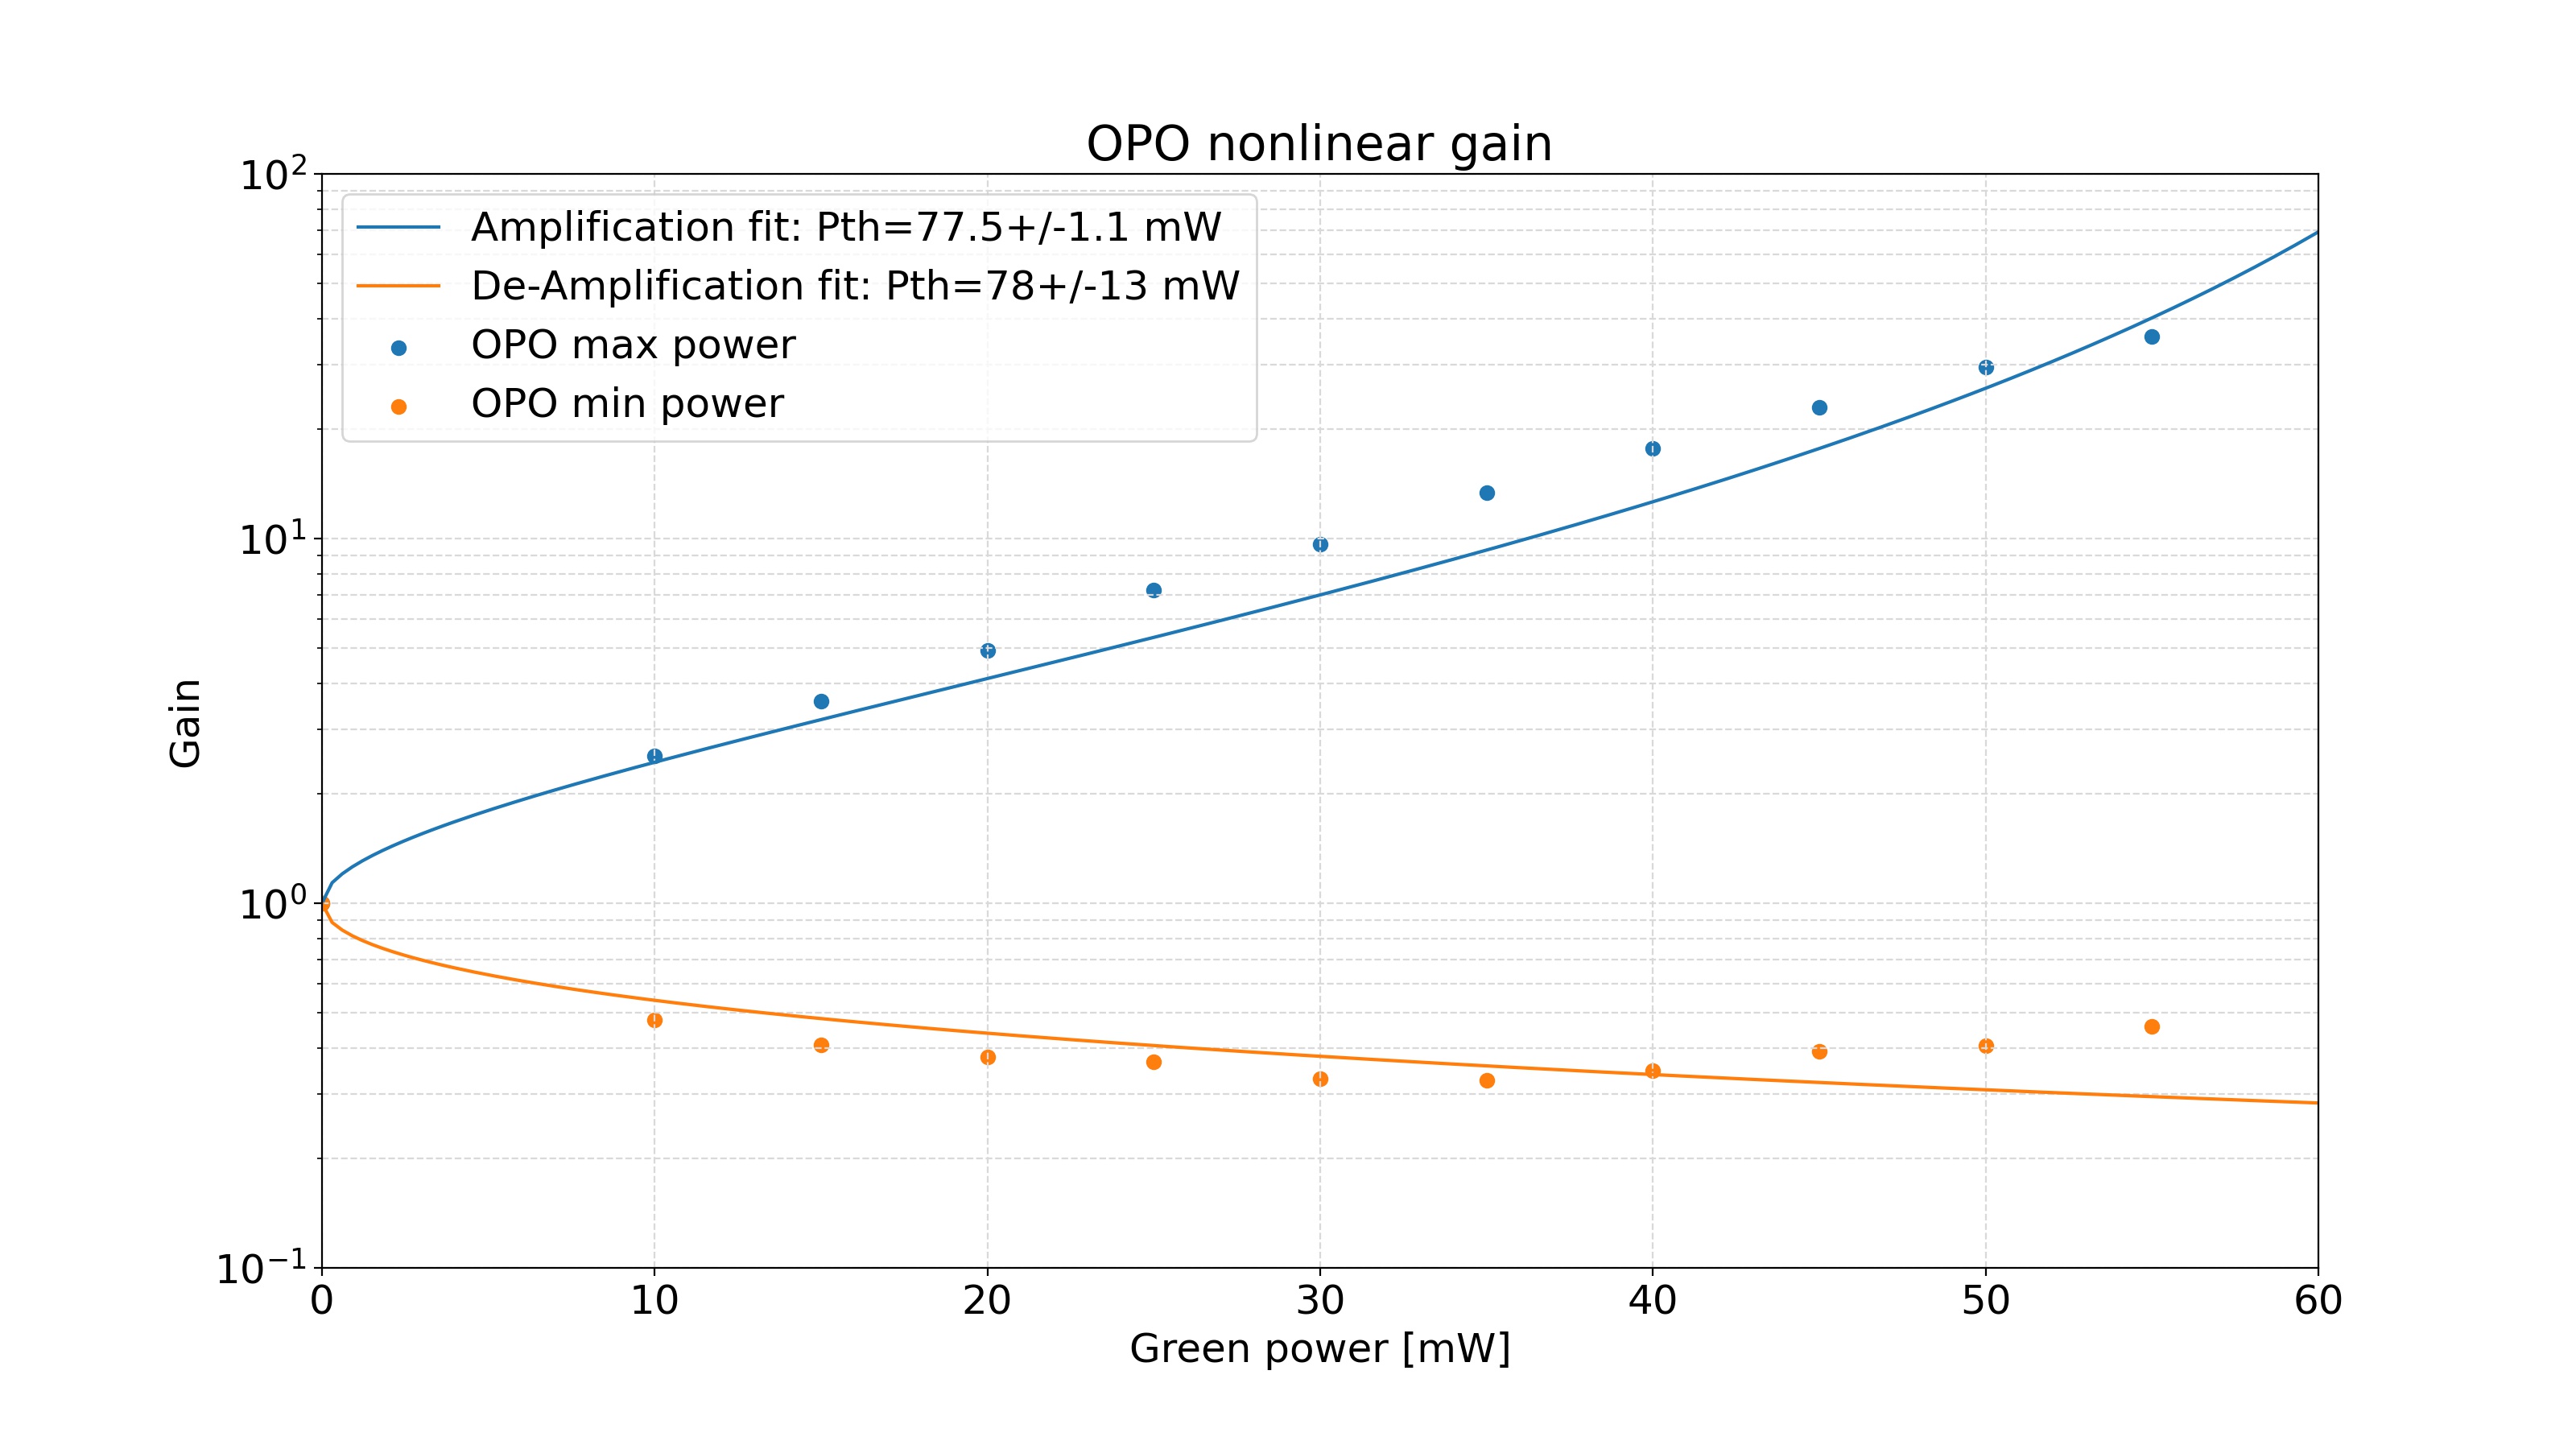
We measured the OPO nonlinear gain vs input green power.
The measurement was performed by modulating green phase at about 1 Hz and looking at the BAB transmission from the OPO. The signal was triggered to maintain its position on the oscilloscope window and the "persist" function was used to keep the resonance peak on the screen. The peak oscillates up and down as a consequence of modulating the green phase. The maximum value of the peak represents the amplification and the mimnum value represents the deamplification. By plotting max and min gain vs green power we can find the OPO threshold power shown in figure 1.
The fit looks a bit odd, and is quite imprecise on the deamplification fit. I found it especially quite difficult to discern what the minimum deamplified power was on the oscilloscope - the persist function of the oscilloscope was used to keep the mimnimum and maximum values of the resonant peak visible, but it also oscilalted slightly on the frequency axis, which obscured the minimum values visible.
At face value, the nonlinear gain seems slightly reduced from the previous value of 80.56 +/- 0.14 mW (Yuhang/Aritomi thesis)
We forgot to tune the OPO temperature during this measurement that could explain the difficulty to fit..