NAOJ GW Elog Logbook 3.2

With Homare Abe
Date: 2022/7/20
We performed a camera calibration measurement for the camera which we used to measure scattering of Aztec No3.
We used an integration sphere with a 1050nm LED (LED1050L2) input as a reference light, then we took pictures with conditions (distance, ISO, focal length etc) same as we took the Aztec sample.
We changed exposure time and took some data.
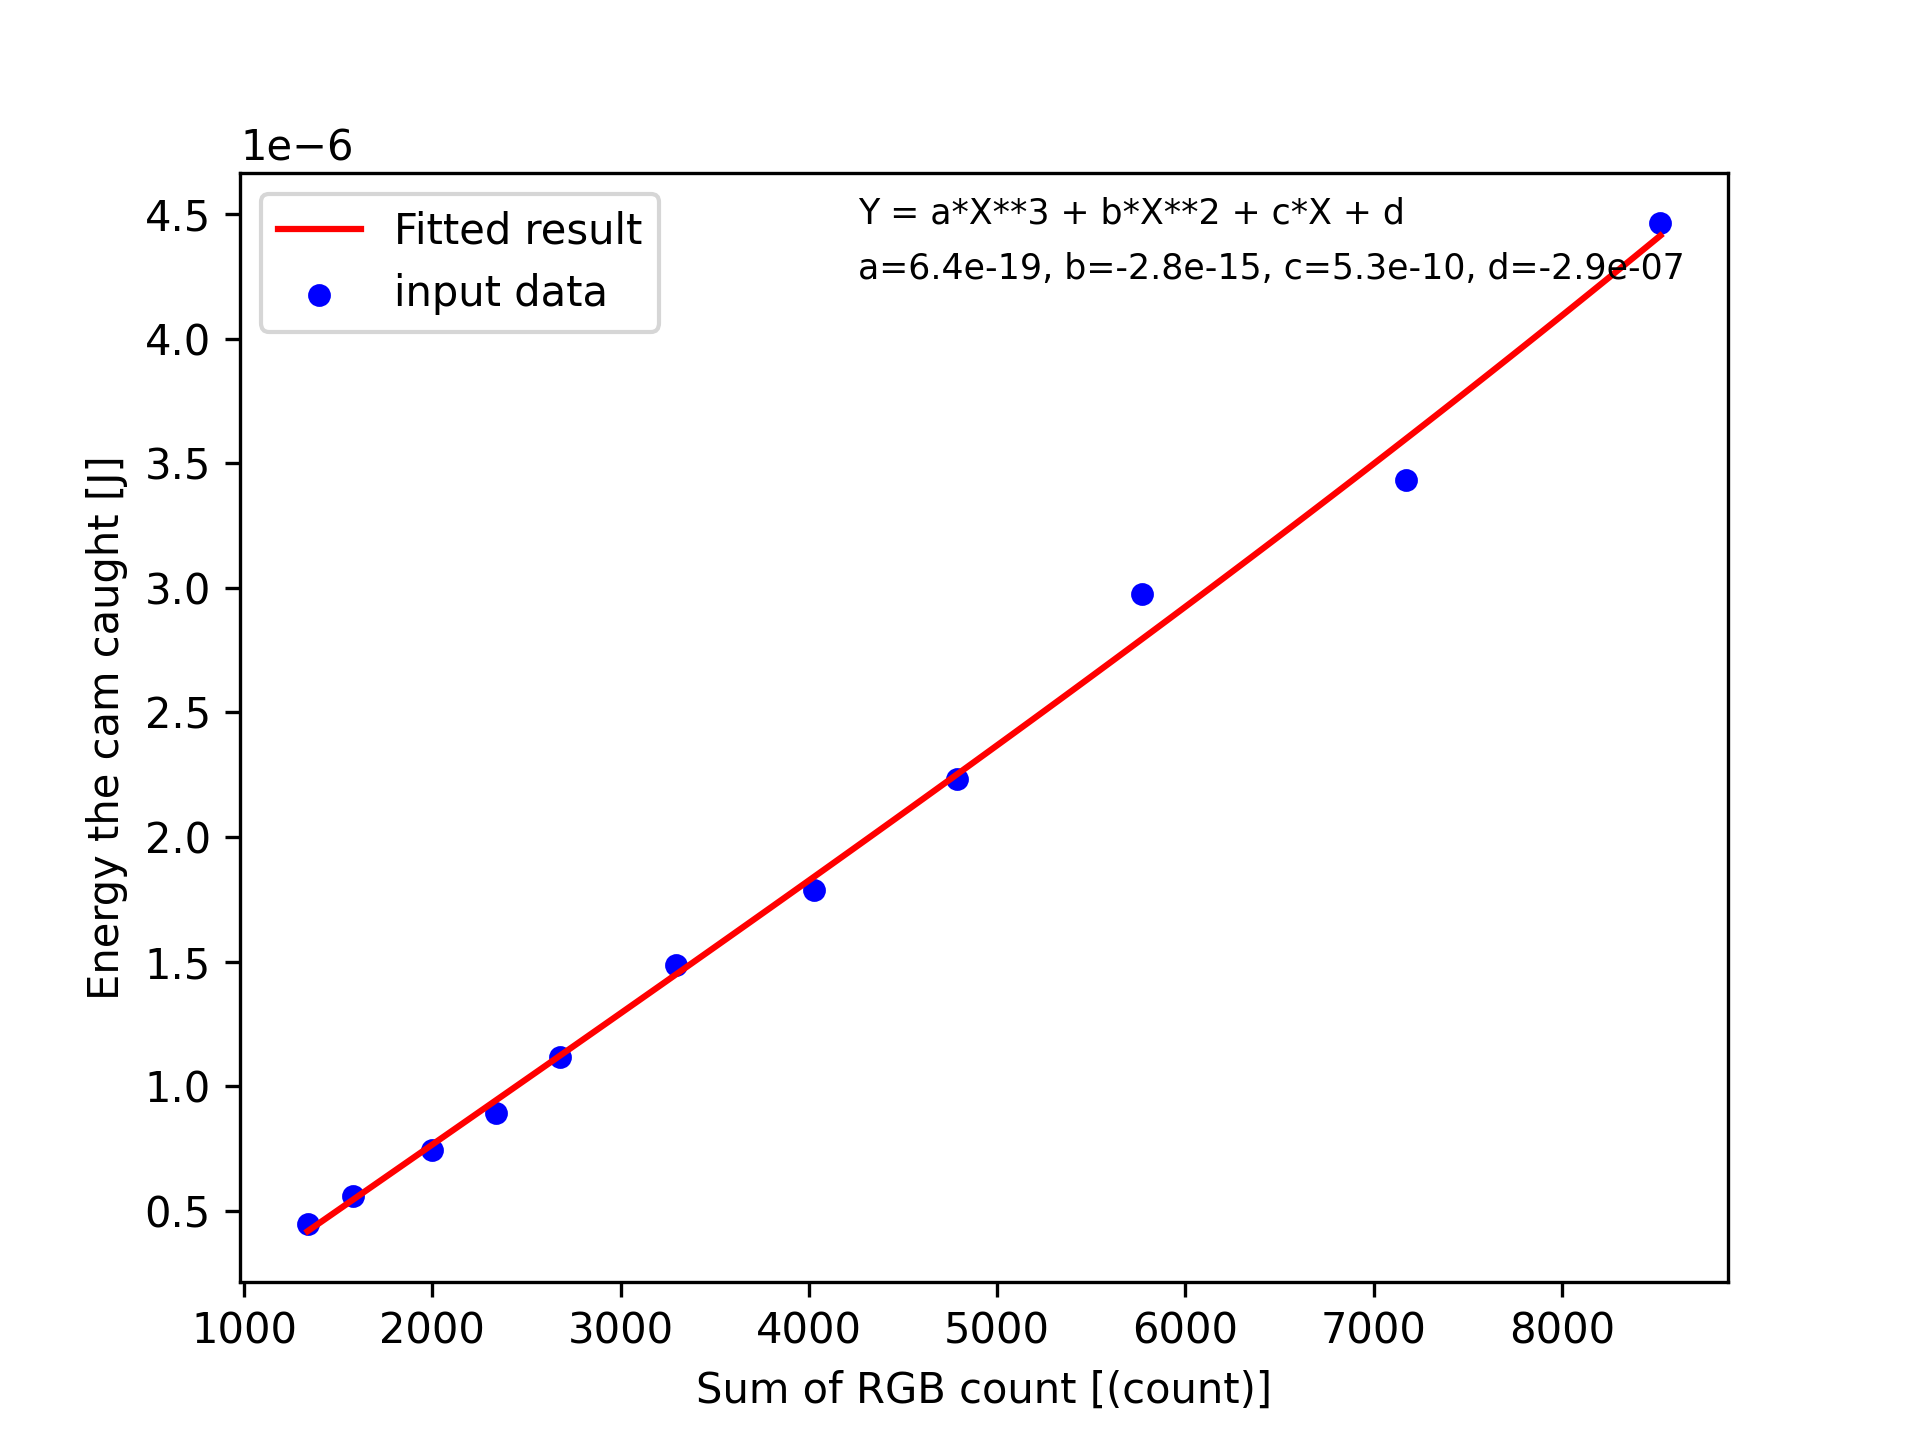
After the measurement, we converted the data to "count sum VS energy caught by the camera", which is attached here.
Now, we can convert picture data for Aztec No3 to energy or power.
Marc, Michael, Yuhang
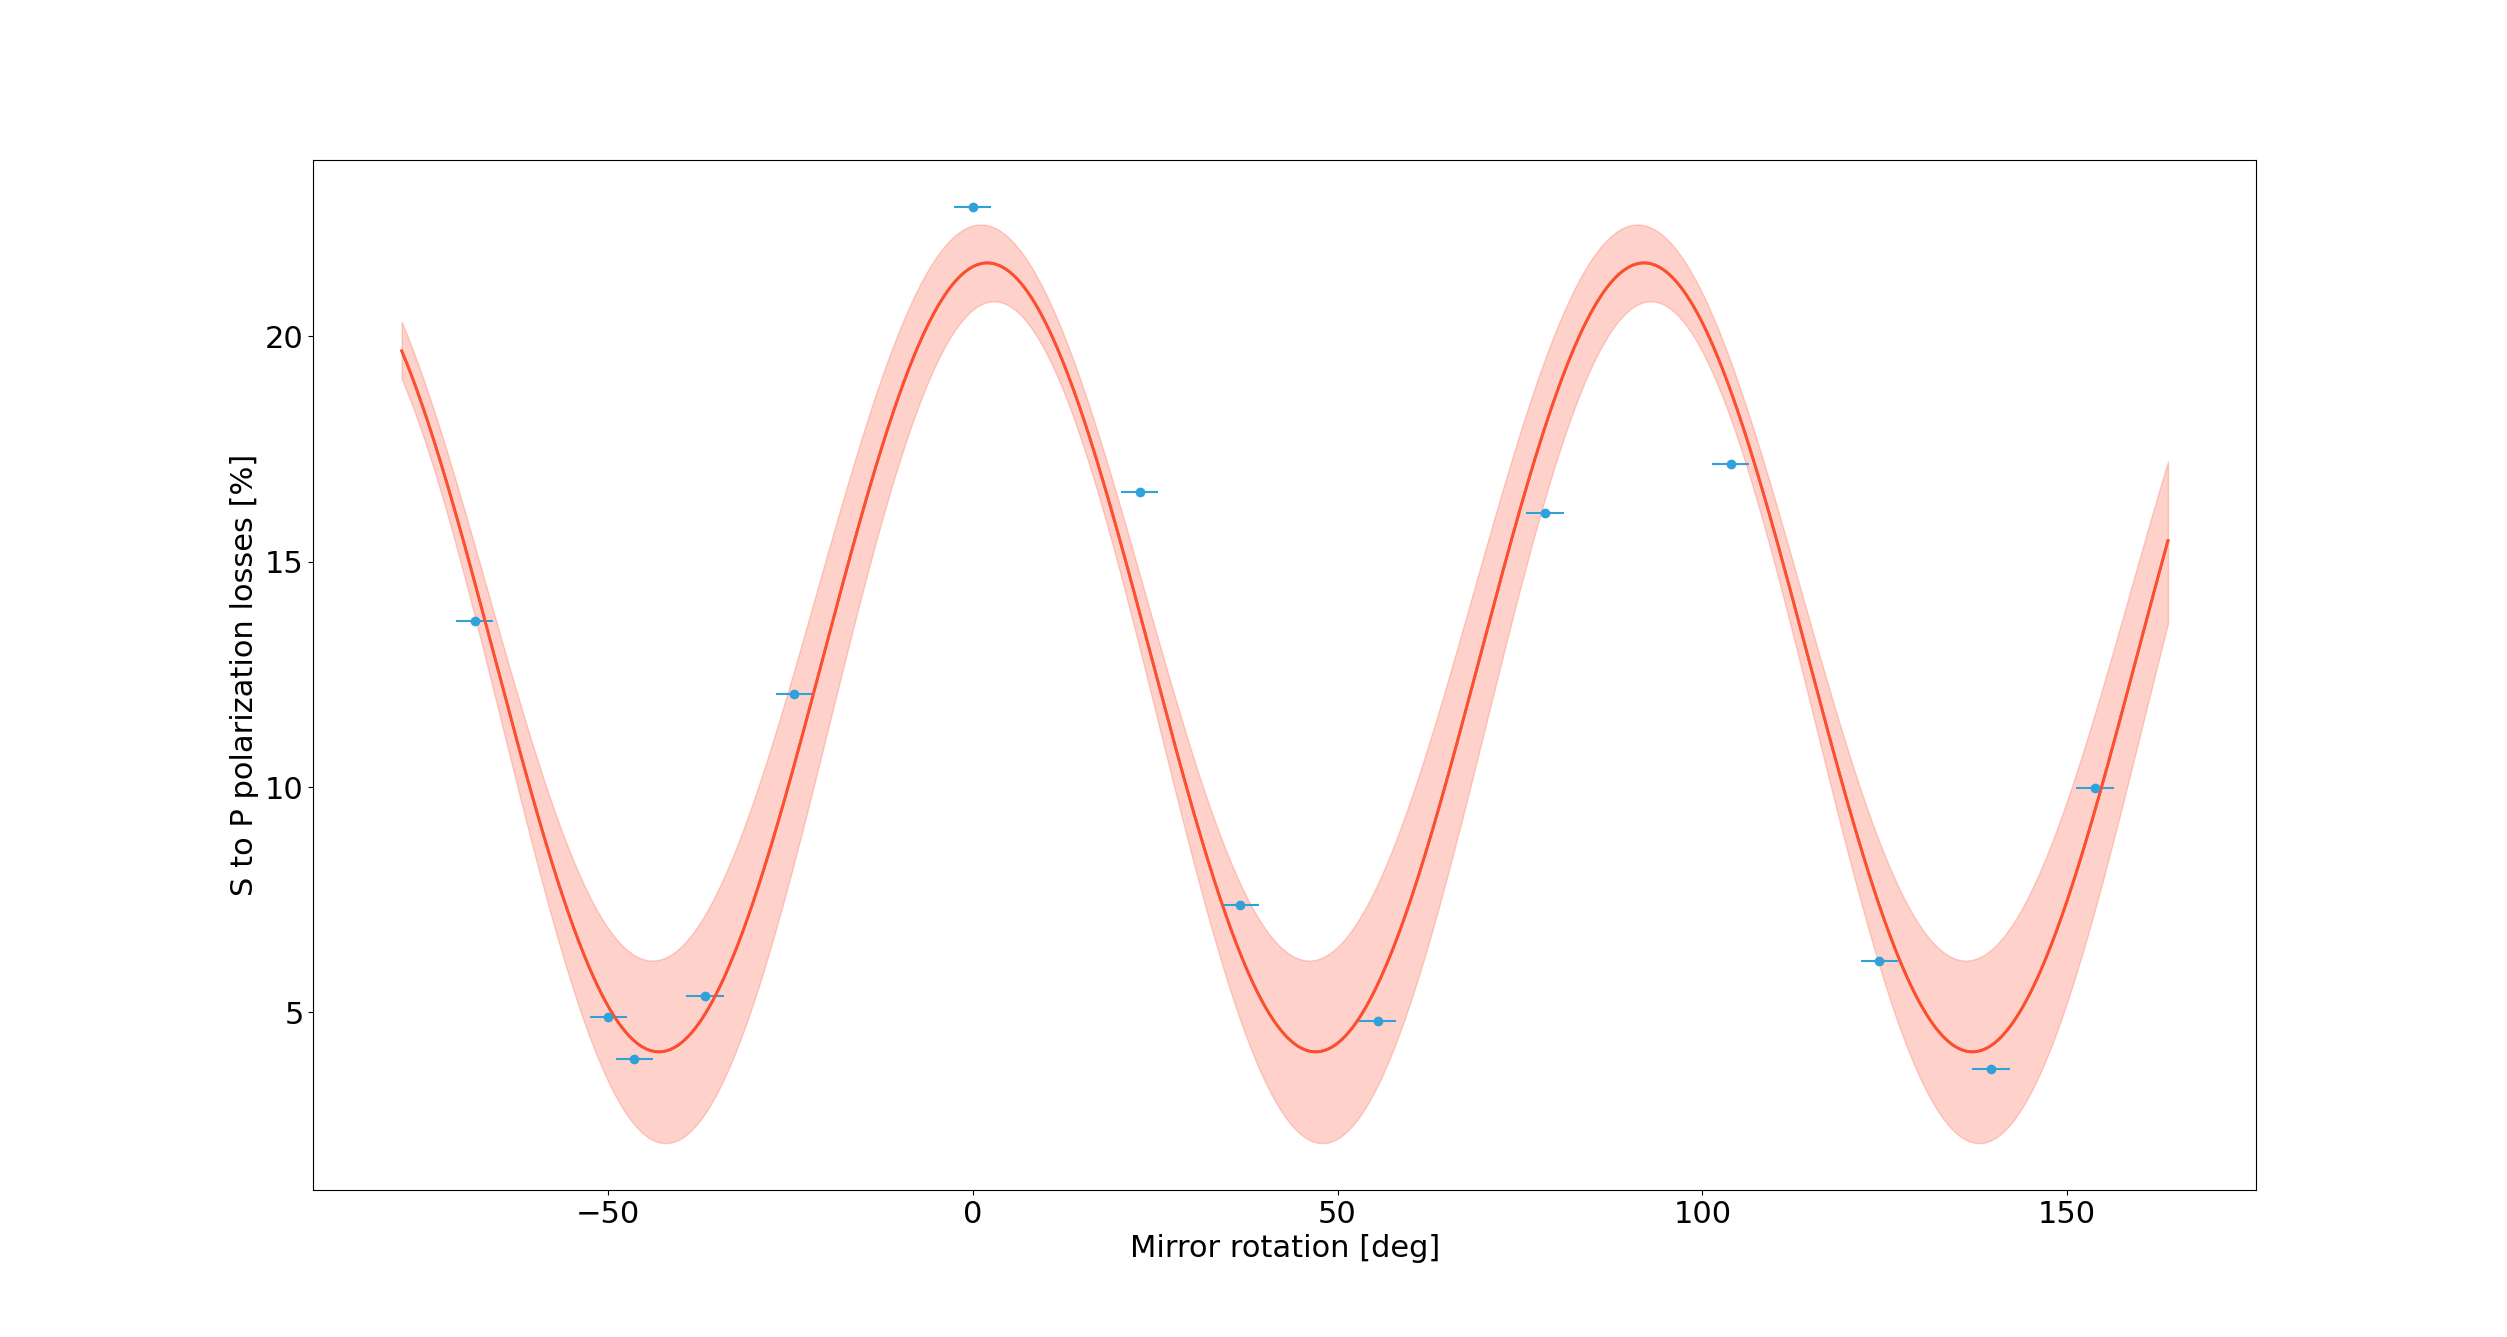
We checked the p polarization power after sample at its center while injecting s polarization and rotating the sample.
Result is attached to this entry.
Note that here, the positive rotation is opposite of positive rotation of the HWP. It means that we expect to see the minimum of p polarization power around -41.5 deg.
We indeed find a minimum around this position and started new measurement with the mirror rotated by -46.5 degrees.
During this measurement we found out that we have 2 beams on each port of the PBS on the readout part (maybe due to birefringence induced beam splitting).
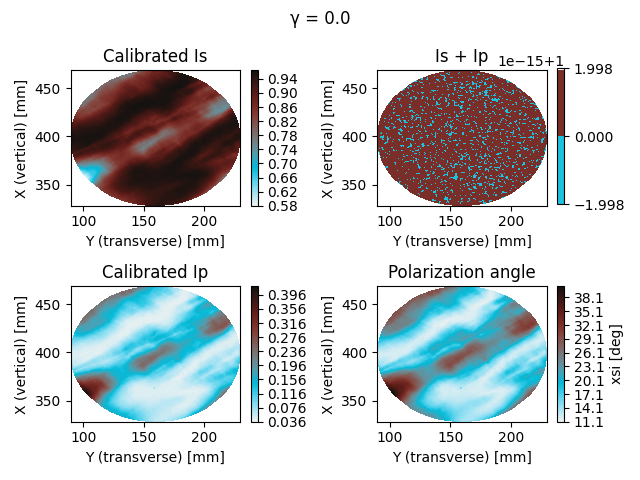
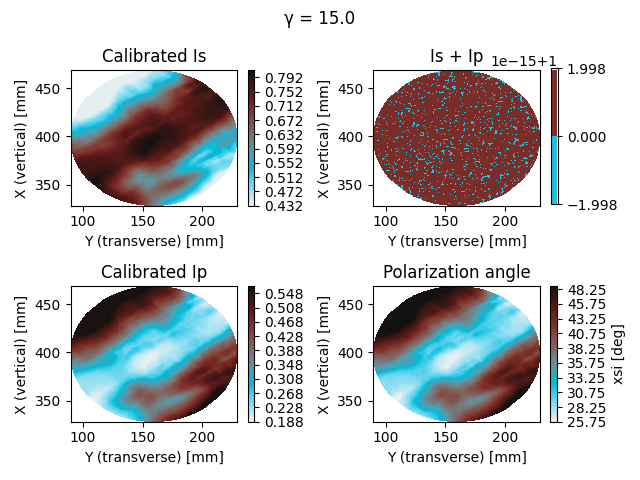
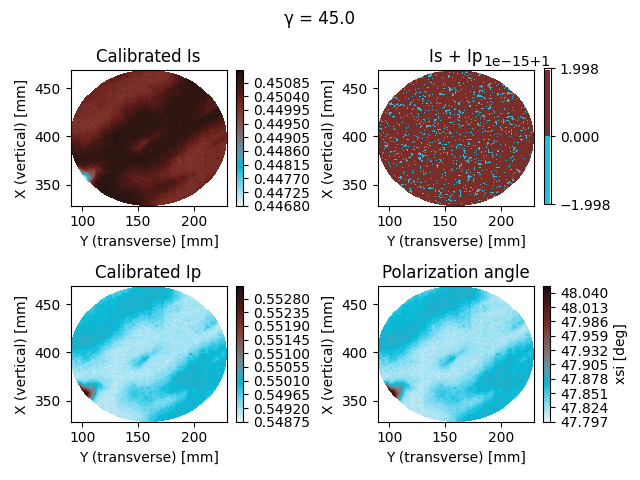
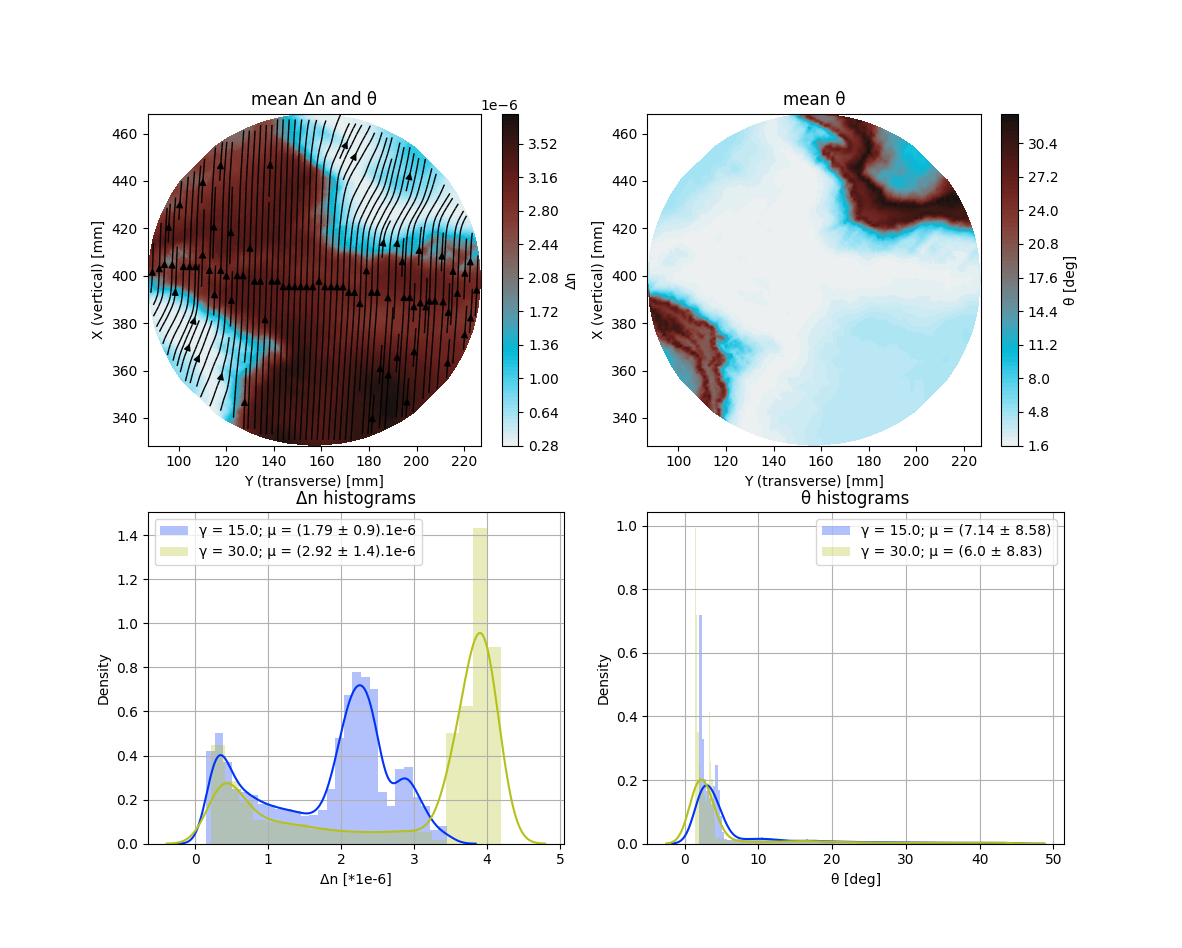
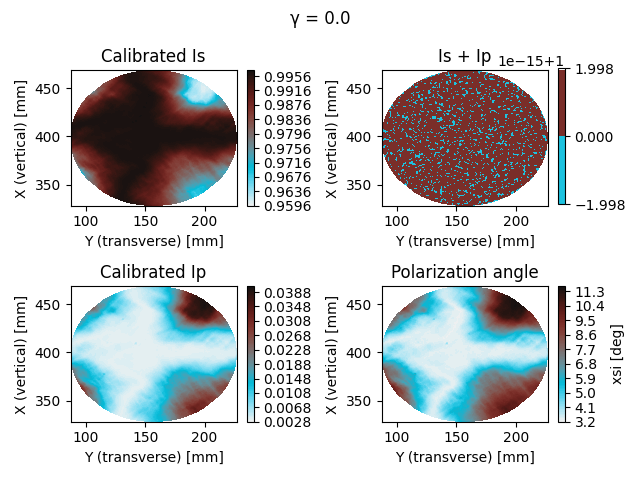
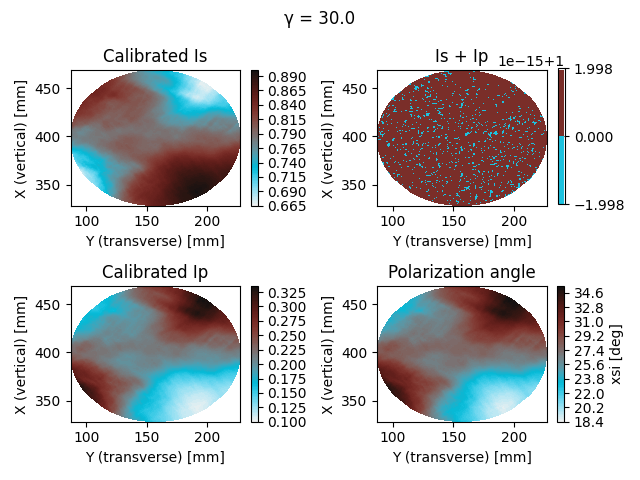
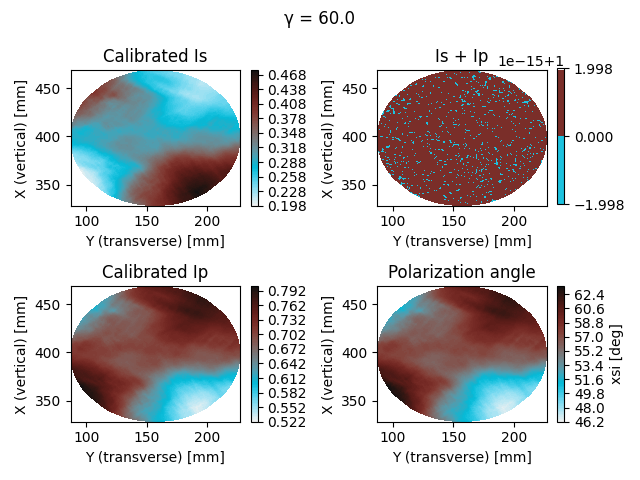
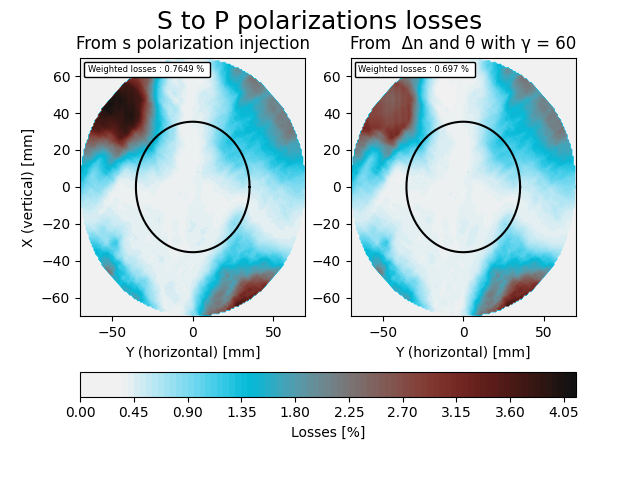
We measured AZTEC #1 polarization with 0 deg (or s polarization), 15 and 45 deg polarization angle at the injection (see figures 1 to 3).
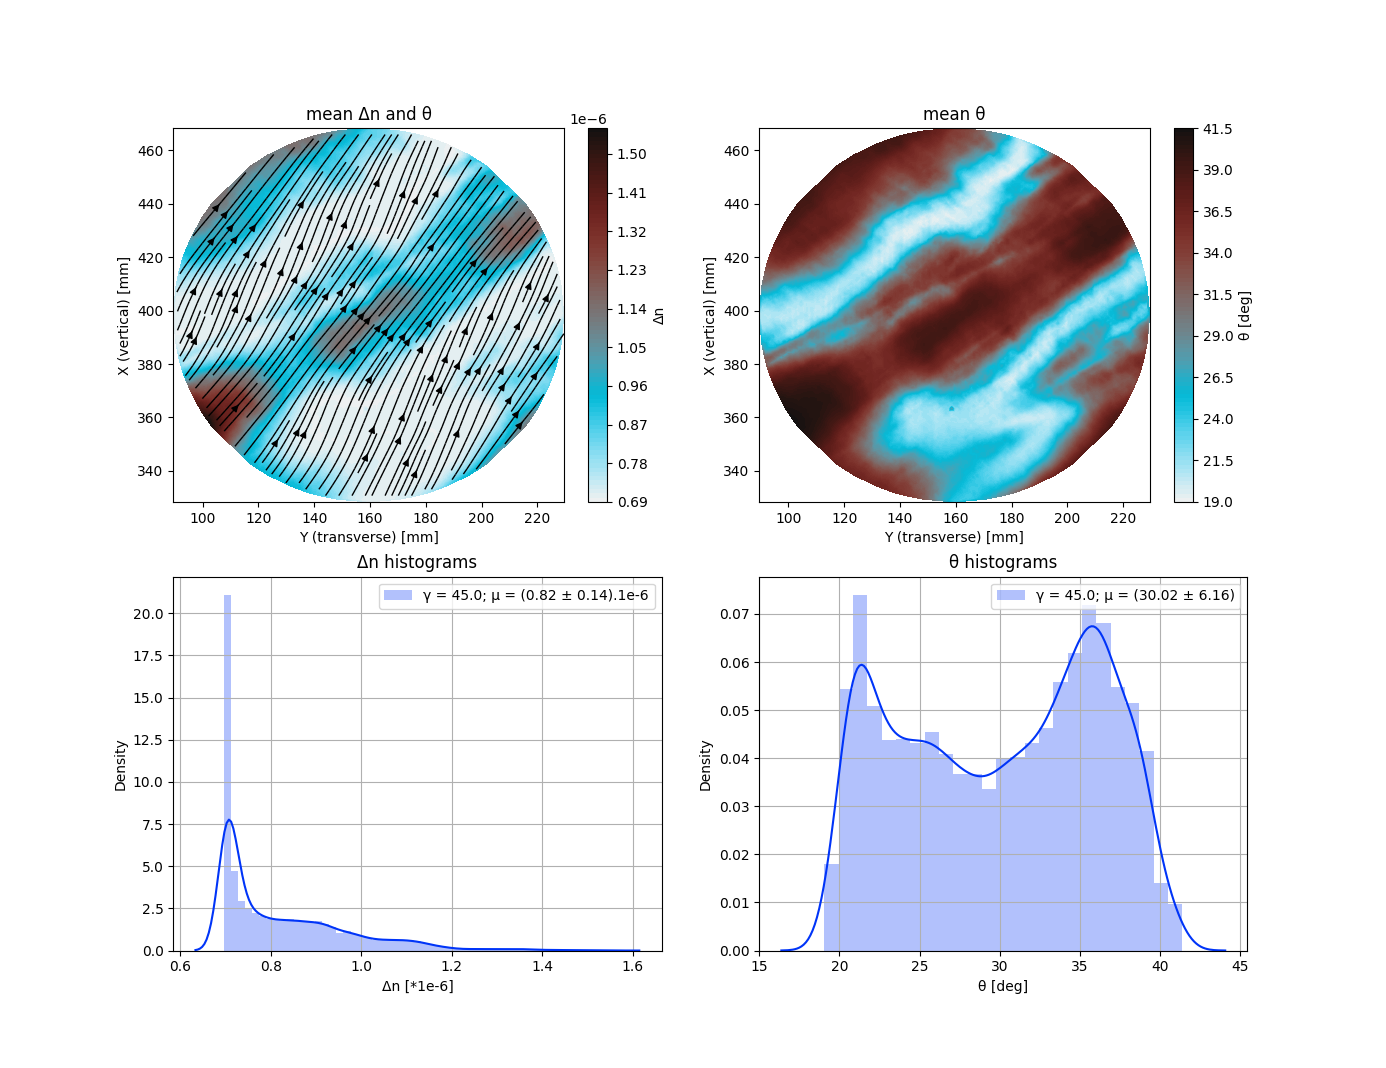
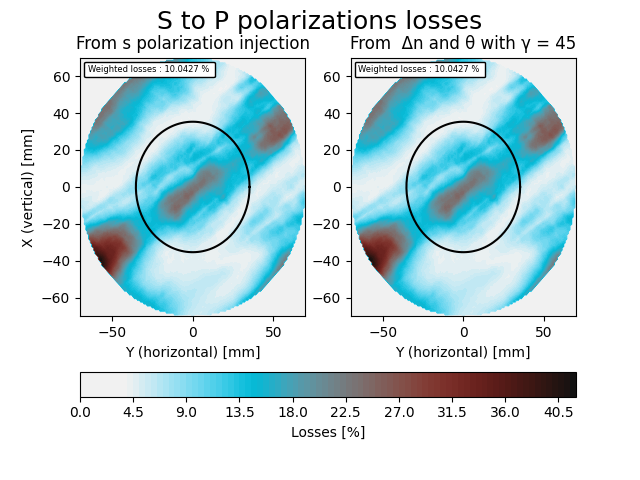
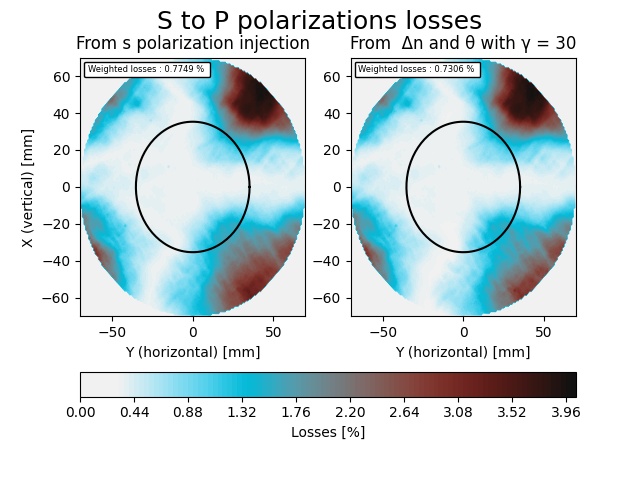
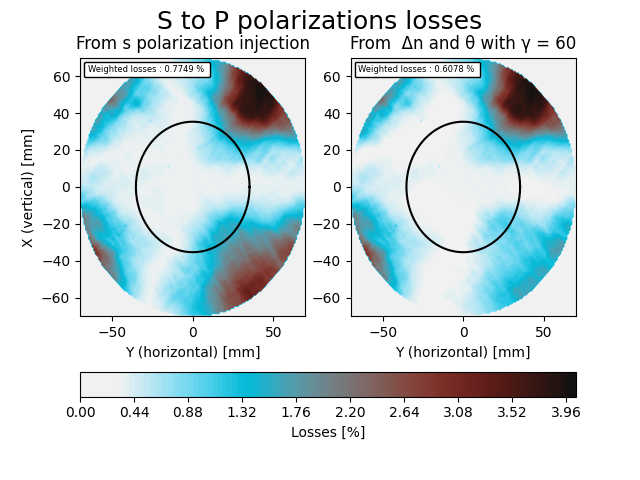
From the measurements with 0 and 45 deg input polarization angle, I could compute delta n and theta (figure 4) and s to p polarization losses (figure 5).
From this last figure, we can see a good agreement of losses between the direct measurement with the computation from delta n and theta.
This was not the case for the measurement with 15 deg input polarization angle and investigation are on-going.
The bad news is that theta is not uniform inside the central area of the mirror. This means that there is no rotation of the sample that will decrease the s to p polarization losses inside this area.
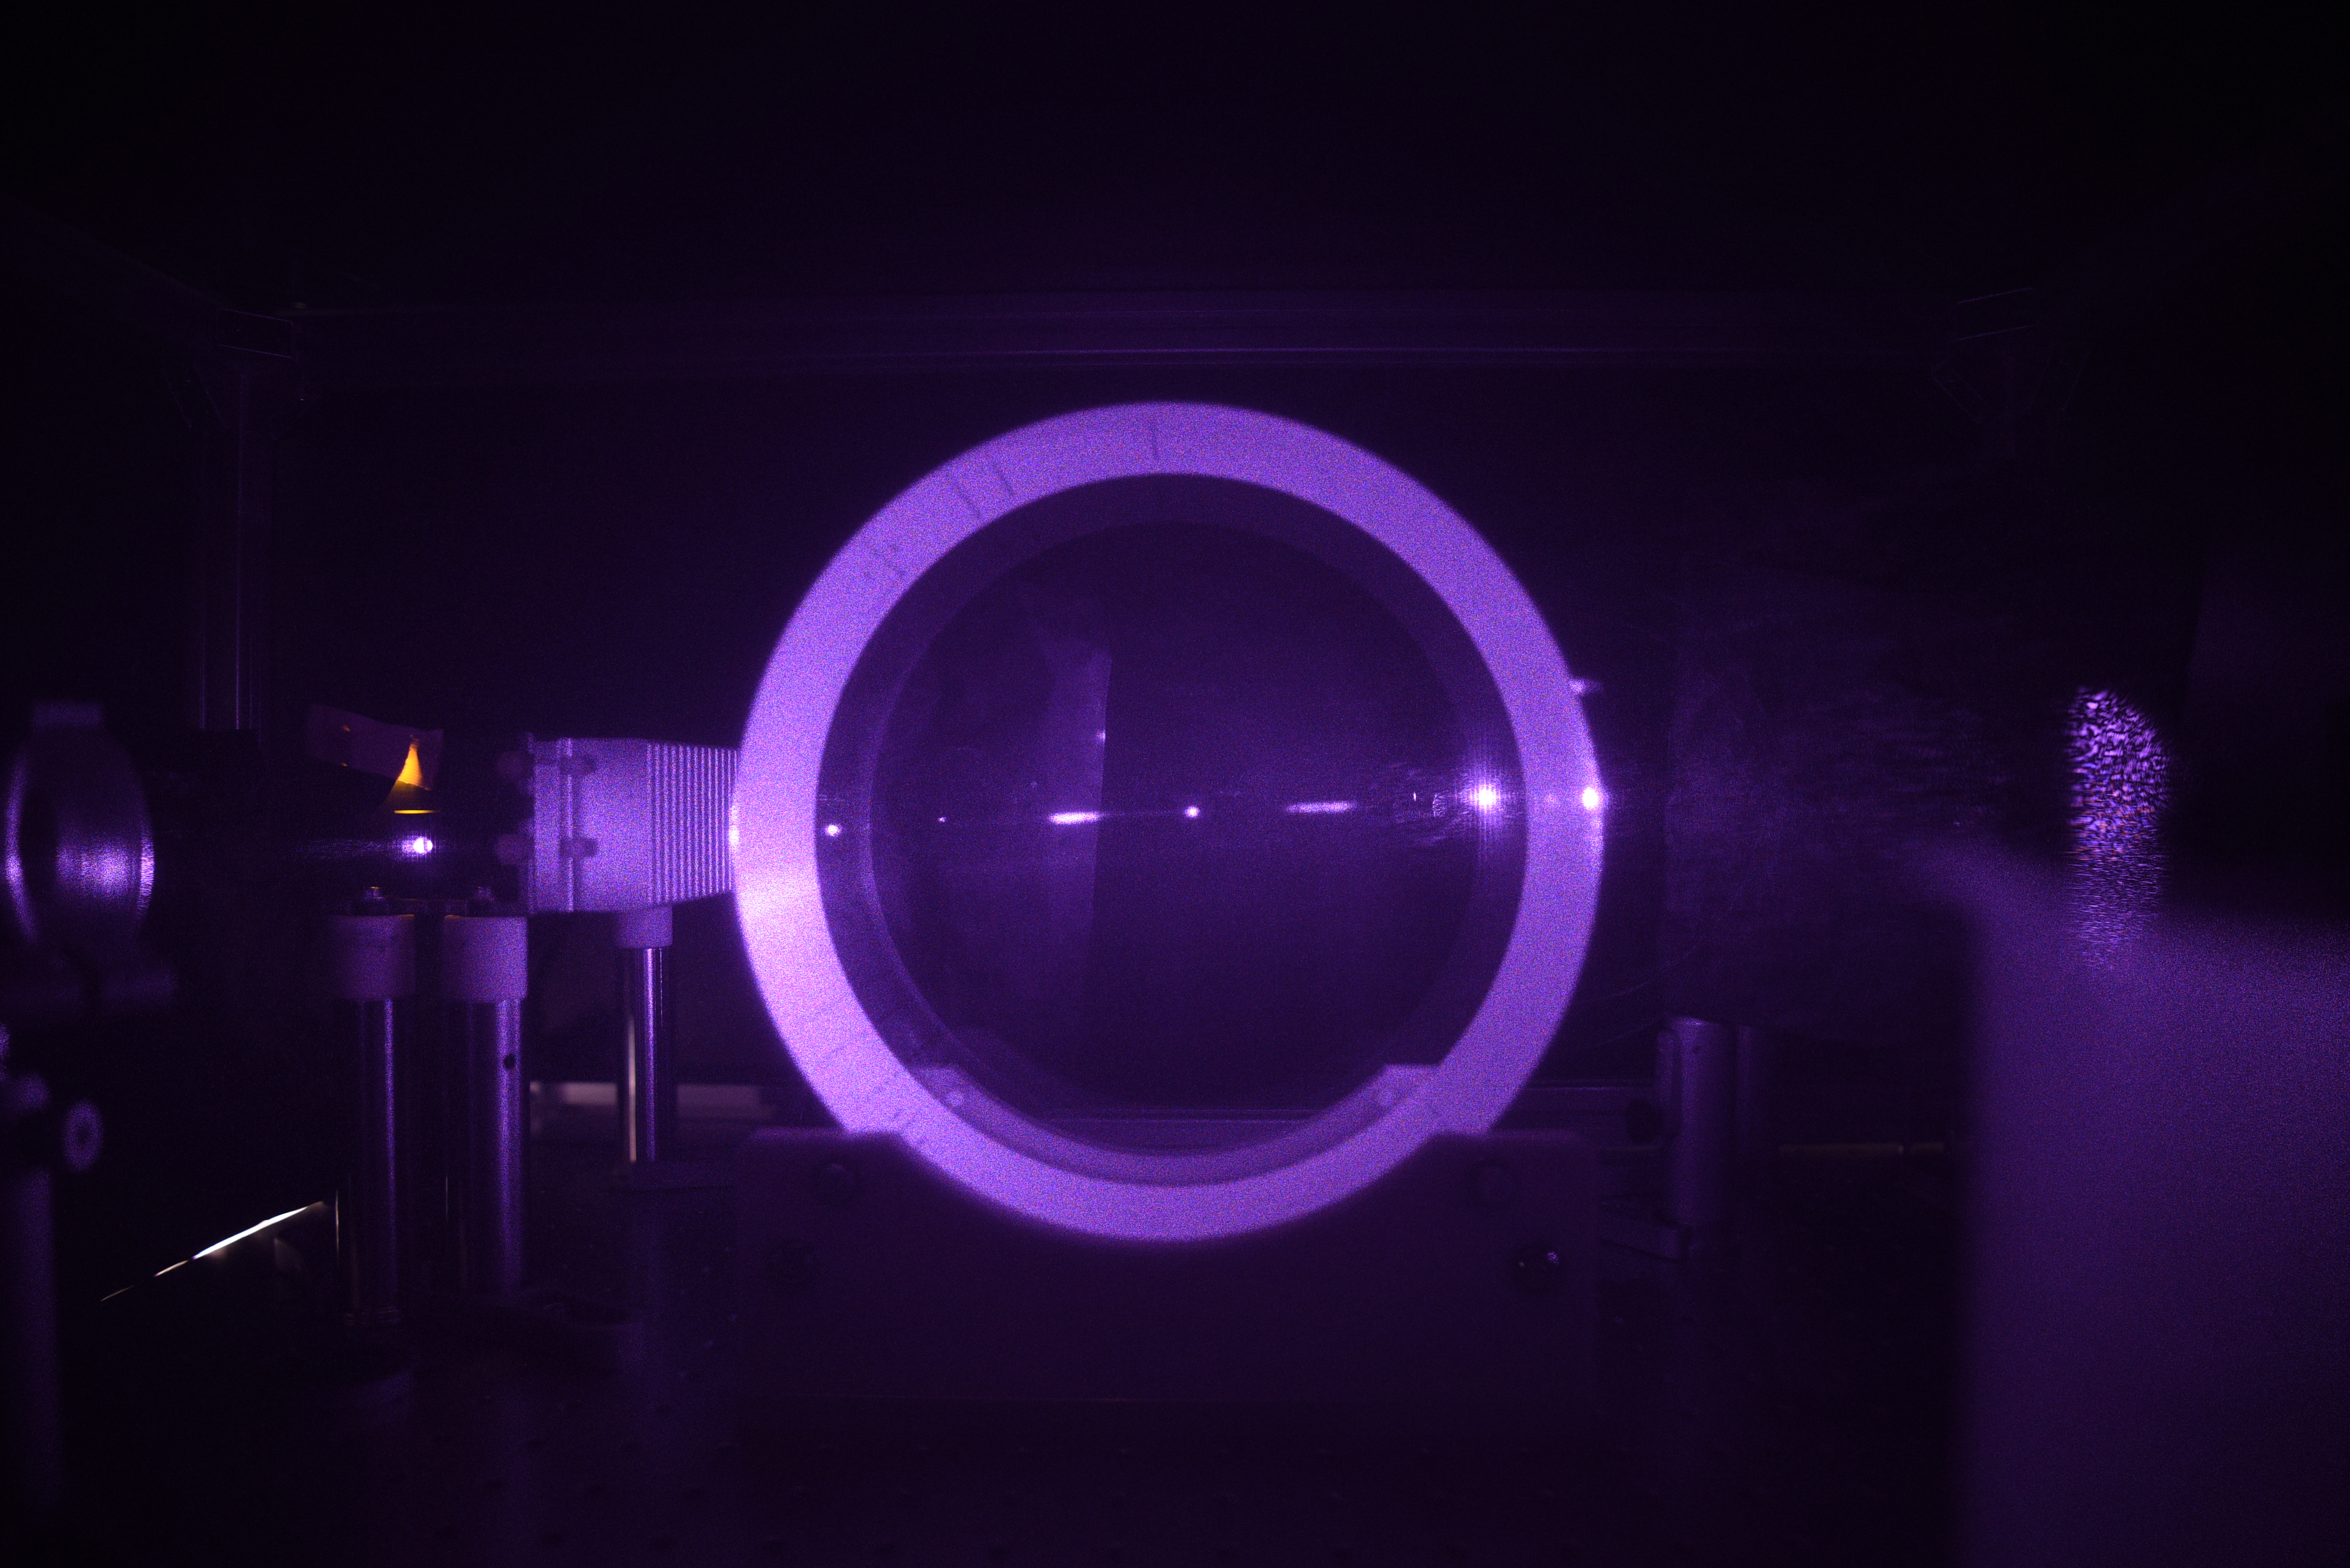
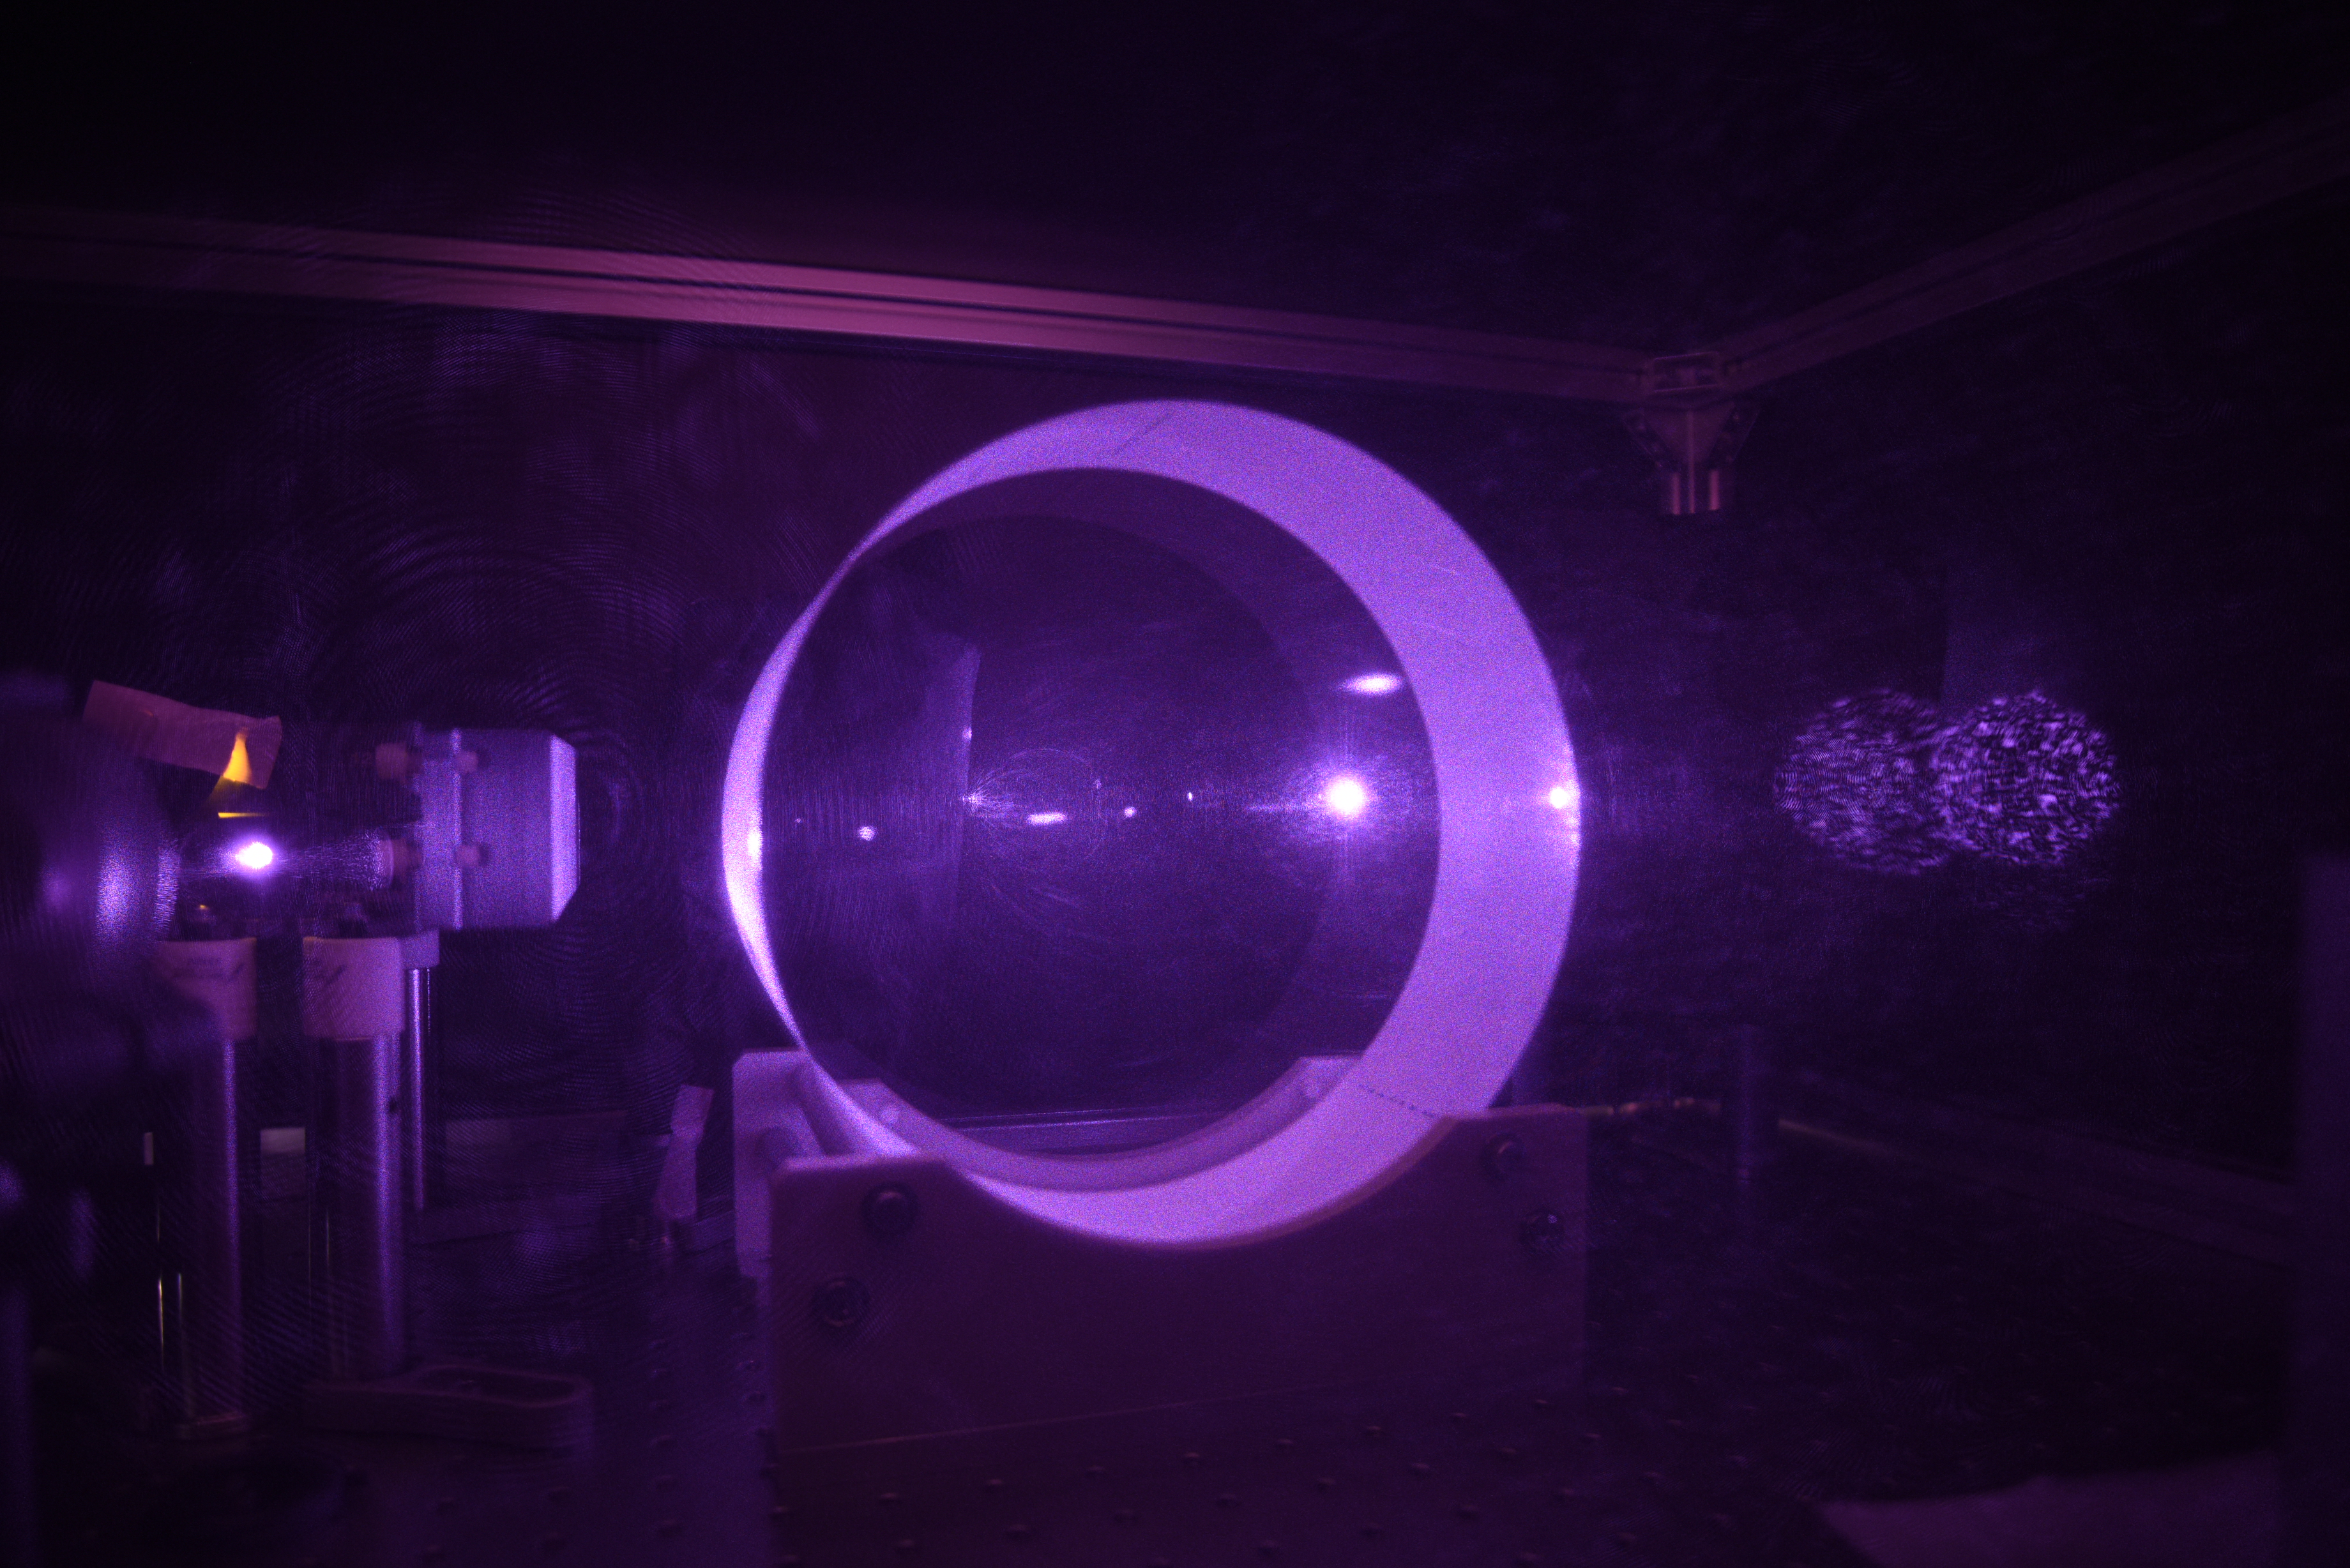
We could see IR scattering light.(See fig.)
Scattered light was visible only in the center of substrate.
We measured again in another angle.
Scattered light was visible in same position.
So we believe that internal scattered light does not have a strong angular dependence.
We start calibration for IR measurement.
We will use 1050nm LED.
We will use an optical table outside clean room. Please don't touch these components.
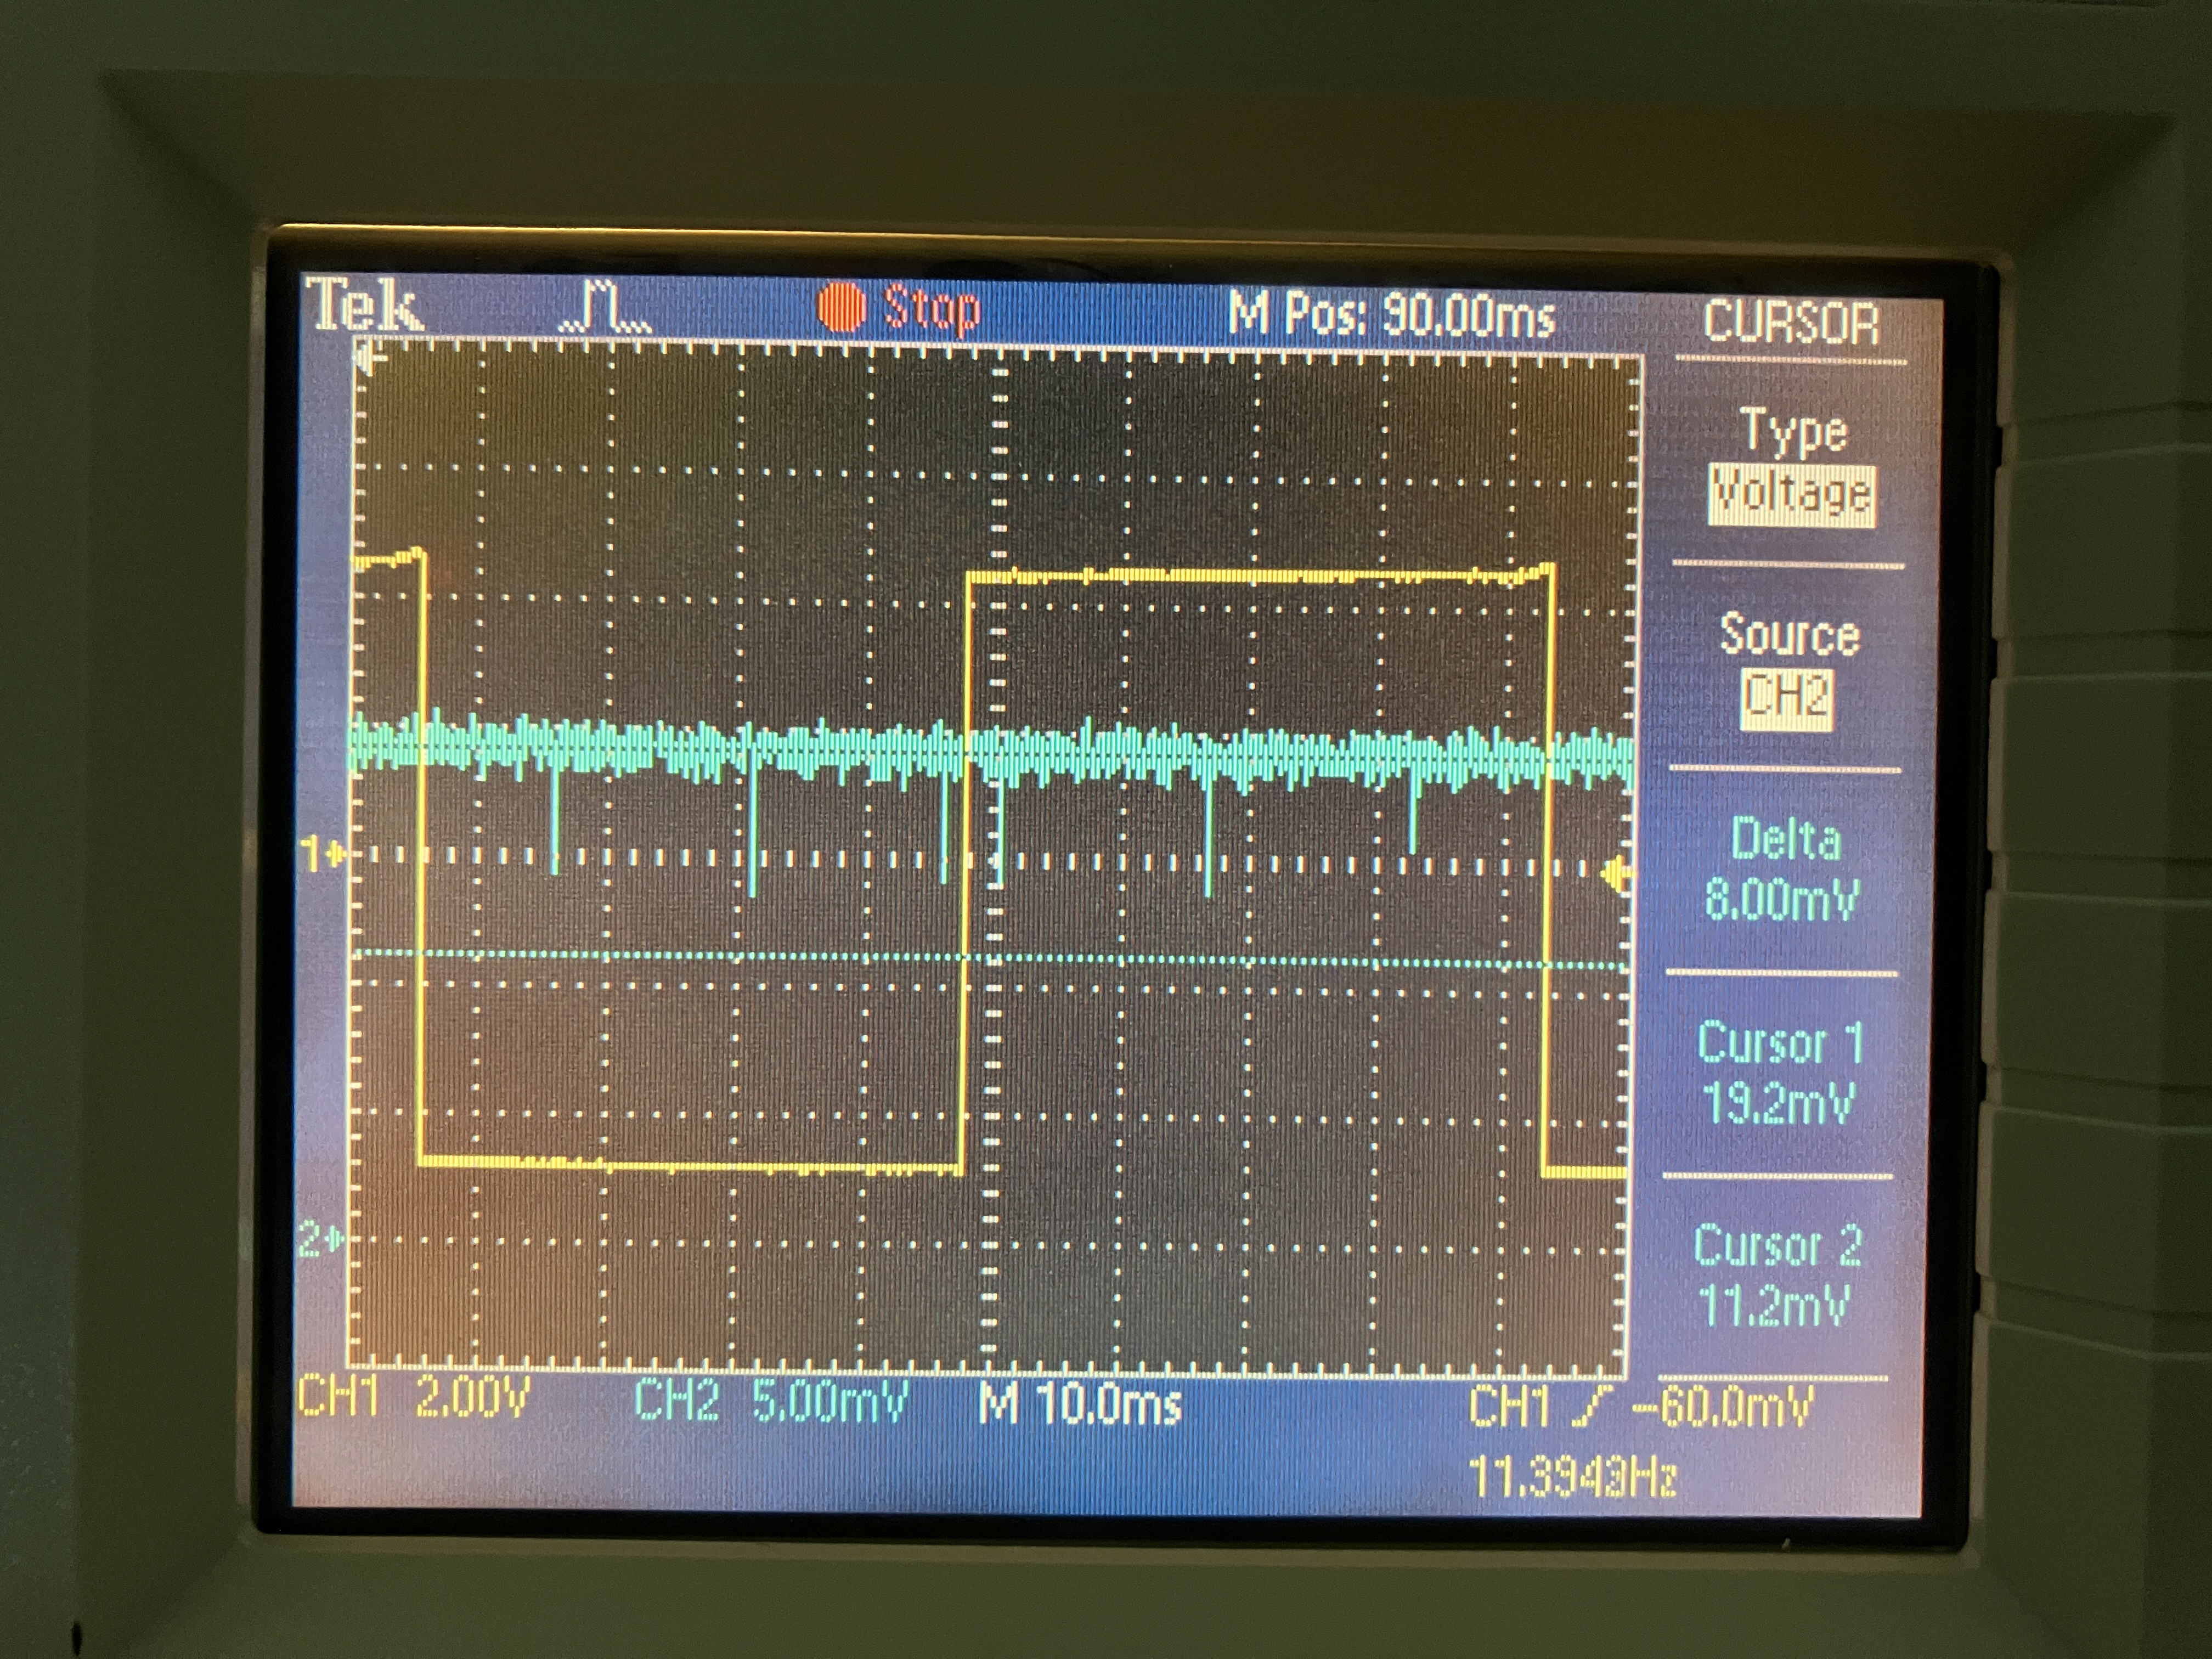
To check the alignment of green from OPO at GRMC, I put a PD at GRMC reflection for green from OPO (Fig. 1). The cursor 2 at 11.2mV shows the offset. Fig. 1 would show the green alignment to OPO is fine.
Then I measured nonlinear gain with BAB maximum. After some alignment of green to OPO, nonlinear gain with 25 mW green reached 5. This is consistent with theoretical nonlinear gain of 5.1 with 80mW OPO threshold, but lower than 6.8 which is the value one year ago in elog2577. The current setting is as follows.
| green power (mW) | 0 | 25 |
| OPO temperature (kOhm) | 7.13 | 7.13 |
| p pol PLL frequency (MHz) | 230 | 160 |
| BAB maximum (mV) | 286 | 1420 |
| Nonlinear gain | 1 | 5 |
I scanned BS alignment and green beam can be found in FC transmission. I aligned input mirror with picomotor so that the green reflection overlaps with the injection. After I aligned end mirror, green flash can be found and FC locked stably!
Marc, Matteo
We removed the AZTEC #5 from the translation stage and installed 2 razor blades.
They are at 120 mm (for the vertical cut) and 122 mm (for the horizontal cut) of the last steering mirror on the injection path.
We realigned the probe beam and reached 0.003 deg and 0.005 deg angle of incidence for vertical and horizontal respectively.
We realigned the PBS and our photodetectors, tuned the QWP and HWP.
S polarization is best for 3.1 deg of the HWP. The best p polarization is reached by moving the HWP angle by -45 deg.
We did the calibration as for #3.
A bit strange result was that s and p polarization power fluctuations were anti-correlated suggesting that the input polarization was fluctuating.
Touching a bit the laser fiber I could generate such anti-correlation. One possible explanation for this could be that the fiber is now touching/resting on the scattering black box foil which might be moving due to the air flow (?).
In any case, we could get some reasonable calibration factors but we will further investigate this issue.
Finally, we started polarization measurement with s polarization at the input.
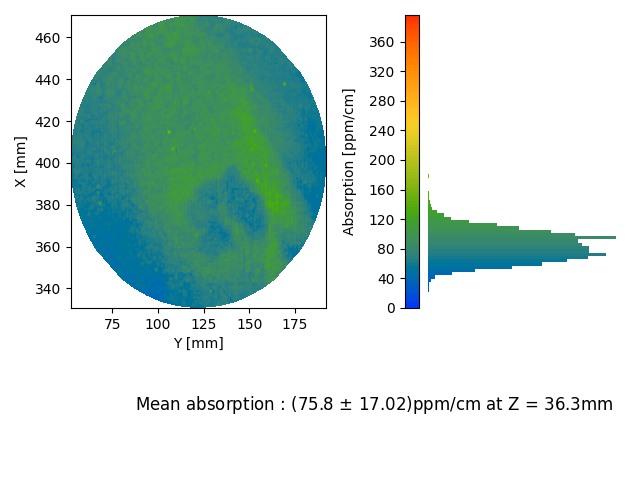
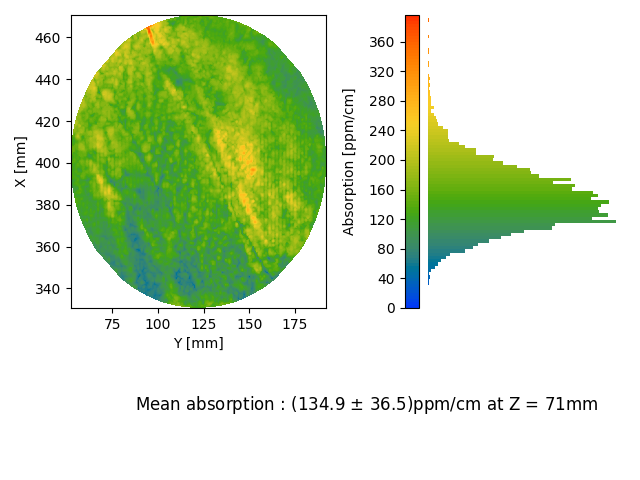
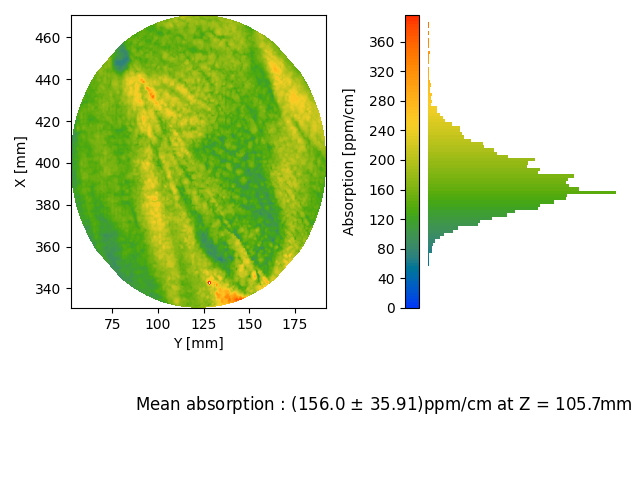
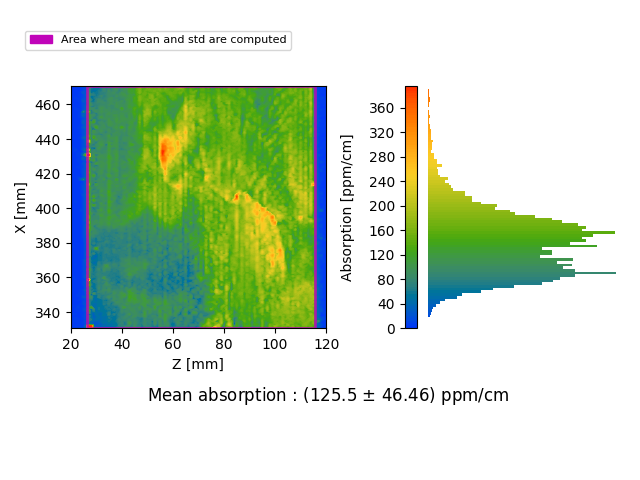
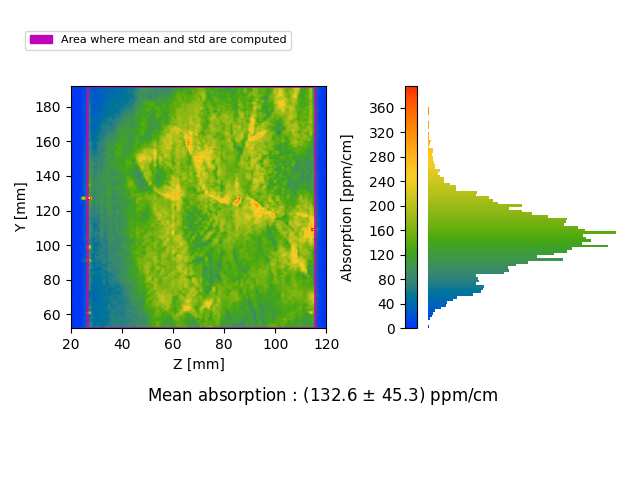
Report about AZTEC #5 absorption.
Absorption is about 140 ppm/cm
Interestingly, it is the only sample with so visible crystalline structure defects (see yz map).
It also had largest scattering area (visible with our probe laser) compared to the other samples.
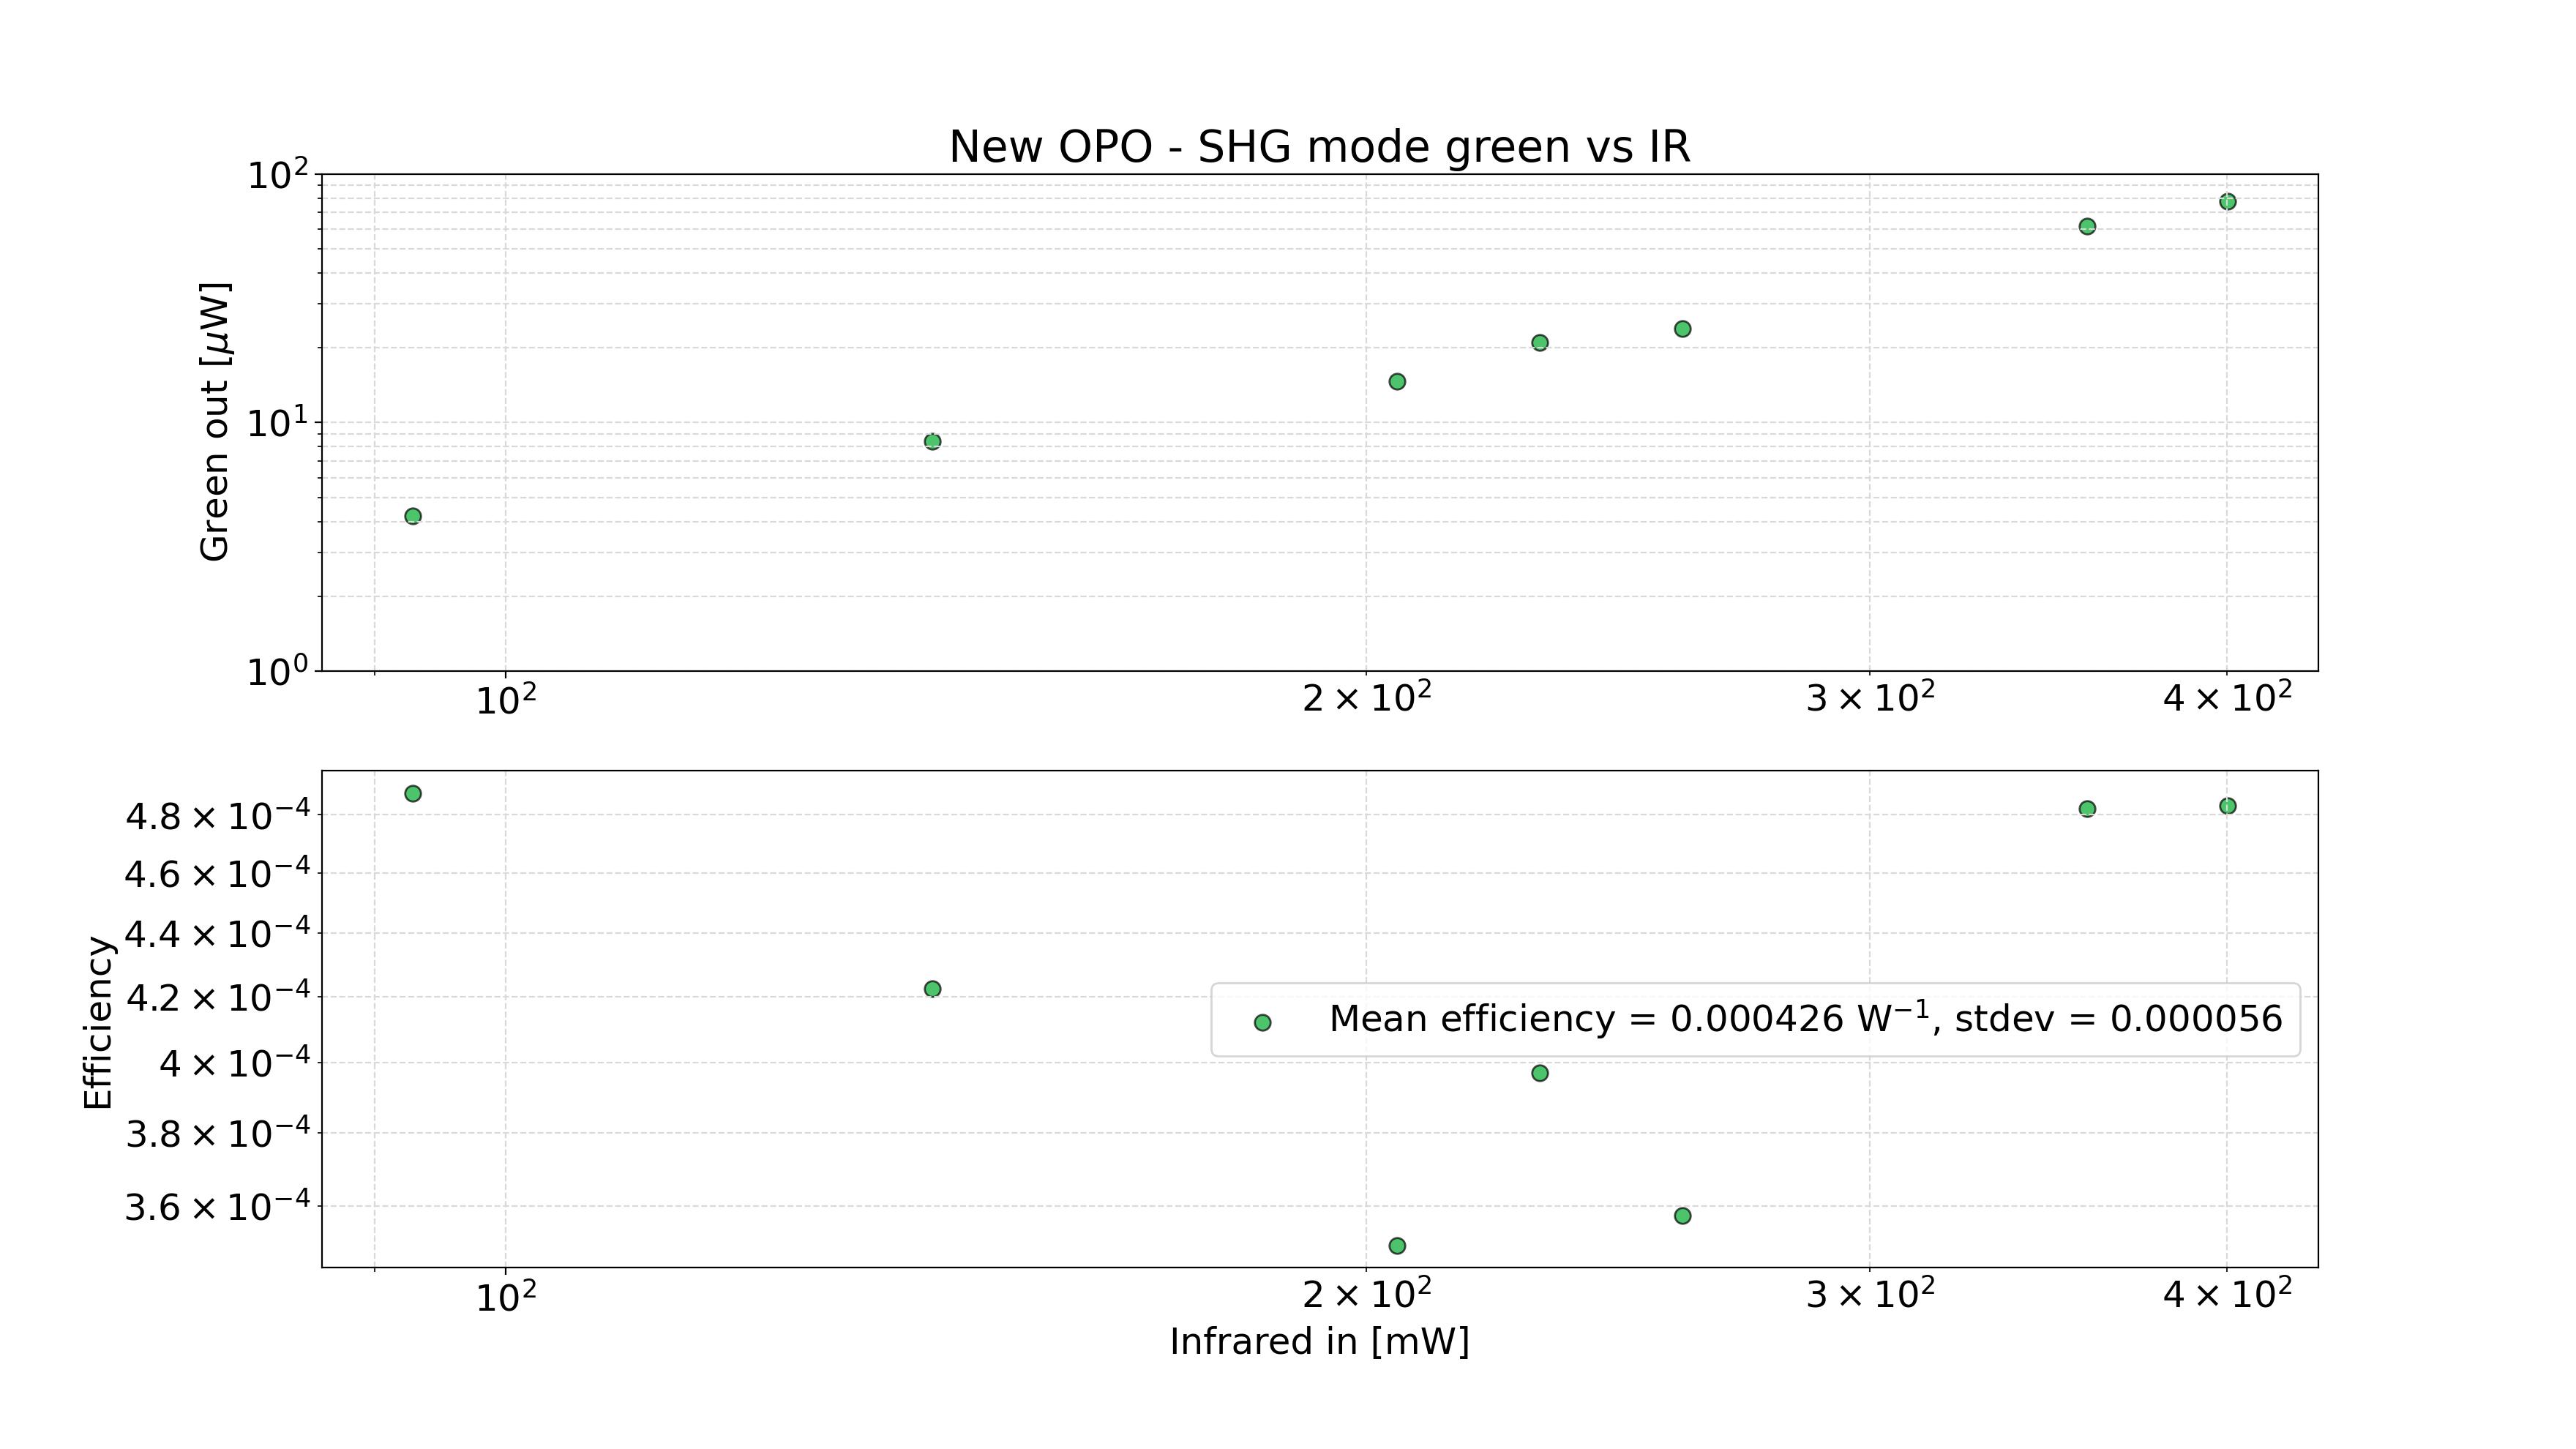
Yuhang and Michael
We checked the output of green power vs injected infrared for the new OPO. A variable ND filter was placed along the path and then the power meter was used just before the OPO for IR and just after for green. Figure 1 shows the IR vs green profile and the efficiency of green generation. Note that the efficiency is P_green/P_IR^2. In Matteo's thesis figure 5.7, the efficiency of a PPKTP SHG IR to green conversion is found to be about 2.3 /mW, vs 0.4 /mW here. But, we are using an OPO cavity with an incoupling mirror that has 20% reflectivity for green, whereas an SHG cavity should be completely transmissive for green.
For whatever reason, the power reading with the variable ND filter in place didn't seem very stable. But when we removed it to do a couple of high power measurements, it was more stable.
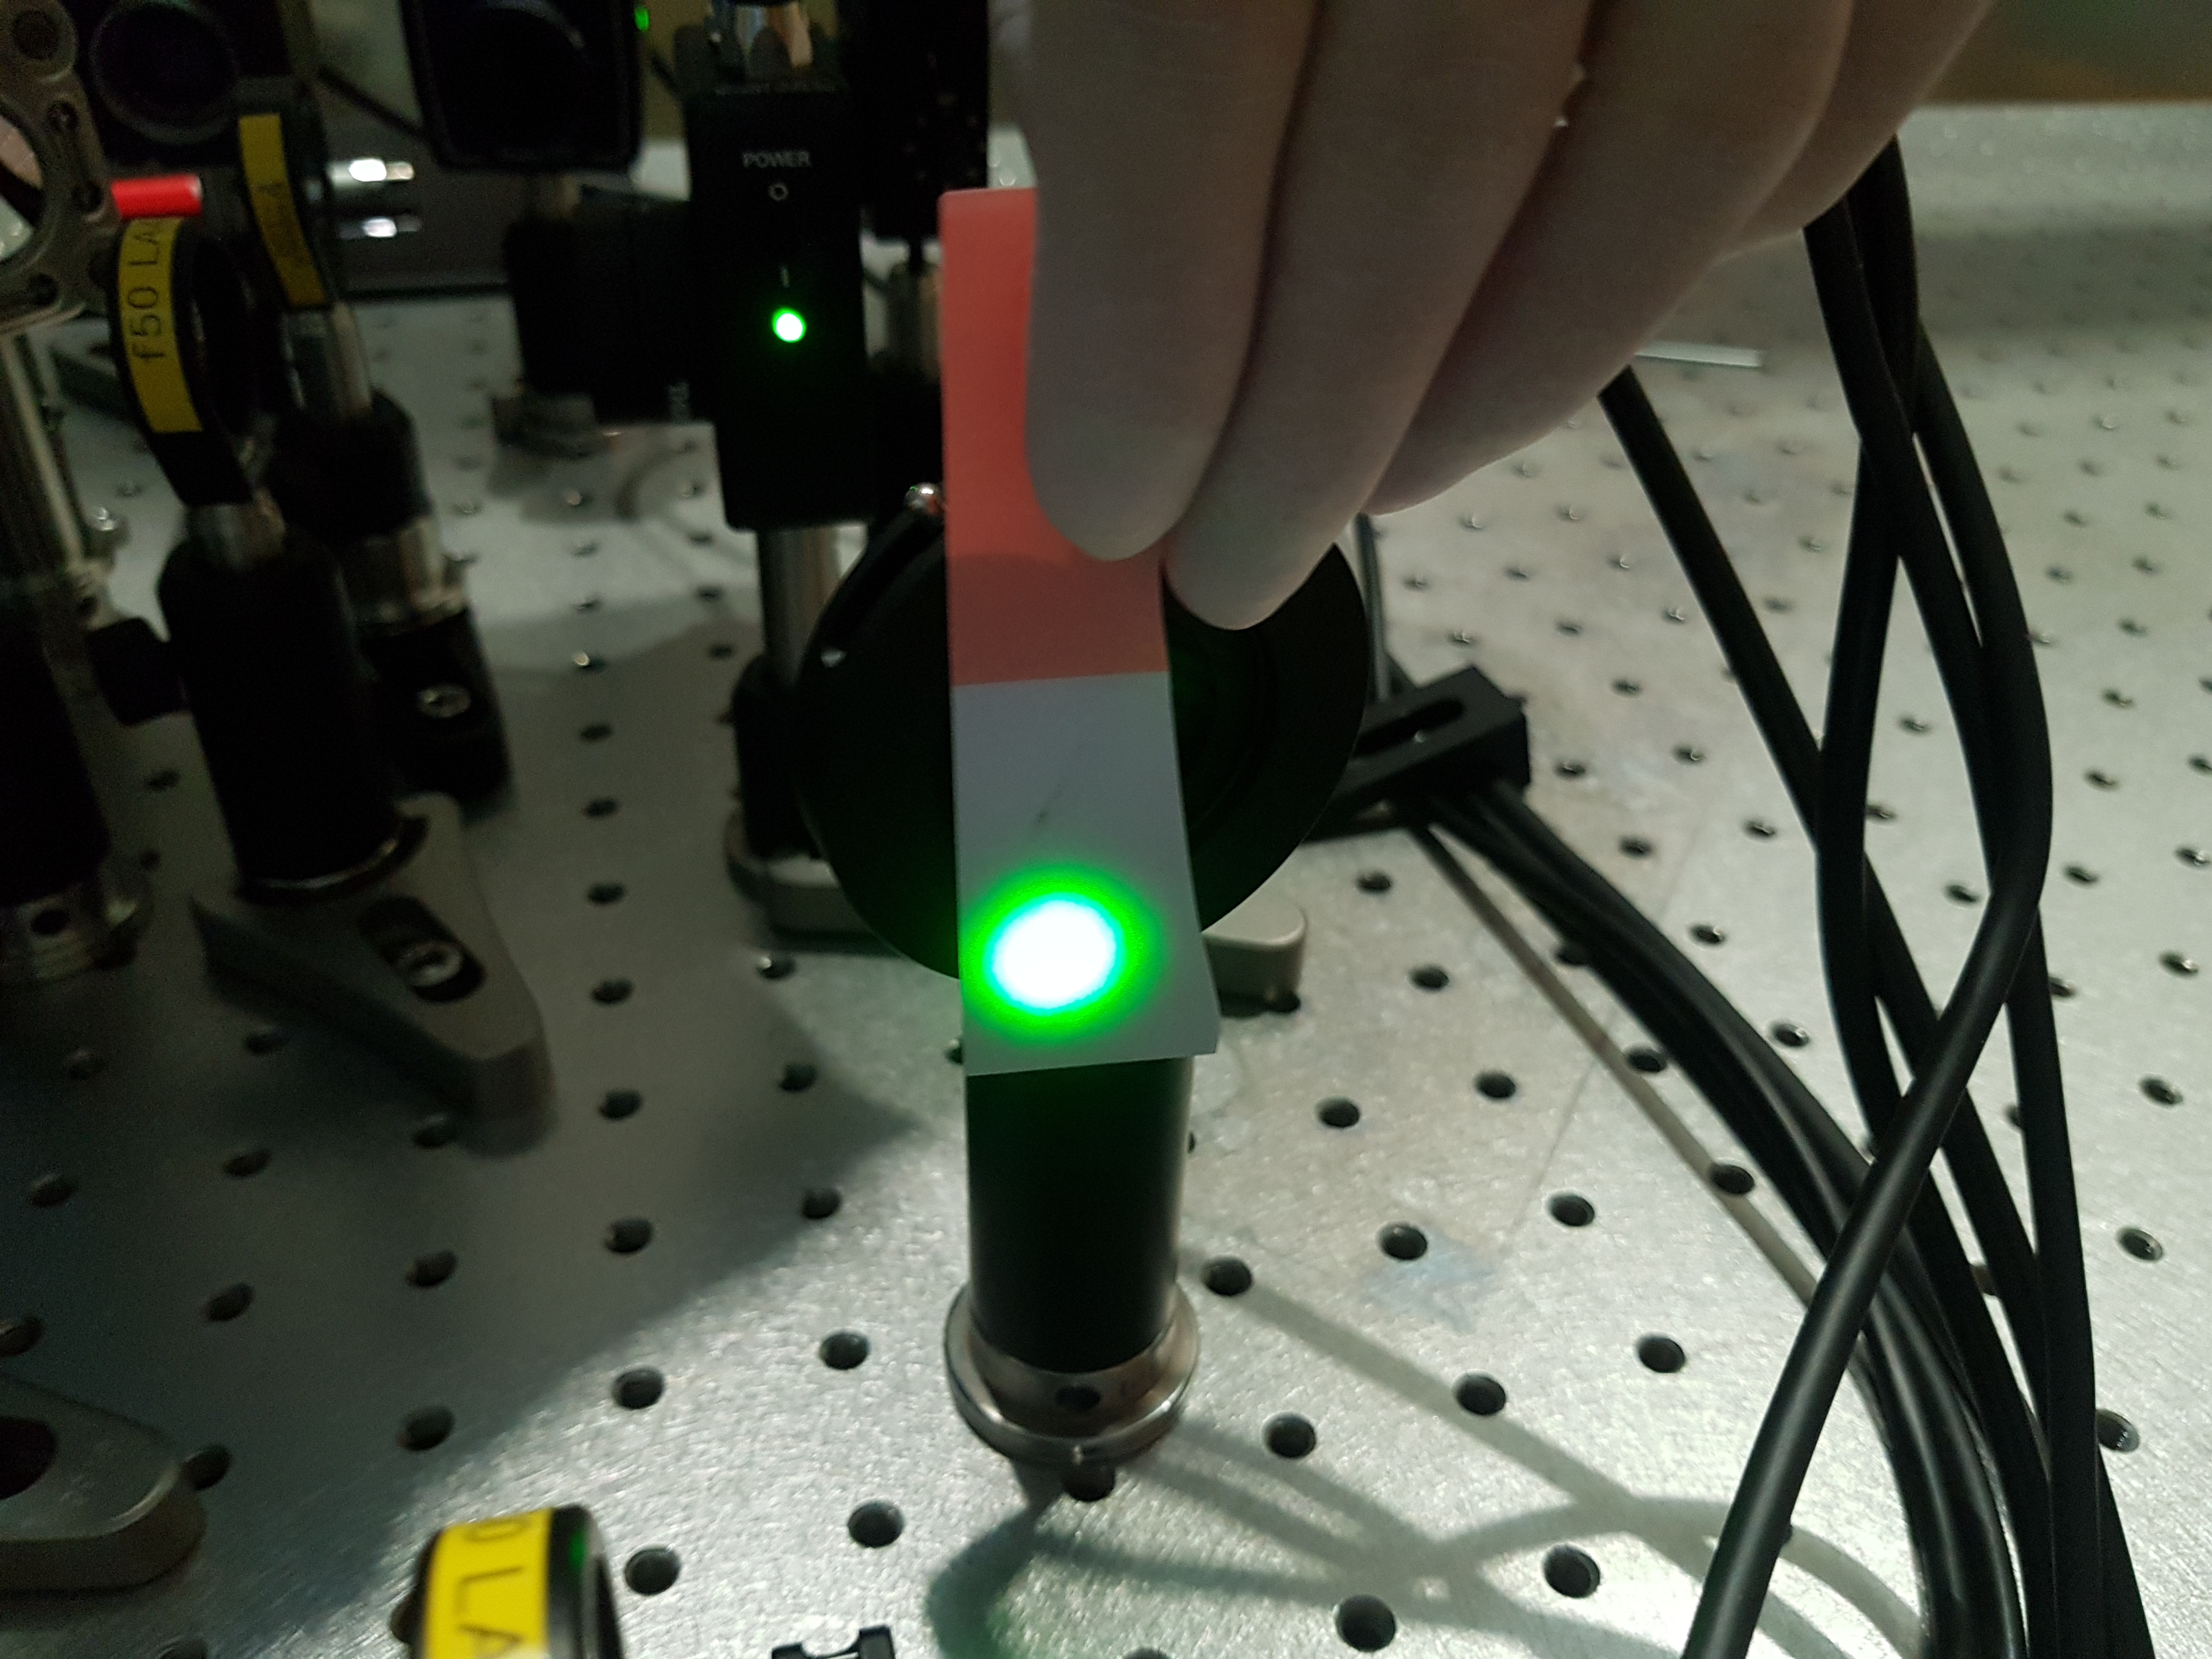
The green beam shape also looks good (figure 2).
Before removing #3 of the birefringence measurement setup I measured the incident and transmitted IR power at normal incidence.
From this measurement, I estimated a rough upper limit of scattered power to be 1 % but note that we had power fluctuations at about 4% during this measurement.
While this value is not precise at all, it is far below the green scattered power (supposedly between 10 and 30 % ; hopefully elog will follow for this measurement)
It means that the scattered power is strongly decreasing with the wavelength.
We changed IR laser and the camera which can receive IR light for IR measurement.
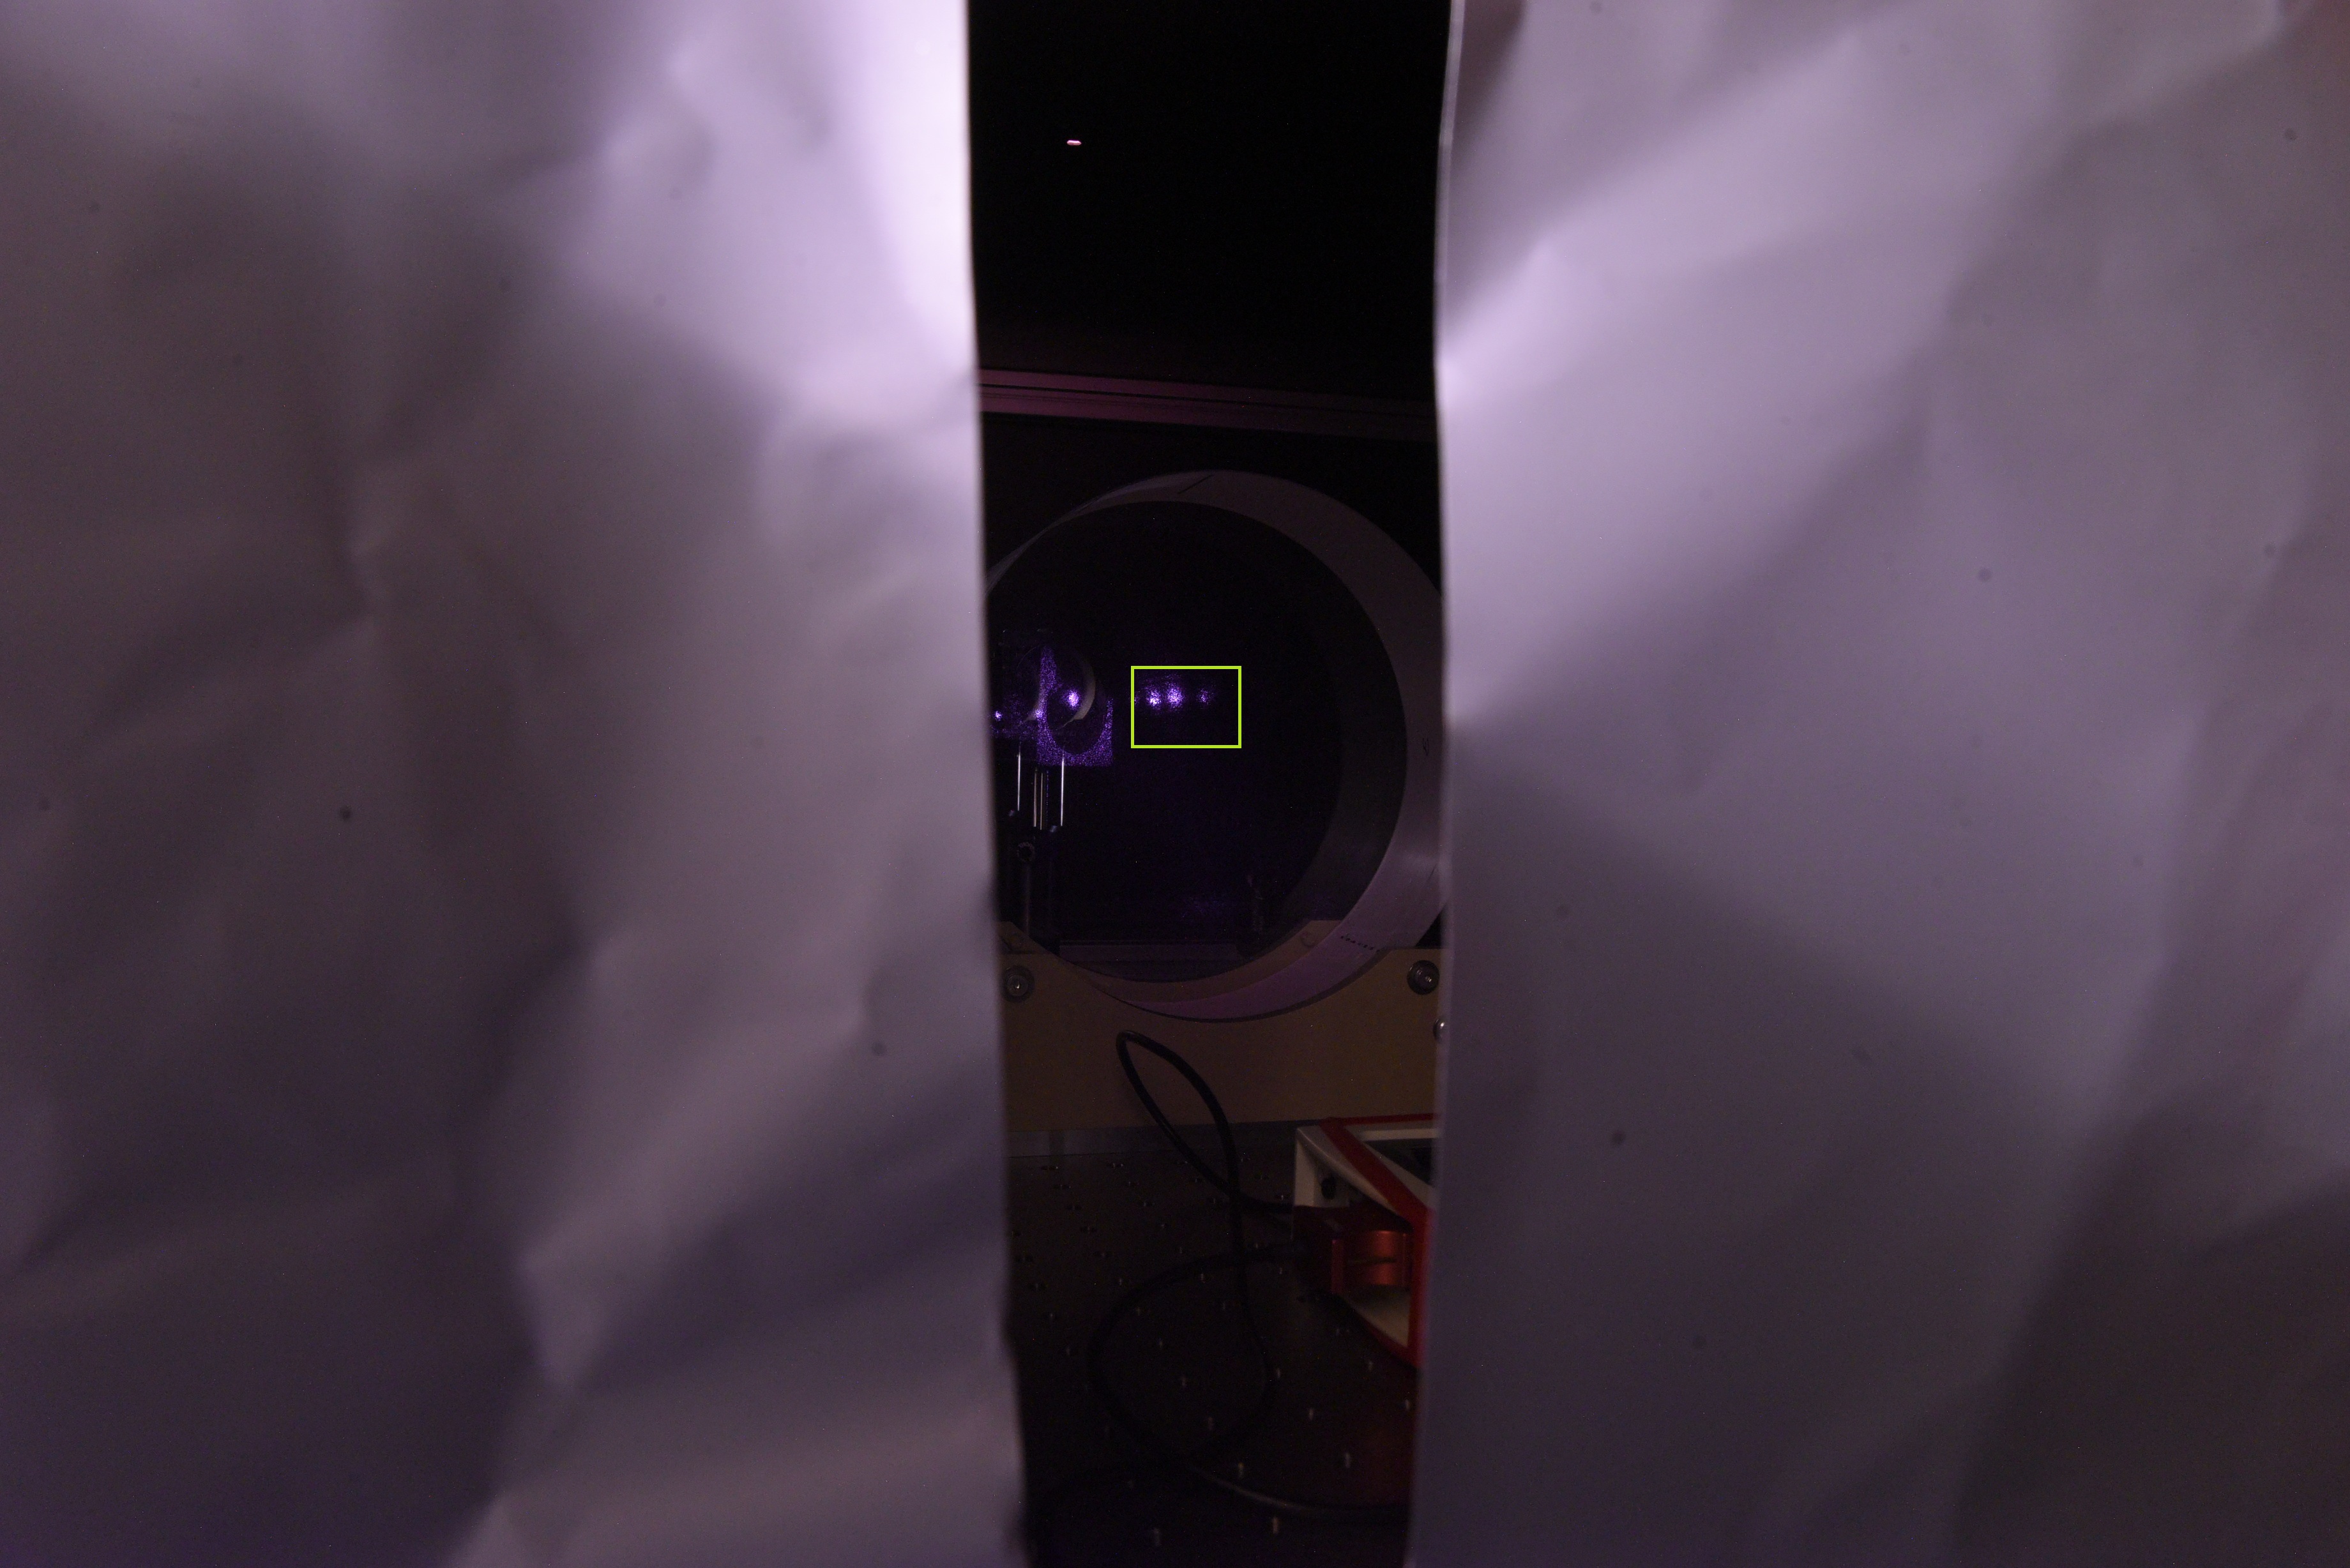
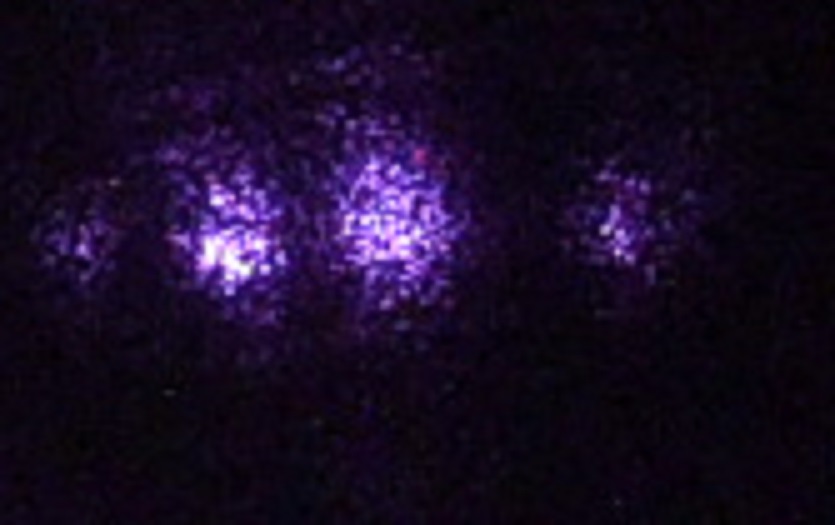
2days ago, we take picture of Aztec3 sample and we can see 4 scattering lights.
The light on the most right is front surface scattering.
The light seen third from the right is back surface scattering.
The light seen forth from the right(most left) is back reflection light.
About second one, we are discussing.
Yesterday, we installed beam profiler in clean room and measured new laser.
The result is like this.
The beam size is large. We will put some collimator lens.
Abe, Ikeda, Marc
Today we brought the beam profiler from ATC clean room to the PCI clean room.
We also brought AZTEC #1 from ATC to PCI cleanroom and reapplied first contact to one of the surface.
Marc, Matteo
We checked the 1.5 inch absorption and got expected values.
We installed #5 and did a long z scan to find the 2 surfaces at 26.3 mm and 114.7 mm making z_center = 71 mm.
From this measurement we could also see absorption about 200 ppm/cm...
In any case we started XY measurement at Z_center.
I removed #3 without rotating it : Please don't touch the holder nor the mirror as we need to precisely mark the c-axis orientation
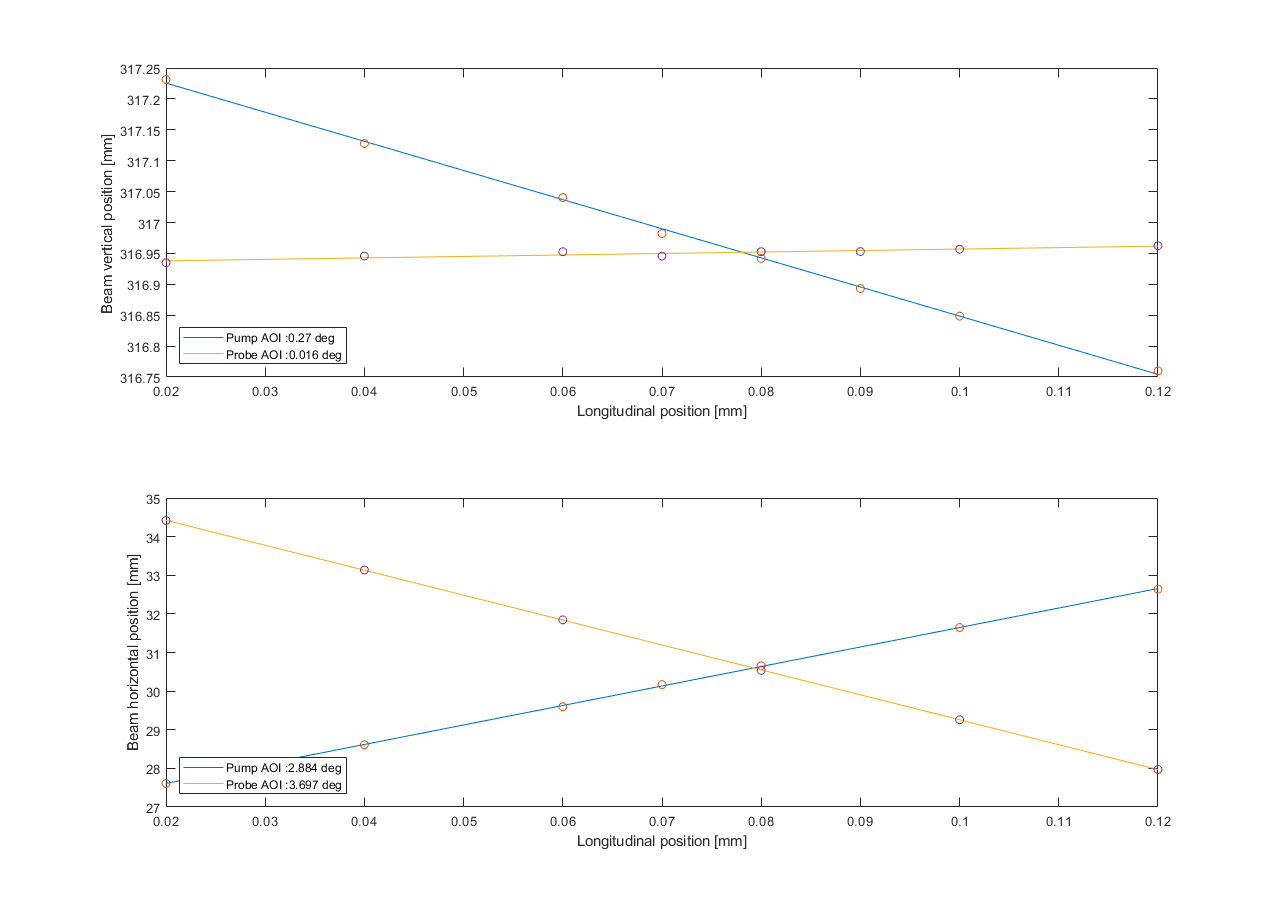
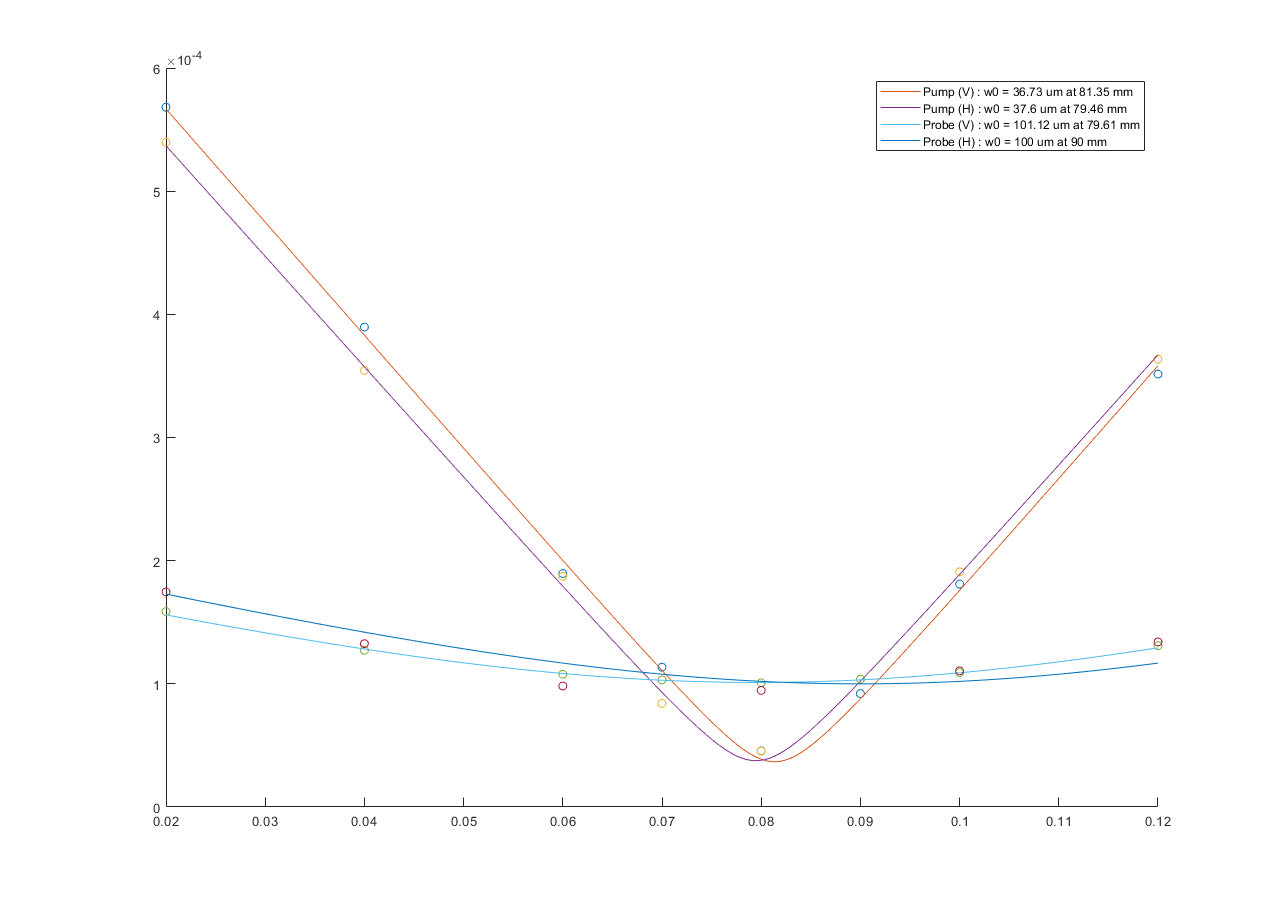
I realigned and characterized with razor blades both the probe and pump beam as reported in figures 1 and 2.
Note that the x axis of these figures is somewhat random (just corresponds to translation stage z position with the razor blades installed)
I got good values of AOI, beam sizes and crossing point.
I measured the surface reference sample :
We did measurement with input polarization angles of 0 deg, 15 deg and 30 deg.
We computed delta n and theta from them.
Especially, we found that theta = 1.6 deg in the center of the mirror.
This is exactly the value we expected from the HWP rotation angle.
We will use this rotation of the mirror for the polishing.
Yuhang and Michael
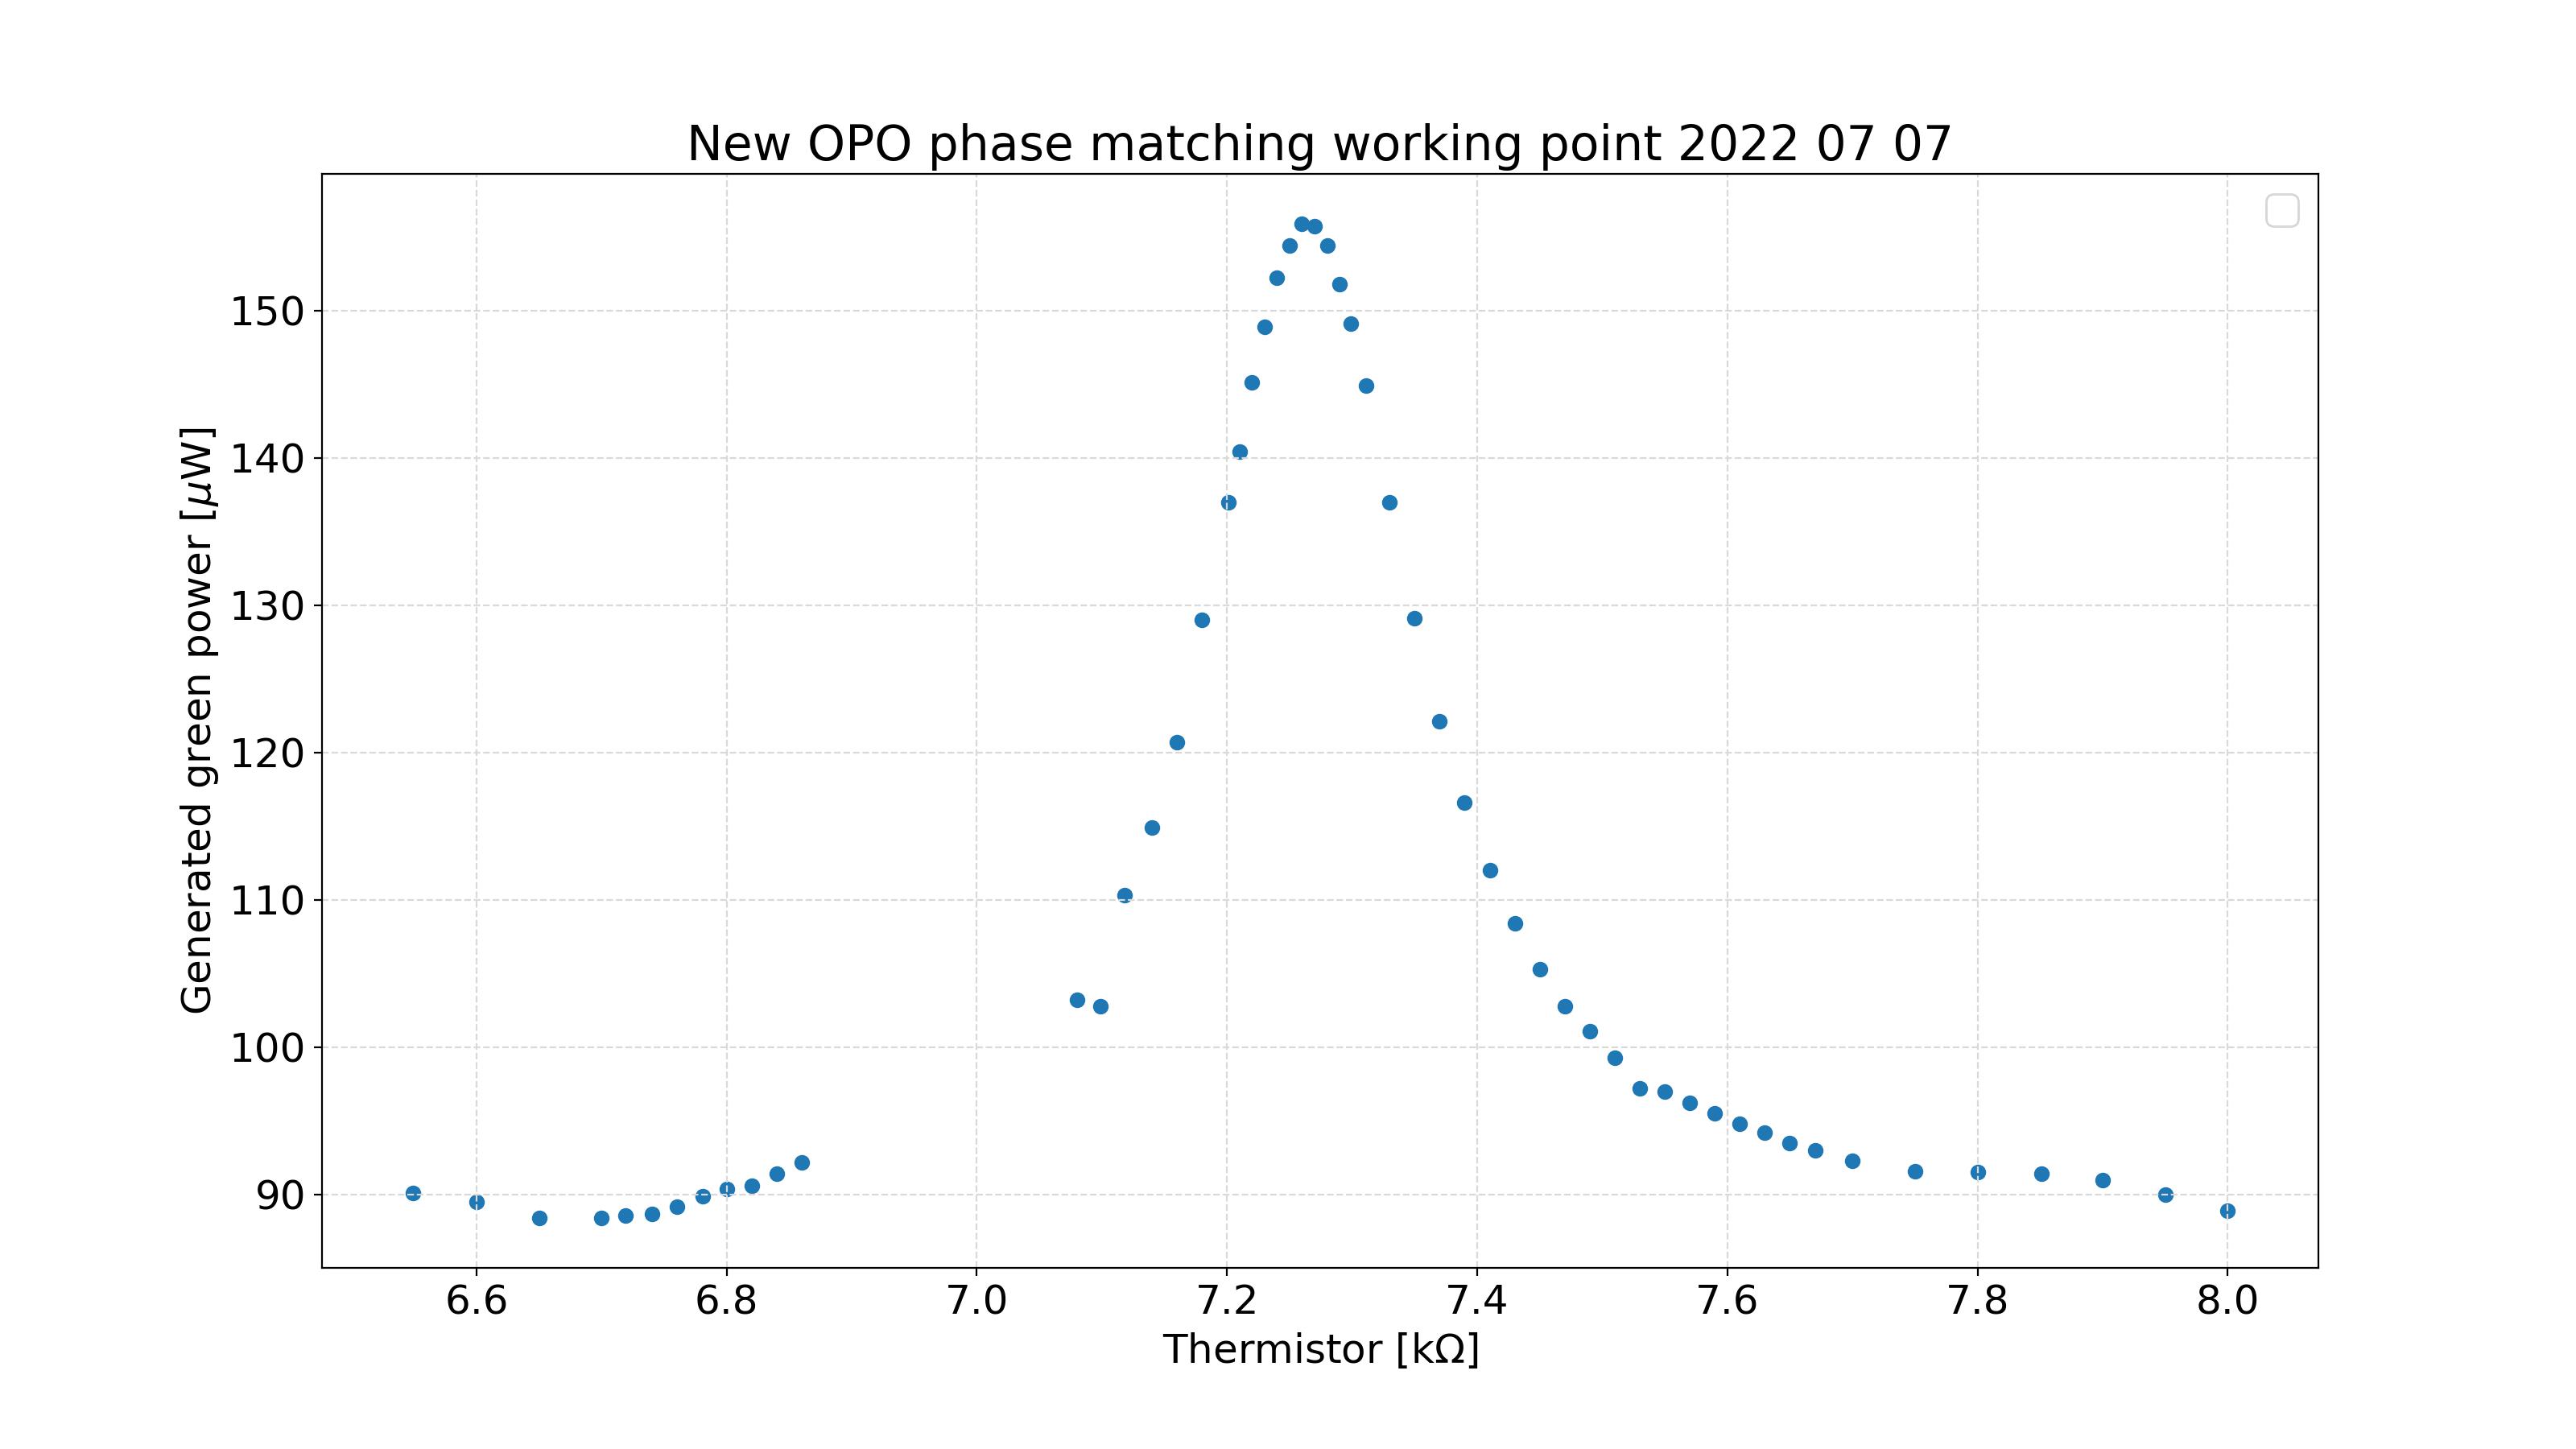
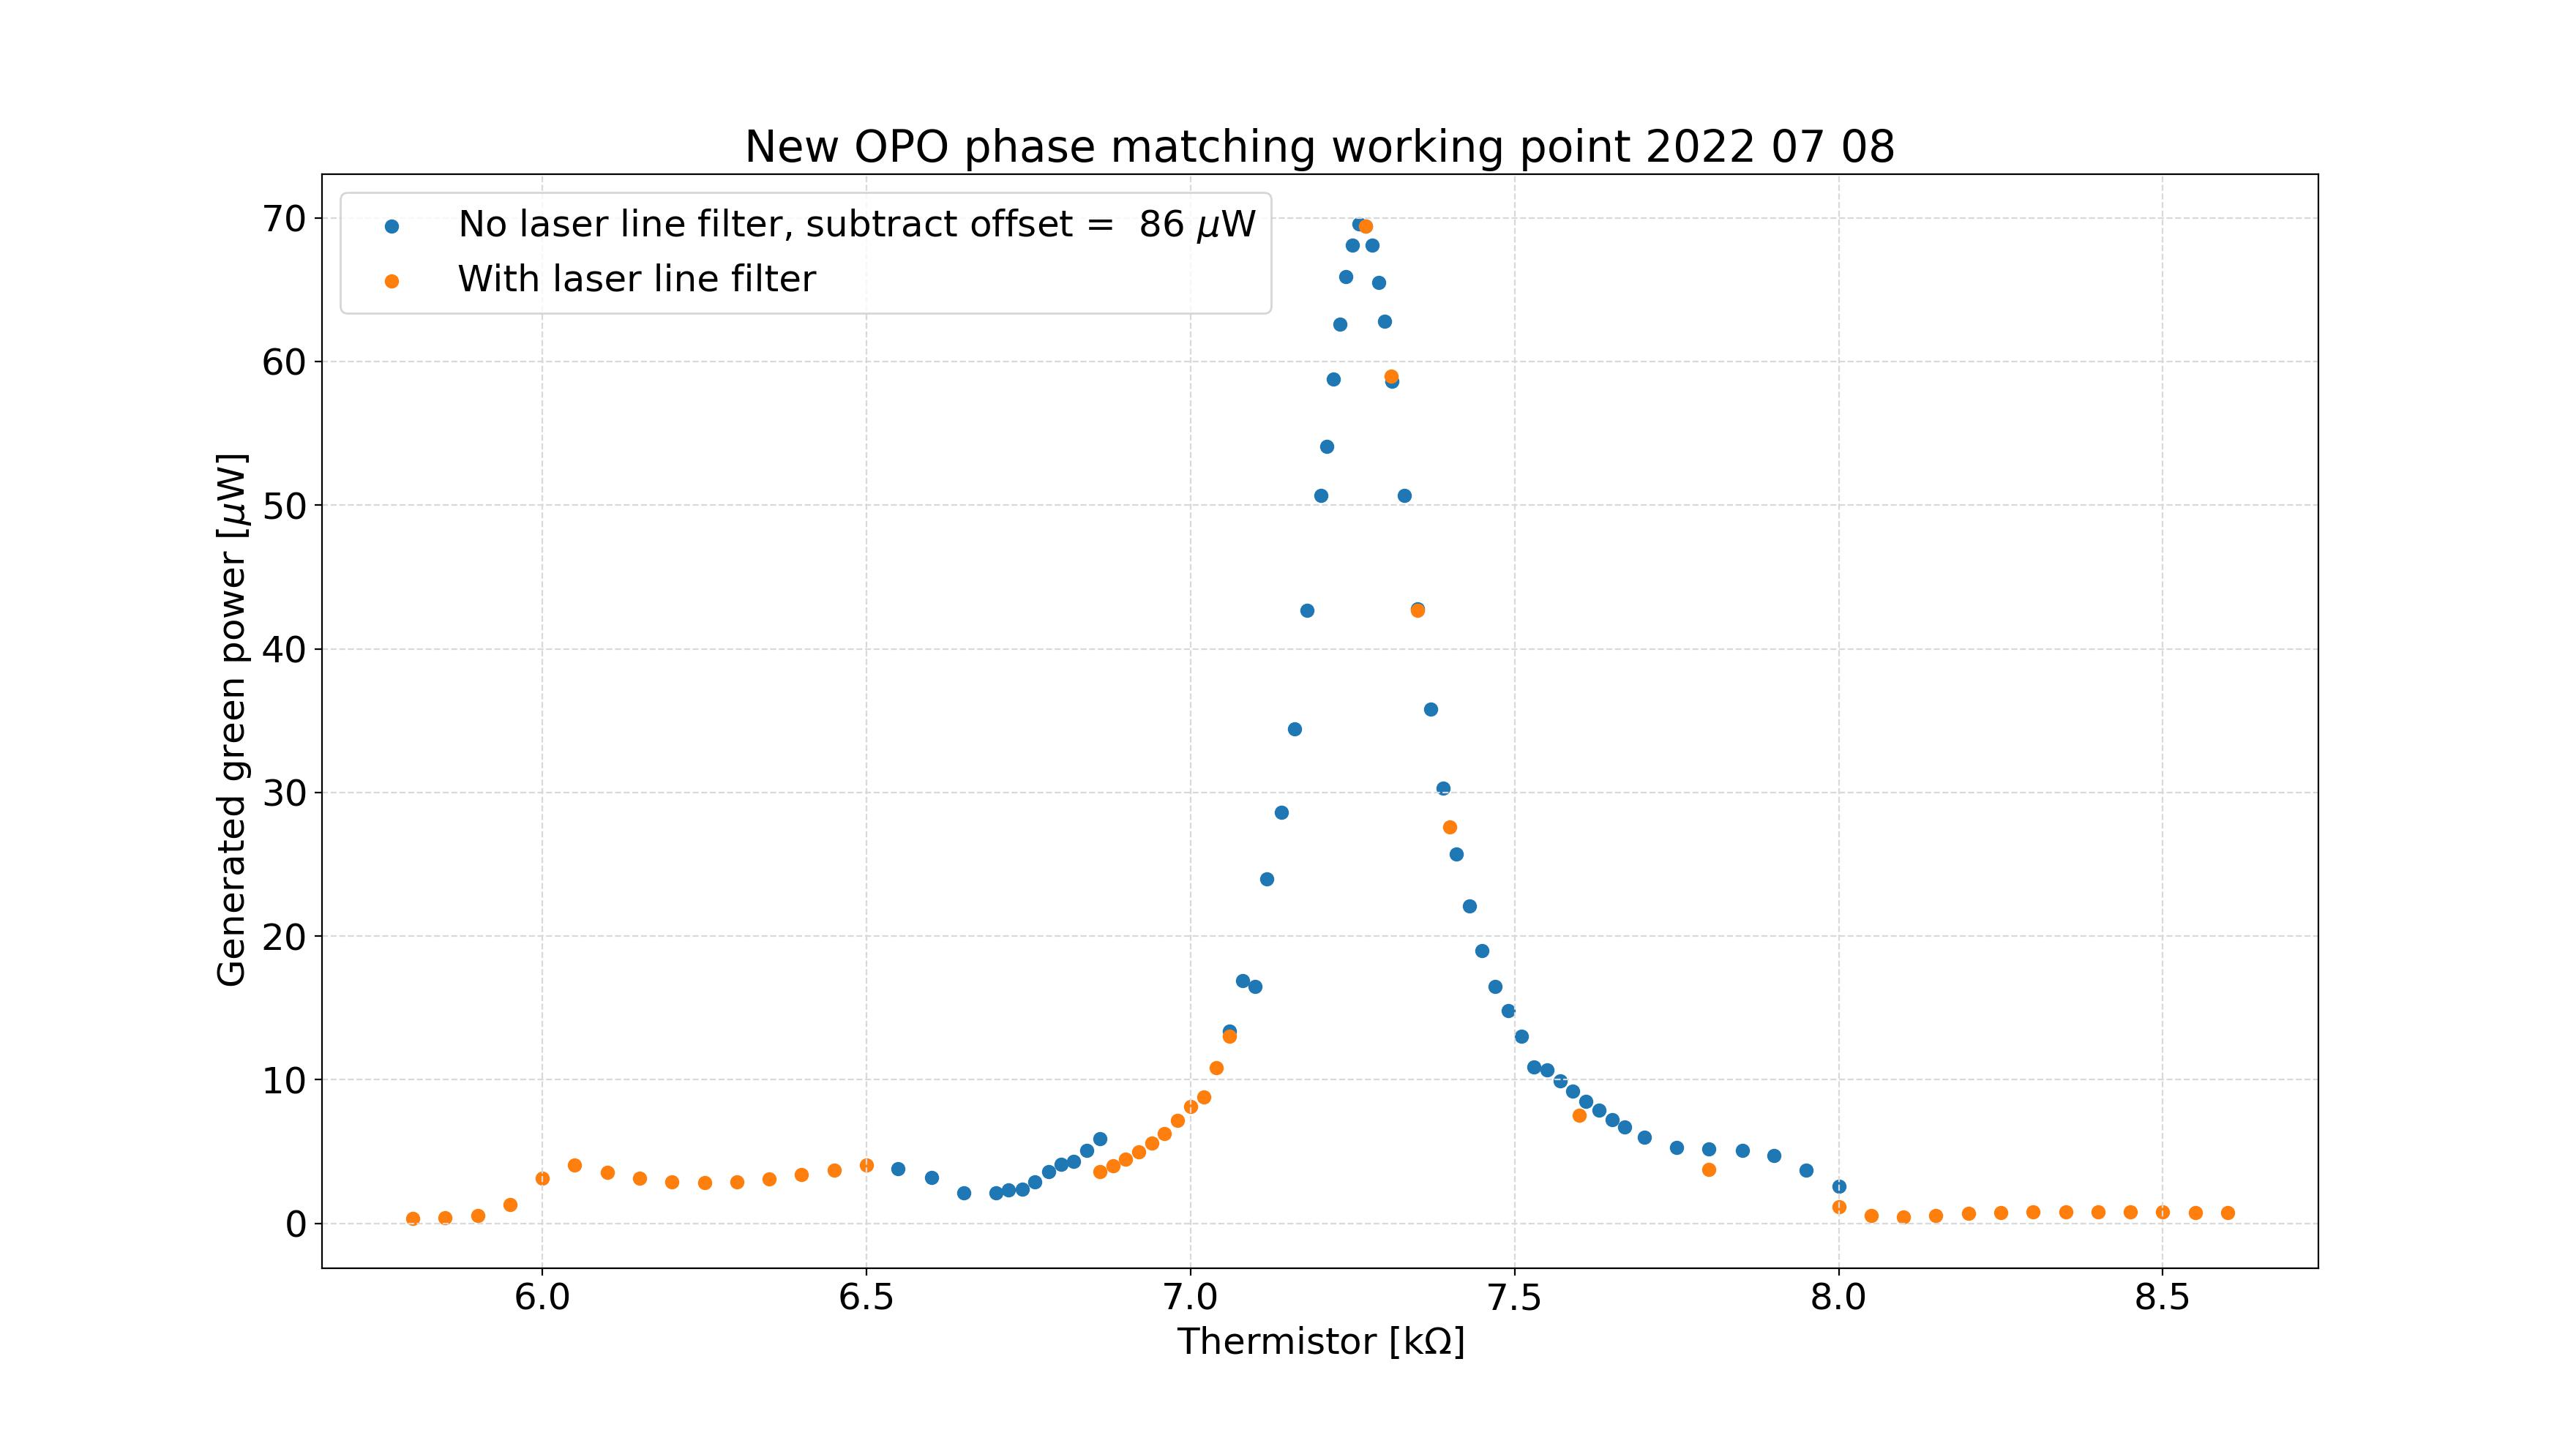
We measured some more points of the green power versus crystal temperature characteristic for the new OPO. However, this time we put a laser line filter after the OPO to cut off any transmitted infrared beam from reaching the power meter. We had a suspicion that this was causing an offset in the measurement. We did a small comparison with some values of T that were already measured as well. With the laser line filter, the green power meter reading is much lower, even though it is supposed to be switched to the "532nm" setting. We checked if this was a linear or nonlinear offset by looking at some values in the flat, steep and peak parts of the green vs T curve. As we can see in figure 1, subtracting the power offset between the measurement sets works well for the green vs T peak. There is a bit of a discrepancy in the points connecting the left side "shoulder" of the peak, but looking at my recordings I think this was a set of points from before we optimised the locking of the OPO (i.e. unlocking and relocking between each temperature change). Anyway, we can see that the peak phase matching occurs at 7.26 kOhm thermistor resistance, which corresponds almost exactly to the old OPO. Also I made a mistake in reporting the amount of power in 3018, it is actually about 357 mW of infrared being sent to the new OPO.
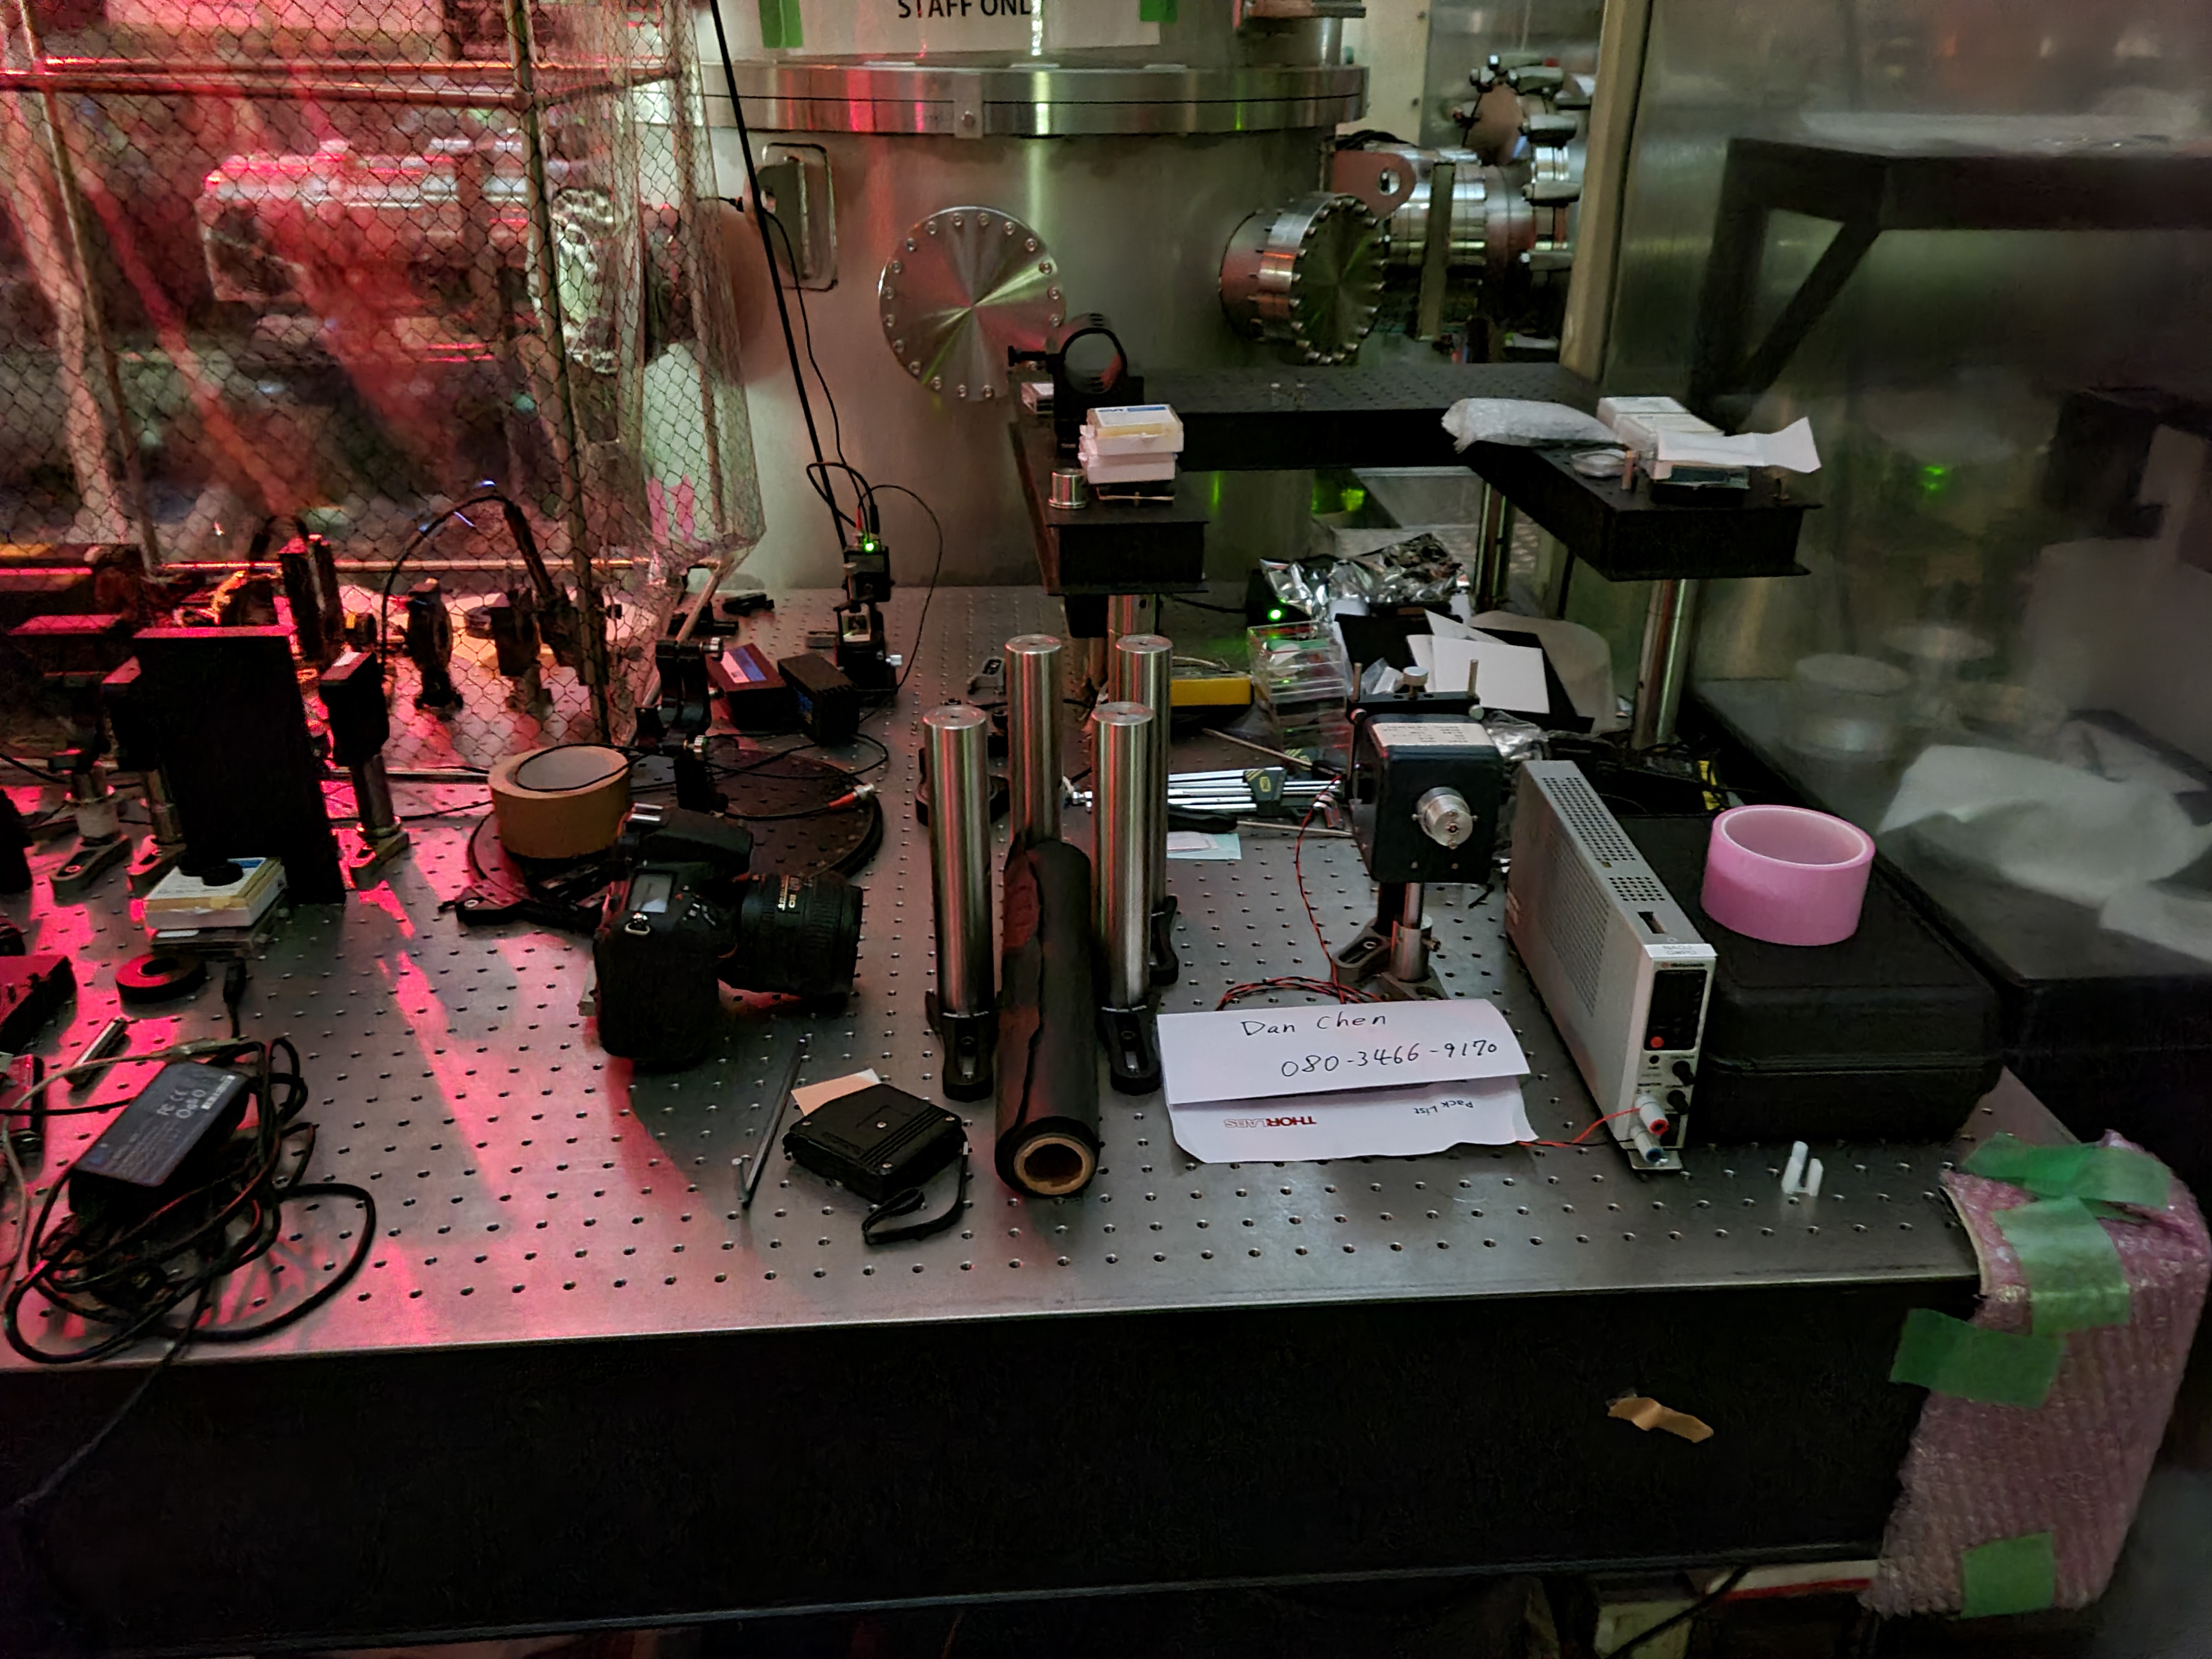
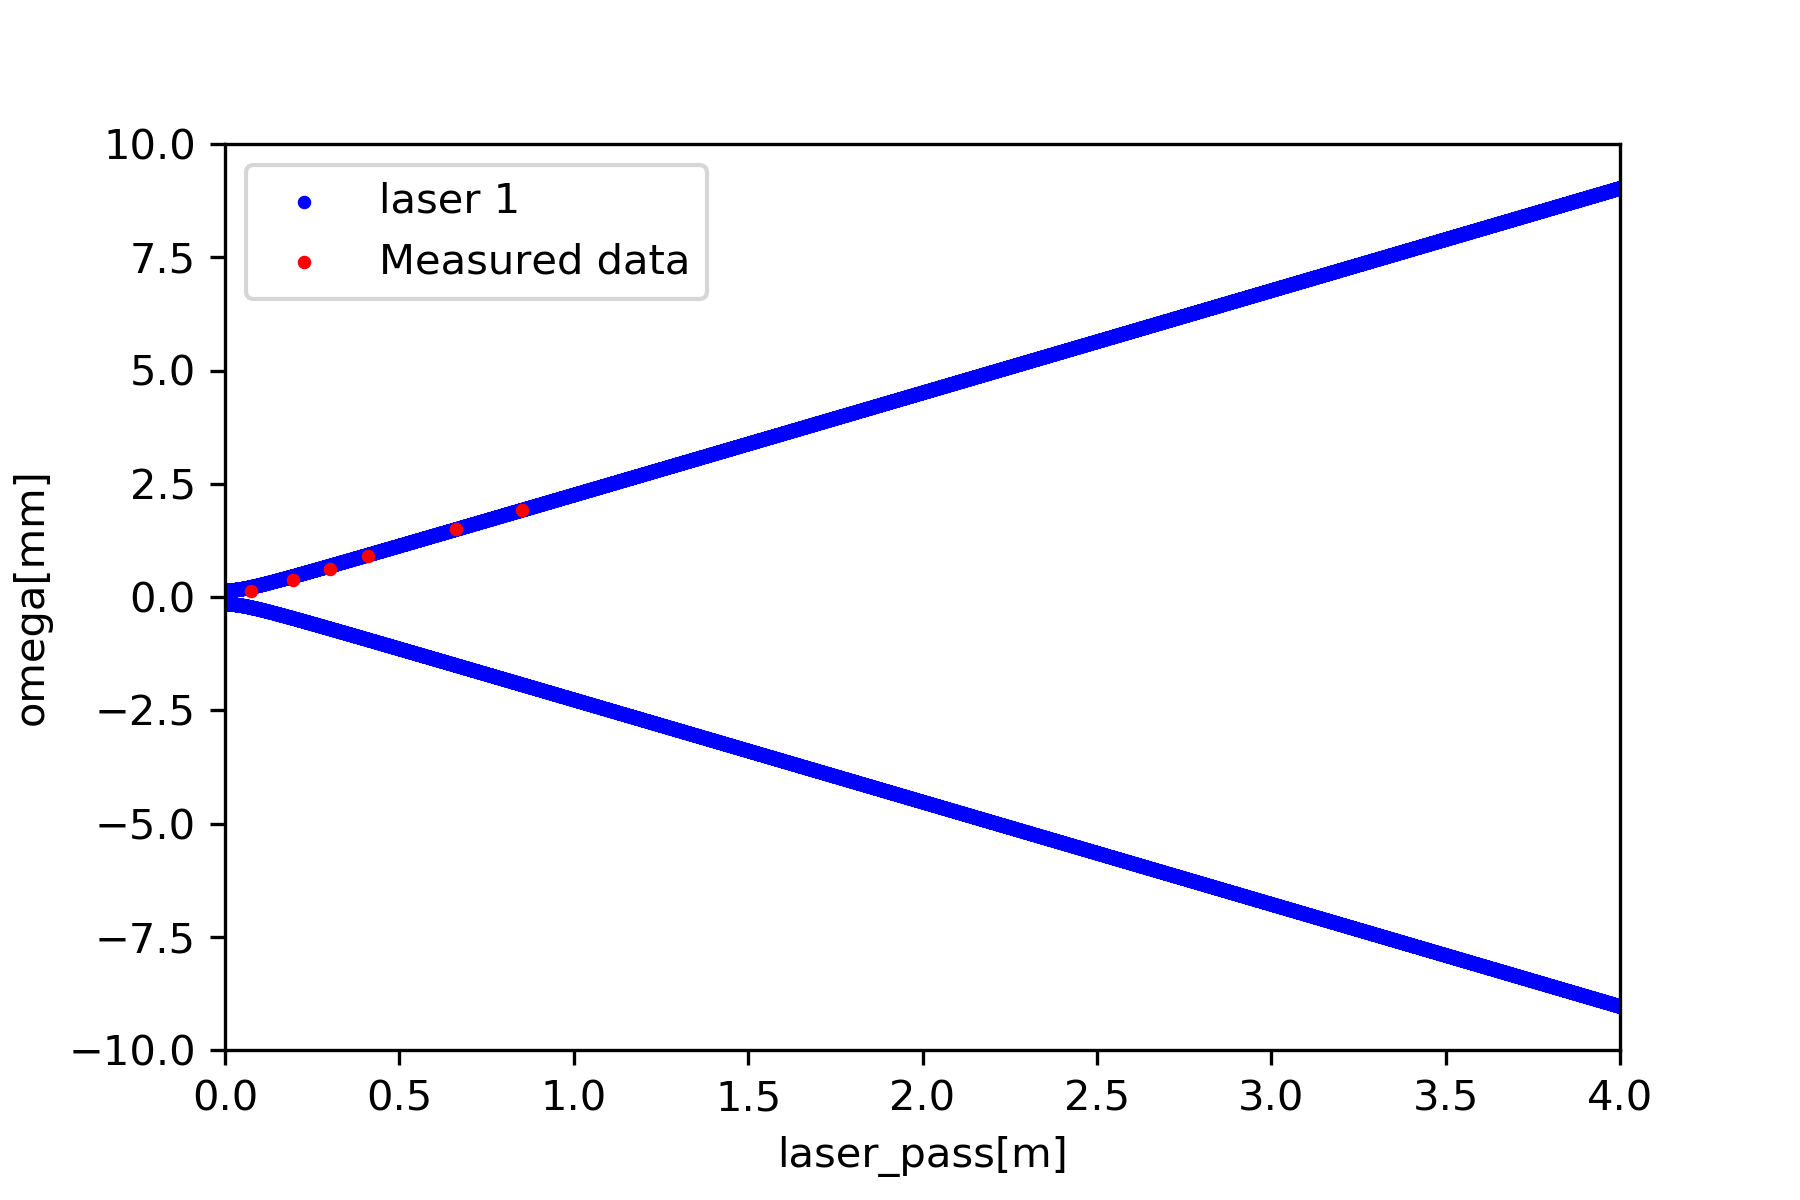
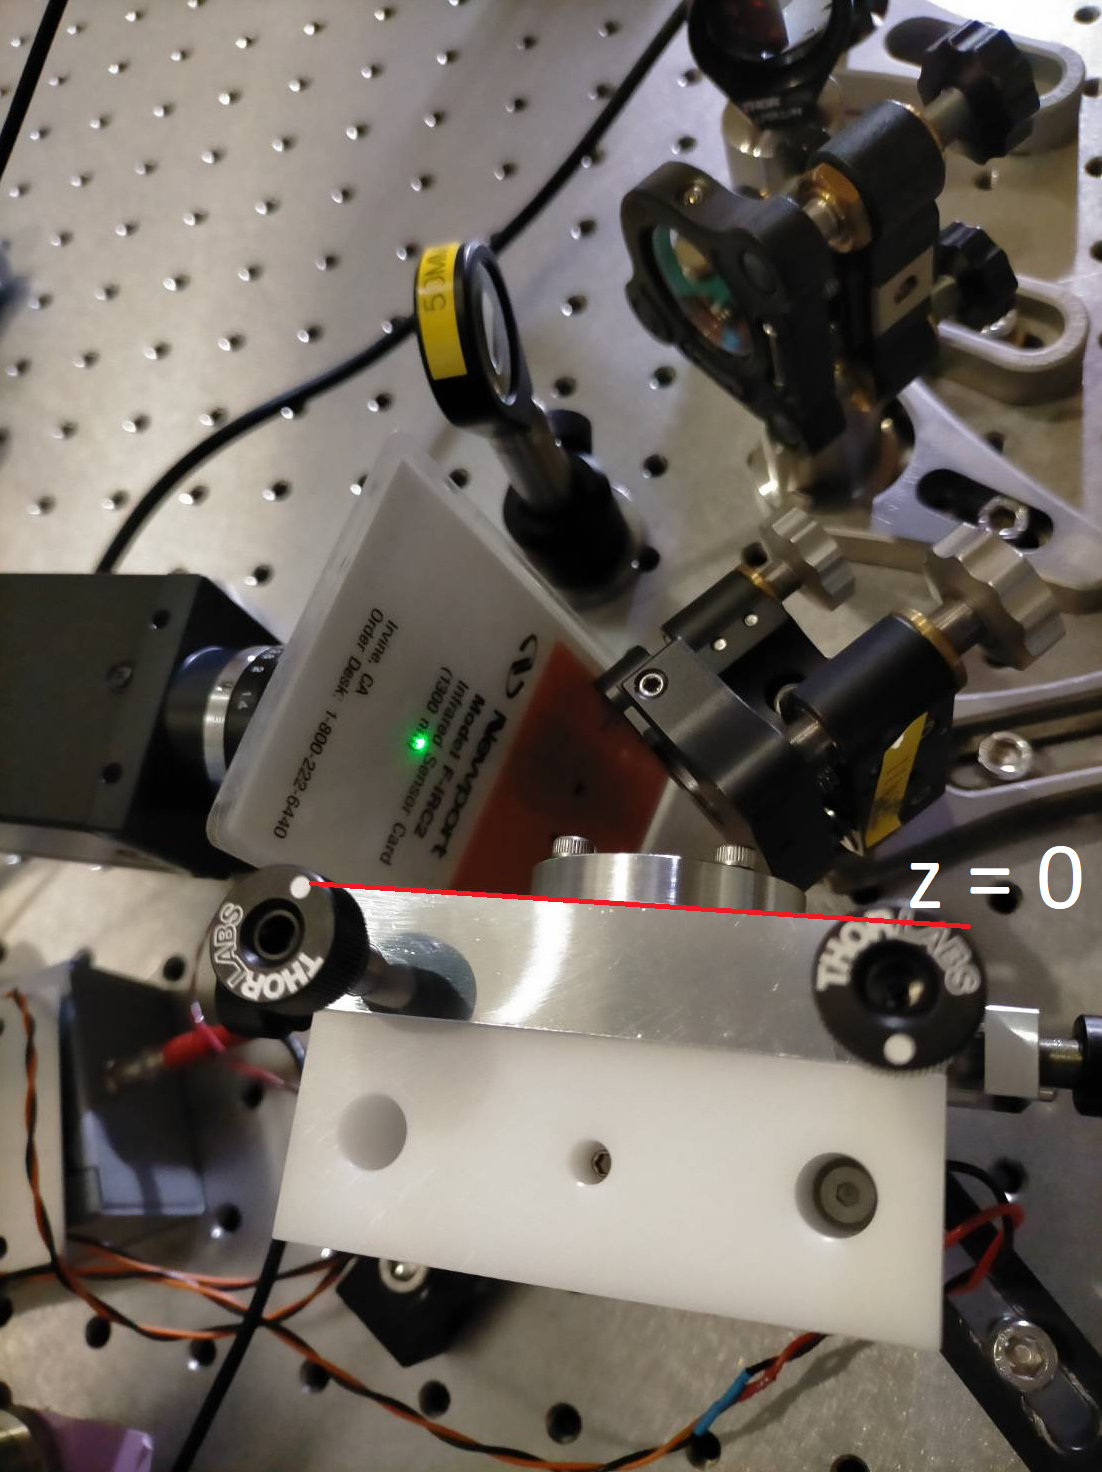
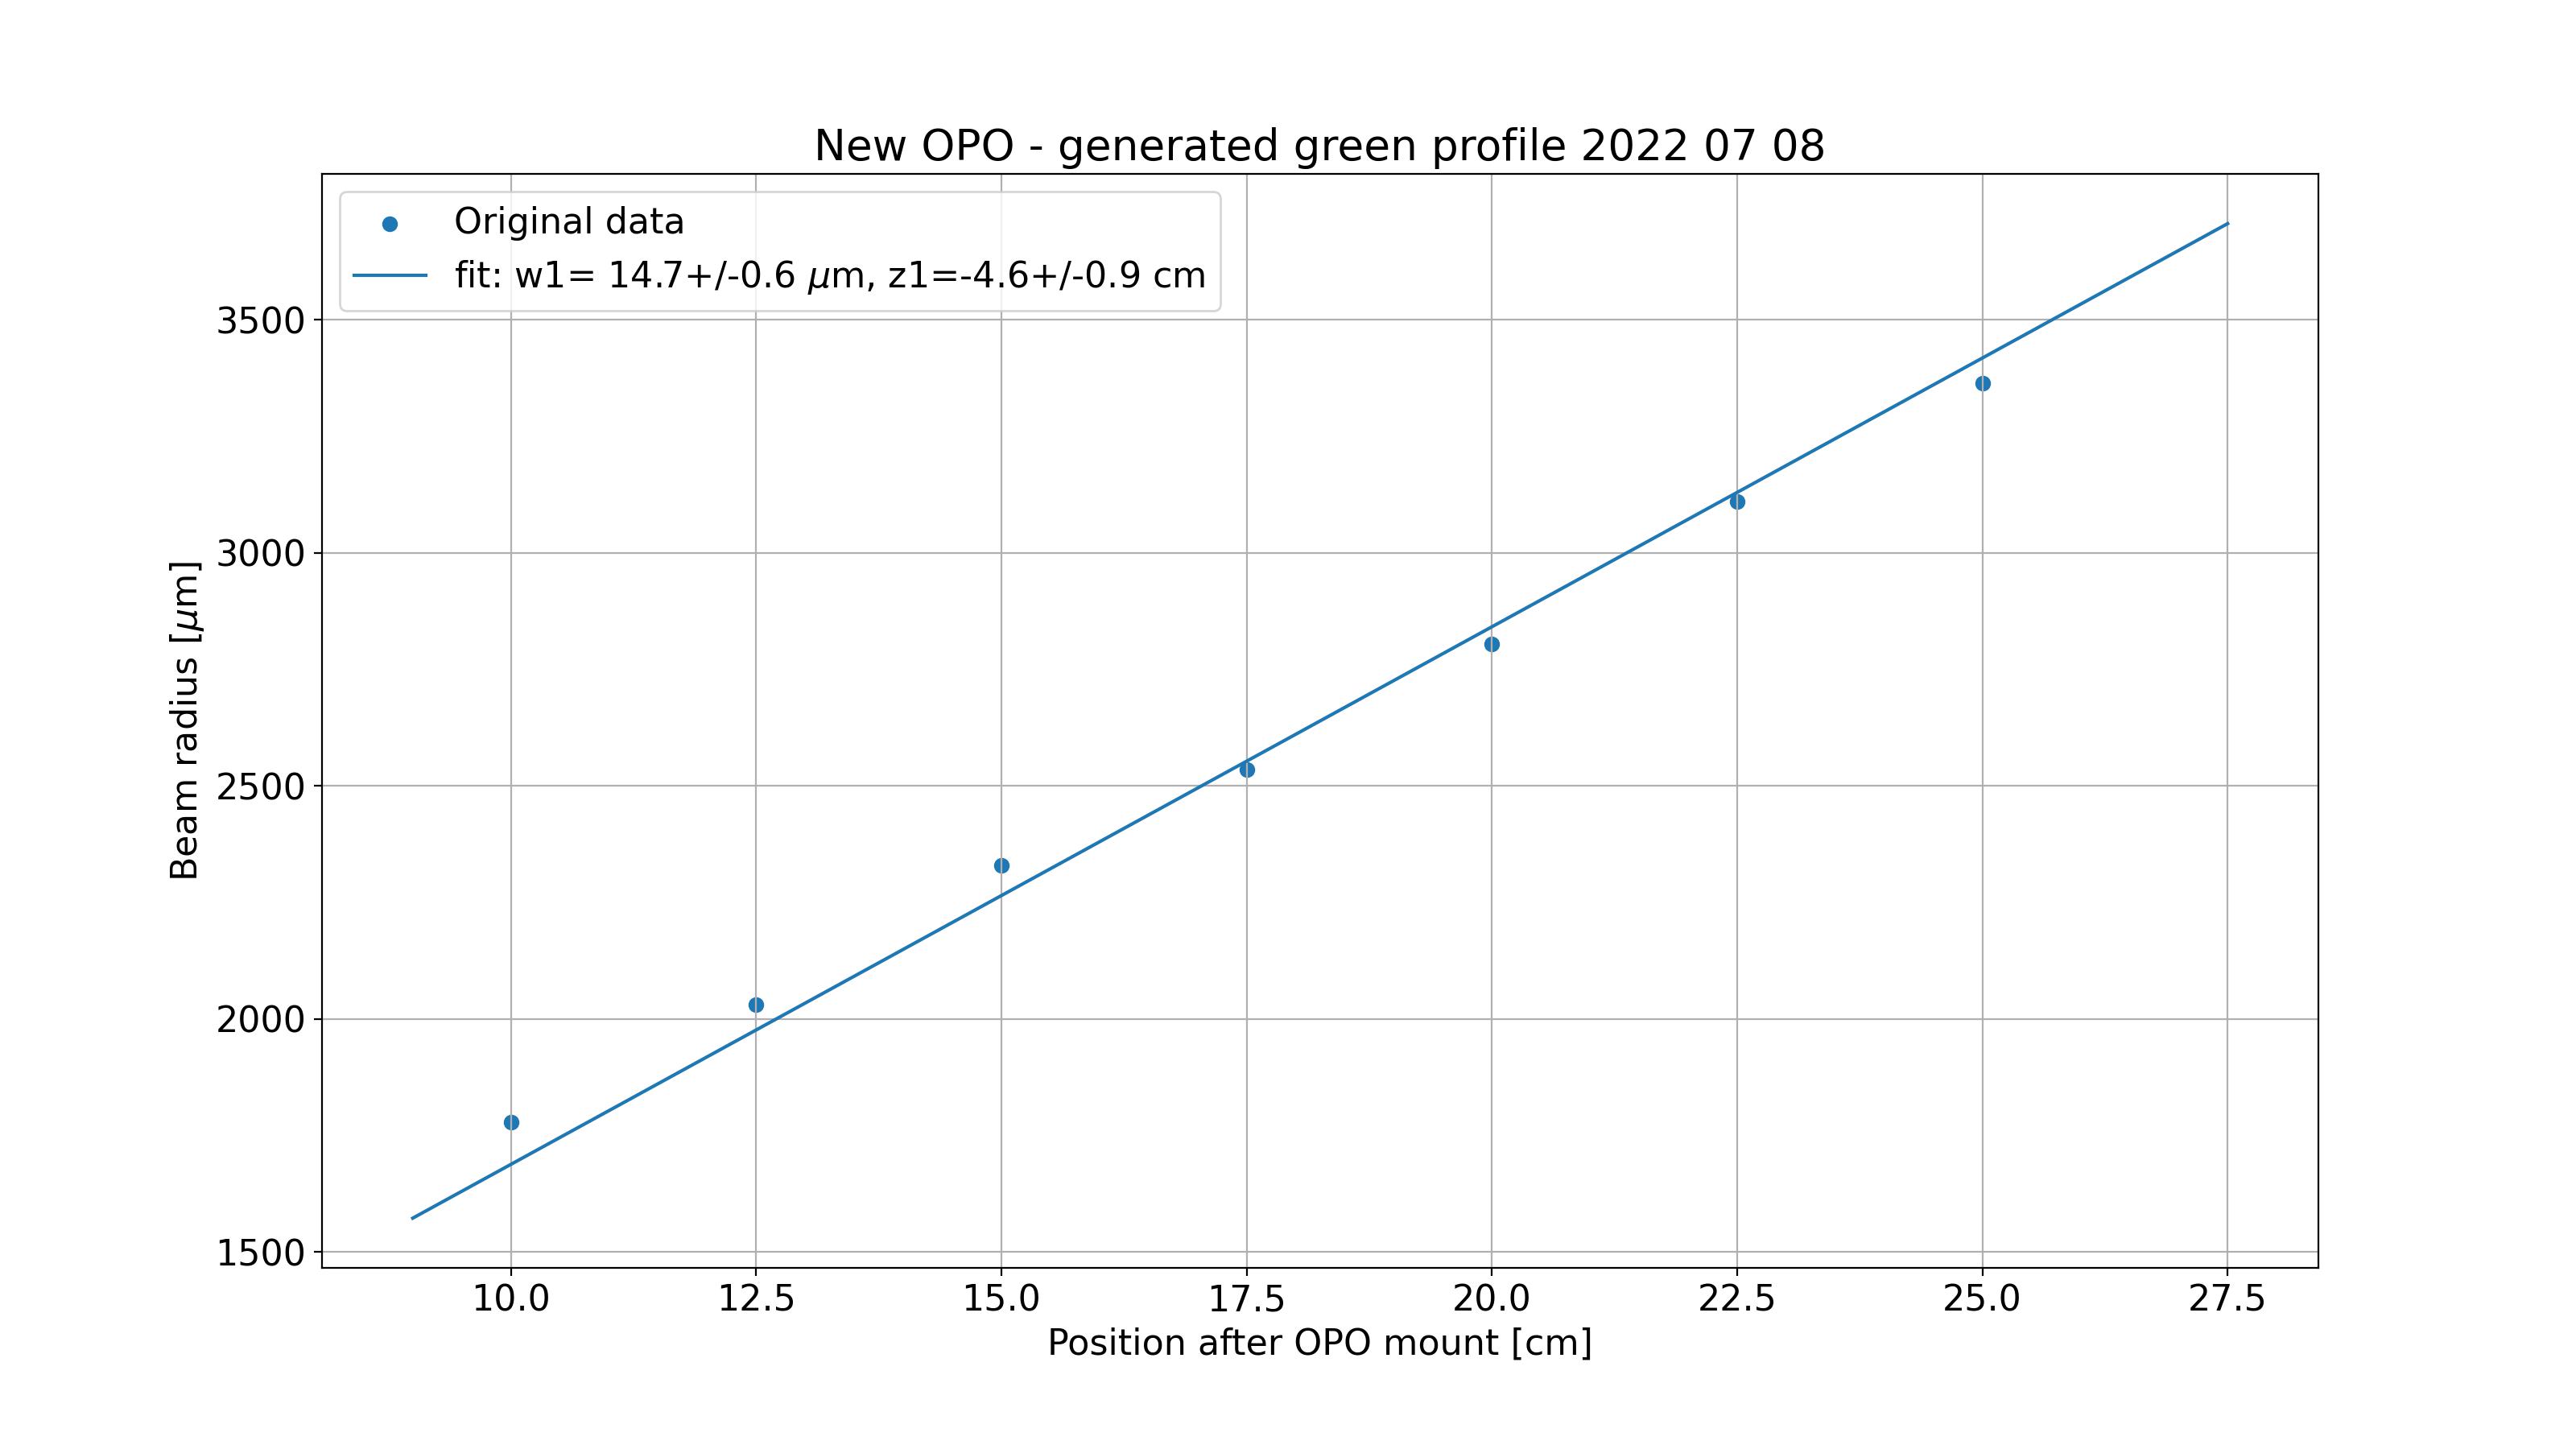
Then we measured the beam profile of the generated green coming from the OPO, in order to find the actual beam position inside the OPO assembly. The measurement is set so that z = 0 corresponds to the metal edge of the OPO holder as shown in figure 2. We used the beam profiler shown in figure 3, removed the ND filter and turned the lights off since the generated green power is very low. The beam profiler software gives us the "13.5%" Gaussian beam width. We used an f = 500 mm lens placed at z = 8 cm with the intent of making it easier to measure the beam over a longer distance, since the OPO beam waist is of the order of 20 µm. The beam profile measurement begins at z = 10cm, so the calculated waist here is for the beam after the lens, as shown in figure 4. I will add a comments later with a JaMMT calculation using the fitted beam and actual lens parameters (Thorlabs LA4181).
However, even using a f = 500 mm lens, we couldn't measure over a large range of distance values, because the beam quickly became too large for the beam profiler. Looking at the graph it looks like low z values are above the fit line while high z values are below, and the beam isn't really focusing. We should probably change the lens or lens position.

Marc, Michael, Yuhang
Today we finished the cleaning of #5 and the 1.5 inch sapphire.
Then, we tried to fine tune the rotation angle of the mirror.
This time, we placed a flexible ruler on the mirror and could precisely (+/-0.2 mm) estimate the arc length of the rotation.
The results are attached in figure 1.
Actually I made a mistake and rotated the HWP by +0.7 deg before this measurement so we need to add this value to the effective rotation of the mirror.
Note that for some points the mirror was a bit tilted which creates stronger coupling between s and p polarizations.
That's why we repeated measurements at some rotation angle.
We started measurement at -2.9 deg rotation with HWP = 0 deg.
In the end, before starting polarization measurement, we checked the HWP position that minimized the Ip power to be +0.8 deg.

Marc, Yuhang
As for any waveplate, theta should have a 90 degrees periodicity with maybe one of the 2 orthogonal axis of better quality than the other.
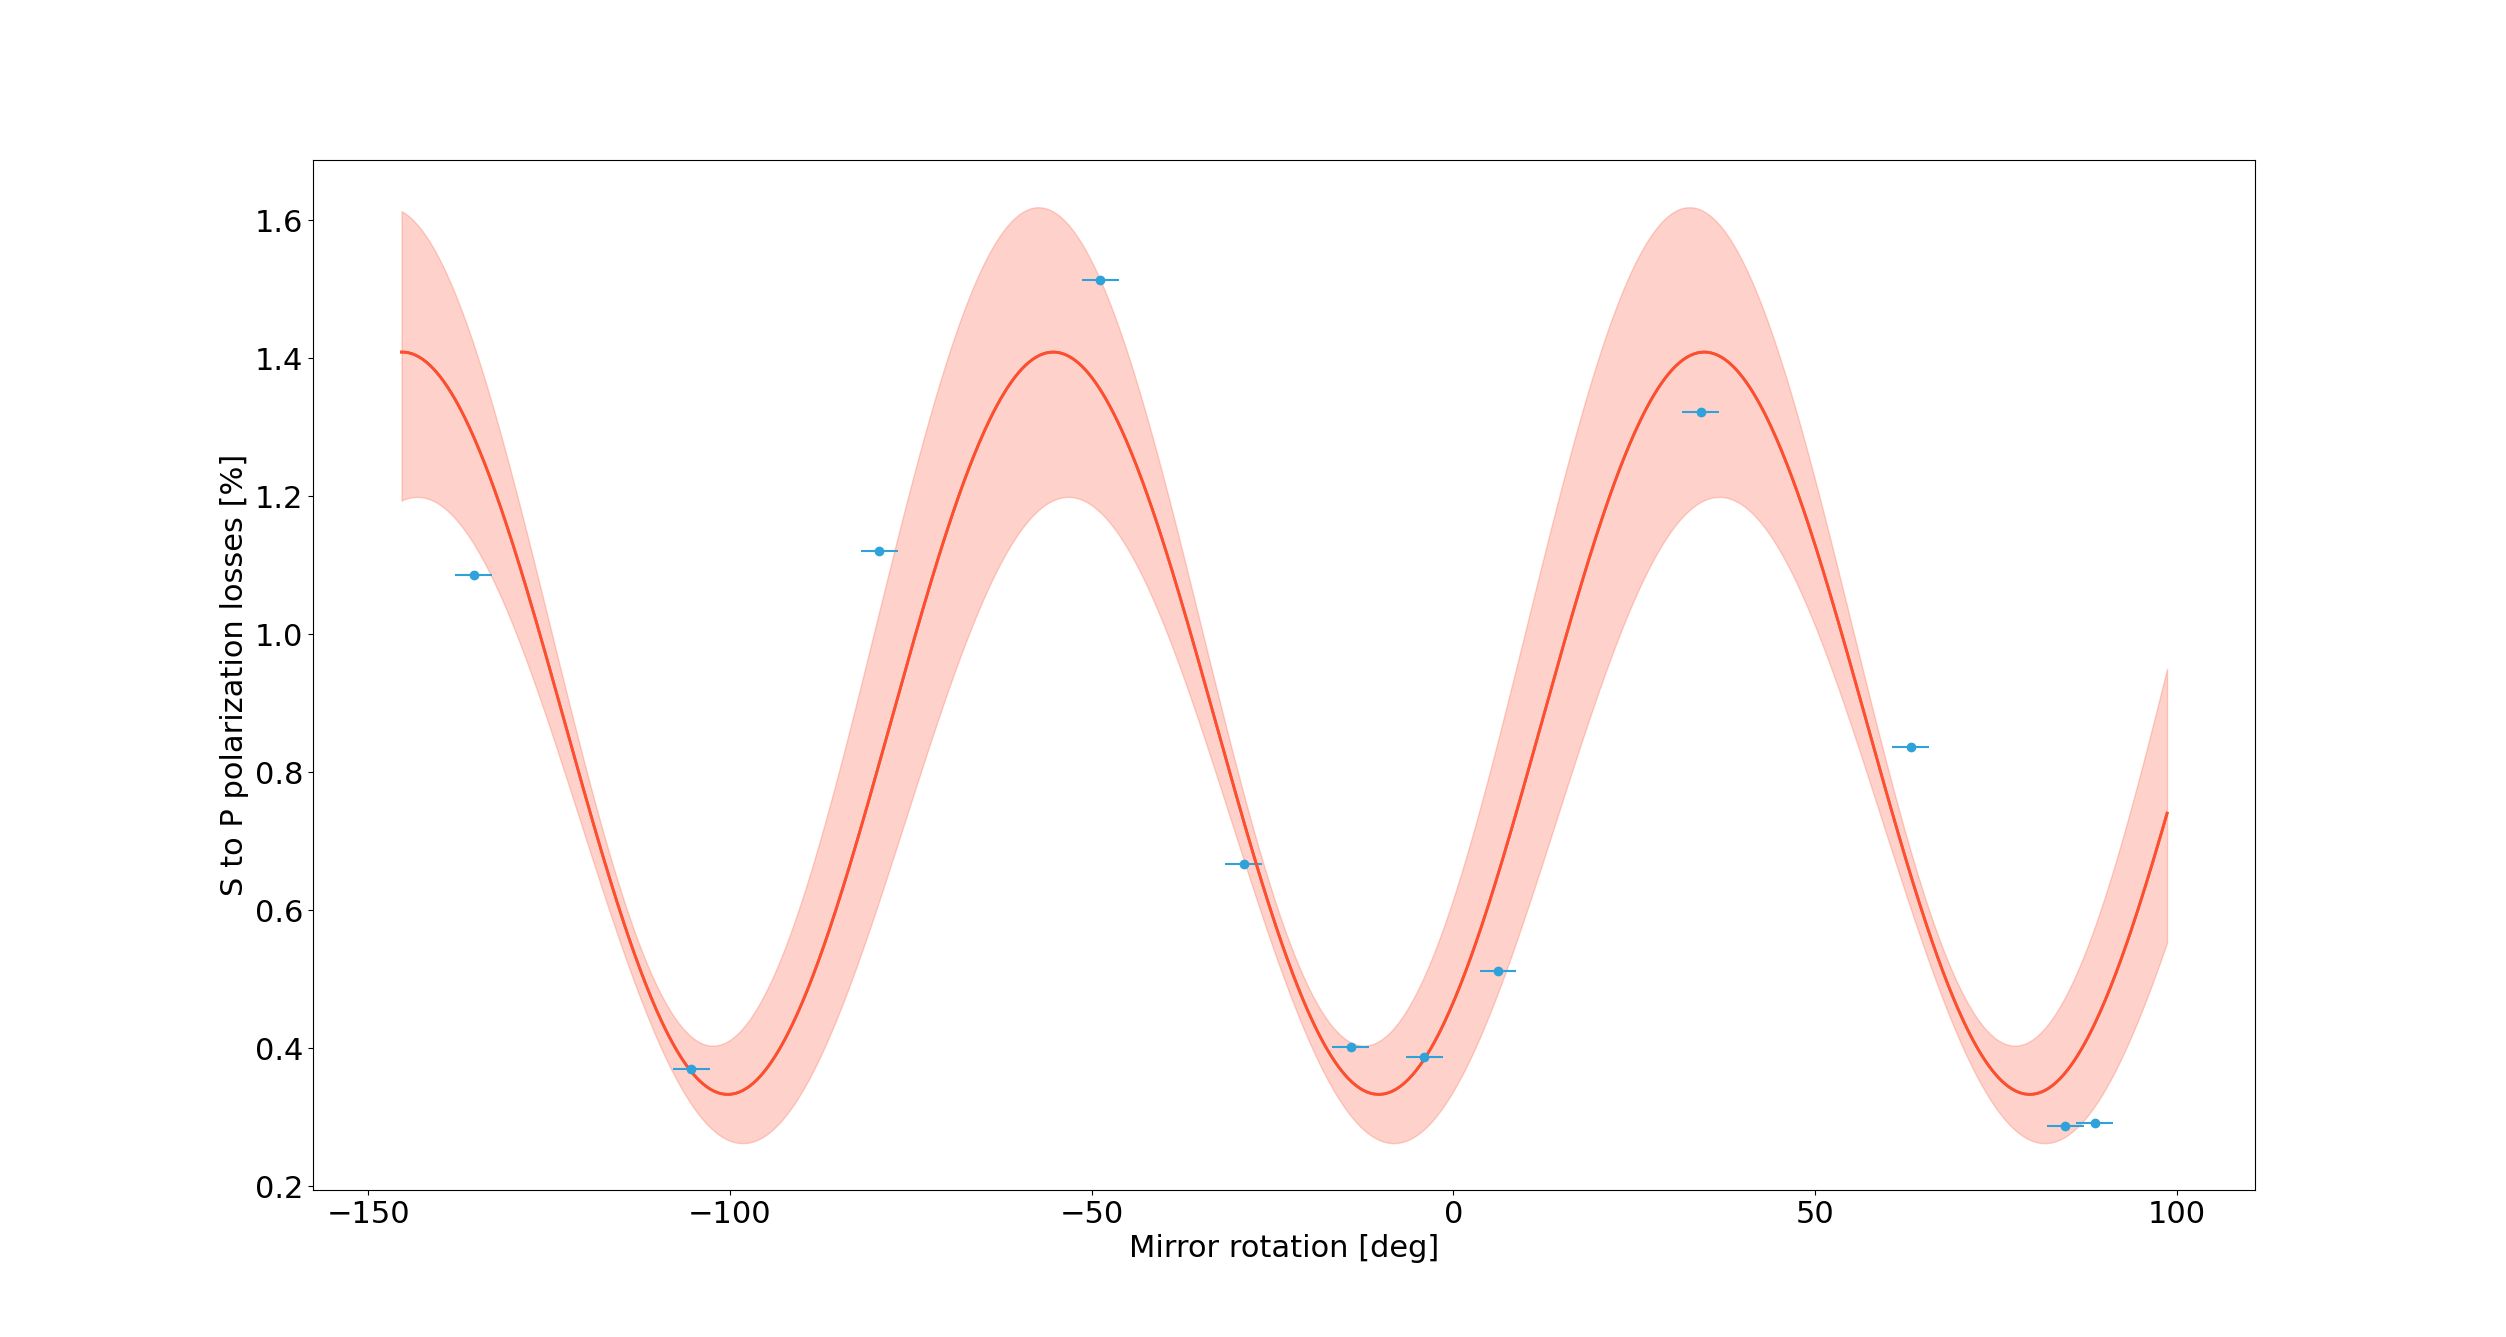
We performed large rotation of the mirror while injecting s polarization and results are reported in the attached figure.
We estimated the rotation angle by measuring the arc length between each rotation. The errorbar comes from uncertainty in this estimation (+/-5 mm).
We measured the Ip and Is intensities at the center of the mirror.
We found out that we have, as expected, a 90 degrees periodicity in the minimum of Ip (or equivalently the s to p polarization losses).
Furthermore, it seems that a +90 degrees rotation (+ means clockwise rotation from the laser side), gave better results than around 0 degrees.
We started measurement at this position that are attached in the following figures.
They show the only small improvement on the losses but this might be due to the remaining theta.
The mean theta at the center position is -2.09 deg.

Marc, Michael, Yuhang
Today we finished the cleaning of #5 and the 1.5 inch sapphire.
Then, we tried to fine tune the rotation angle of the mirror.
This time, we placed a flexible ruler on the mirror and could precisely (+/-0.2 mm) estimate the arc length of the rotation.
The results are attached in figure 1.
Actually I made a mistake and rotated the HWP by +0.7 deg before this measurement so we need to add this value to the effective rotation of the mirror.
Note that for some points the mirror was a bit tilted which creates stronger coupling between s and p polarizations.
That's why we repeated measurements at some rotation angle.
We started measurement at -2.9 deg rotation with HWP = 0 deg.
In the end, before starting polarization measurement, we checked the HWP position that minimized the Ip power to be +0.8 deg.
We did measurement with input polarization angles of 0 deg, 15 deg and 30 deg.
We computed delta n and theta from them.
Especially, we found that theta = 1.6 deg in the center of the mirror.
This is exactly the value we expected from the HWP rotation angle.
We will use this rotation of the mirror for the polishing.
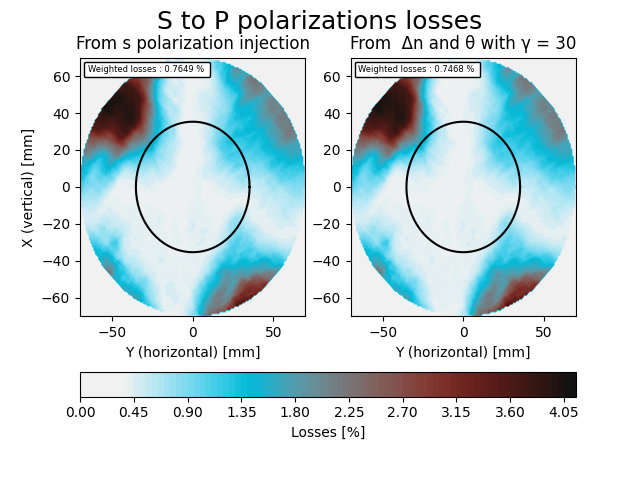
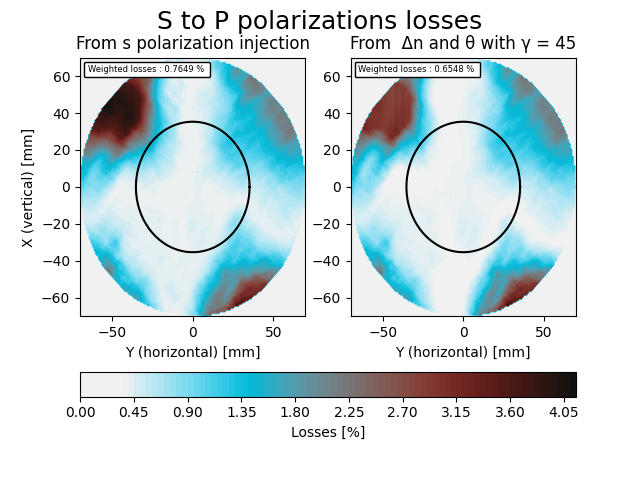
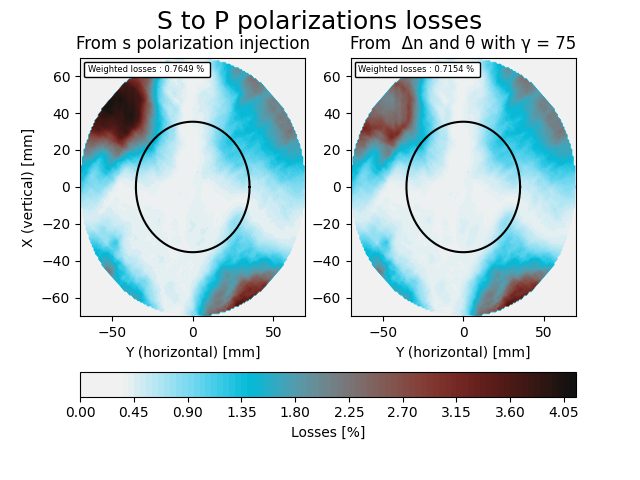
There is a little discrepancy between the 2 ways we compute the s to p polarization losses.
One possible explanation could be that we were using the mean of theta and delta n from 7 measurements during about 5 days.
It is quite probable that alignment condition or translation stage position slightly drifted between each measurements making this mean value a bit different with some sharp features.
I attach to this entry the comparison between the direct estimation of losses and the delta n and theta computed for each input polarization angle.
There is no sharp feature anymore and we have better agreement between the 2 estimations !

Here is a set of data points measured for generated green power versus thermistor resistance. The PDH lock was optimised at each temperature change. Note that only about 200 µW of infrared is sent to the OPO. The gap was just due to a note taking error, so we will fill out the rest of the points soon.