NAOJ GW Elog Logbook 3.2

Marc, Michael
We restarted standalone and realigned the readout part of every oplevs.
Then, we could perform the healthcheck without issues.
All coils excitation show some good coherence with the oplev so it seems that the magnets are still present and working properly.
[Shalika, Marc-san]
This elog covers details of the ongoing tests of the LC.
Details:
In the previous test, the fast axis of LC was at 90°. We saw a drift from the expected characteristic for <10V. Although the LC behaves as expected at >10V.
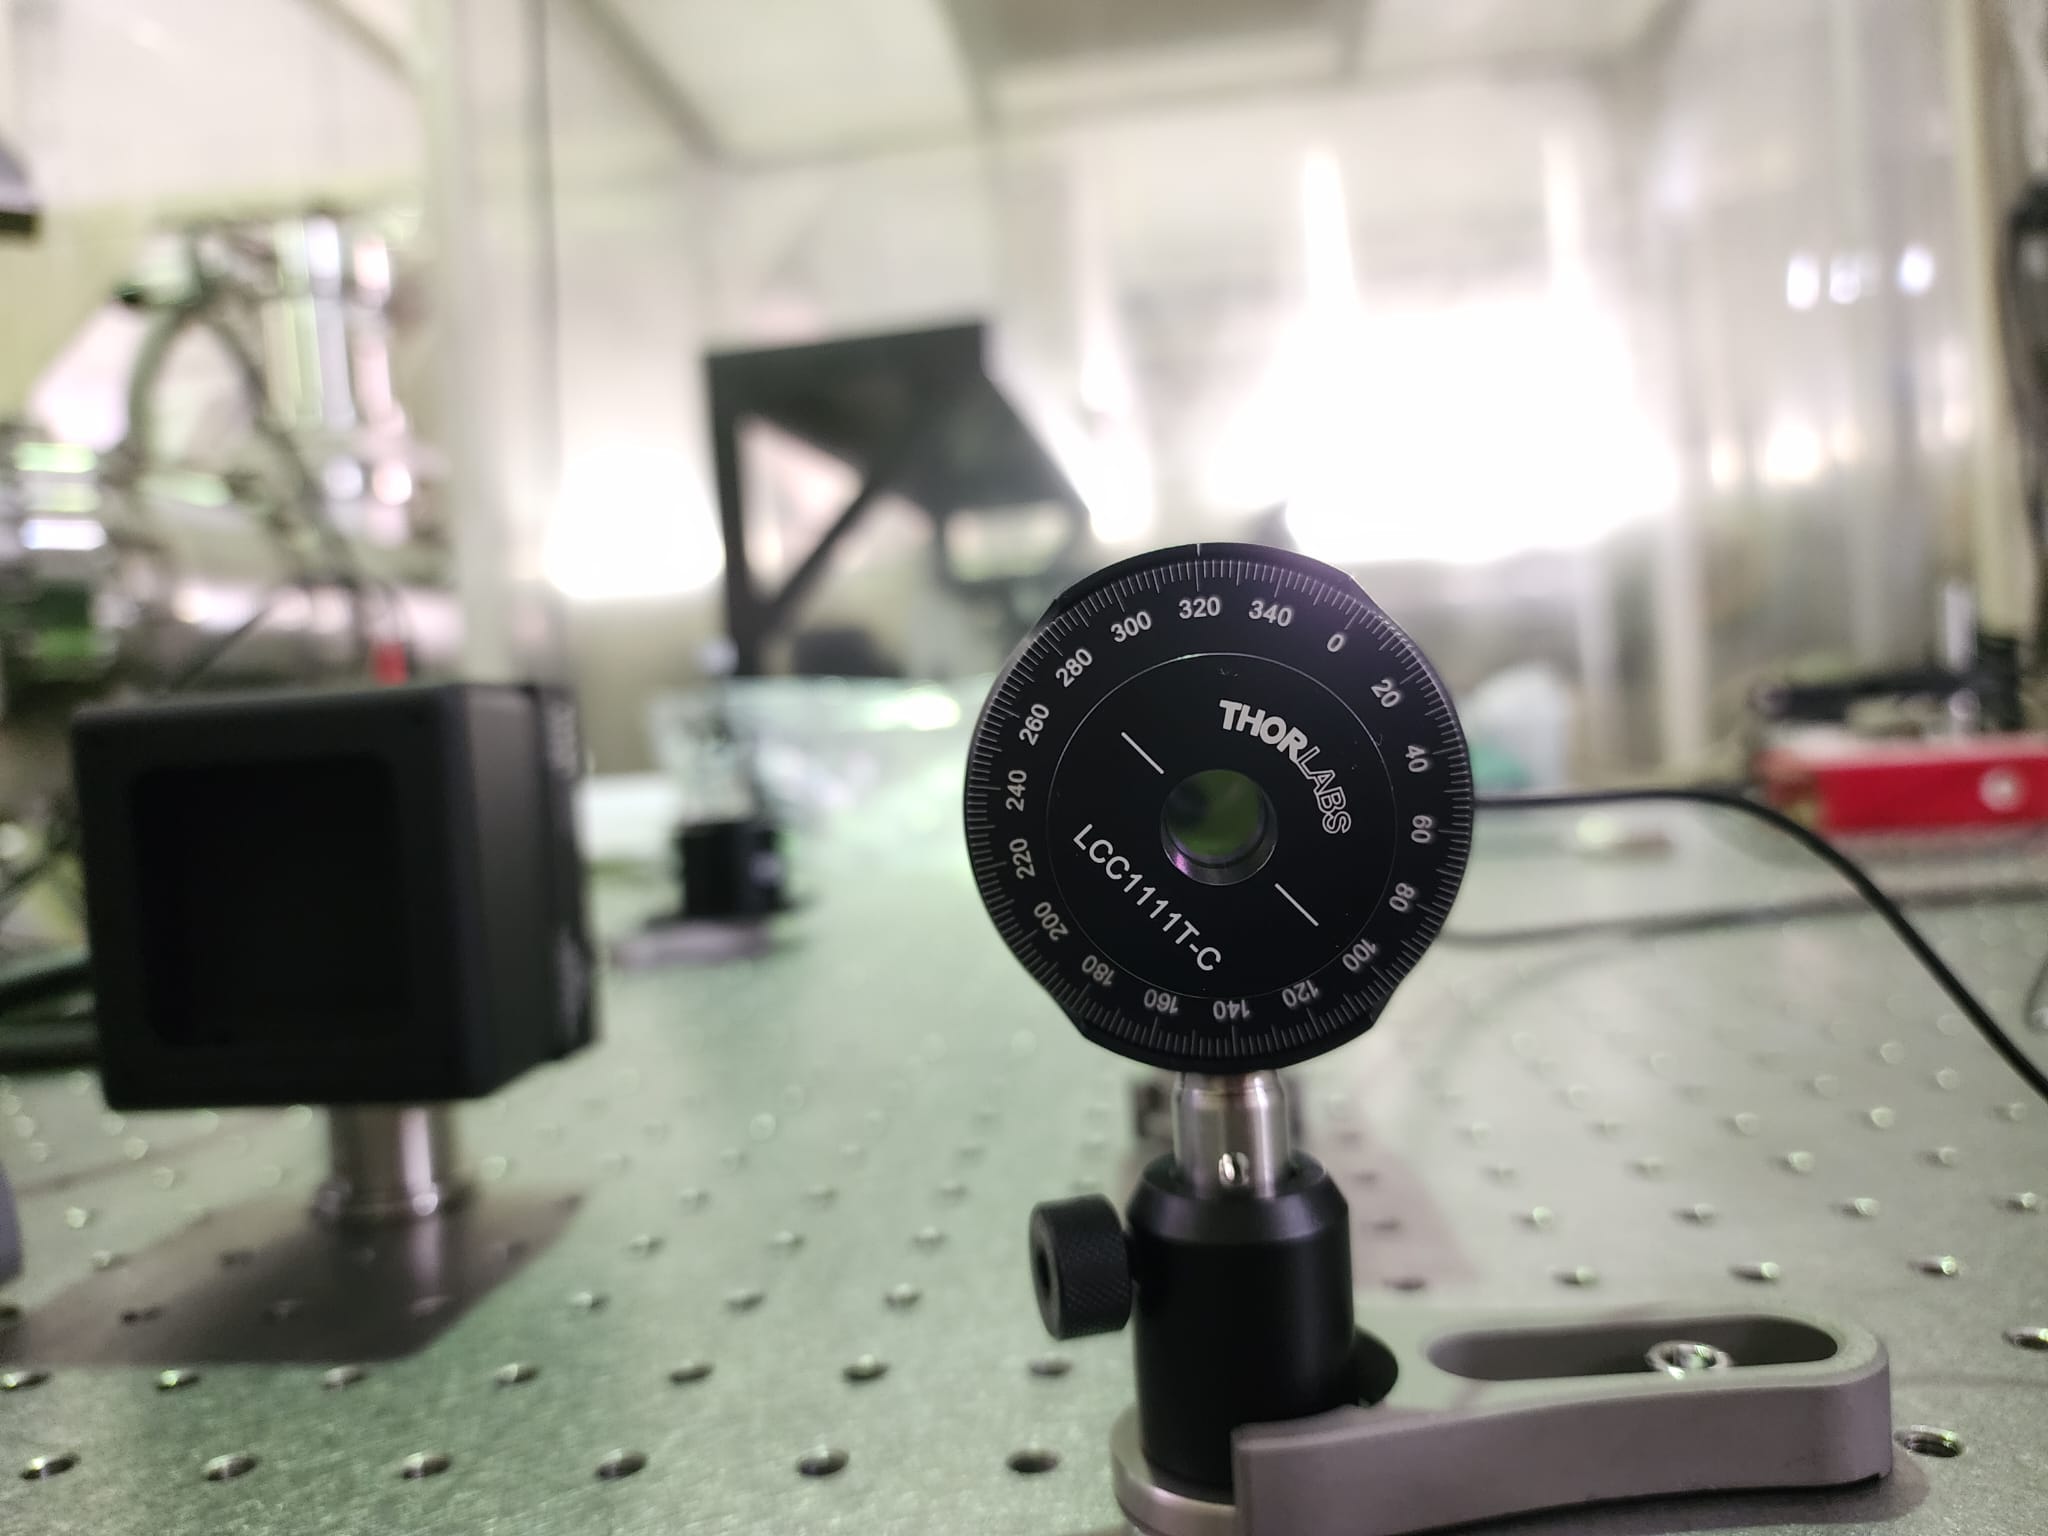
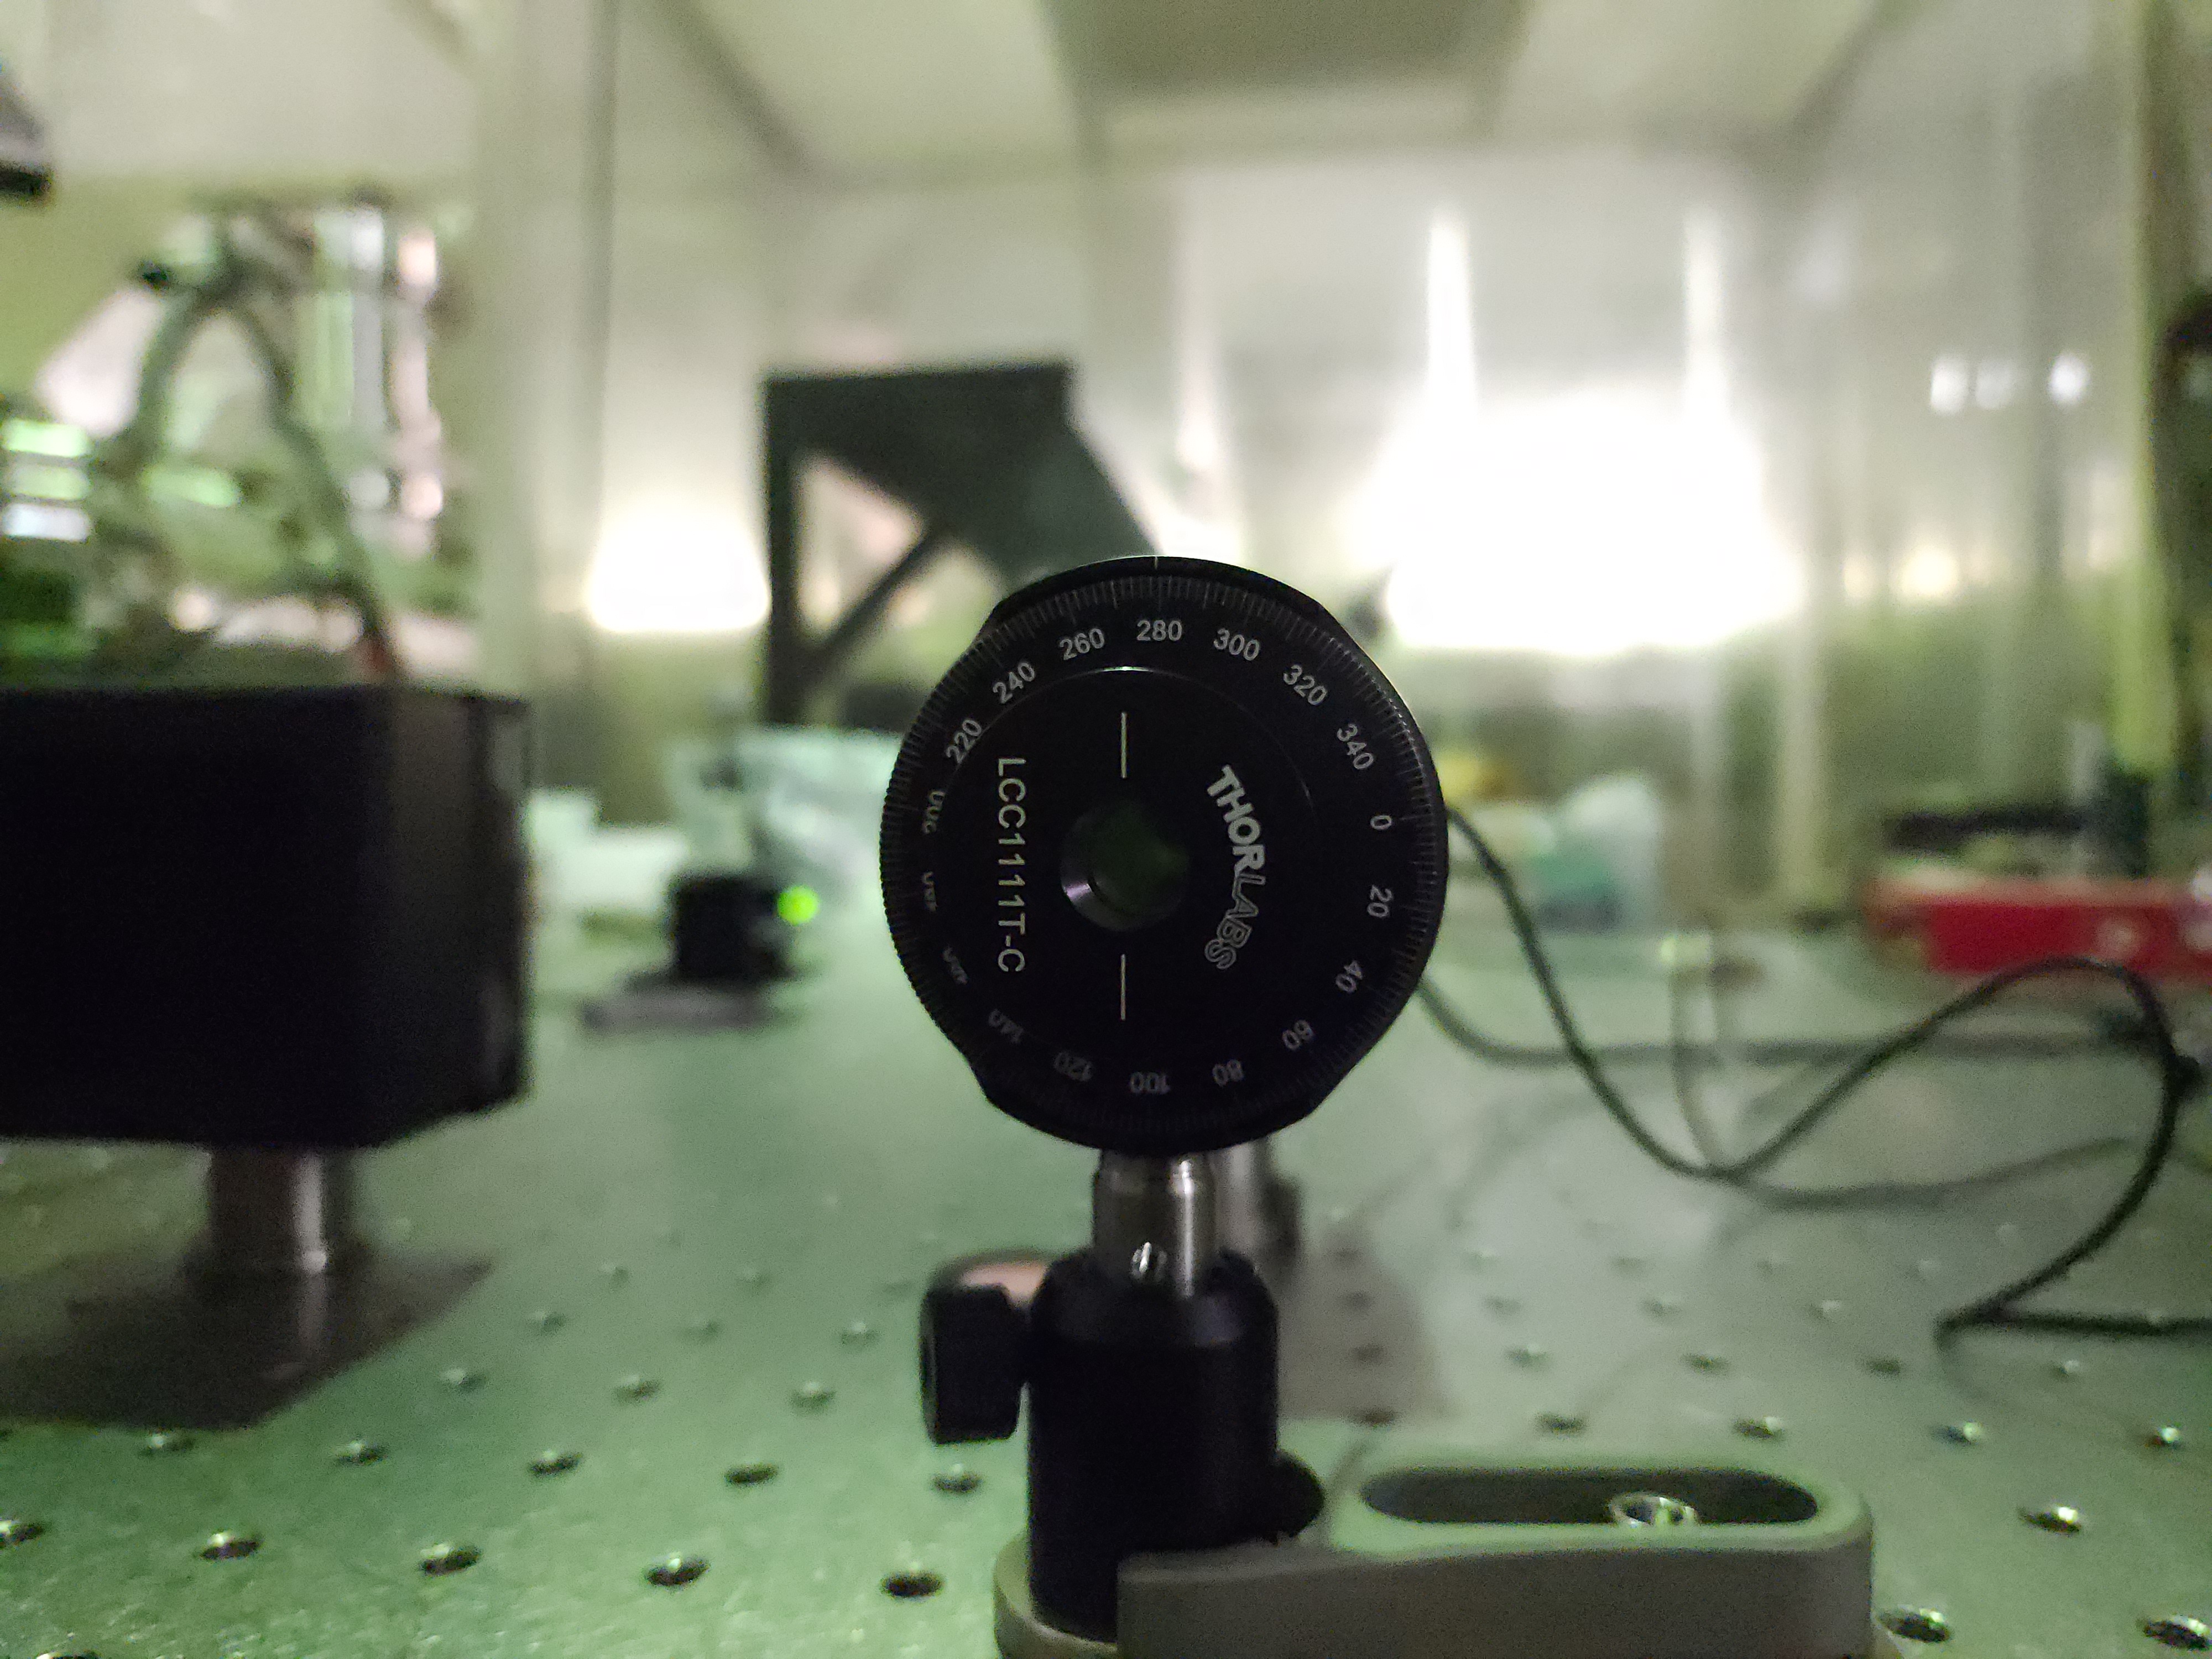
We changed the orientation of the fast axis was changed to ~45°(Fig 1) to understand if this issue continues.
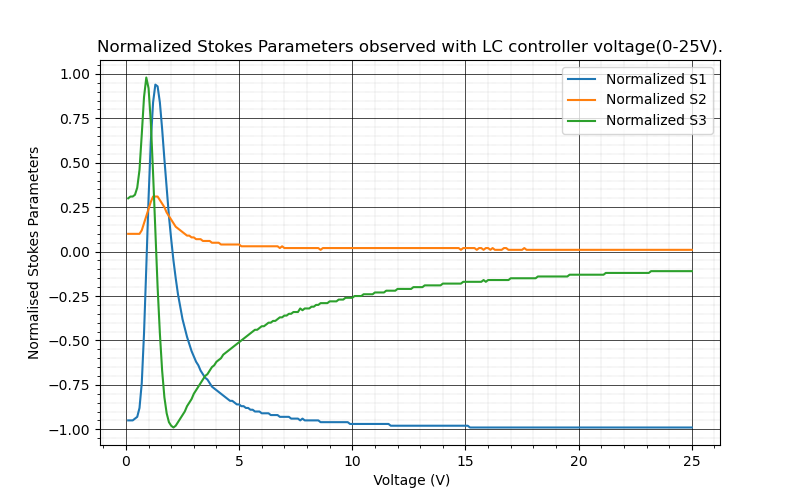
a. The LC voltage controller's RMS voltage was varied from 0.1V to 25 V and was swept with a step size of 0.1V and step duration of 2s.
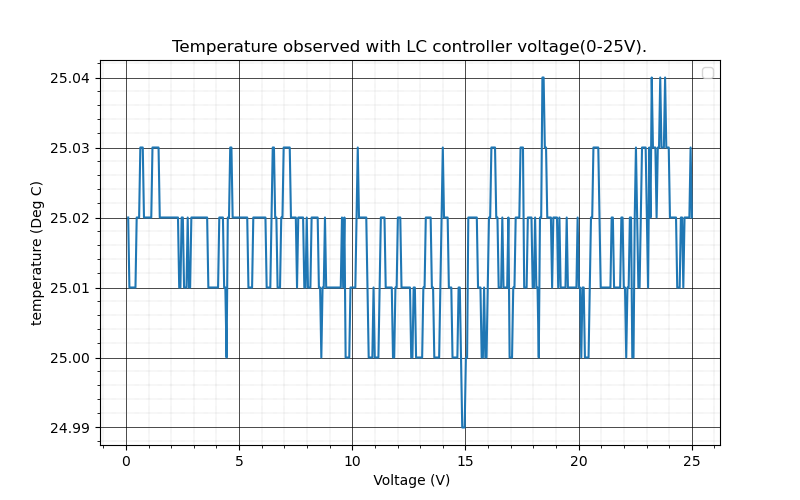
b. The LC temperature was observed to be fairly constant at 25±0.04ºC and is shown in Fig 2.
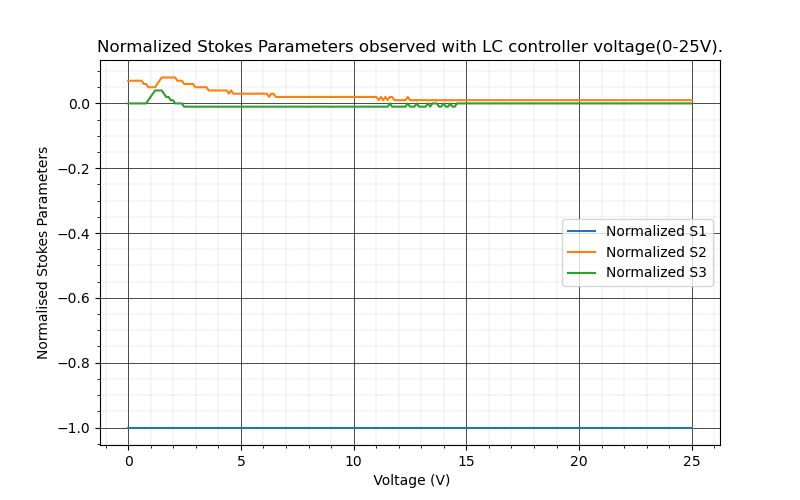
c. The Normalized Stokes Parameter was observed as shown in Fig.3
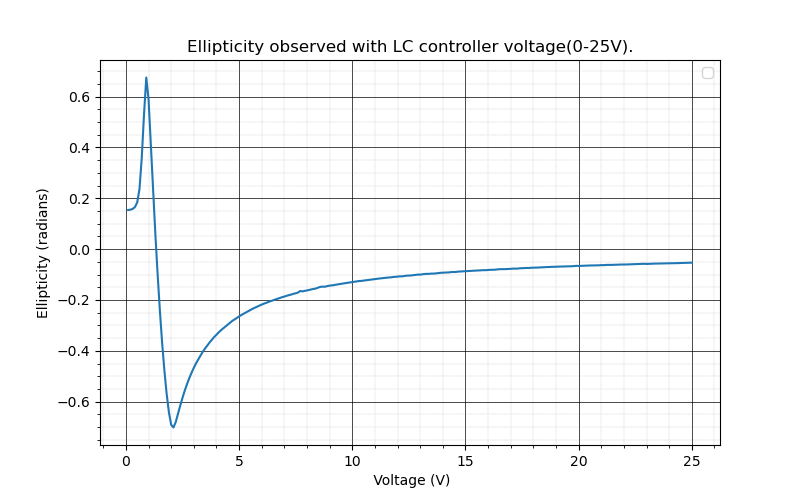
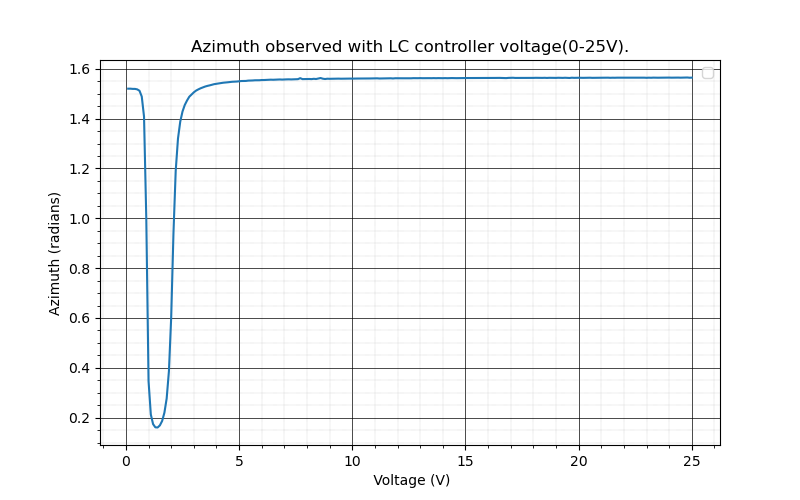
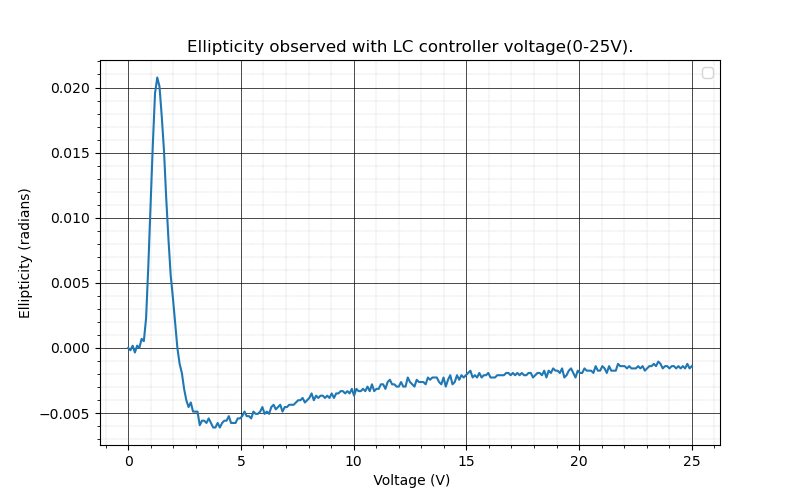
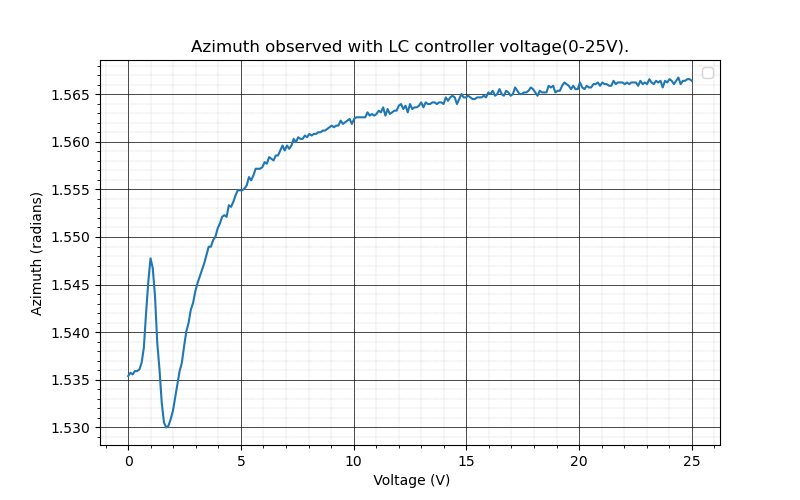
d. The Ellipiticty and Azimuth varying with varying voltage were observed as shown in Fig.4 and Fig 5 respectively.
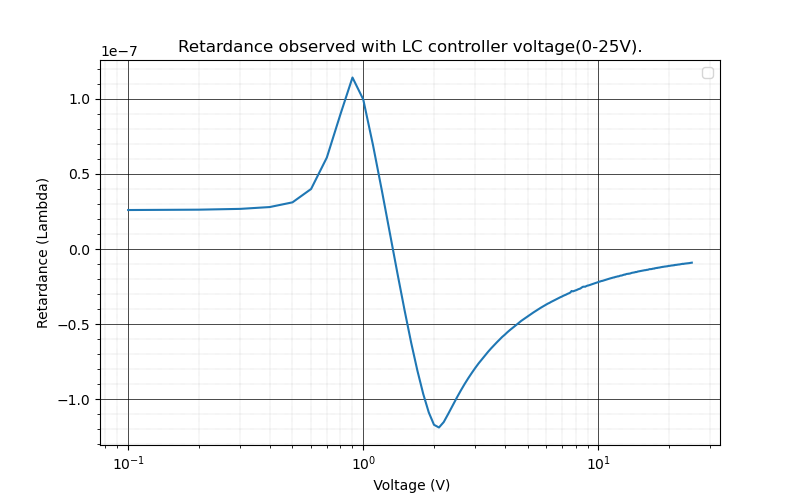
e. The calculated retardance is shown in Fig 6.
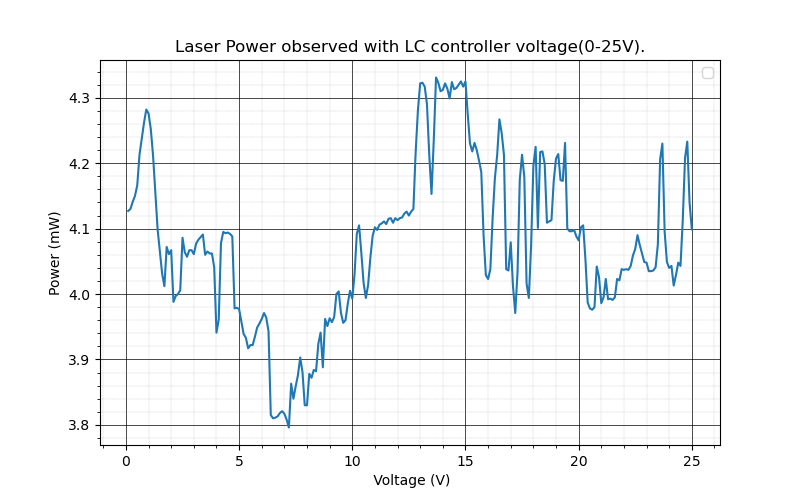
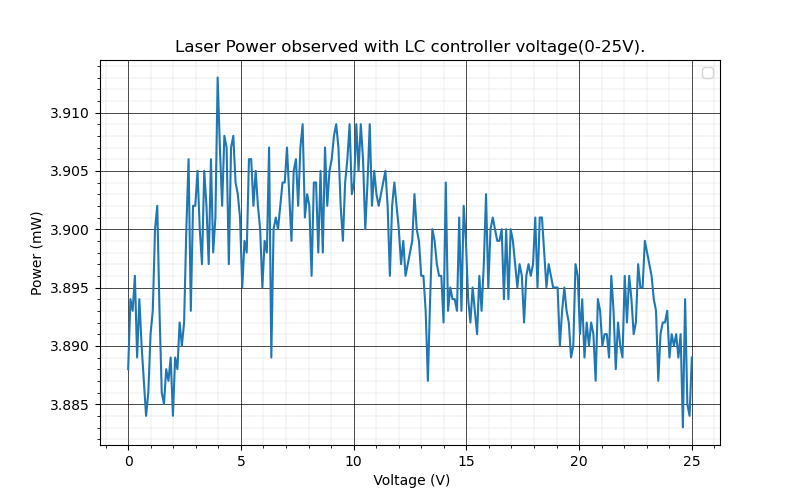
e. The laser power observed using the camera is shown in Fig. 7.
Next Step:
Try to understand why at low voltages(<10V) the LC drifts from its expected characteristics. We might have incorrectly set some parameters of LC when using the LC voltage or temperature controller.
[Shalika, Mitsuhashi-san]
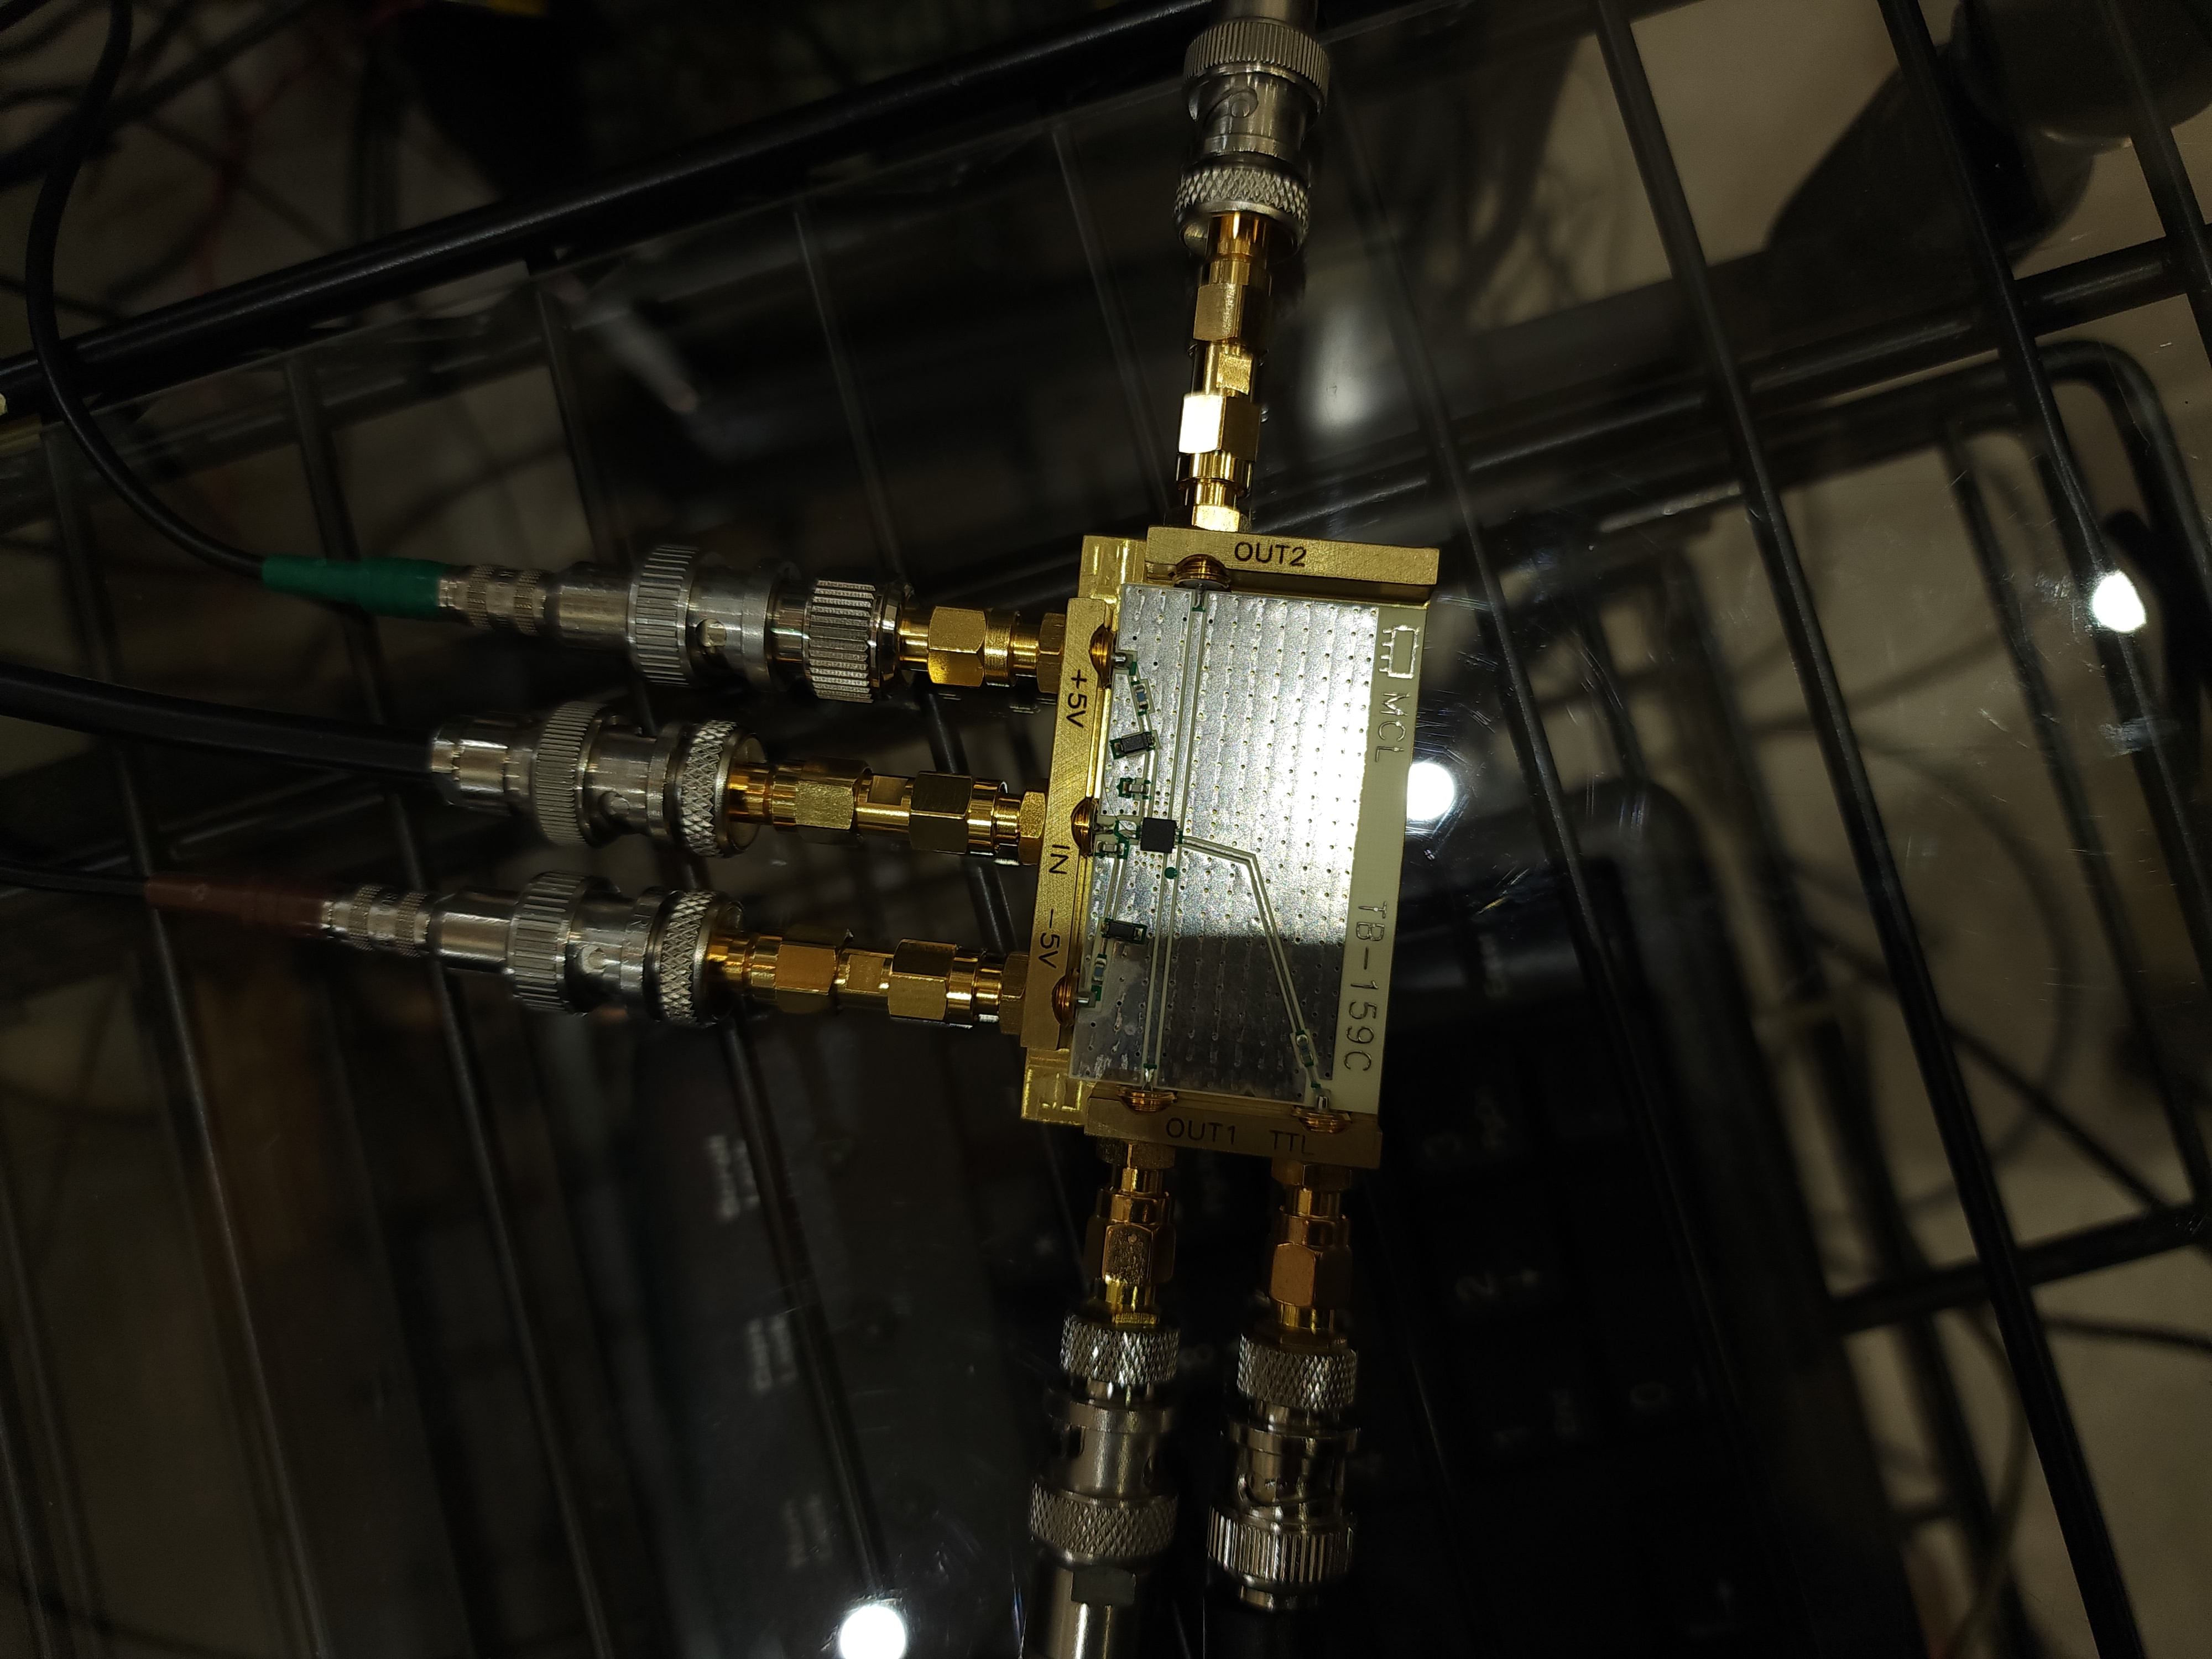
This elog is about connecting the RF switch (Fig 1). In continuation to the experiment in elog, we realized that an RF switch is essential for the ringdown measurement.
Details:
1. We first made sure that we had the correct supply of +5V and -5V using a multimeter.
2. We then supplied a square wave of frequency 1Hz and 3 V amplitude to the TTL, using a function generator. The square wave signal was ensured with the use of an oscilloscope.
3. The analog input which was previously supplied to the RF driver (for AOM) was connected to the input of the RF switch.
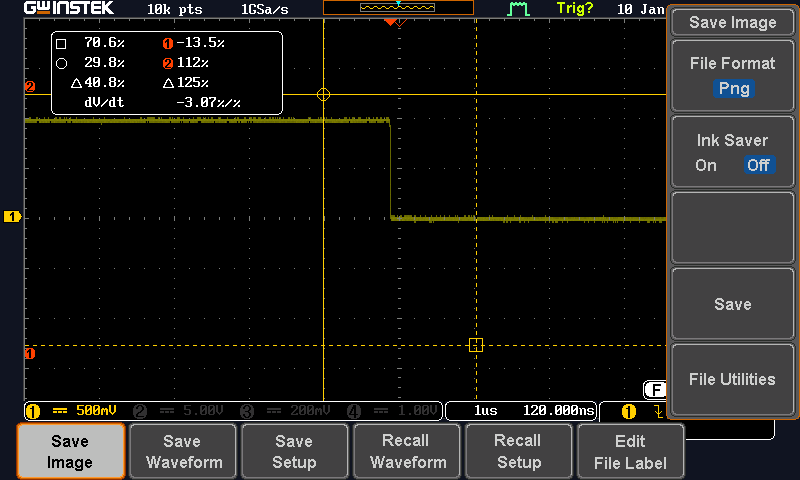
4. The output of the RF switch when the input is switched off is shown in Fig 2.
Next Step:
1. Toggle the voltage of TTL for better shutdown for AOM.
2. Connect the output of the RF switch to the RF driver of AOM.
3. We test the response of photodiodes and select the better one for ringdown measurement.
[Shalika, Mitsuhashi-san]
In continuation to the ongoing ringdown measurement, this elog covers tests of the photodiode to be used at the transmitted beam path. We suspect that the ringdown measurement is not accurate because of absence of RF switch and an unsuitable PD.
We tested the decay time of two PDs after shutting down the AOM.
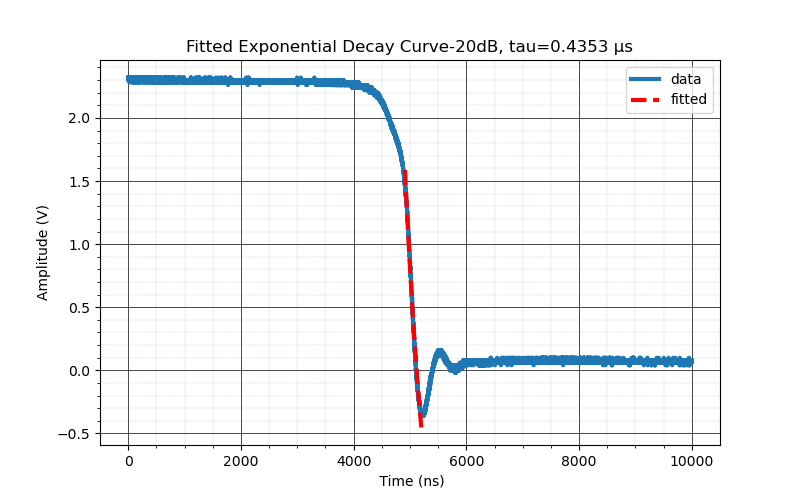
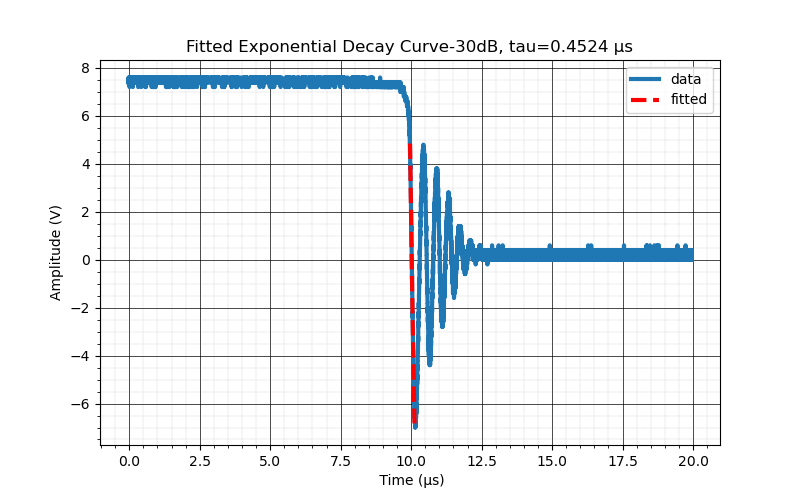
1. PDA20CS-EC --(this is the one that was initially installed. We suspect we should change this with PD in 2)
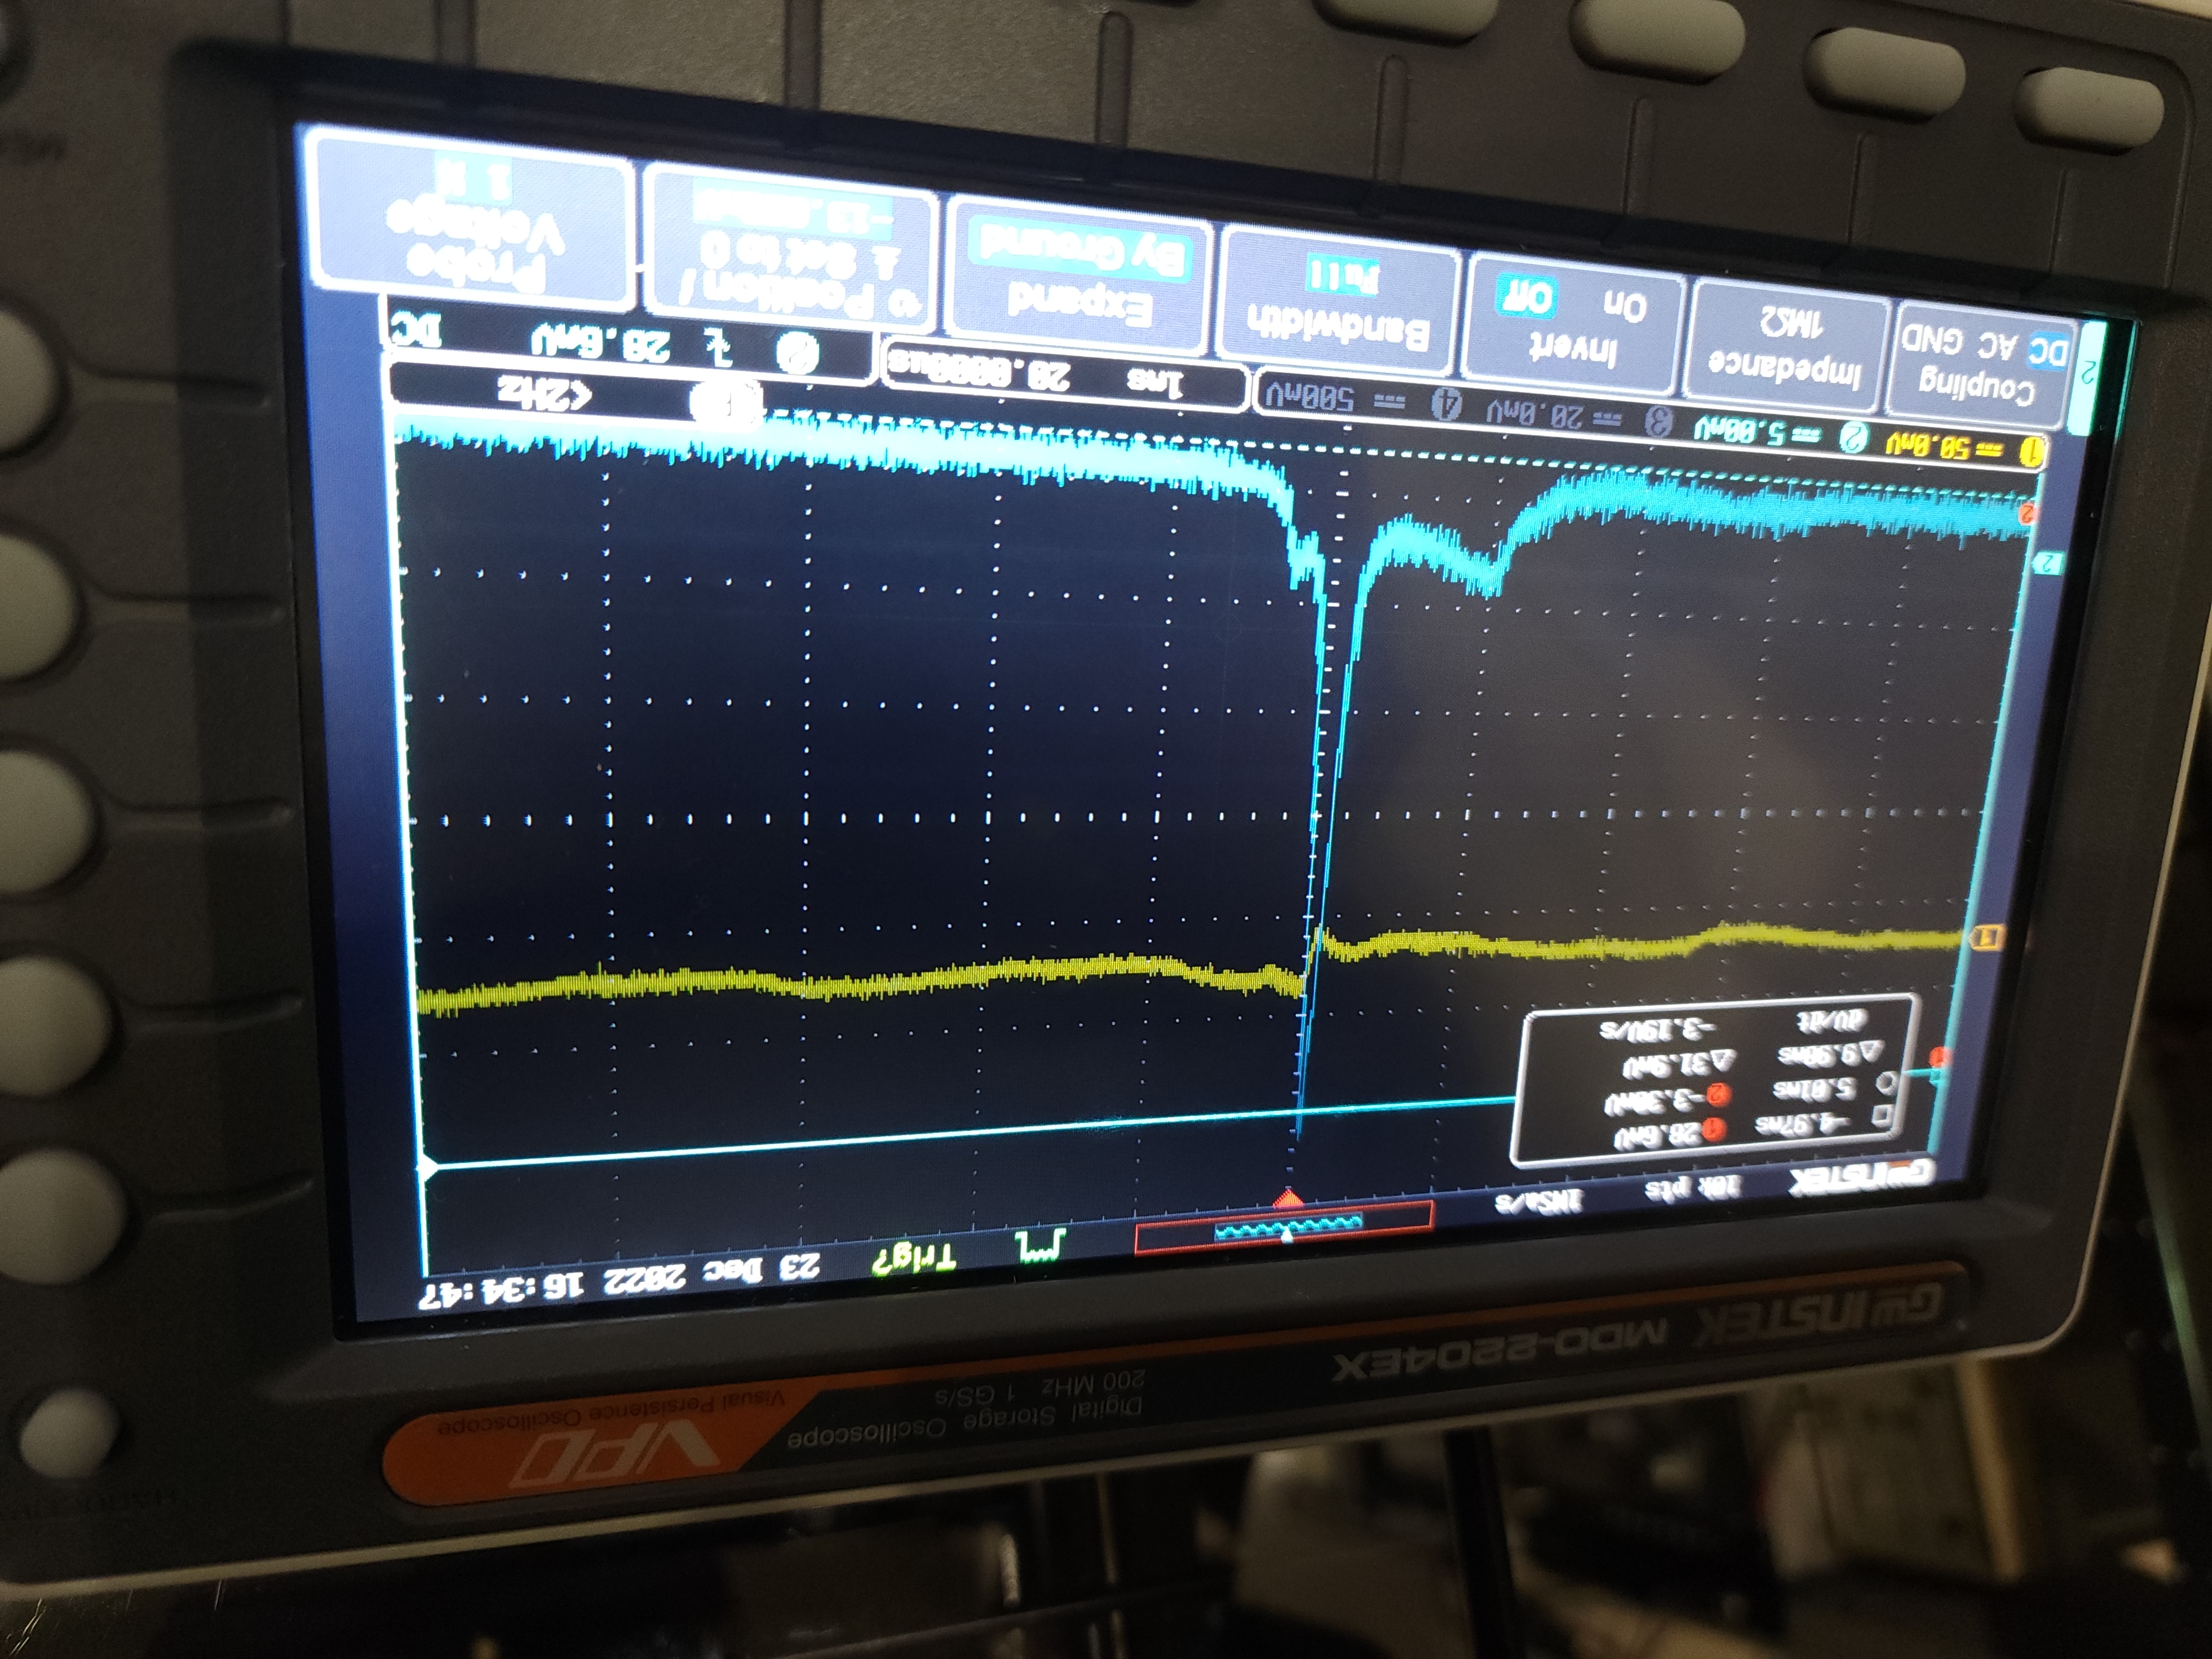
a. The decay time for the 20dB gain setting is 0.4 µs (Fig. 1)
b. The decay time for the 30dB gain setting is 0.4 µs (Fig. 2)
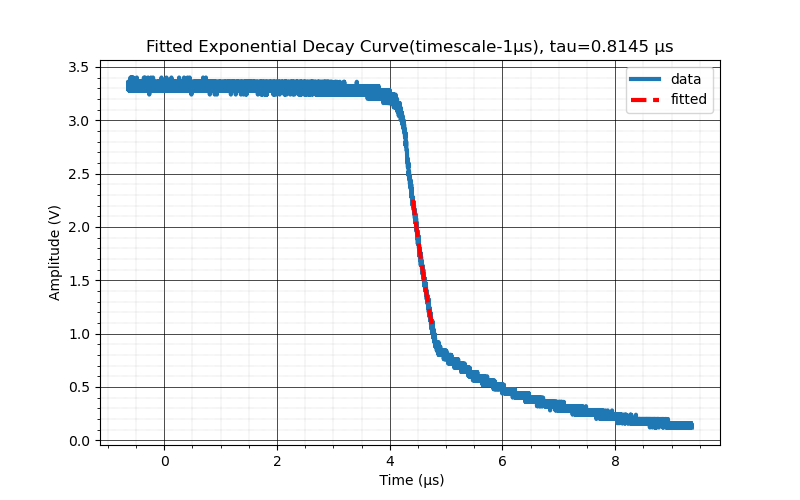
2. PDA05CF2
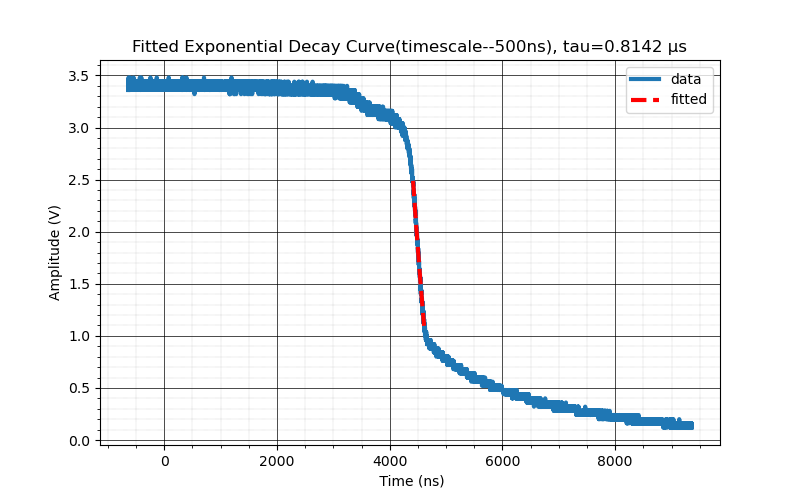
a. The decay time (oscilloscope time scale as 1µs) is 0.8 µs (Fig. 3)
a. The decay time (oscilloscope time scale as 500 ns) is 0.8 µs (Fig. 4)
It seems this is very close to the previous ringdown time estimated by us (0.9 µs) and the above-measured time is not accurate for both PDs. We realize it might be happening because we don't have an RF switch installed yet.
Next Step:
We will install the RF switch between the RF driver and AOM, and observe the PD responses again.
Notes:
1. We brought RF switch from ATC clean room to ATC cryogenic room, today.
2. I have brought a mulitmeter from electrical shop to ATC.
This elog covers the testing of Liquid crystal(from here on referred to as LC) (LC1111T-C). In continuation to ongoing work in elog.
1. Observing changes in the linearly polarized laser passing through LC with change in voltage of the LC controller.
2. Testing stability of measurements for long-term measurement (6 hours in this study)
Details:
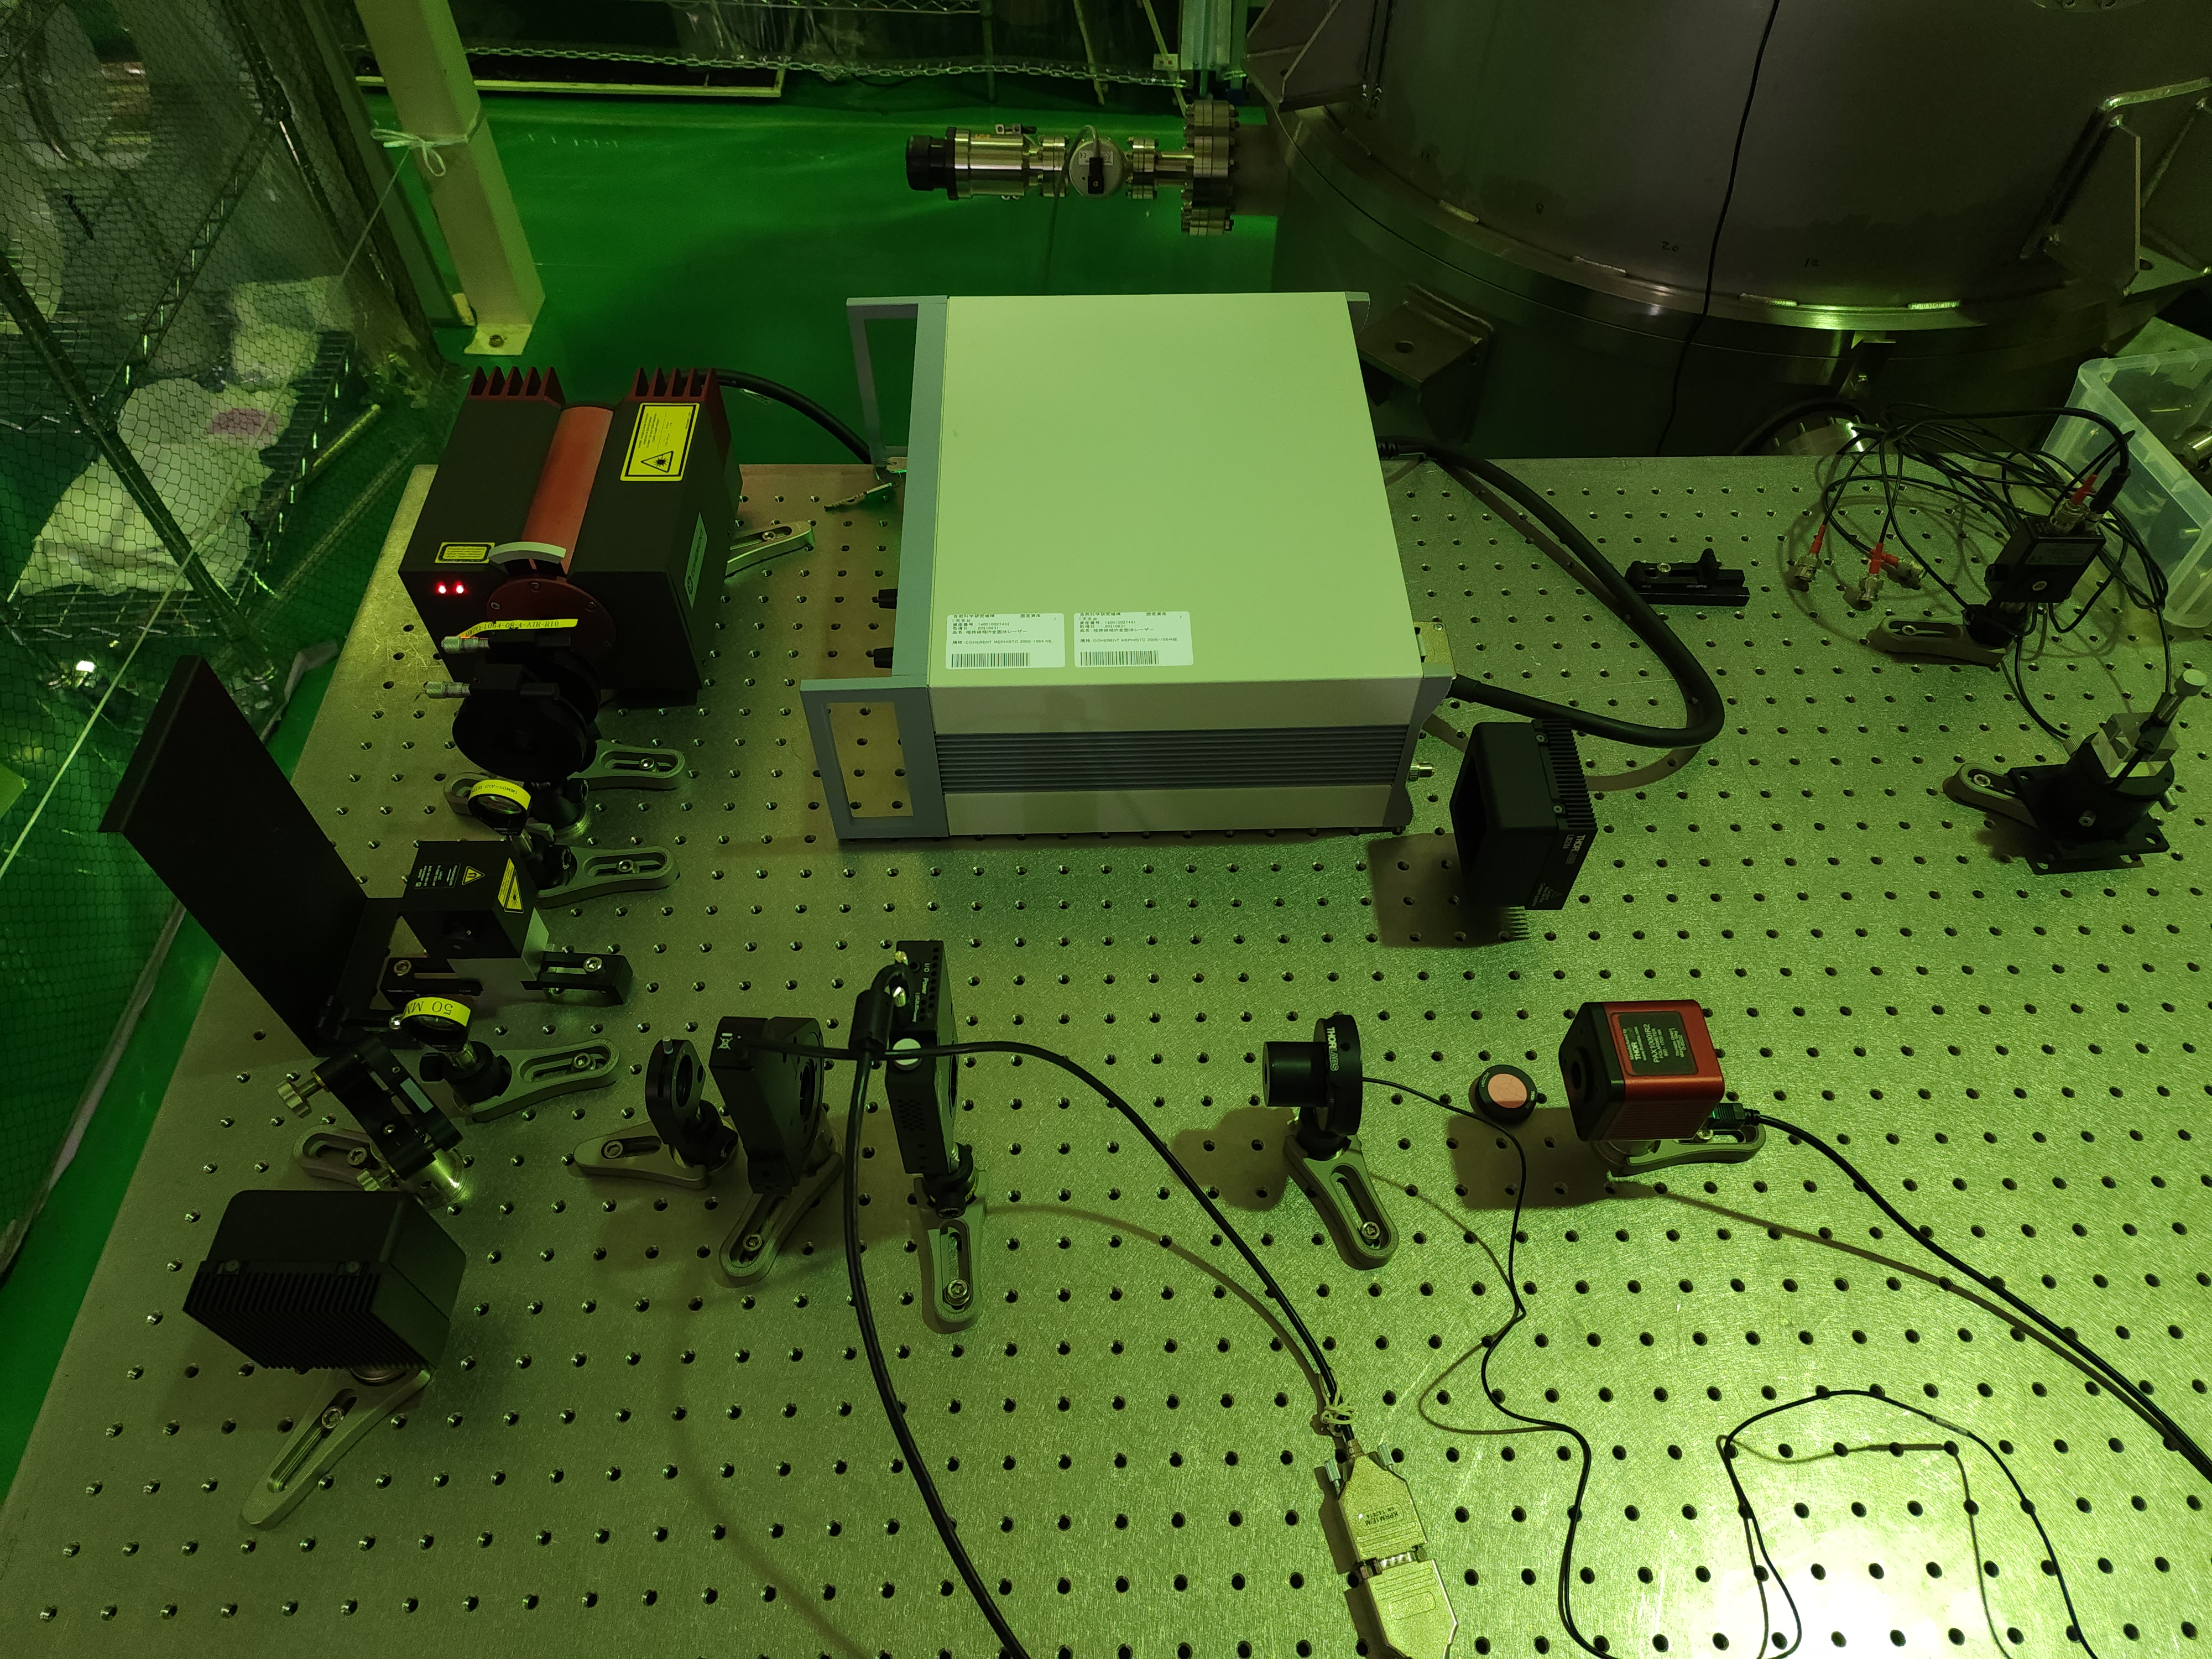
1. The setup is shown in Fig 1. The HWP and QWP placed were rotated such that the laser was linearly polarized. This was made sure with the use of the polarization camera. Then the LC was placed after them and the fast axis was rotated manually to make the laser linearly polarized again(see Fig 2, the white line on LC shows the slow axis). The LC was connected to the LC voltage controller and temperature controller. The LC expected characteristics from the datasheet are shown in Fig 3 and 4.
a. The LC voltage controller's voltage was varied from 0 to 25 V and was swept with a step size of 0.1V and step duration of 2s.
b. The temperature was observed to be fairly constant at 22.58±0.02ºC
c. The Normalized Stokes Parameter was observed as shown in Fig.5
d. The Ellipiticty and Azimuth varying with varying voltage were observed as shown in Fig.5 and Fig 7 respectively.
e. The laser power observed using the camera is shown in Fig. 8.
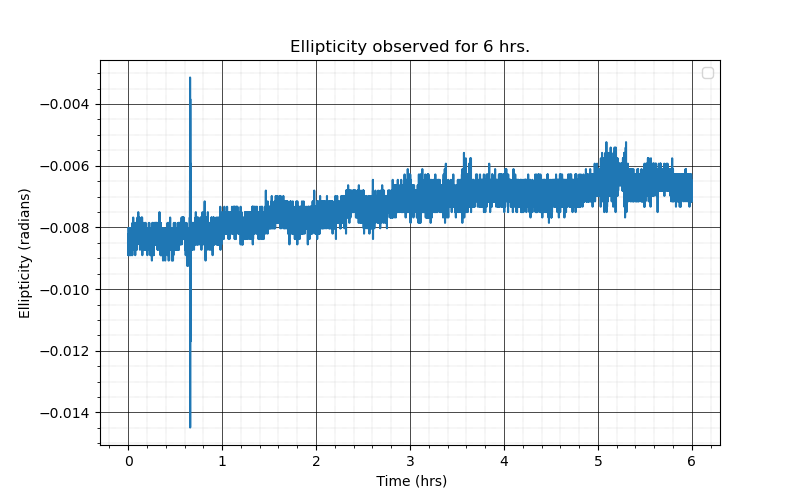
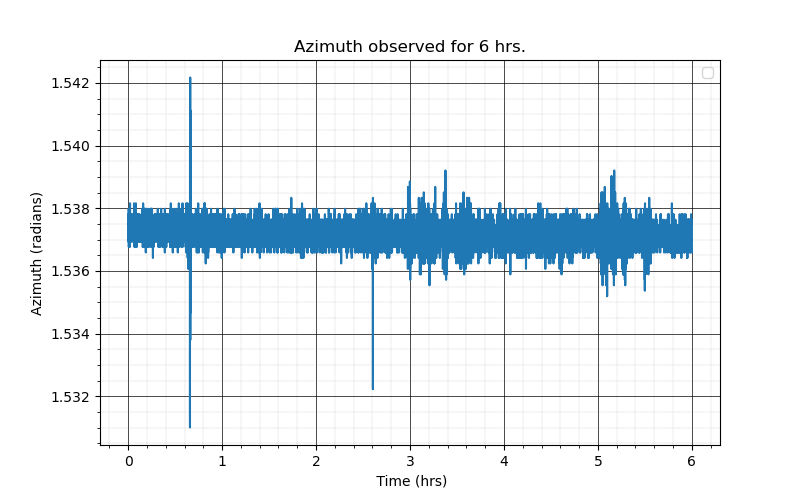
2. Since mirror characterization takes long hours we had to check if the LC would be durable for long operational hours. To study this, another measurement was taken for 6 hrs. In this case, no parameters were varied.
a. The LC voltage controller's voltage was set constant at 0V.
b. The temperature of the LC during the operation was 22.58ºC±0.3 and was fairly stable for 6hrs (varied from 22.58ºC(at the start), 22.83ºC( at 2.5hrs) to 22.49ºC(at the end))
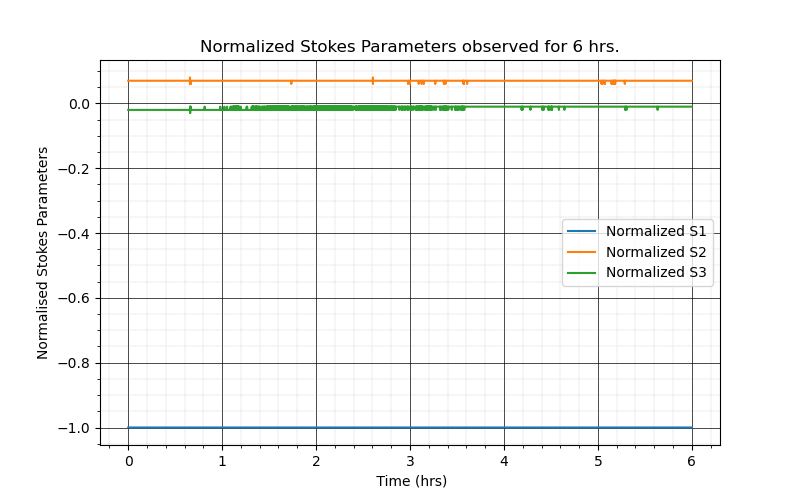
c. The Normalized Stokes Parameter was observed as shown in Fig.9
d. The Ellipiticty and Azimuth varying with varying voltage were observed as shown in Fig.12 and Fig 13 respectively.
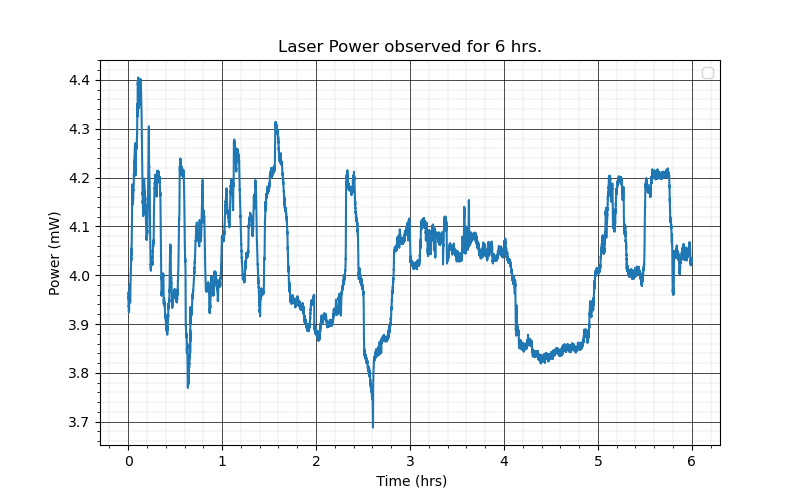
e. The laser power observed using the camera is shown in Fig. 14.
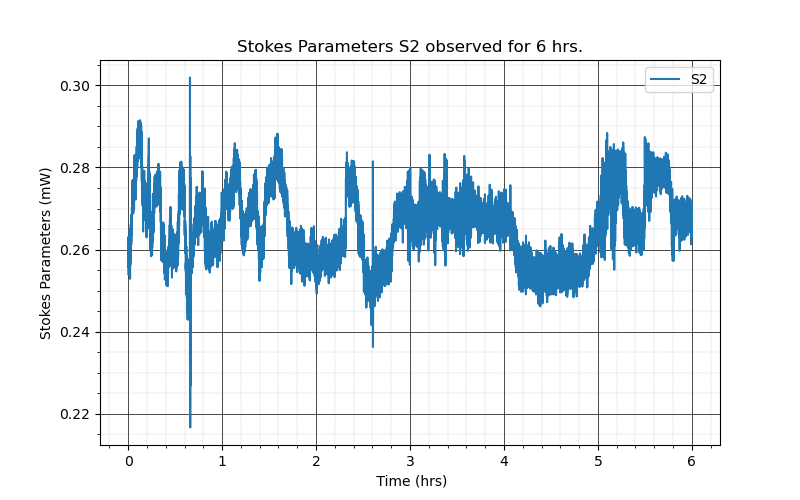
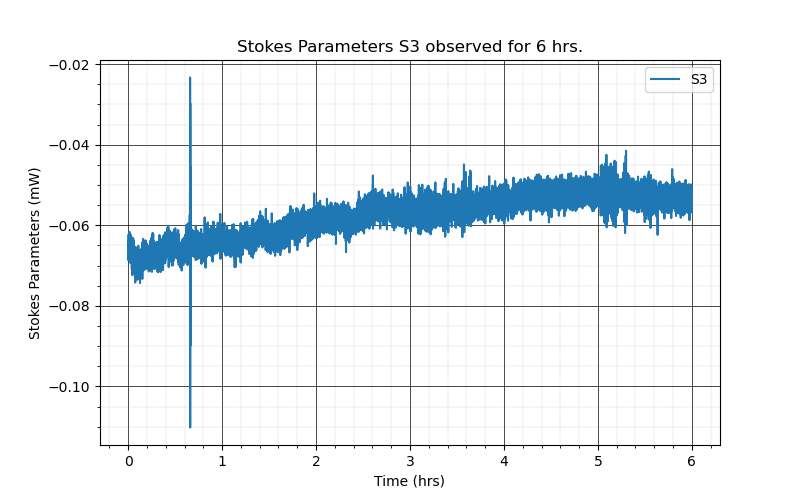
Although the parametres are seen to be constant enough during LTM, we will do this measurement again to investigate the peak observed in the ellipticity and azimuth since they appear at the same time. The same peak was also observed in stokes parameters S2 and S3(Fig 10,11). Interestingly, no such peak was observed in the laser power. It would be worth keeping an eye on the LC temperature for this.
Next Step:
1. 6hrs operation test with LC controller's voltage set at >0V.
2. Observe the temperature variation of the LC
For the PR I remembered that I should try and realign using the picomotors to bring the oplev output beam to within the actuation range of the steering mirror. This is actually a common problem but because I am not so good independently operating FC I forgot, so others not so familiar with FC operation who are reading this should also take note.
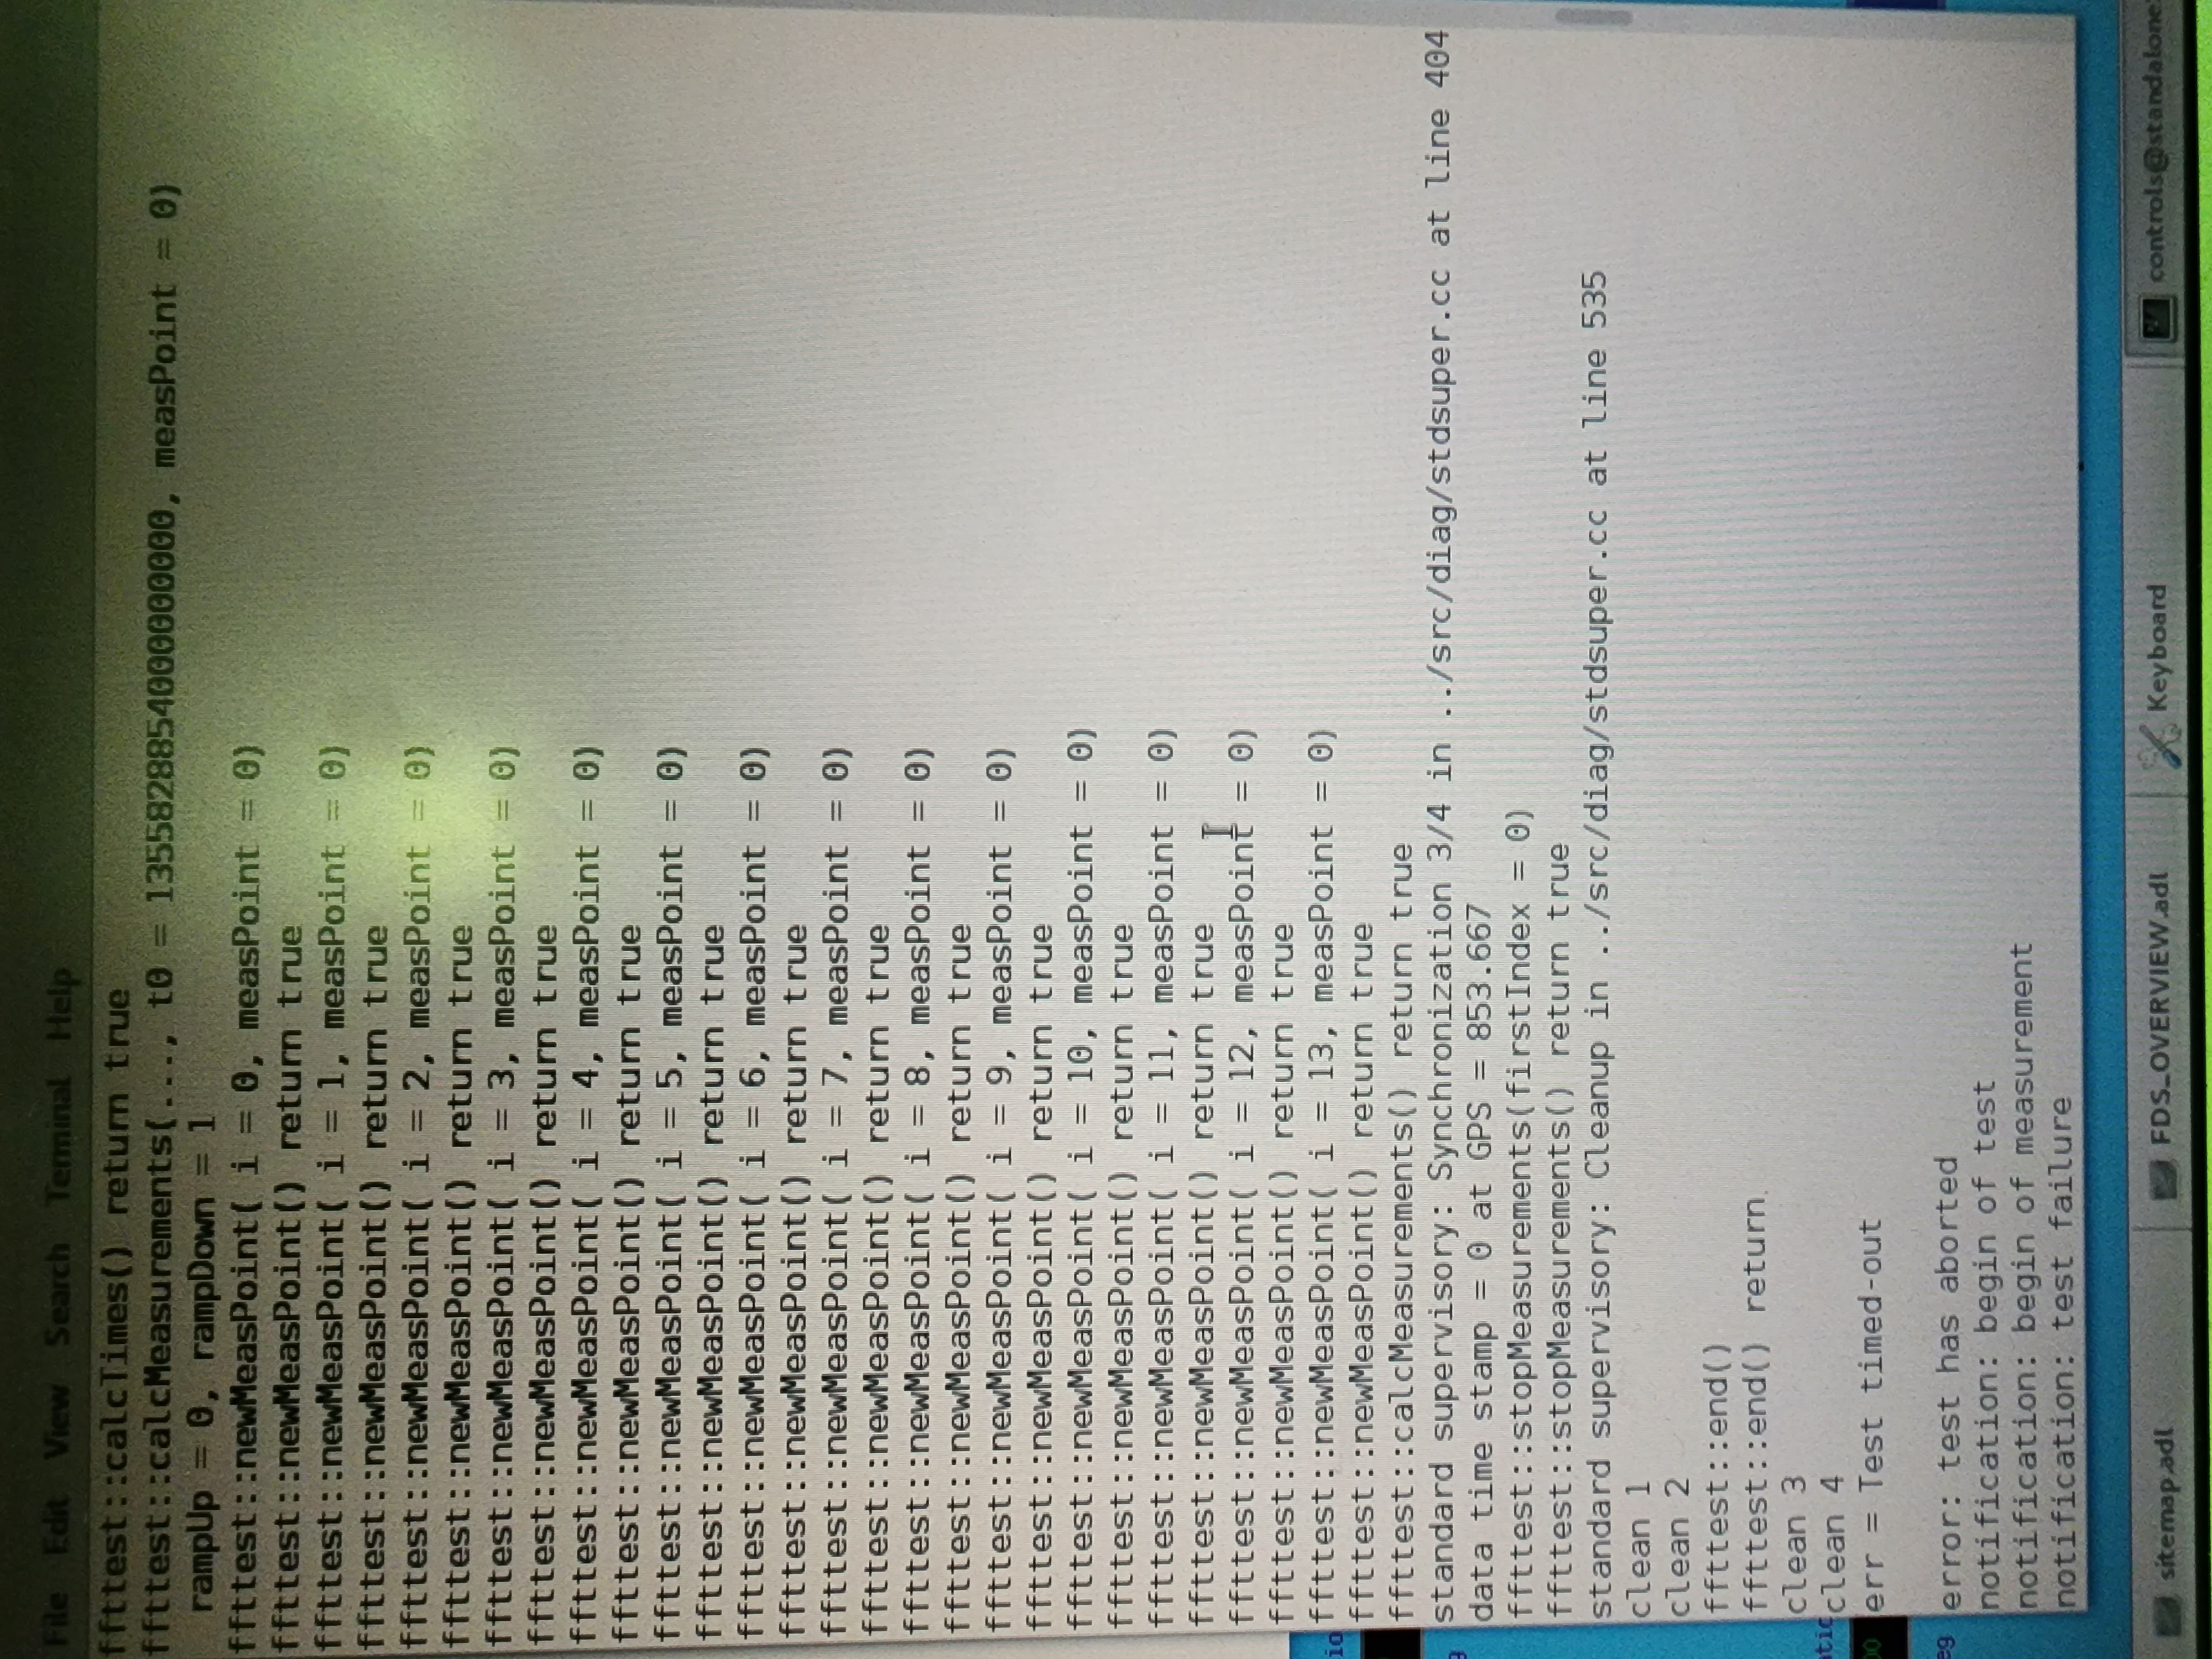
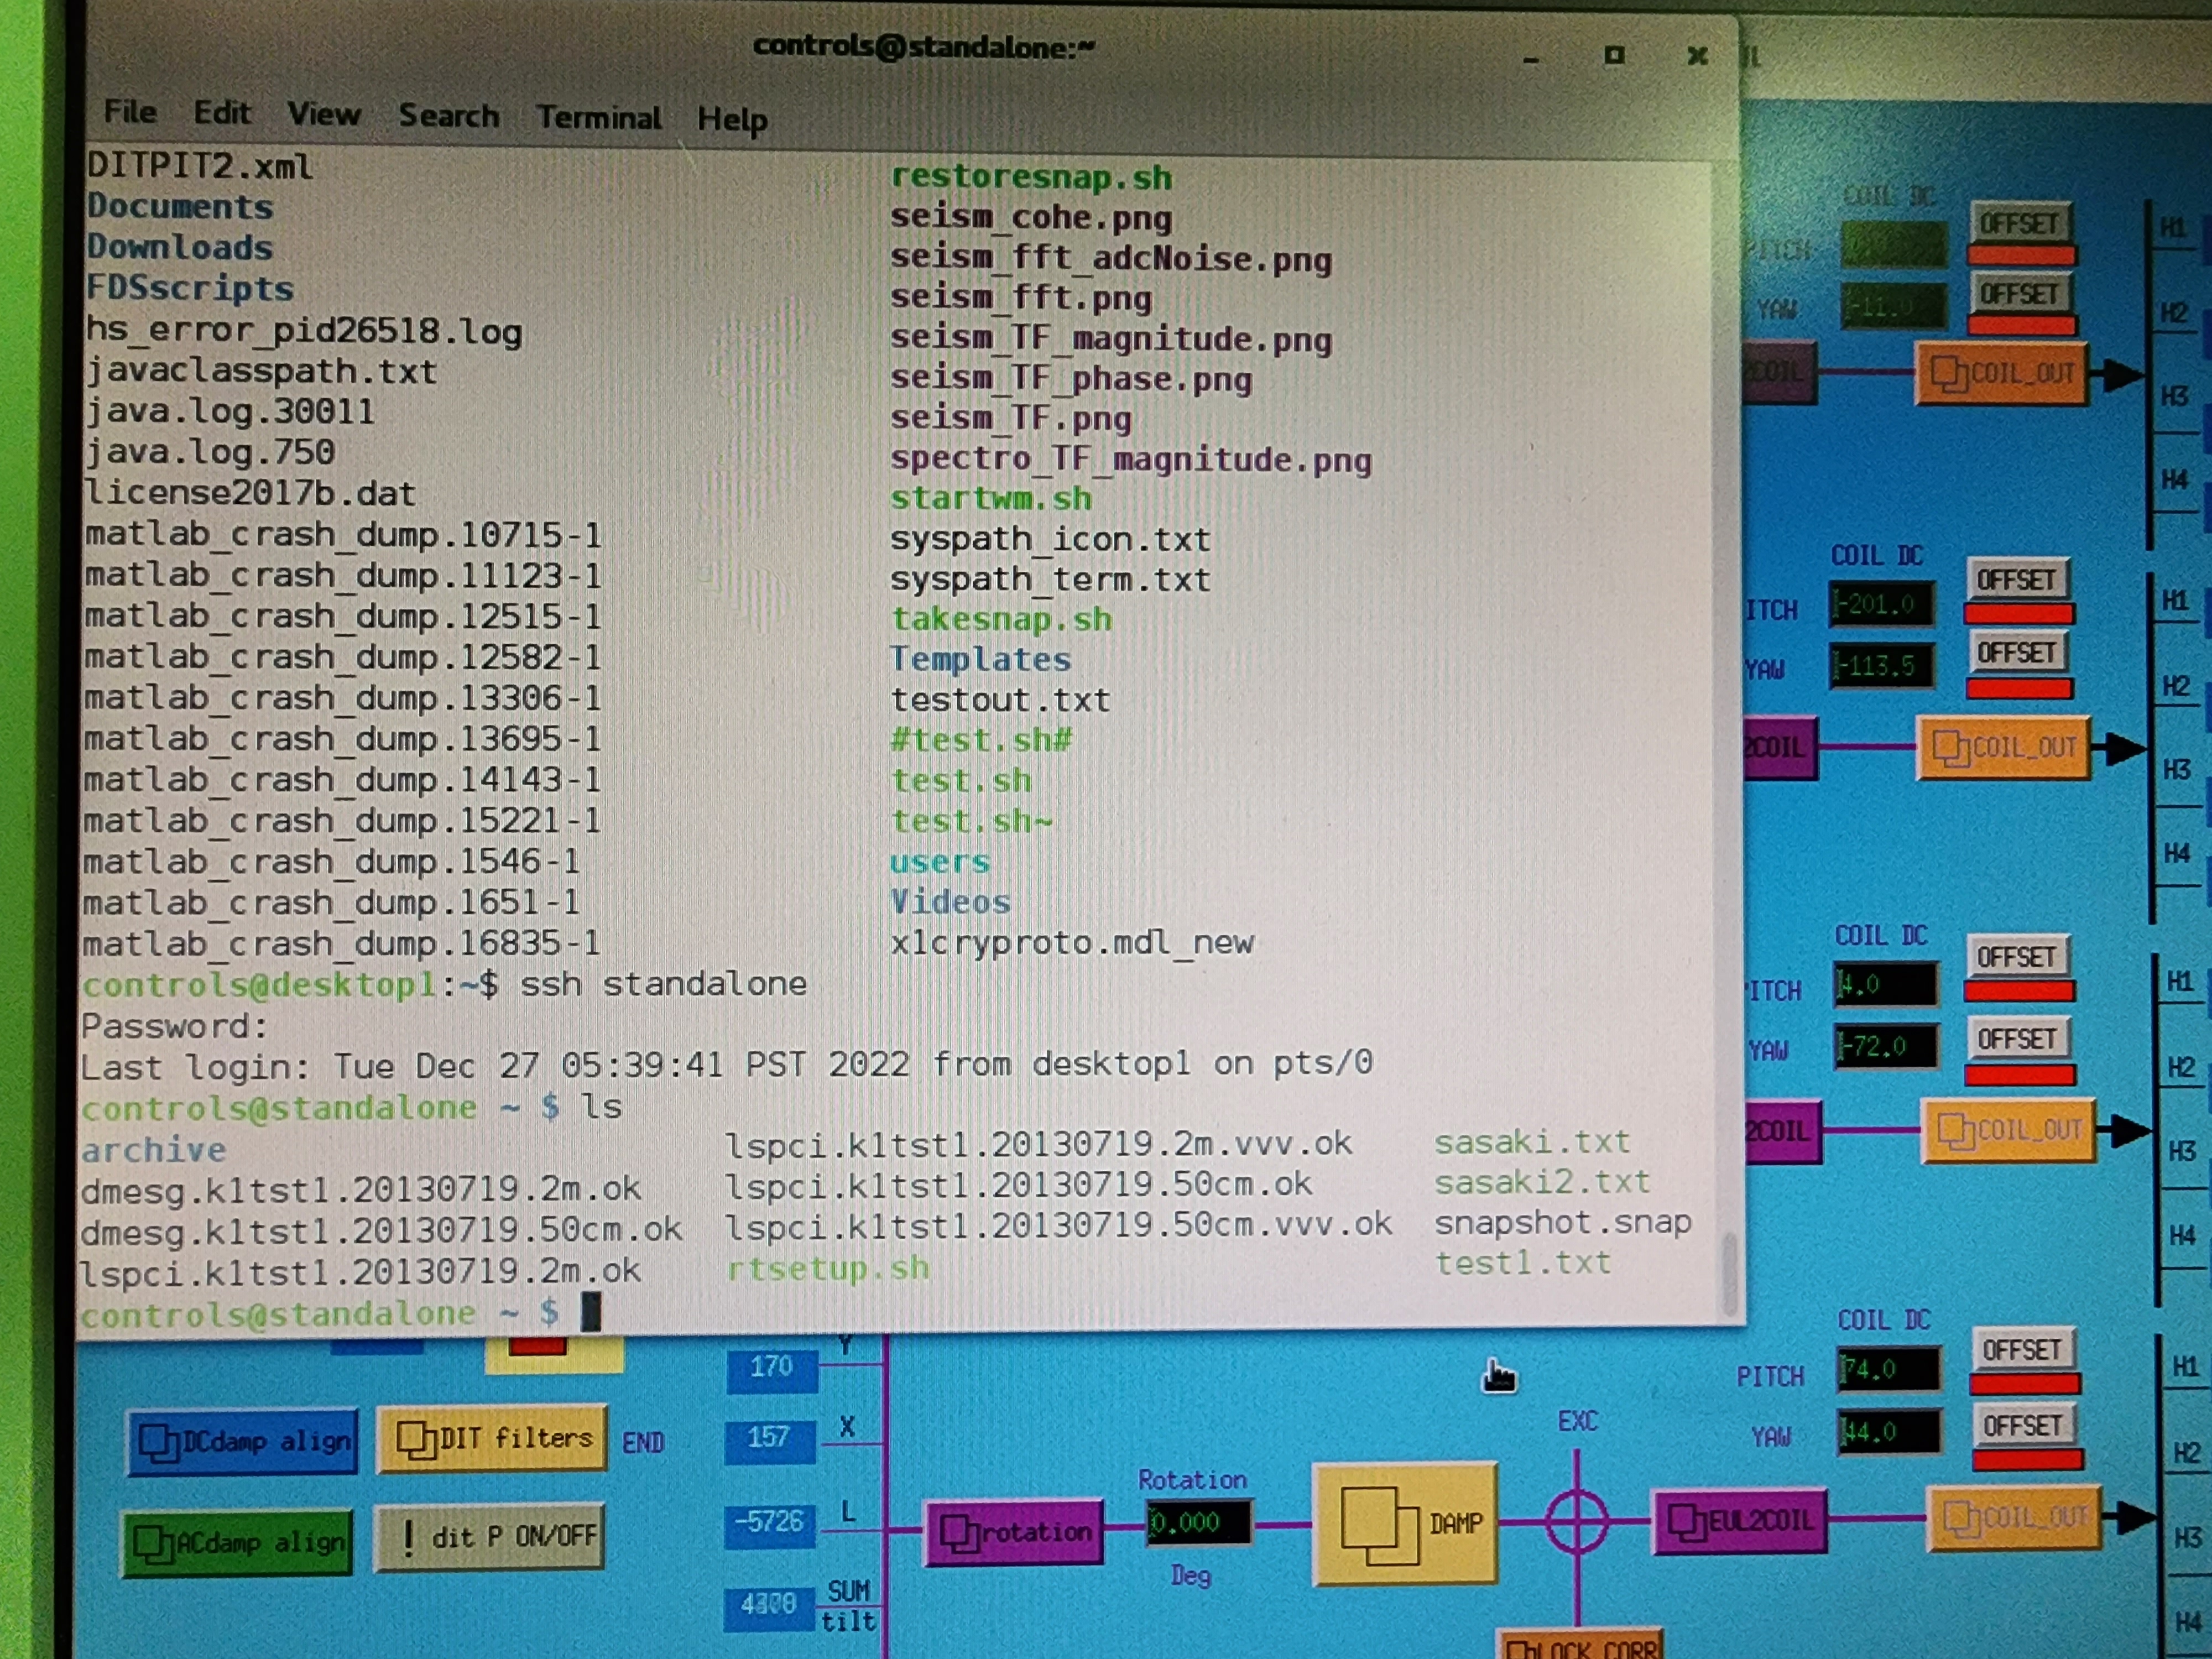
For the health check, I looked at the terminal logs (fig 1) and it seems that there is a test timeout error on every measurement of the coils. What that means is that the program starts at coil PR_H1, sets up the frequency range to be iterated, then tries to measure the first frequency point but fails some sort of supervisory check in this measurement. Then, it aborts the opration but also says the data is saved into the file PR_H1 located in /Desktop/TAMA_VIS/check_after_earthquake. After that, it moves on to the next coil, PR_H2, and does the same thing for all 16 coils on PR, BS, IN, END. So, in short, it looks like the health check script isn't taking any data.
I tried deleting some of the data in /frames/full on the standalone PC but it took a really long time. I pressed Ctrl+C in terminal to stop the operation after about 40 minutes had passed, then checked the disk status with the df command, and it was still at about 76% capacity.
I took a snapshot using the button in the medm VIS overview interface. Then I restarted the standalone PC and pressed restore snapshot in medm VIS. But it seems to have not completely restored things, for example, the file structure seen when using ssh into standalone (fig 2). To be honest, it is not clear to me *exactly* what this snapshot function does, so this problem and procedure should be written down in the GWSP wiki under FC procedure to operate, when I figure it out.
Anyway, I had rebooted the standalone PC and there *should* be sufficient disk space to perform measurements. But I still keep getting the same test timeout error when I run the health check script. Everyone who can help with this problem is on holiday so I will just leave it for now.
Report from last Friday
I tried to do the suspension health check as per the description. The purpose is to excite the mirror coils then check the transfer function to oplev pitch and yaw. If there is no coherence between the input excitation and the output then it is an obvious sign that a magnet has fallen off. However, I ran into some problems:
- The PR oplev is quite off center in pitch. The steering mirror at the output viewport of the PR oplev ran out of actuation when I tried to recenter the PSD. In the medm screen it was about 5000 counts off center. I don't have too much memory of TAMA oplevs so I am wondering if PR oplev pitch is a relatively common issue or not.
- After centering all of the other oplevs, I ran test.sh in the folder /TAMA_VIS/check_after_earthquake. However, the program kept giving test time out errors. I checked the disk space and it was nearly full, so I tried deleting all of the frame data in frames/trend/second and freed up about 25% of disk space. But the problem persisted.
[Mitsuhashi,Shalika]
This elog is about doing ring down measurement, and fit the data
What we did:
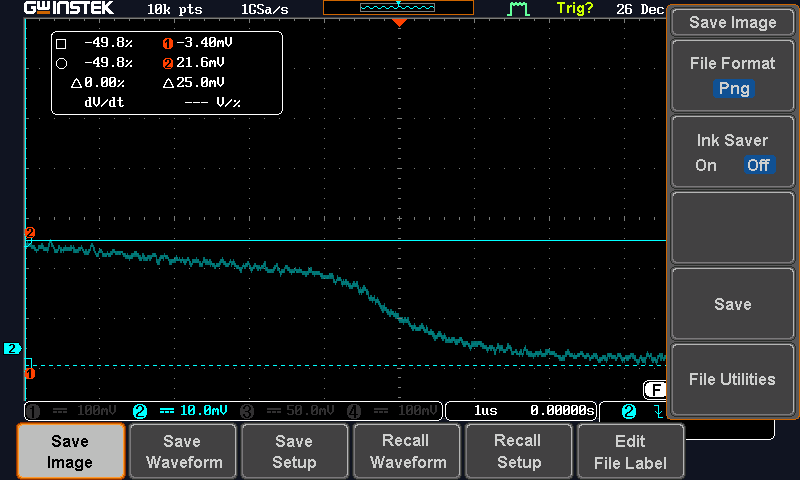
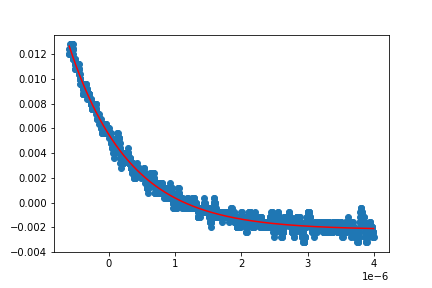
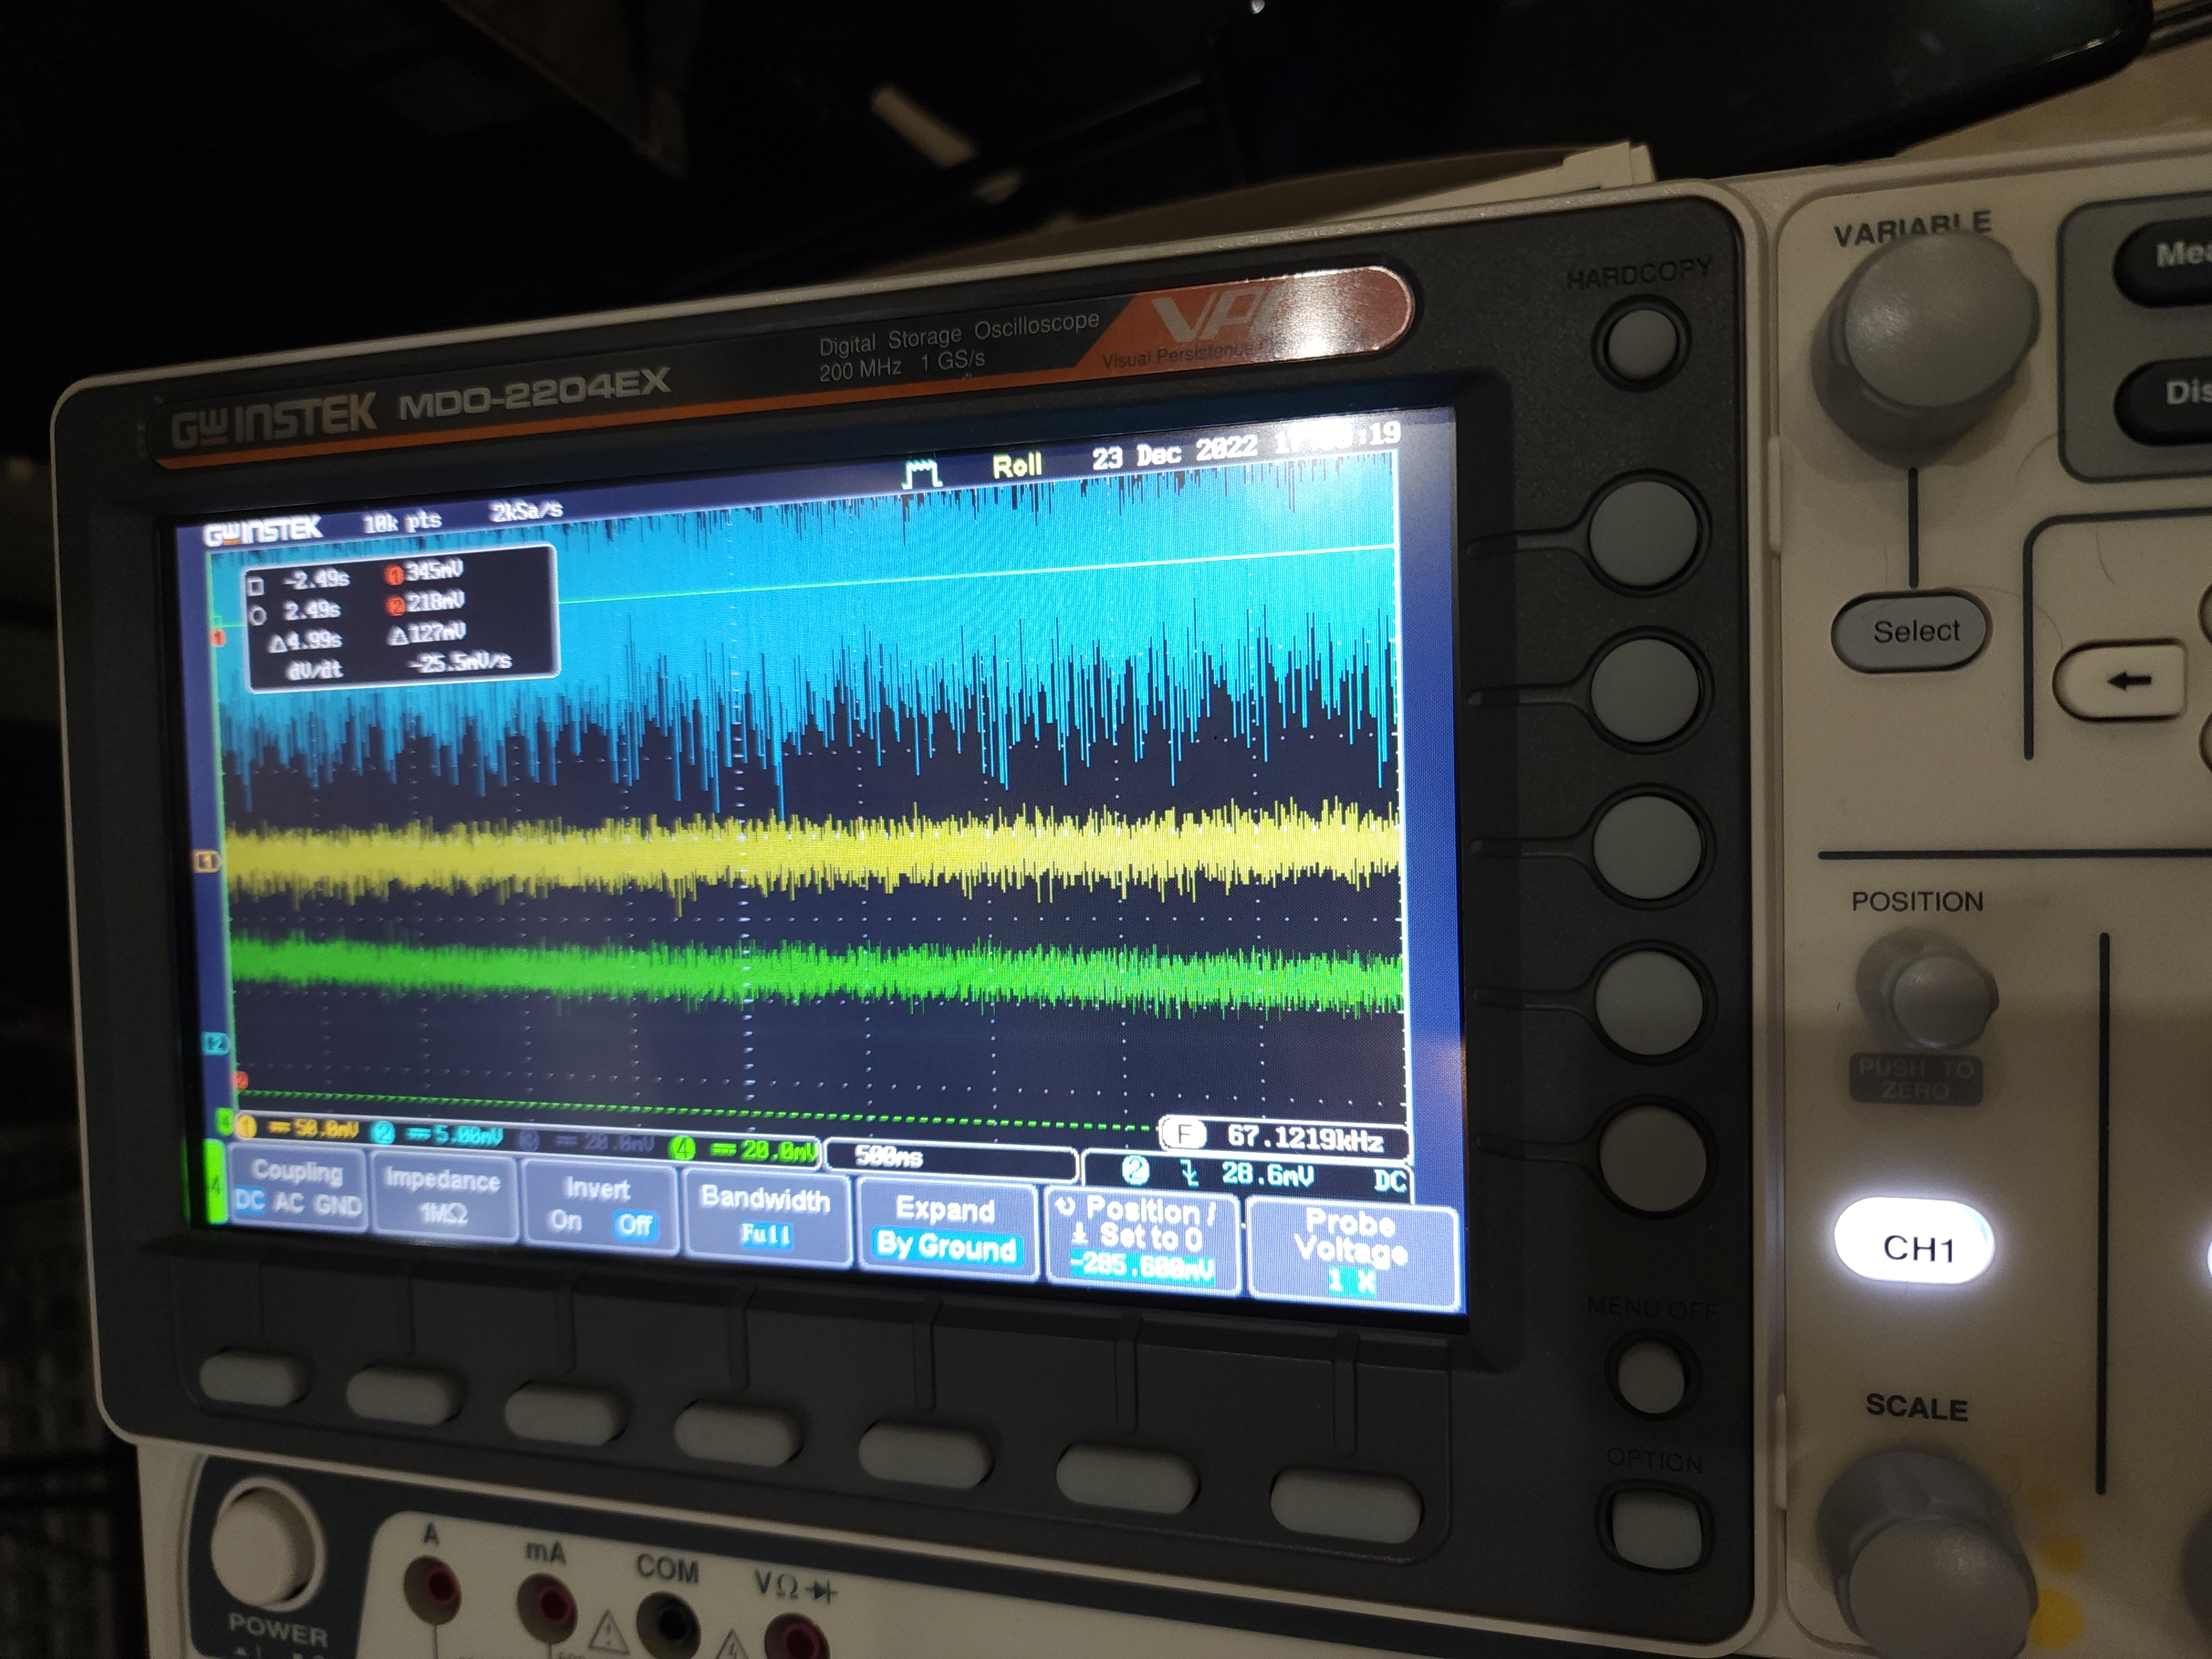
When we try to measure the ring down. The pictuere from osiloscope was attached.
The supposed decay time from the picture was around 1μs, and the result of fitting the data show that decay time is 0.9μs.
This value is comparable to time resolution of the photo detector we use now.
What we will do:
We check how the photo detector and AOM works when we shut down a lazer.
And we will try to reinstall a photo detector that has hight time resolution.
[Shalika, Mitsuhashi-san]
This elog is about doing the ringdown measurement. In continuation to work in elog.
Details:
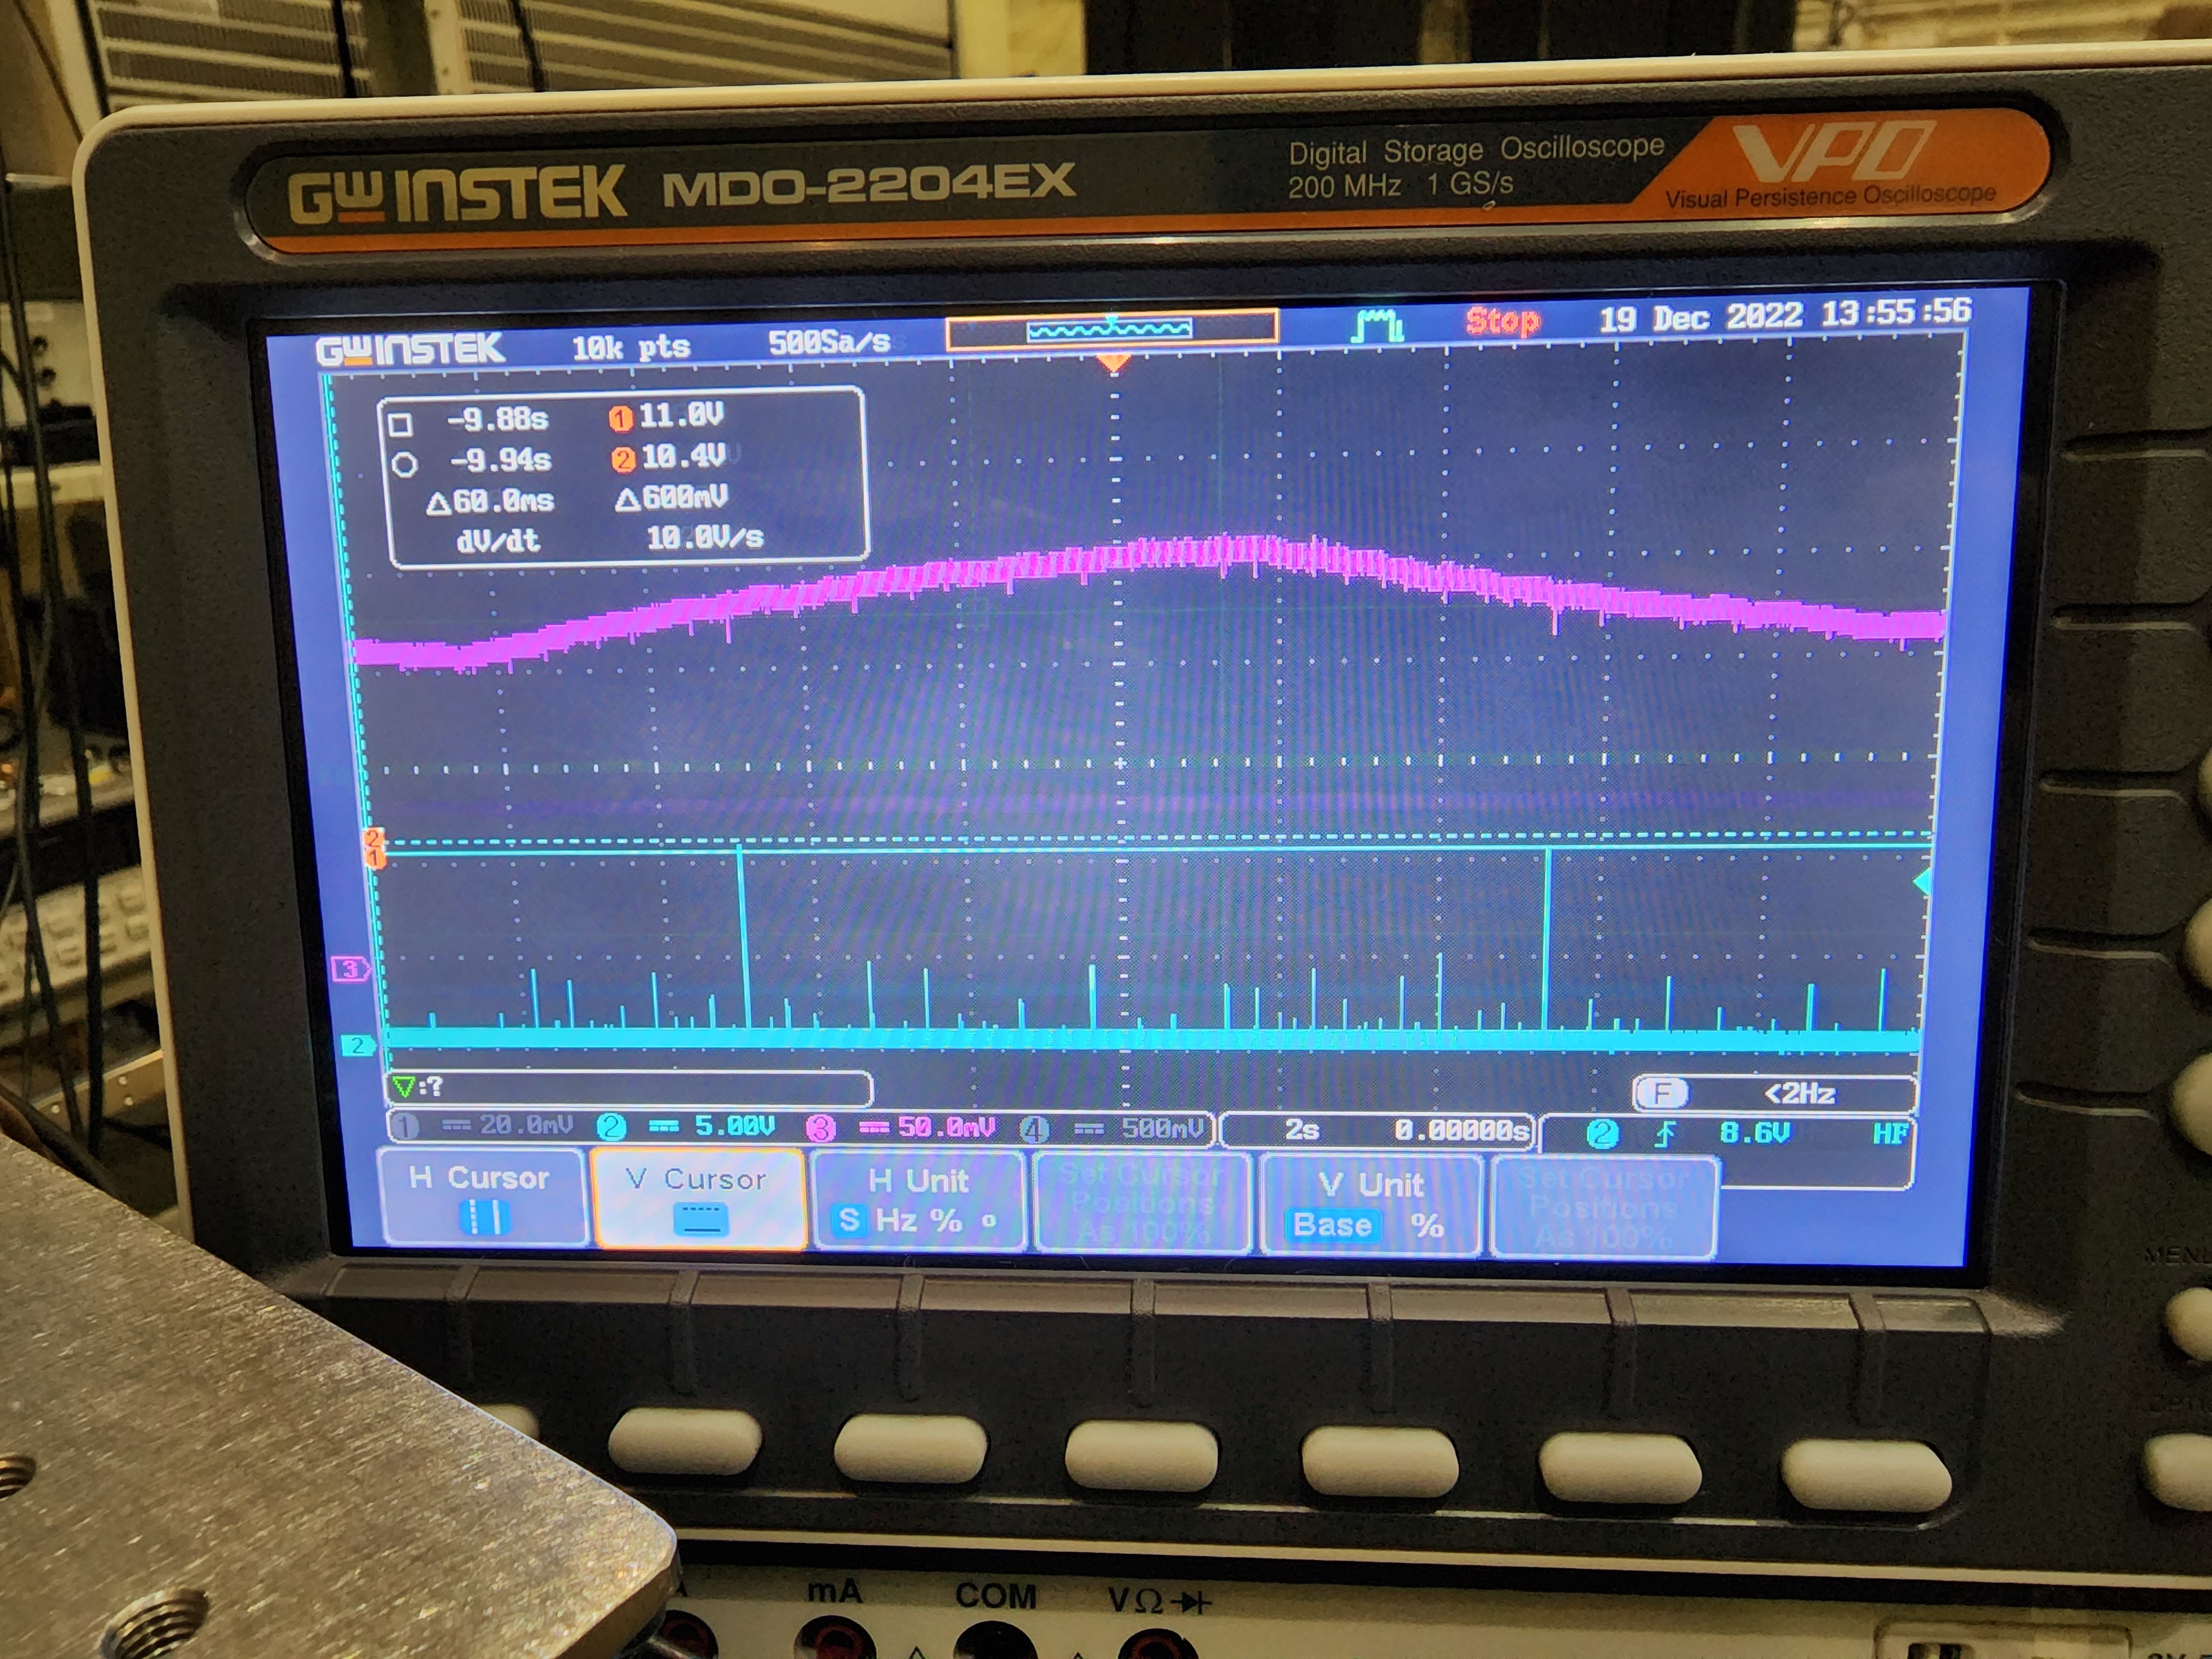
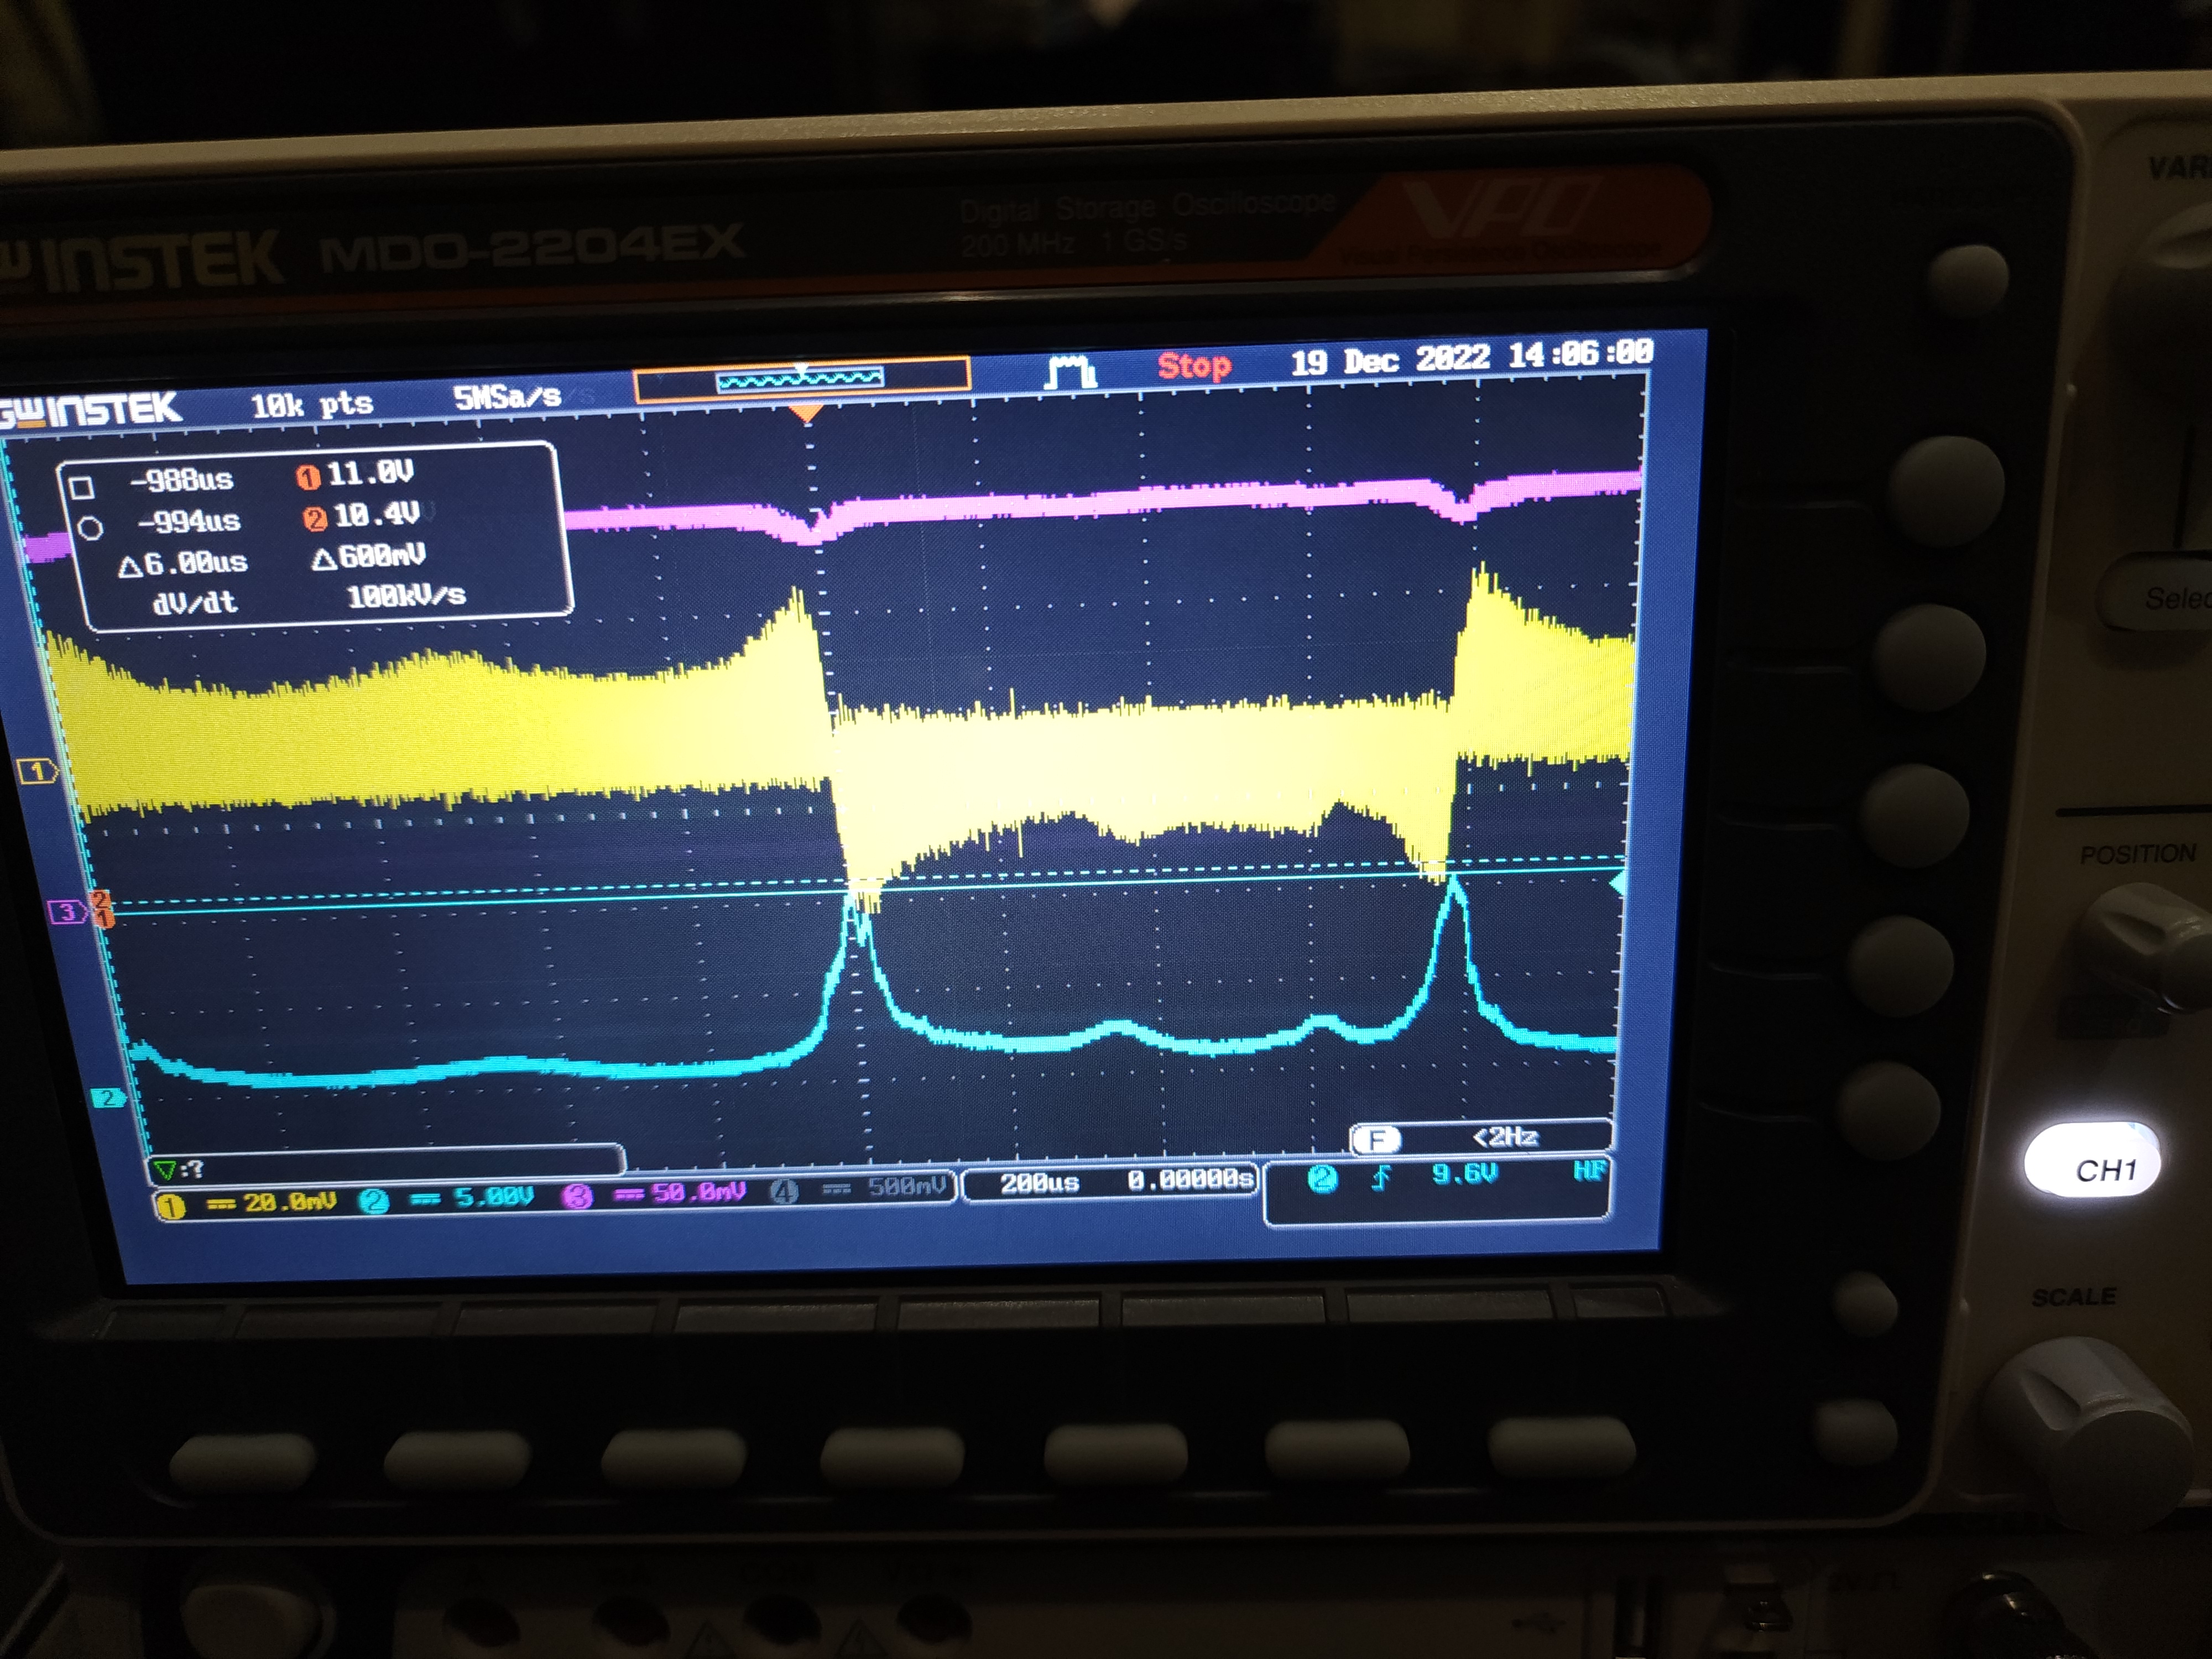
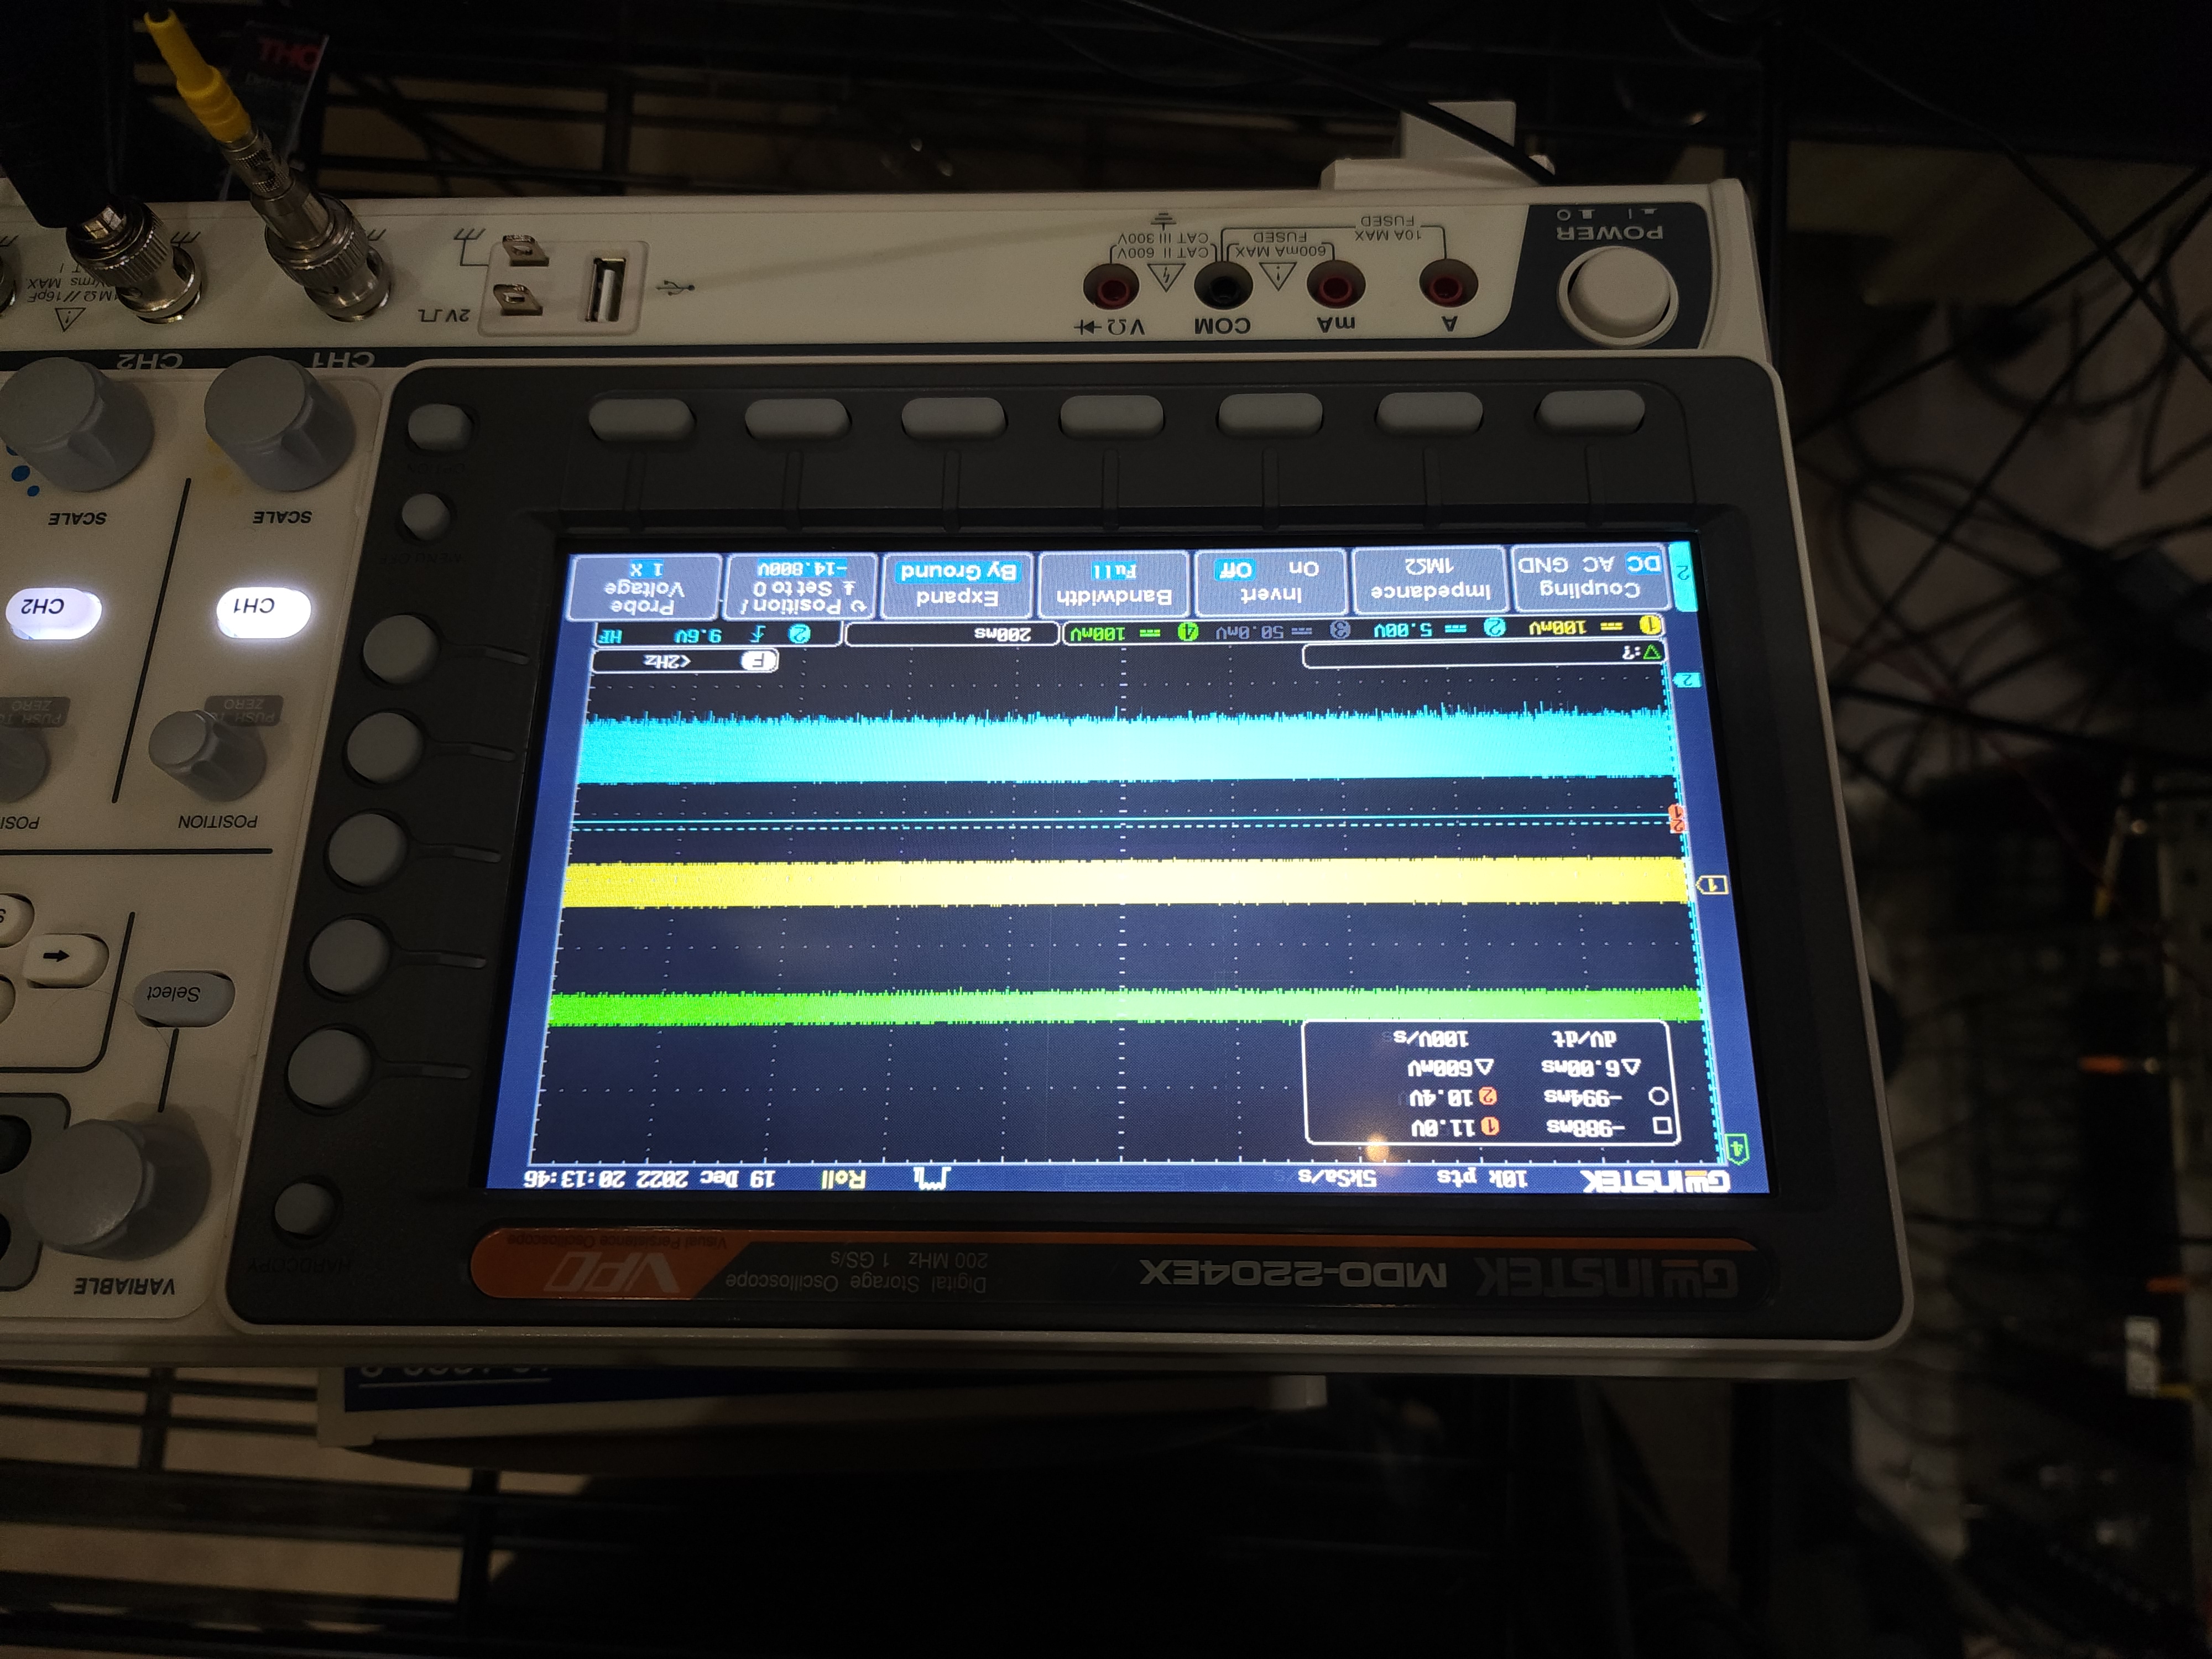
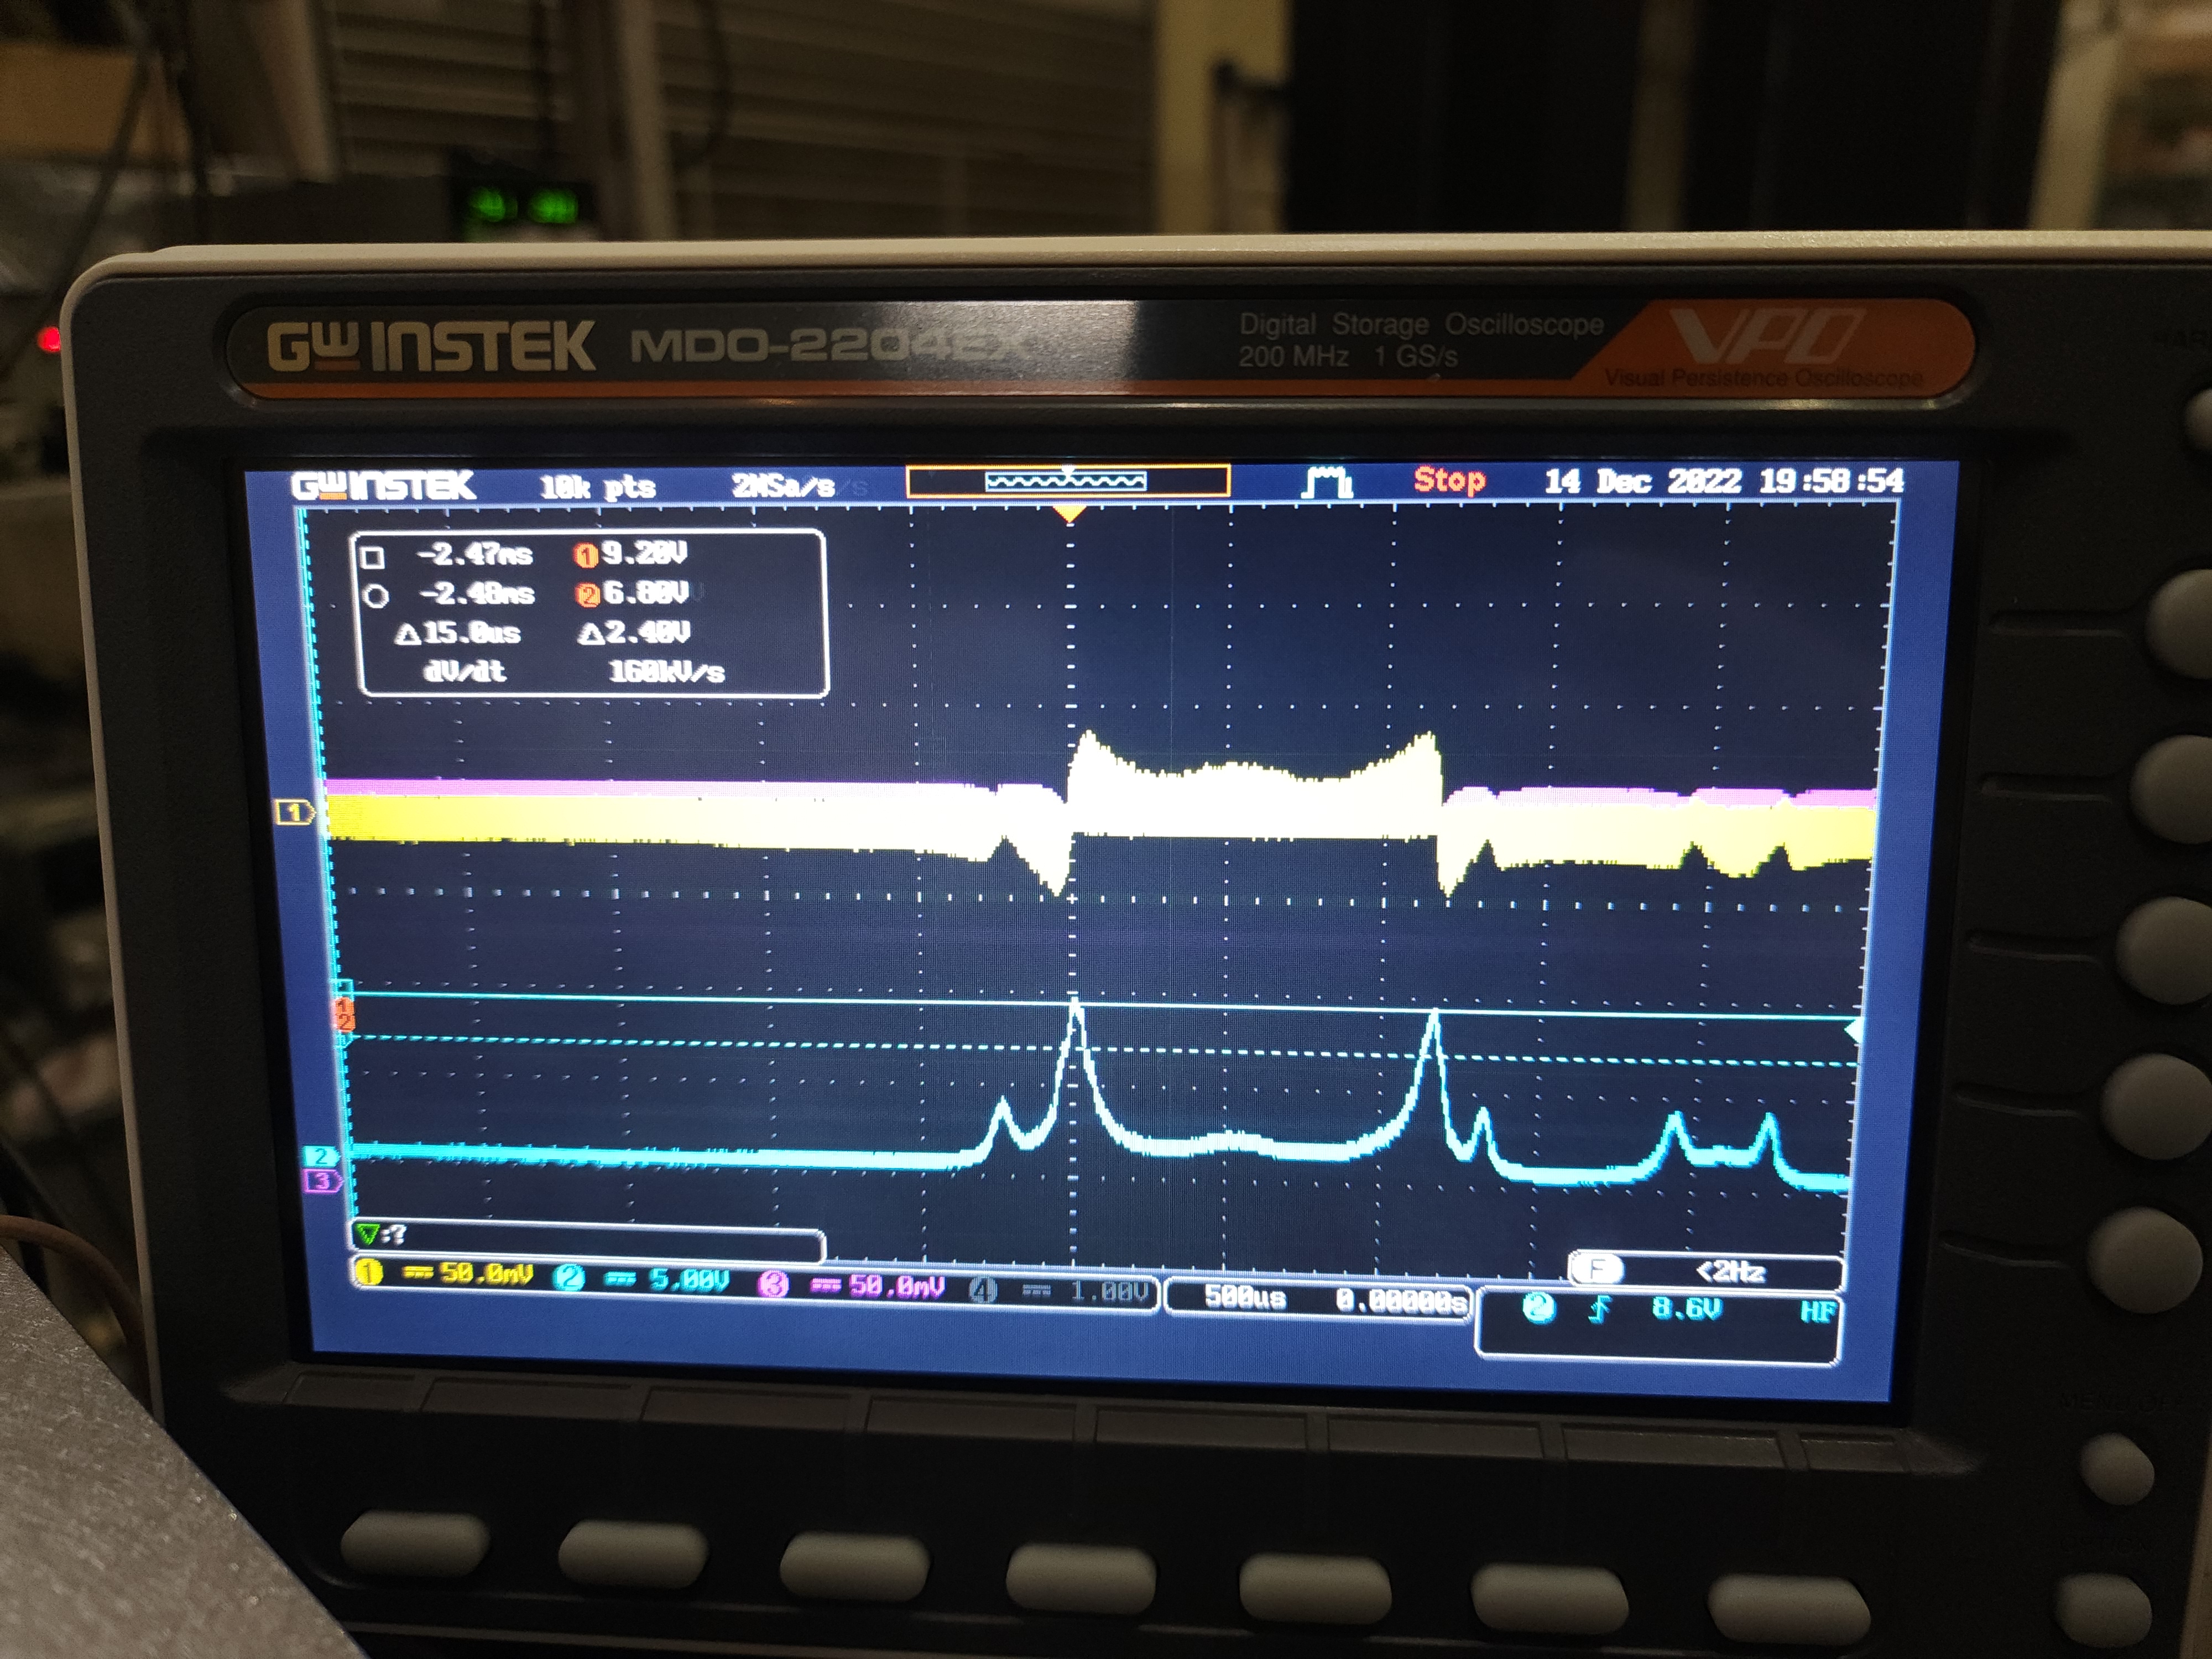
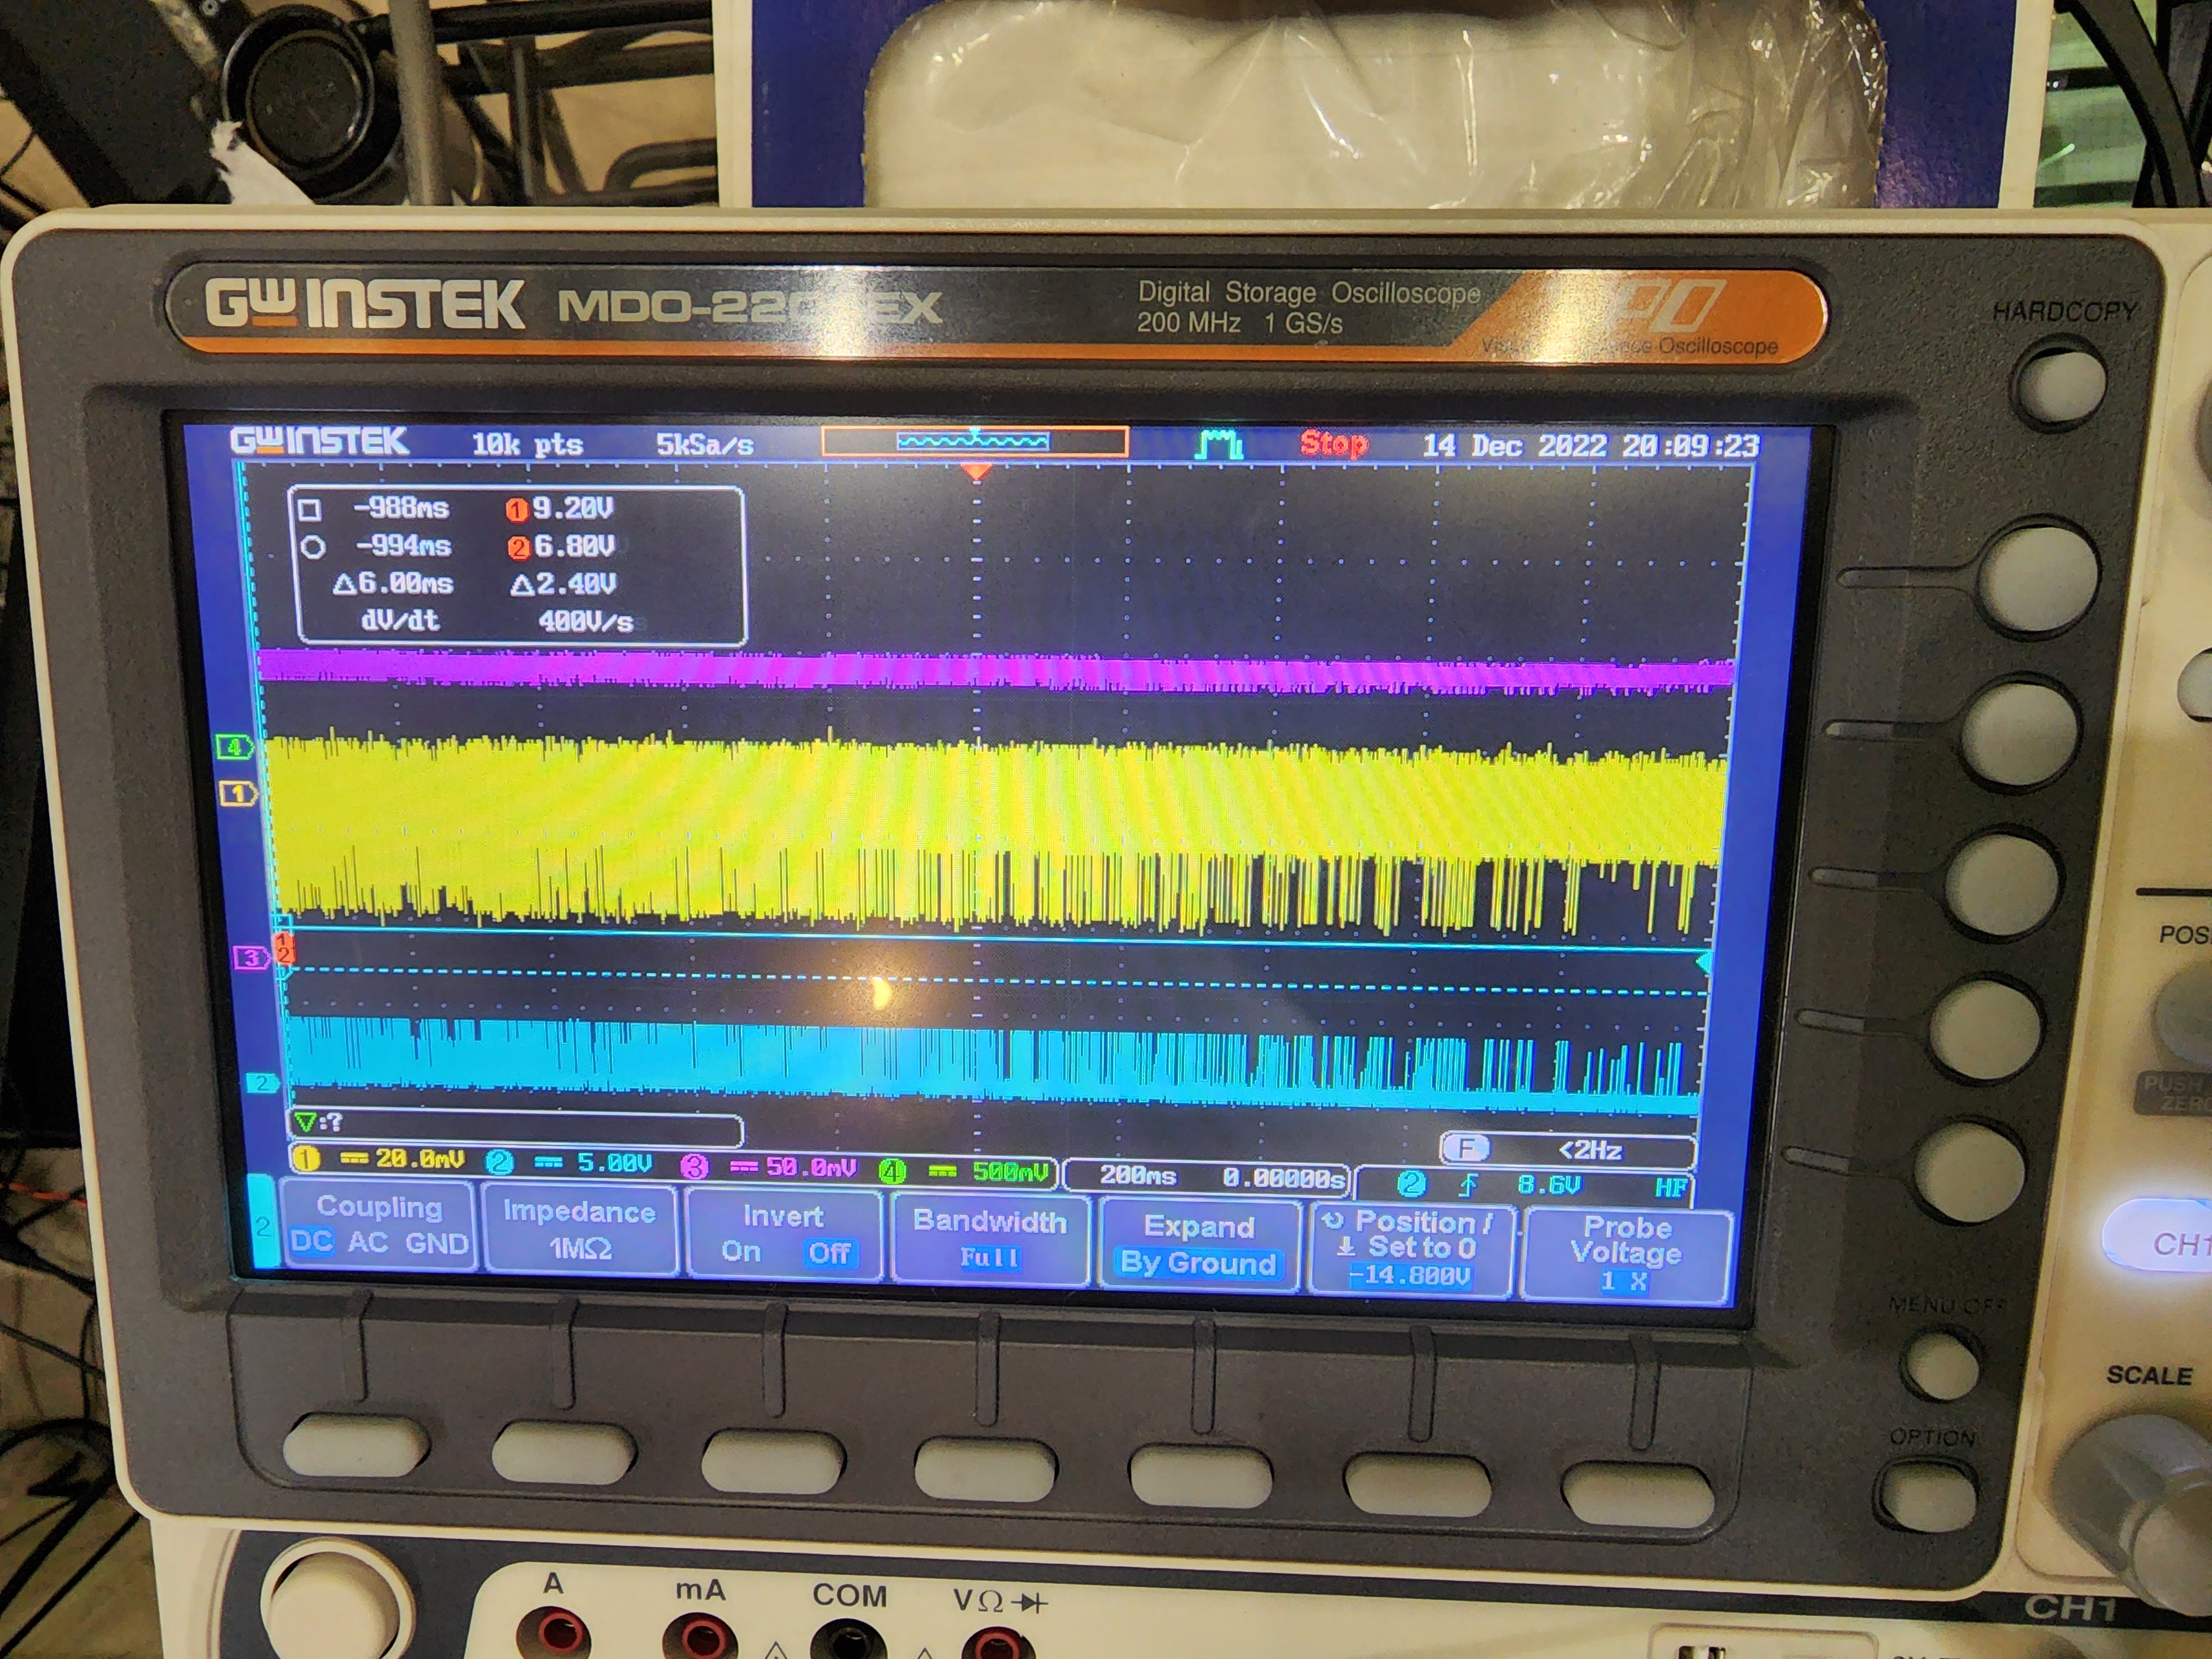
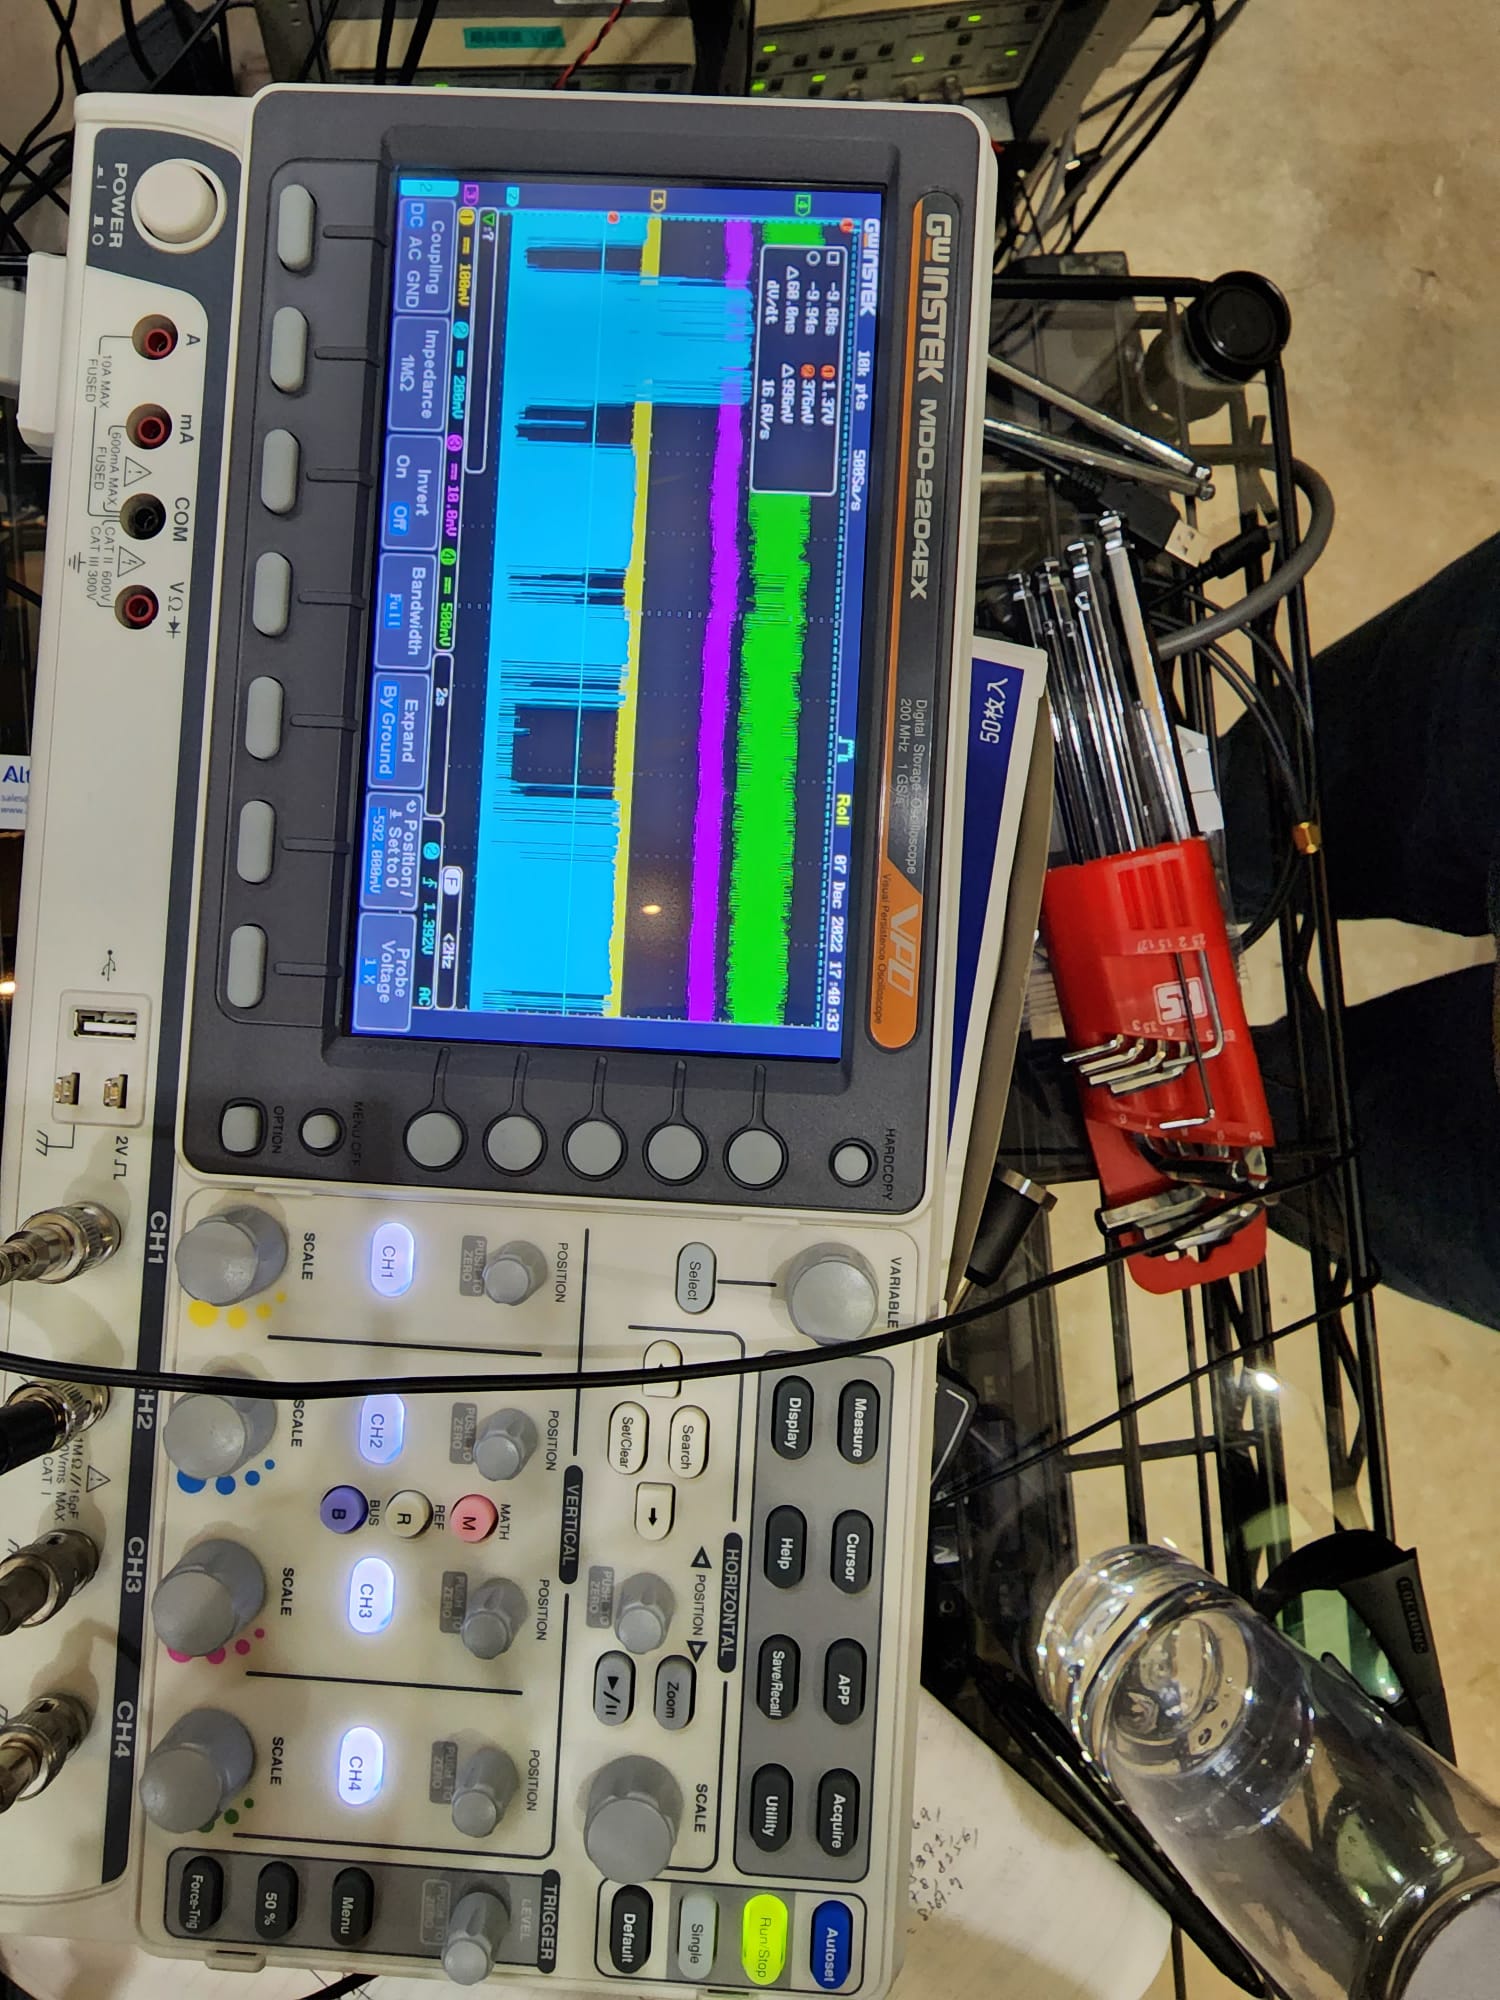
1. The amplitude of TEM00 mode in transmitted signal is 37mV. The PD at transmitted beam is set with 20dB attenuator. The cavity was able to lock the TEM00 mode at 37mV for 12 minutes. The error signal(CH1--yellow) for the corresponding peak looks as shown in Fig 1. The demodulation phase was set to 185º.
2. The filter cut off frequency was 3 Hz and gain was 100.
3. The laser temperature was 8510±20. The offset voltage varied from -0.1 to 0.1.
4. The feedback signal(CH4--green) and error signal(CH1--yellow) during lock looks as in Fig 2.
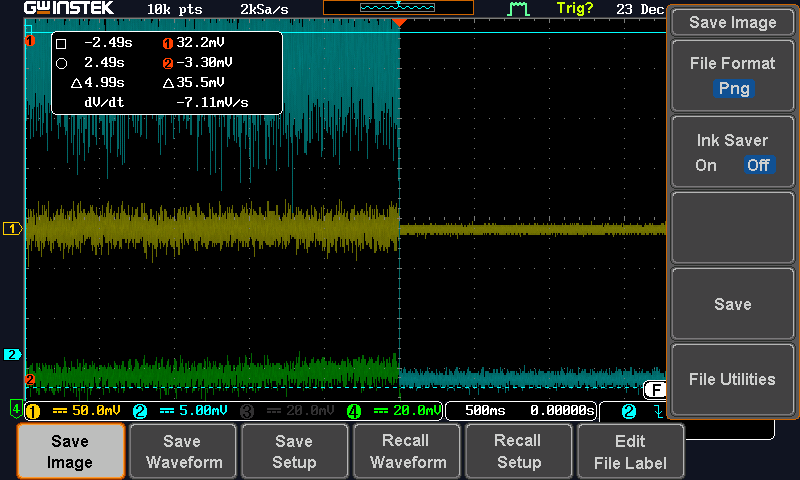
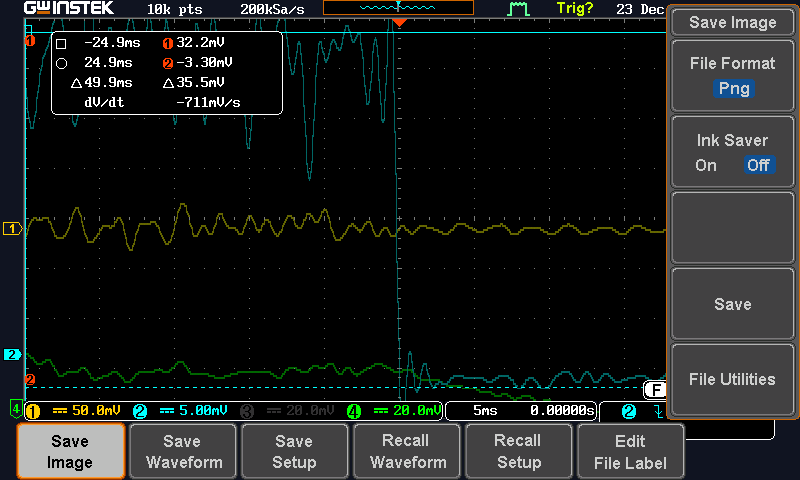
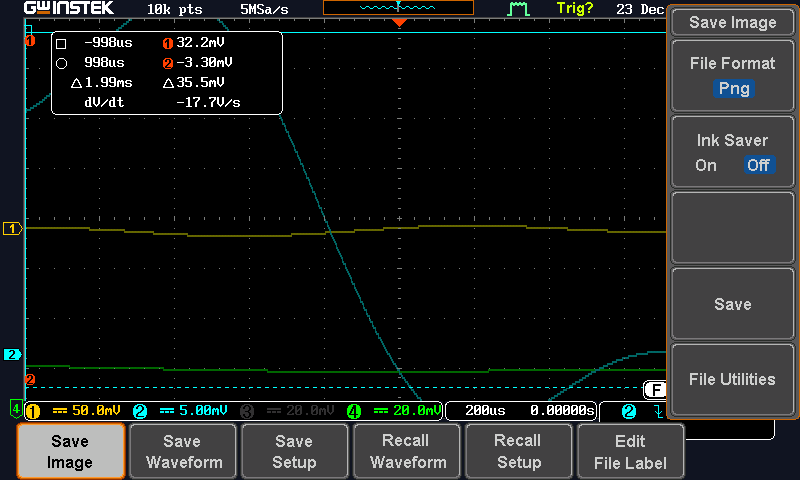
5. The ringdown measurement was done by setting the trigger and switching off AOM. The signals look as shown in Fig 3,4,5.
Next Step:
We will analyze the data to calculate the decay time.
[Shalika, Mitsuhashi-san]
This elog is about us trying to improve lock time. In continuation to work in elog.
Details:
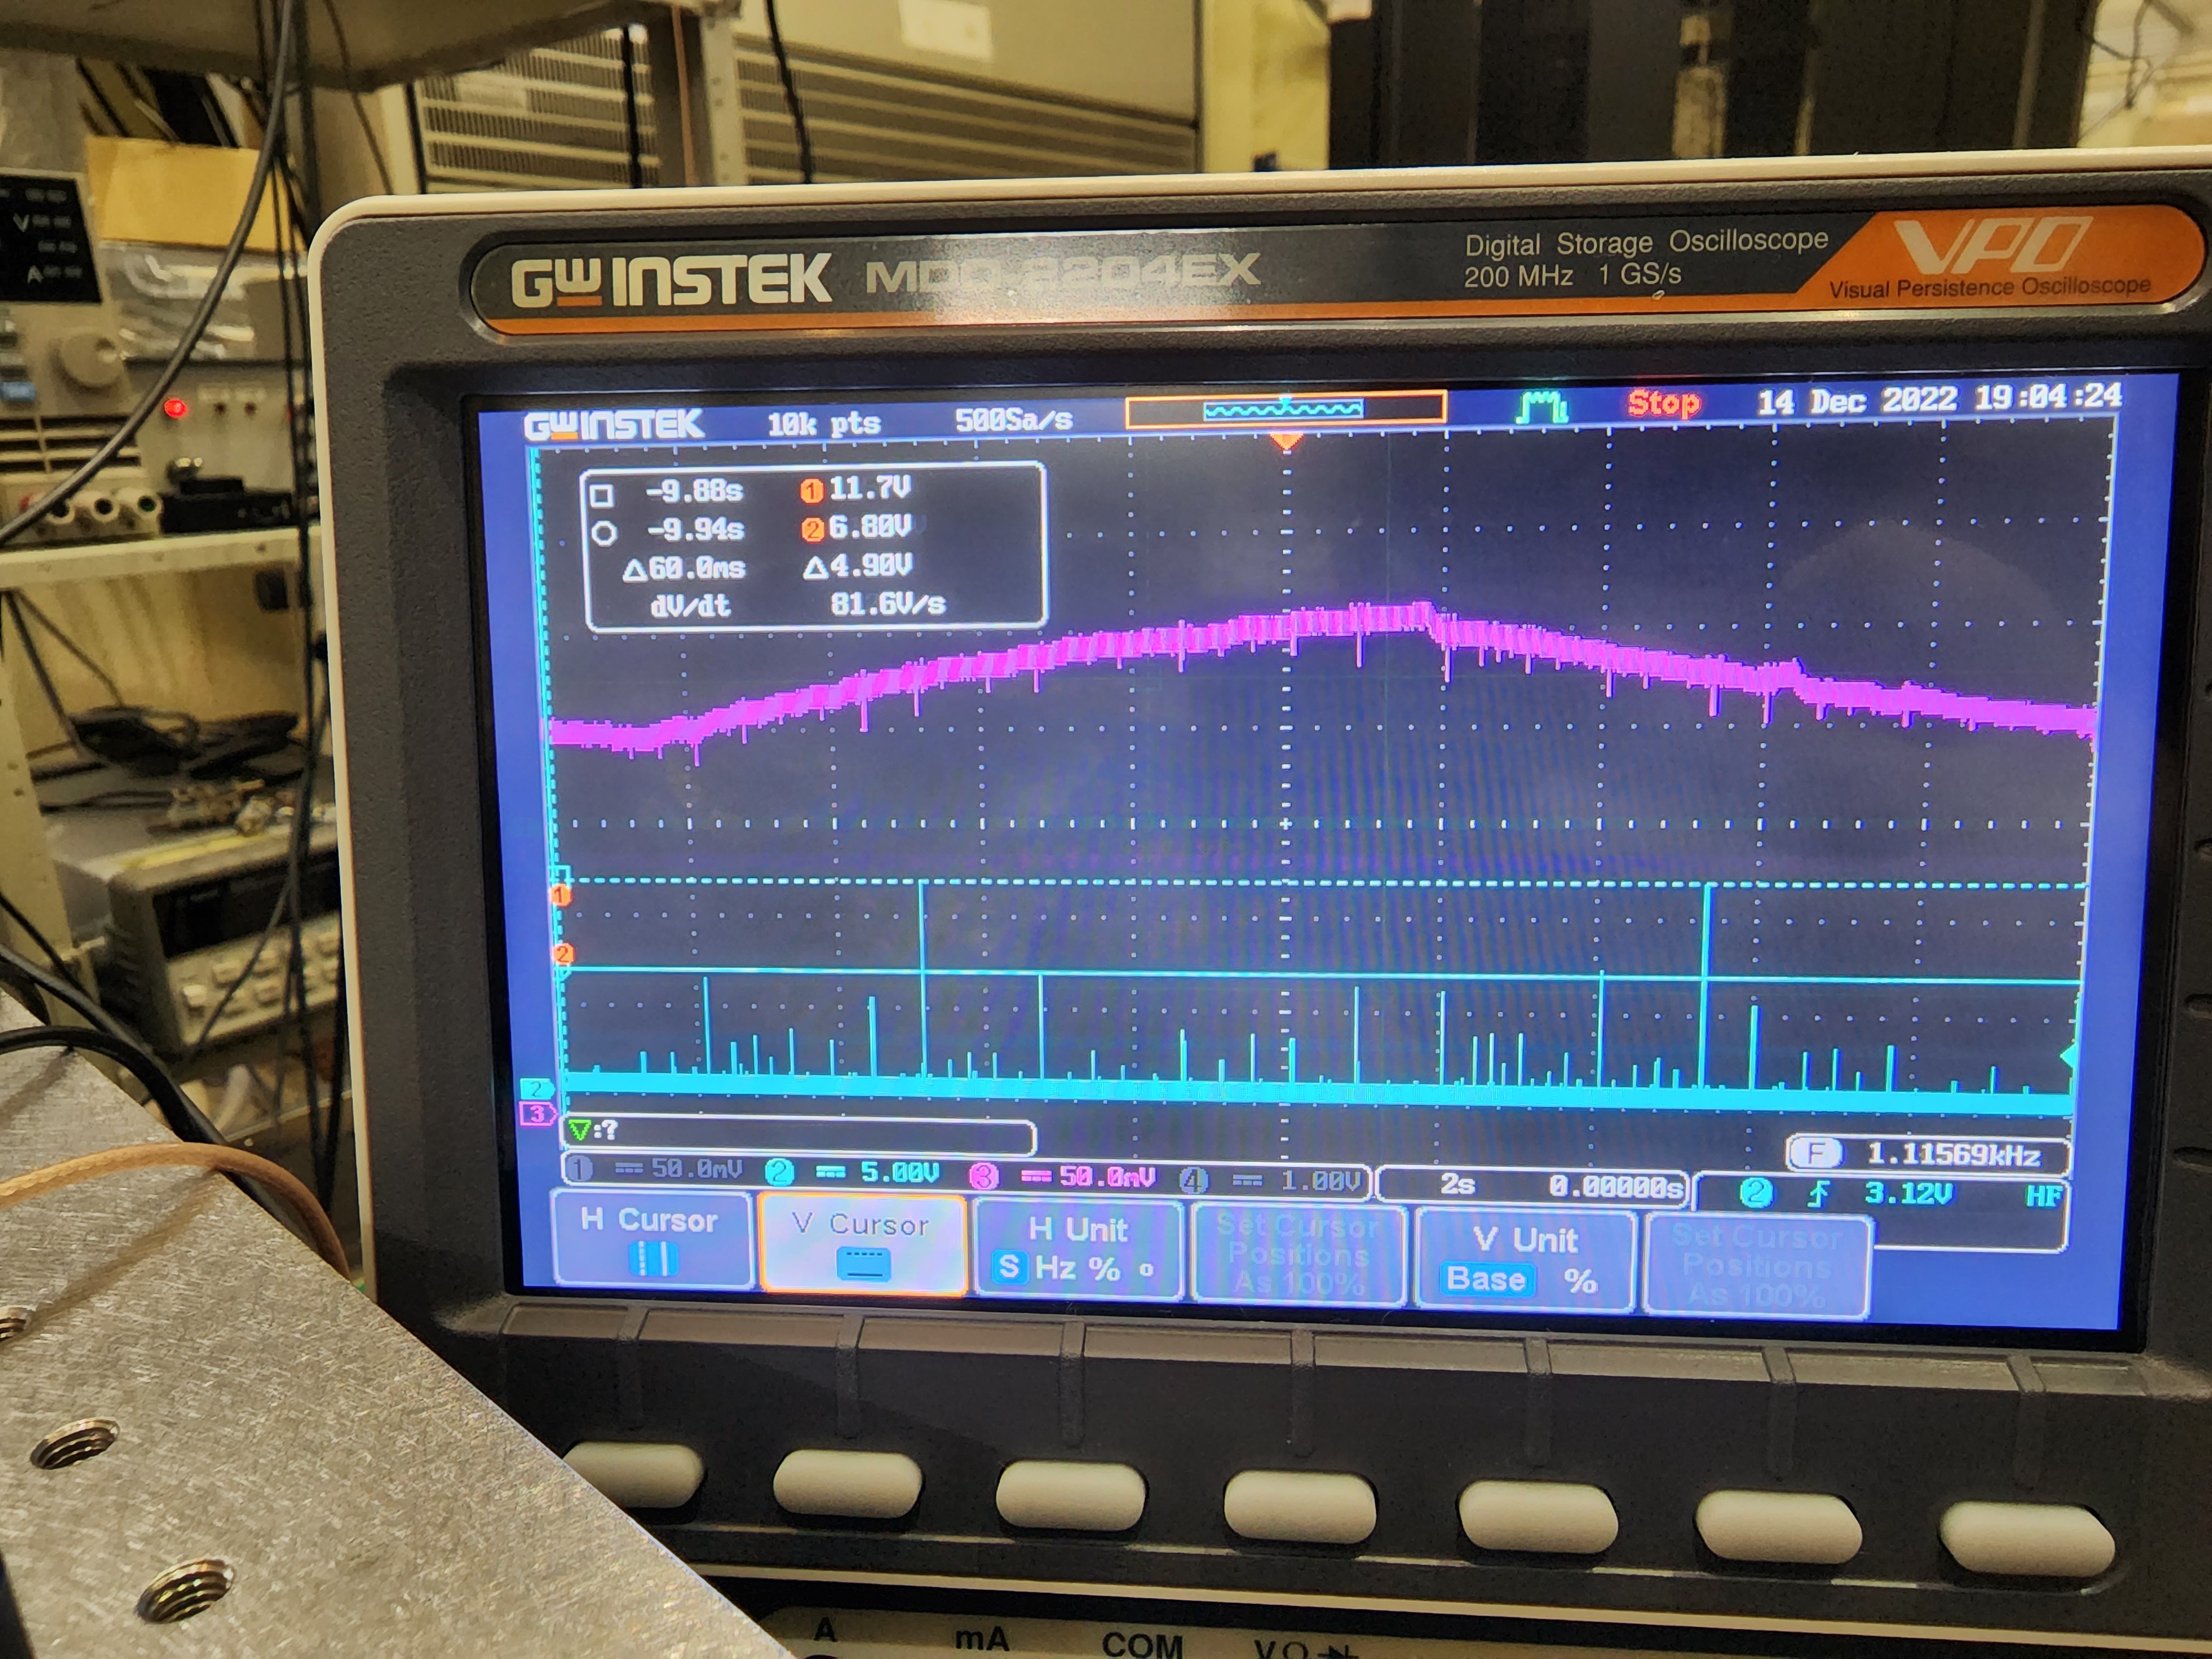
1. Today we finalized our cavity mirror alignment. The TEM00 mode observed using PD at transmitted beam is of 10.4V ampitude and is as shown in Fig 1 during laser scan. The corresponding error signal looks is as shown in Fig 2. The demodulated signal's phase is set at 110º. All the higher order modes were less than 50% of TEM00 amplitude.
2. We found the laser temperature at which TEM00 mode appears. We set the laser temperature to 9100.
3. We changed the offset voltage and around 0.7 to 0.8 V, the cavity was able to lock for 10 minutes(shown in Fig 3).The filter cut off frequency was 10 Hz and gain was 200. The amplitude of the locked signal was a bit less than the TEM00 mode amplitude. We are certain it was locked to TEM00 and was not locked to higher order mode, since no modes other than TEM00 were observed at an amplitude of more than 5V. To fix this we will change the filter cut off frequency and gain.
Next Step:
We will try to change the filter properties and make the locked signal amplitude same as TEM00 mode amplitude(as in Fig 1).
[Shalika, Mitsuhashi-san]
This elog is about us trying to improve lock time. In continuation to work in elog.
Details:
1. We tried tuning the cavity mirror alignment to increase the TEM00 mode. The amplitude of modes has improved (more because of the incident mentioned in point 2). Also, we tuned more to suppress other higher-order modes. Now the modes look as in CH2 in Fig 1. The error signal for the corresponding TEM00 mode is shown in CH1 in Fig 2. The scale for CH2 is 5V. We tried locking but it only locked to higher order modes as in Fig 3.
2. On Tuesday evening by mistake I touched the first mirror in the optical setup outside the cavity. As a result, the transmitted beam was lost. I was able to fix the problem, and now the AOM diffraction efficiency is improved and is 57.3% (output: 6.59mW and incident:11.5mW). In the past, the efficiency was 38%. I made sure that there are no higher-order modes (shown in Fig 4)
Next Step:
We will try to tune the temperature of the laser to find the desired frequency at which TEM00 mode appears. Also, we will try to find the optimum offset voltage and keep improving the mirror alignment.
Marc with remote help of Matteo and Yuhang
We changed the ground of all DDS boards and the 500 MHz clock from the 'high quality ground' to 'ground' as in http://tamago.mtk.nao.ac.jp/tama/ifo/general_lib/circuits/000000_general/NIM_pin_connection.pdf
We tested that all components could be turned on and all applied voltages were correct.
We reinstalled the clock and DDS boards in the usual nim rack without issue.
DDS1 and DDS2 provide the expected signal (ie about +9/10dBm with internal amplifier and --8/9dBm without).
DDS3 have all outputs connected to internal amplifiers. Only the DAC0 provide the expected output. I checked that the output of the evaluation board is correct (-8dBm) so the issue is either in the internal amplifier or from loose connections.
[Marc, Mitsuhashi, Rishab, Shalika]
Summary of these past days activities as elog was down.
Preparation of optical table and rack
We moved the table away of TAMA AS vacuum chamber and installed a spare rack we found in TAMA north arm.
We setup Manuel's PC there with all appropriate softwares. It is now connected by Ethernet to the FC new DGS switch.
Optical setup and camera test
We installed a second f=50mm lens roughly 100 mm after the first one to have a collimated beam.
Then, we installed a 10:90 BS so to have about 6 mW in reflection.
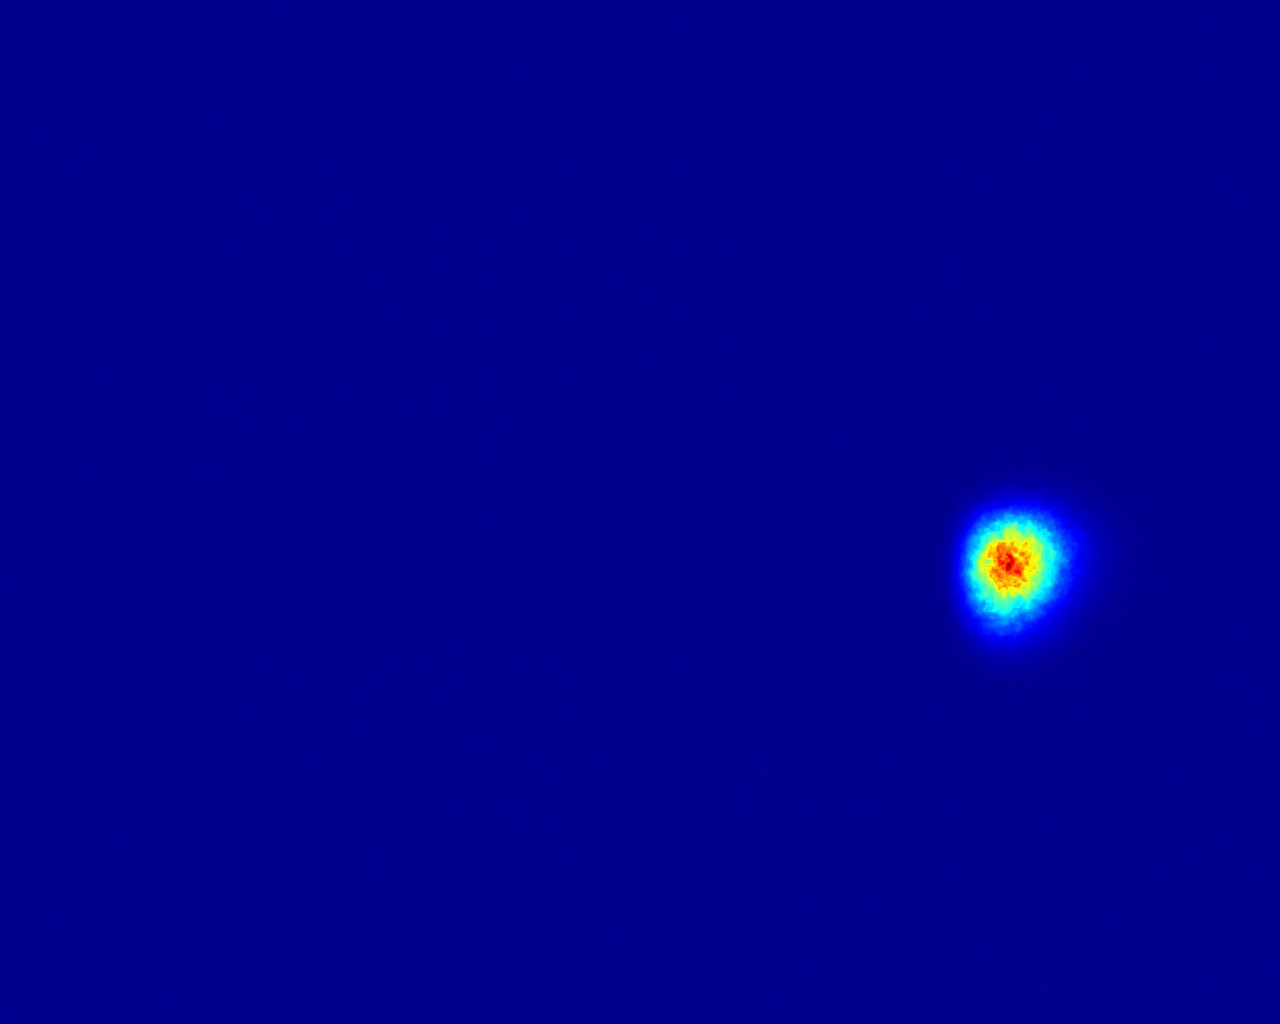
We measured the beam diameter to be about 800 um and quite well collimated.
In the reflection, we installed a QWP and HWP mounted in motorized mounts.
Finally, we installed our polarization camera (PAX1000IR2) several tens of cms after to have some space for our future tests.
As expected from the datasheet, we can measure the polarization rotation or retardation with accuracy of 0.5 deg. This is same order of magnitude of our currents birefringence characterization setups (both from NAOJ or ICRR)!
We could confirm that the rotation of QWP and HWP yield the expected ellipticity and rotation changes respectively.
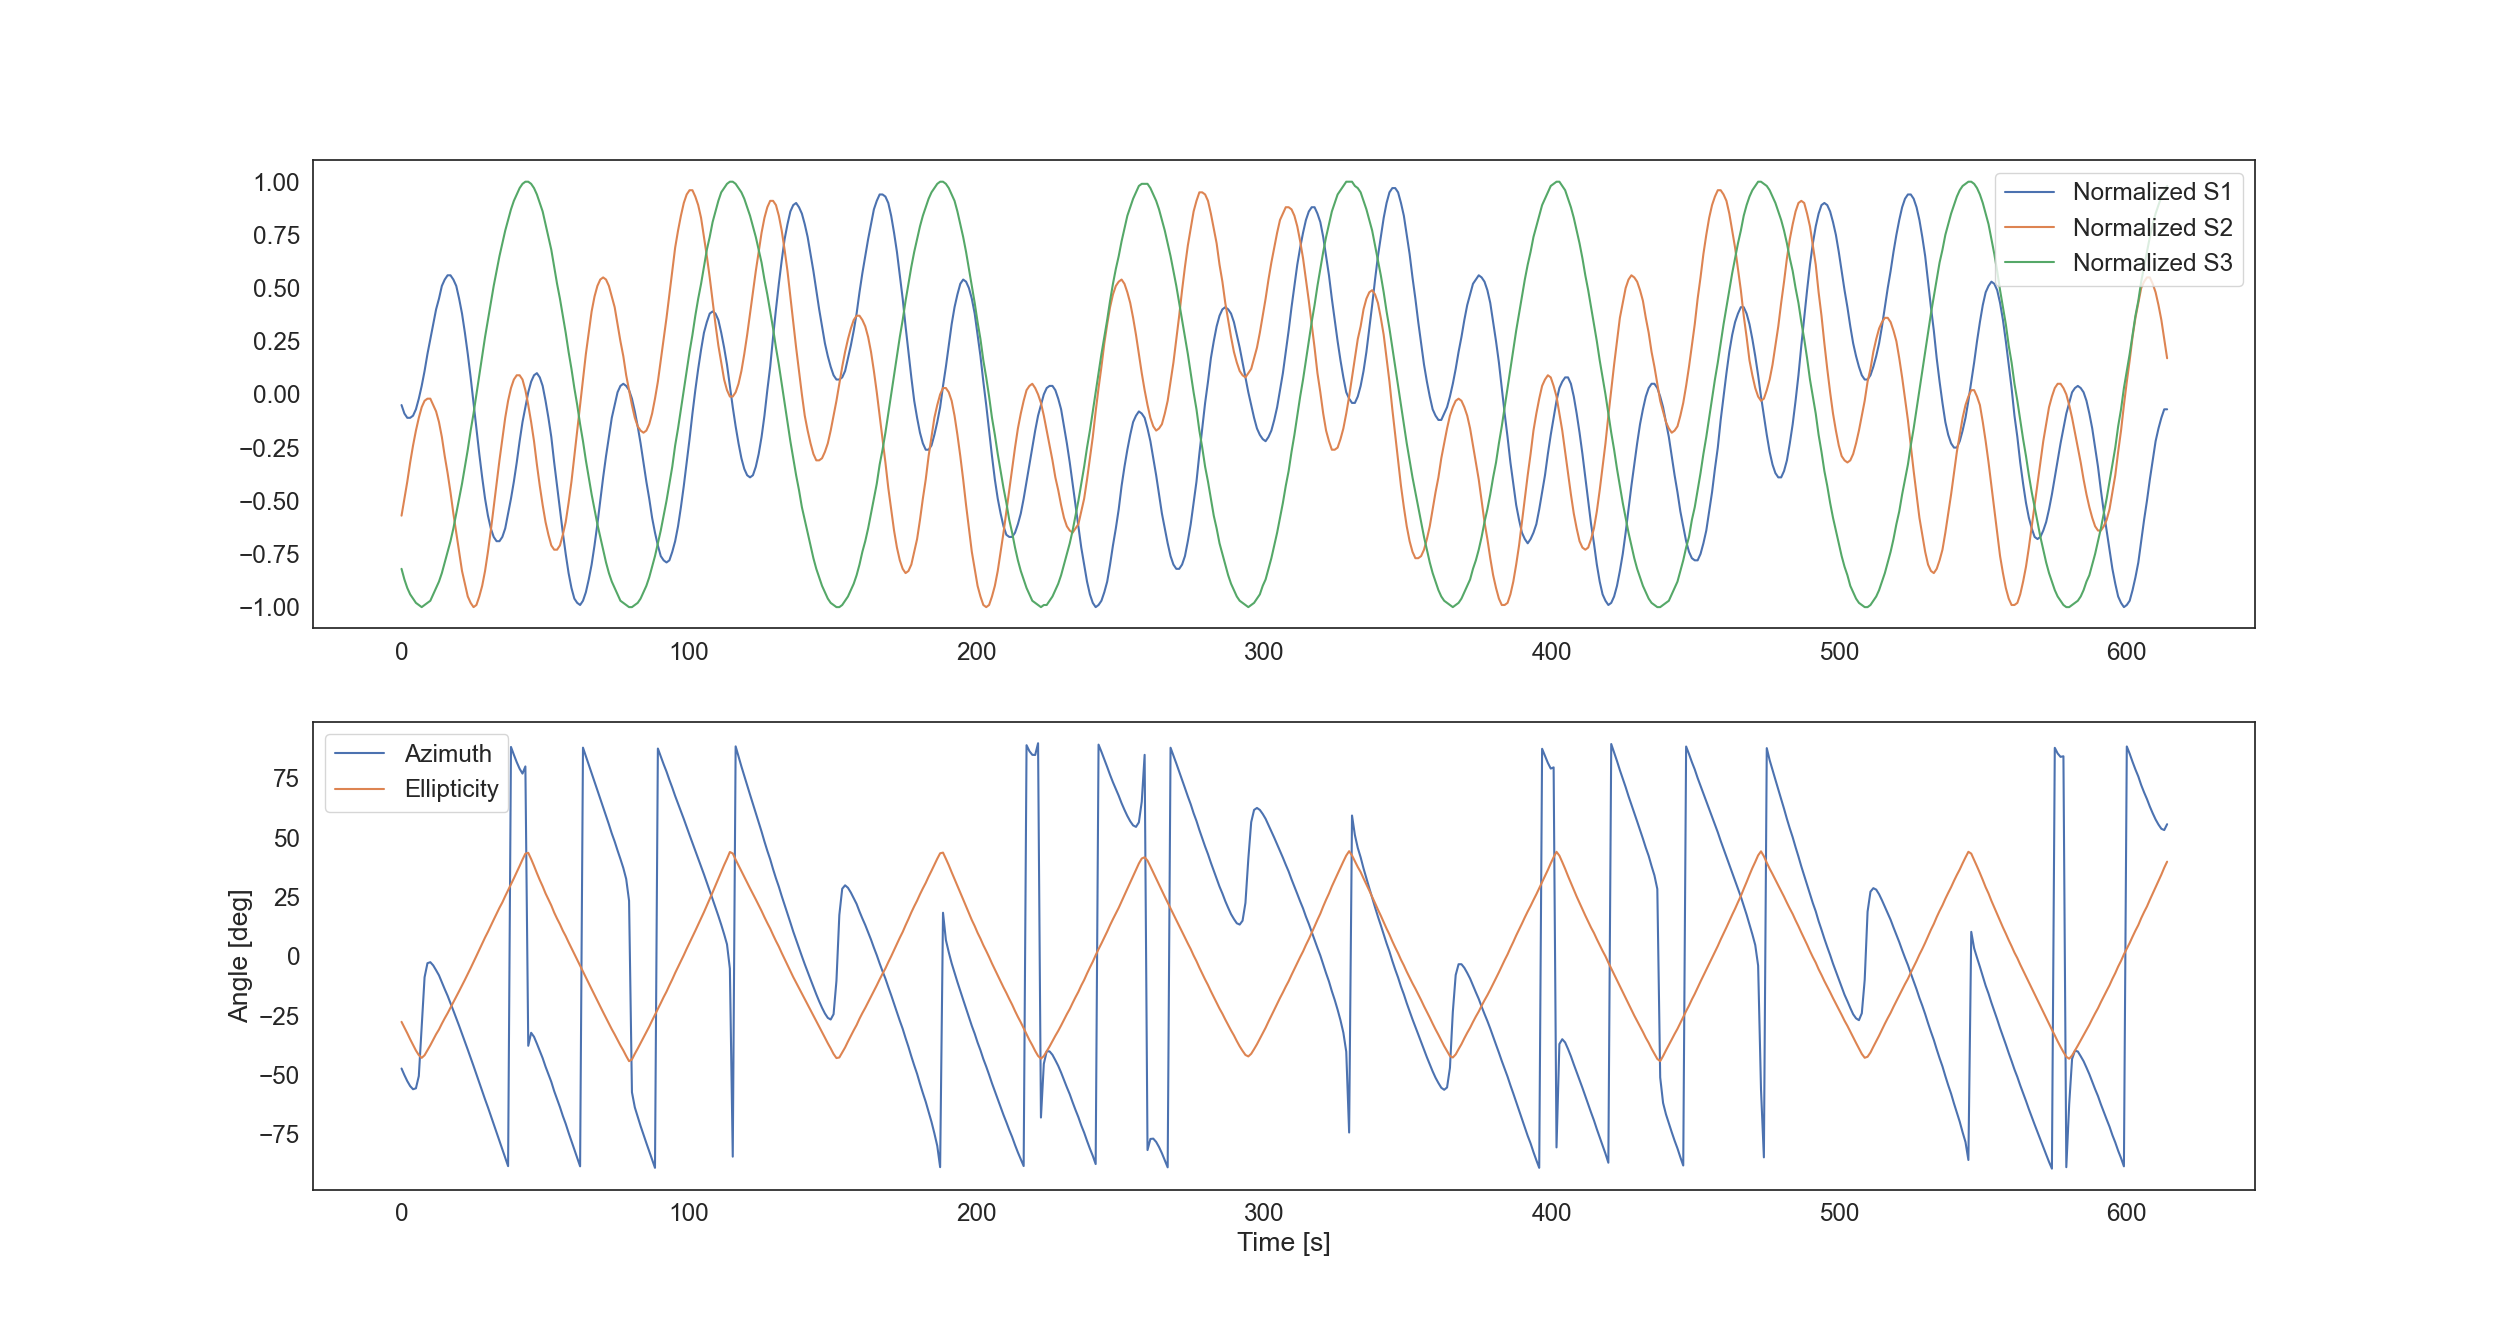
We then applied continuous rotation of QWP and HWP with a 5:6 Lissajous pattern.
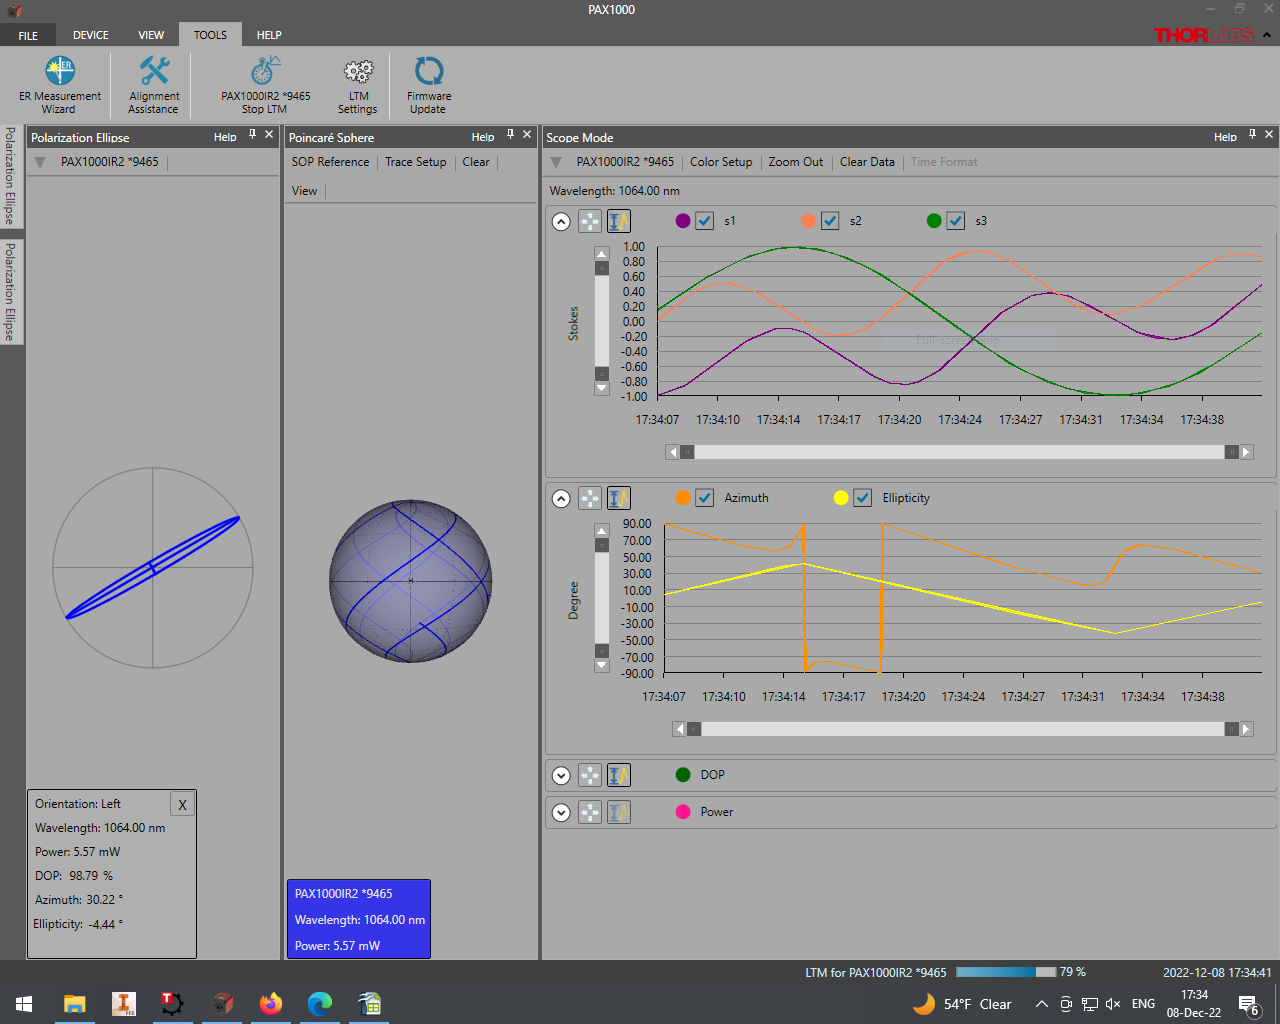
Fig 1 shows a screenshot of the camera software during this measurement where you can see the polarization state, Poincare sphere, Stokes parameters and ellipticity/rotation angles.
For now, we can save several parameters in csv and in figure 2 you can see the time evolution of some of them.
Check of LC
Finally, we wanted to install our 2 LCs.
We found that one of them is likely broken as it can not be recognized from the temperature controller out of the box.
We are in contact with Thorlabs to solve this issue
[Marc, Mitsuhashi, Shalika]
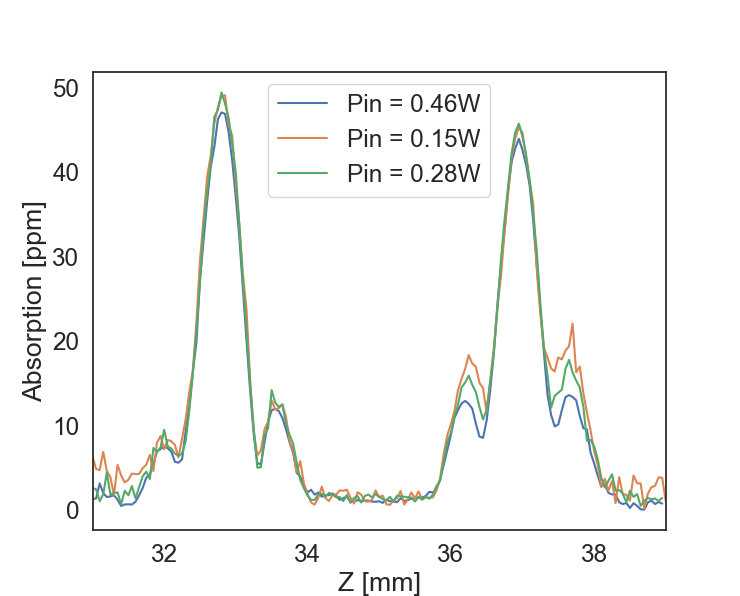
We installed the surface reference sample and did several z scans to optimize the translation stage and imaging unit positions.
In the end we found the best calibration factor R = 14.37/W with z = 38mm and z_iu = 69.5 mm.
We installed the half inch sample with HR side facing the laser source and optimized the (x,y) position to maximize the transmission (x,y) = (327.4,121.8).
Finally, we measured absorption with 3 different inputs power and measured the HR surface absorption to be about 45 ppm.
Shalika, Mitsuhashi-san
This elog covers the aspects of
1. Attempting to lock the cavity. We were able to lock the cavity for 10s.
Details:
After proper installation of the new mirrors, we observed the transmitted beam. We scanned the laser by providing a ramp temperature signal (see Fig 1). In the oscilloscope image the colors correspond to the following signals.
CH1-yellow--> Error Signal from mixer
CH2-blue-->Output from PD at Transmitted beam path
CH3-purple--> DC output from RF PD at FI
CH4-green--> Feedback signal from SR560
We then attempted maximizing the TEM00 mode by tuning the pitch and yaw of the cavity mirrors. Since we didn't have access to a camera sensitive to 1550 nm, we had to do the tuning intuitively. We tried maximizing the modes and at the end we were left with only one mode maximized, as in Fig 2. No mode was observed to be maximized at an amplitude more than this, and so we guessed that it could be the TEM00 mode. We then trying locking the cavity by providing the error signal as feedback to the laser. We were able to lock the cavity for 10s (See Fig 3)
How to lock the cavity (This is the approach we took and is also for anyone to refer who tries to attempt this in future for first time like us).
1.Make sure that you have tuned the mirrors to have reflected beam power (at the FI) to be maximum.
2.Observe the transmitted beam and Reflected beam using Photodiodes. The photodiode used to analyze the reflected beam is a RF PD. It has DC and AC output.
3.Scan the laser by providing a temperature ramp signal.
4.Initially you will see a lot of peaks corresponding to higher order modes in the transmitted beam (as in Fig 1). The zero-order beam is embedded among them, and the purpose is to tune the alignment of the mirror to maximize this and suppress other higher order modes as much as you can. Access to a camera can make this work easy, but in case if you don't have access, you may simply maximize all the beams. And at the end you will be left with only TEM00 mode maximized.
5.When you have obtained the most maximized beam (as in Fig 2), you may try to lock
6.Make the demodulation path using AC of PD, mixer and SR560.
a.Connect the AC of PD to F terminal of mixer.
b.Set the frequency of mixer same as EOM frequency using function generator (L terminal of mixer)
c.Provide the demodulation phase shift to the mixer (calculated using 2*pi*L/Lambda, where L is optical length after EOM)
d.The unfiltered mixer output from terminal I is the error signal. Filter the error signal and provide the output of filter is provided to another SR560
e.The above output is coupled with a DC offset voltage to provide feedback to the laser.
7.Set the temperature of the laser at which you observed the TEM00 mode during the scan.
8.Tune the offset voltage to see if the cavity can lock.
9.When the cavity is locked you would see the transmitted beam PD signal maintain a constant value same as that around the TEM00 mode amplitude level (as in Fig 3).
10.The error and feedback signal will be varying as an attempt to maintain the lock.
11.To increase the lock time keep tuning the mirror alignment, laser temperature and the offset voltage.
What we will do next:
We will try tuning the alignment, offset voltage and laser temperature to improve lock time.
Mitsuhashi, Shalika,
We installed the new cavity mirrors and the demodulate part.
• install the new cavity mirrors
The new cavity mirrors' ROC is the same as the previous one(ROC=50mm)
• install the demodulate part
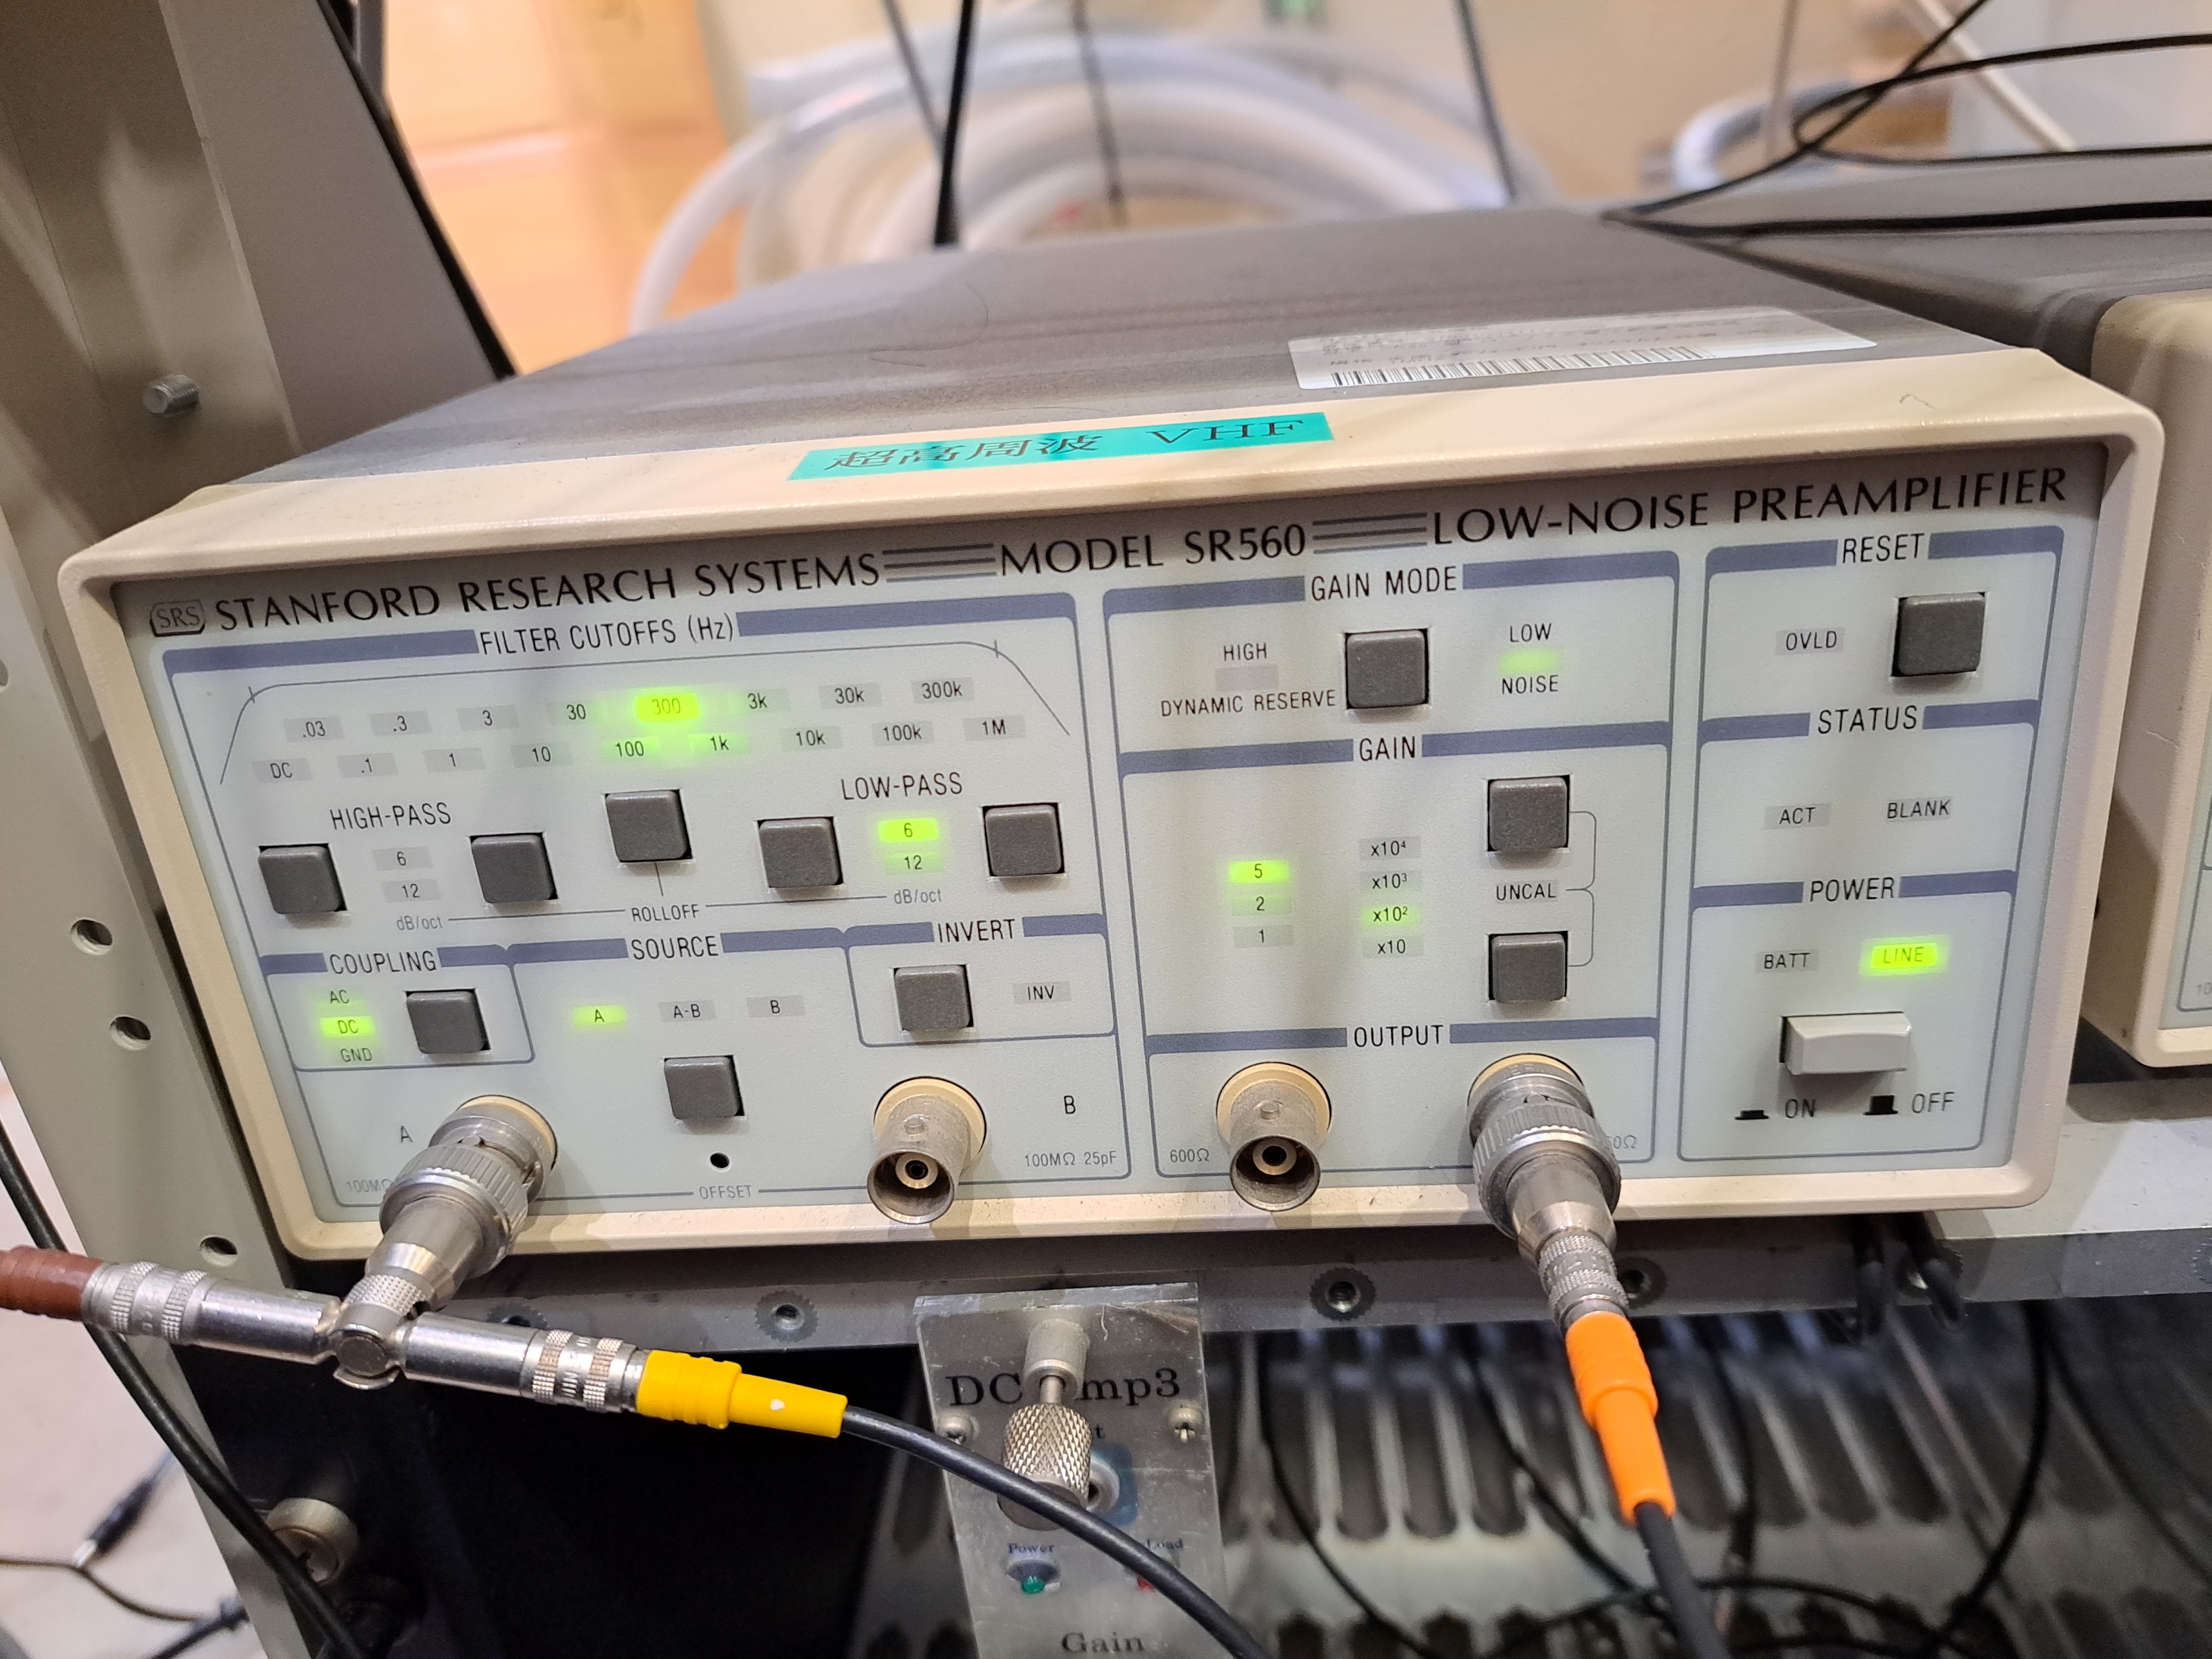
We install the preamplifier(SR560 made by Stanford Reserch System), the local osillator(AFG1062 made by Tektronix), and the mixer(ZAD-1-1+ made by Mini-circuits) to demodulate the beam.
The setup of the local oscillator's phase was 85°.
The setup of the preamplifiler was as follows(The picture was attached).
| filter cutoffs[Hz] | 300 |
| low pass [dB/oct] | 6 |
| gain mode | low noise |
| gain | ×500 |
[Marc, Mitsuhashi, Shalika]
We plan to use the 120 * 180 cm optical table down the stairs in TAMA to install the heterodyne WFS scheme and compare several birefringence measurements schemes.
First, we removed all the installed setups : the scatterometer optics have been placed in a box (all are for 633 nm) placed in storage room; the scattering calibration setup has been placed together with the other optics/ components of this setup; the small clean booth is now in storage room, and the u-shape optical breadboard was placed closed to the end mirror of TAMA IMC.
Then, we also brought several unused TAMA optics and mounts that are now stored in a plastic rack nearby the optical table.
We installed the laser source at the expected position (note that it starts to emit with 0.7A and we are currently using it with 0.8A that corresponds to about 72mW).We installed a QWP, HWP, a f=50mm lens and an old FI from the FDS experiment (from QIOPTIC in the FC wiki). After tuning the QWP and HWP angle we had about 93% transmissivity.
The plan will be to use the heterodyne WFS LO beam as a pick-off beam to compare the various birefringence measurement techniques while using the main laser beam path to start the cavity lock activities.
Nishino,Mitsuhashi,Shalika
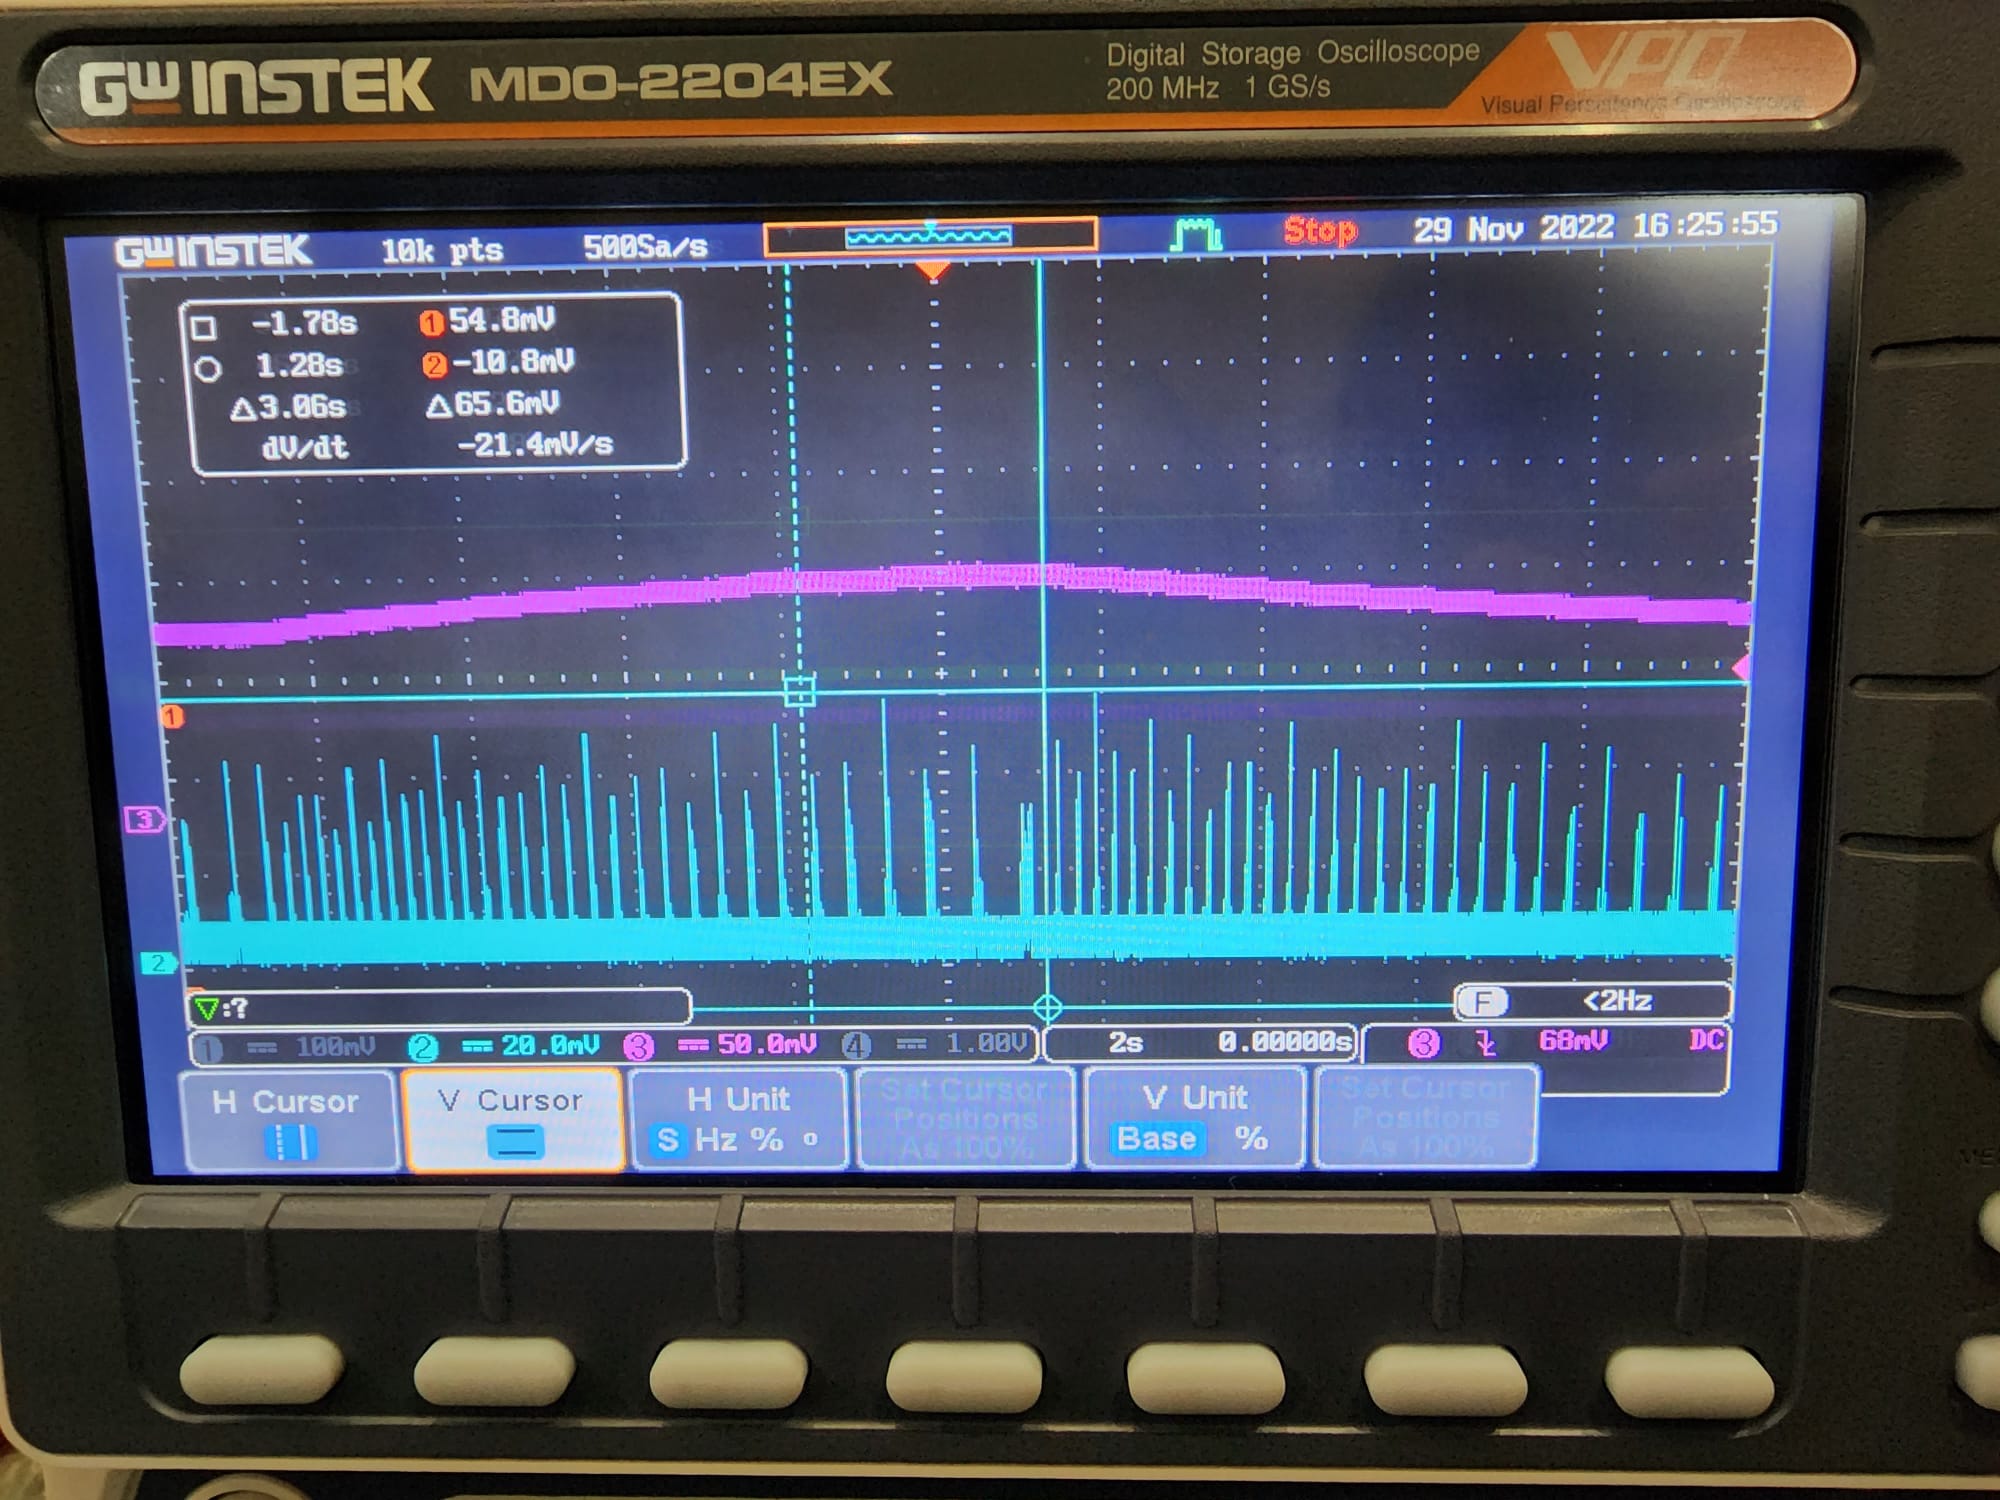
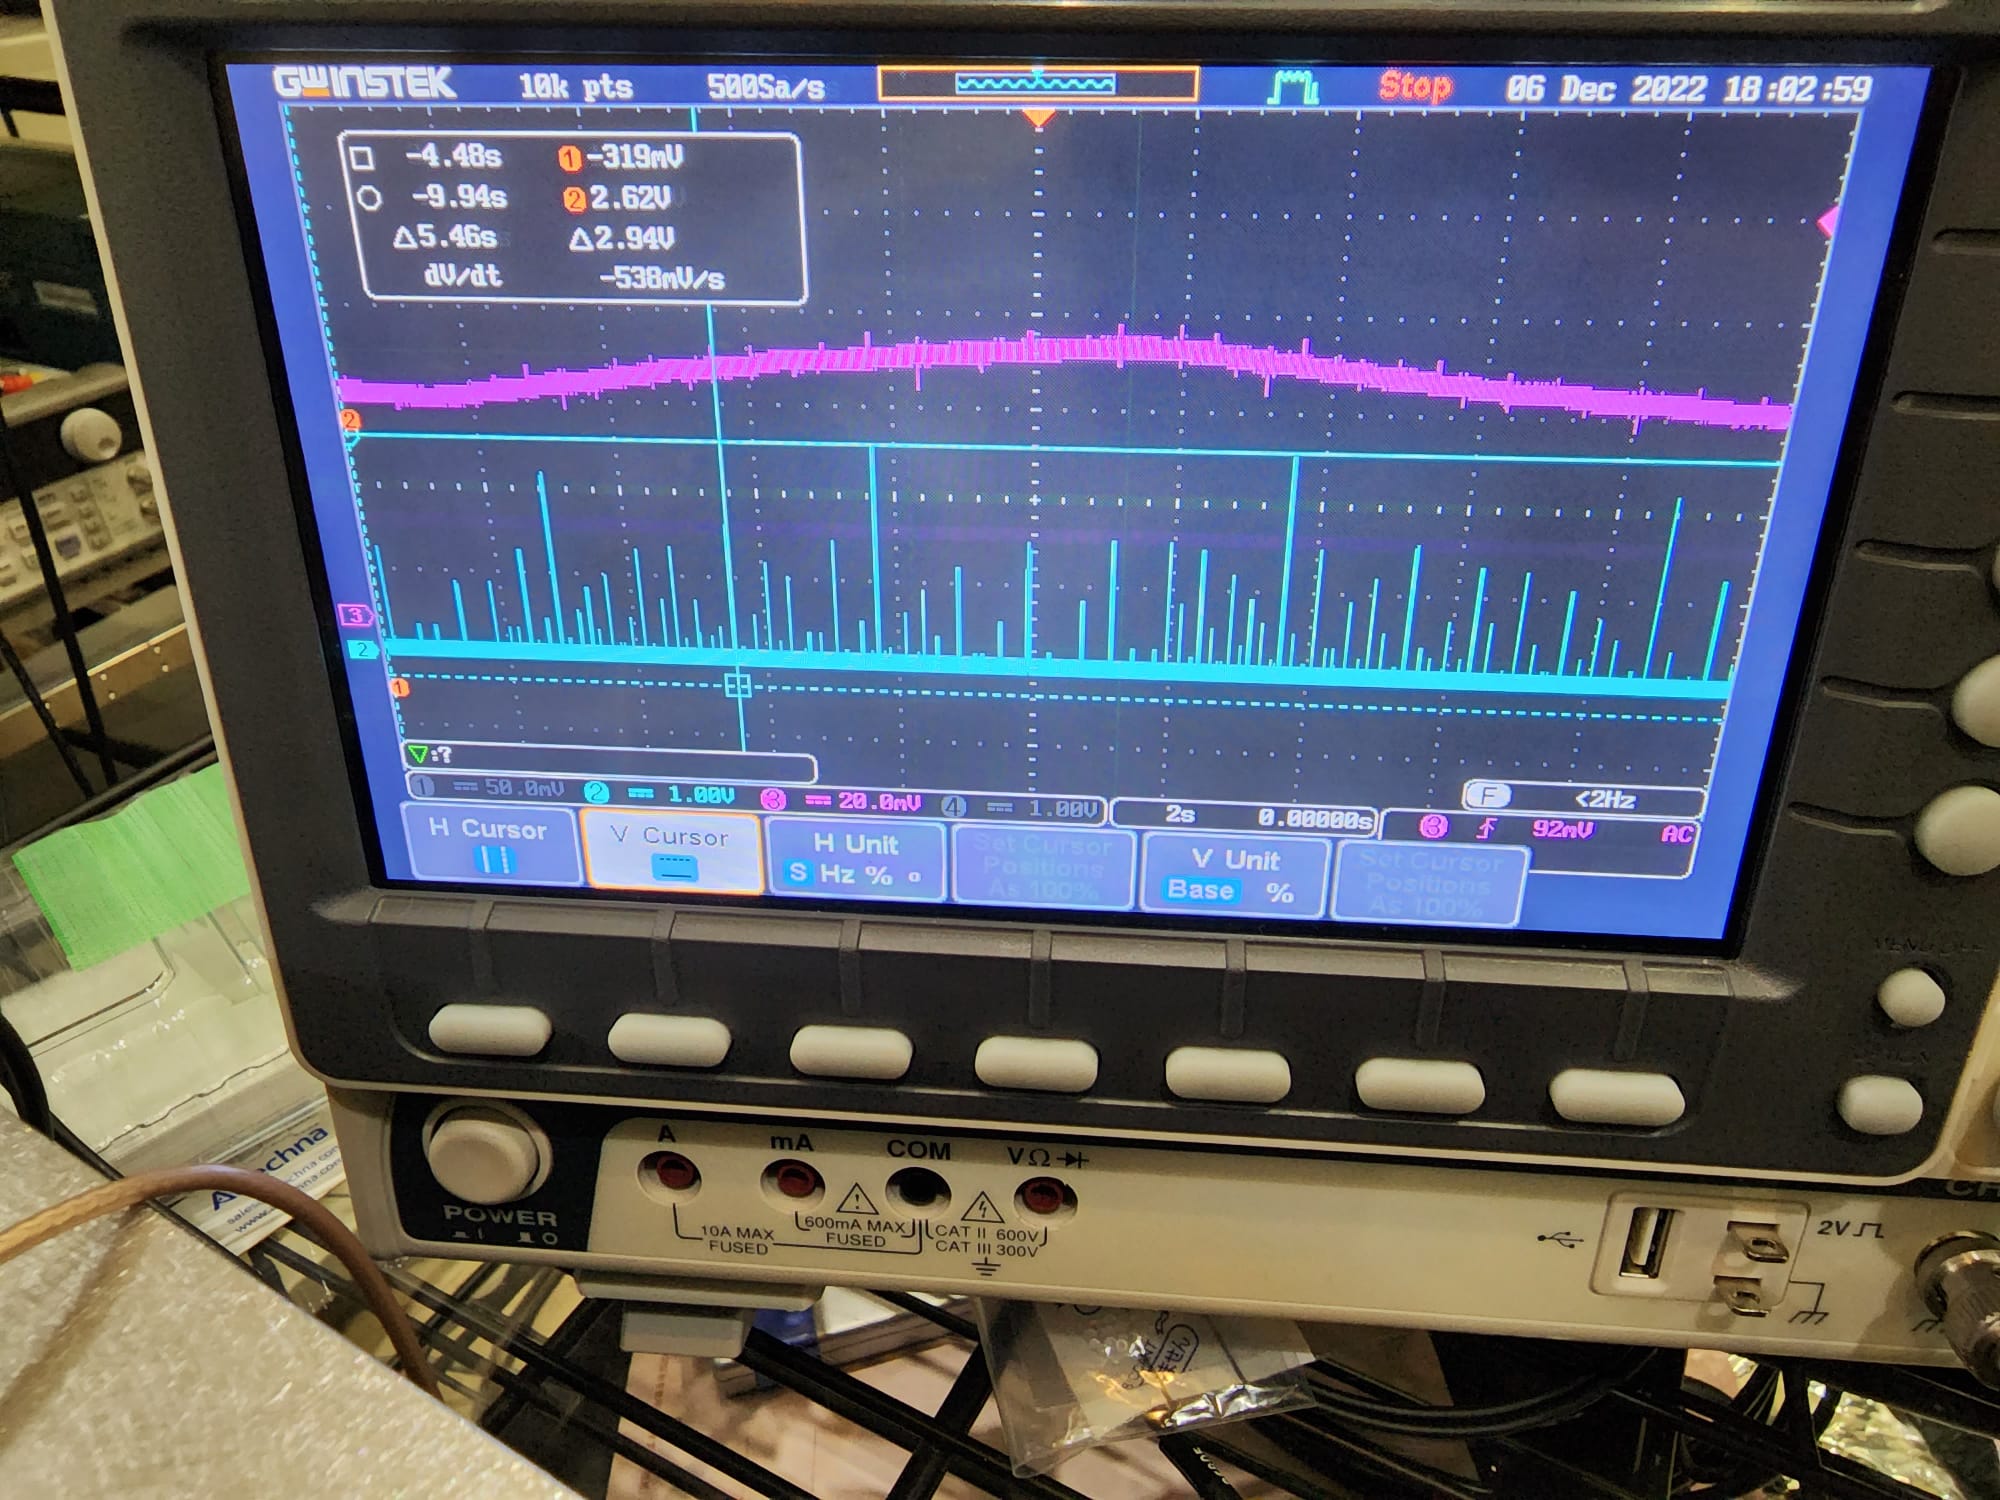
What we did:
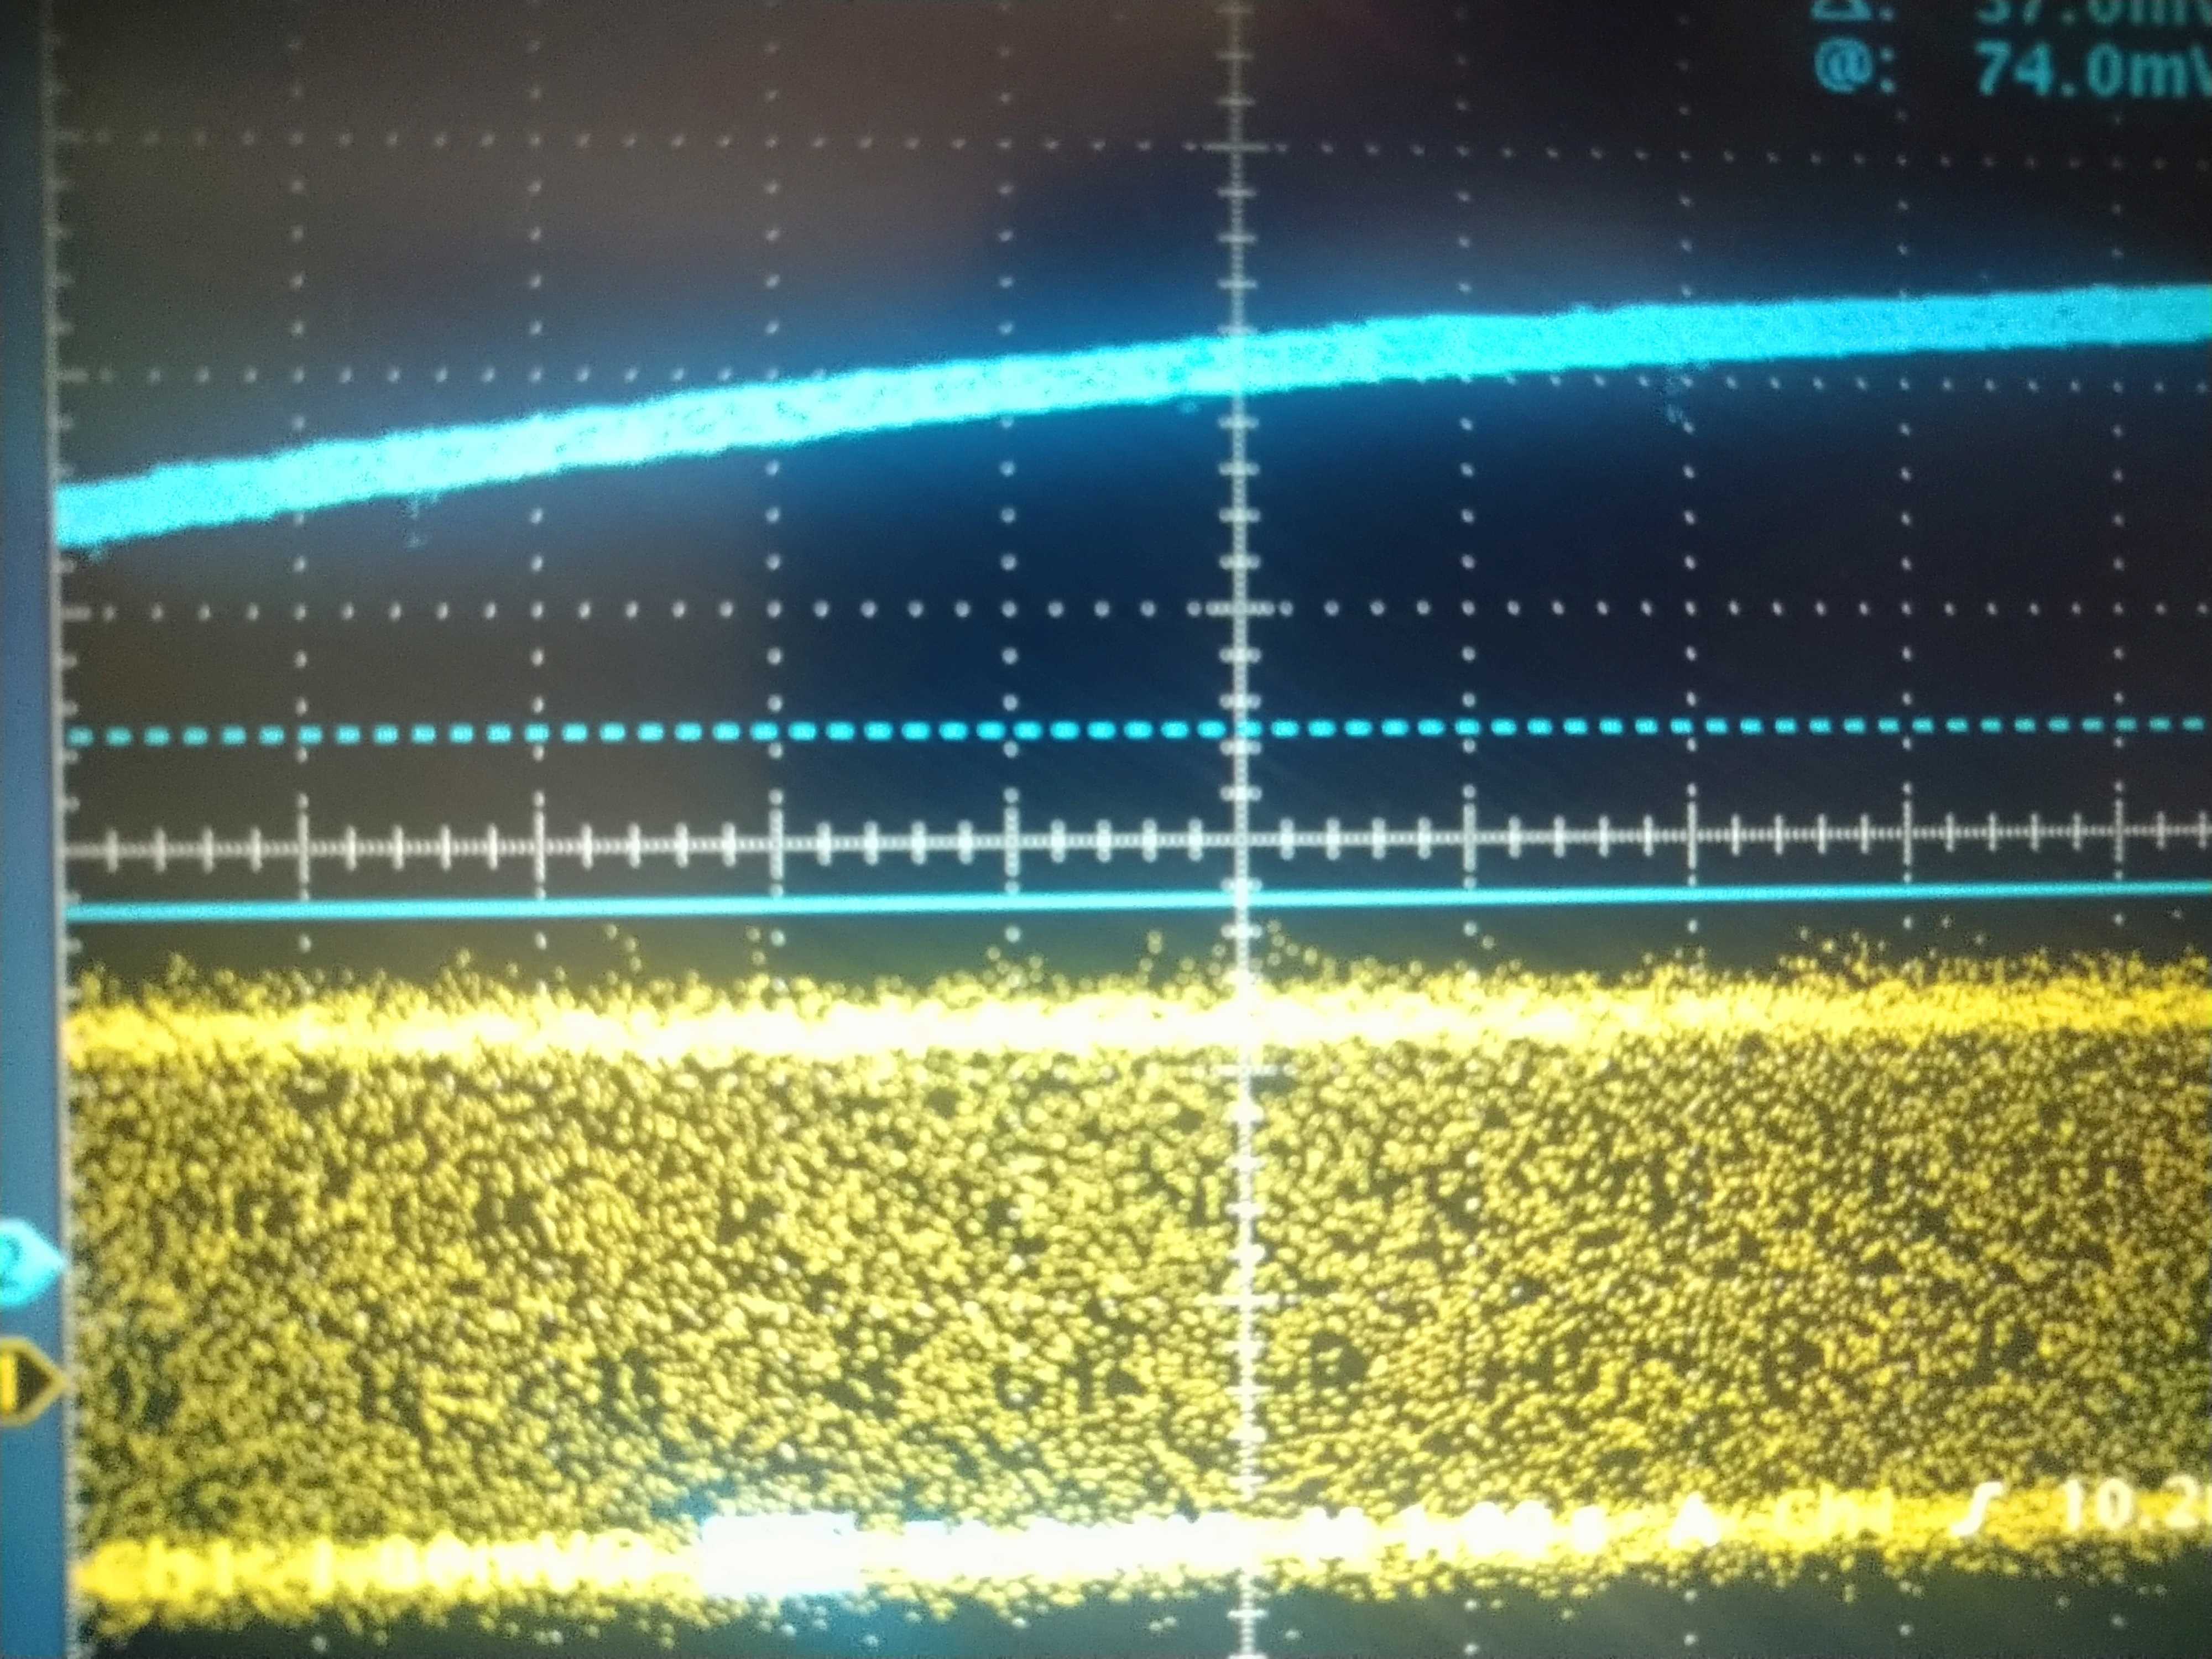
We modelated a lazer frequency to observe the resonance of the cryogenic cavity, and checked the reflected beam power.
As a result, we can't observed the resonance of the cavity at all.
The picture of a oscilloscope was attached when we modulated a lazer frequency. The blue line is the reflected beam power.
What we will do next:
We optimize the mirror angle and the lens position.
[Marc, Nishino]
We restarted the probe and pump laser sources.
When we tried to move the translation stage it tried to move to crazy position so we stopped the LabView motion and manually brought the translation stage close to the home positon.
Then we home the translation stage with Zaber.
After that, we could properly move the translation stage.
We tried to measure the surface reference sample at the previous good position but got lower calibration factor than expected (about 12.2/W).
We slightly changed the sample z position and the imaging unit position but could not really improve the calibration factor meaning that the alignment might have drifted.
I tried to restart the standalone and controls pc after the electrical shutdown but could not get any signal in medm.
I found that the timing signal generator was also resetted.
I turned off the standalone PC, recovered the correct timing signal parameters( as from elog 1537 ie square wave at 65536 Hz, level 2.5 V, offset 1.25 V) then turned on the timing signal once the standalone pc was on.
After that, I could get the usual readout in medm screen so I restored the snapshot that was saved just before the shutdown.