NAOJ GW Elog Logbook 3.2

Participaint: Aritomi, Chienming, Eleonora, Shurong and Yuhang
At the beginning, we want to do like this. Scanning green beam phase with a 1Hz, 1.5Vpp ramp signal. Then adjusting MZ offset to have different power going to OPO. Lock p-pol and adjust PLL to make both p and s-pol resonant. Locking OPO by p-pol. Sending green. Measuring OPO s-pol(BAB) transmission DC to see the parametric amplification and de-amplification.
1. Today's change: For making sure we are locking OPO at resonance. We set up a DC/RF photo detector for OPO s-pol transmission.
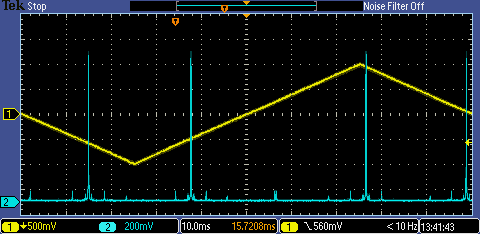
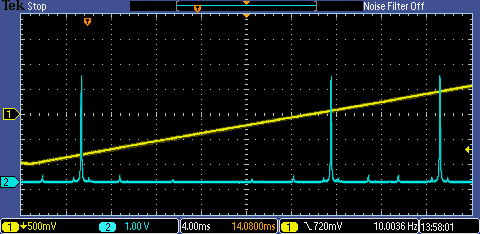
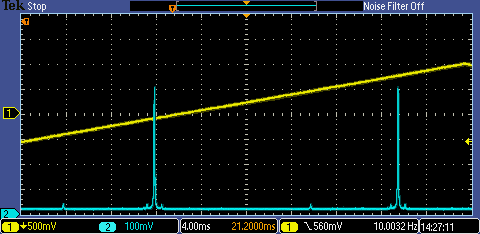
2. Lock OPO with p-pol, found demodulated s-pol transmission RF oscillating at 1Hz. The RF signal before demodulation oscillates at 15MHz with an amplitude modulated at 1Hz.
3. The green injection changes the co-resonant condition. We guess this is because of temperature change. See attached picture 1.
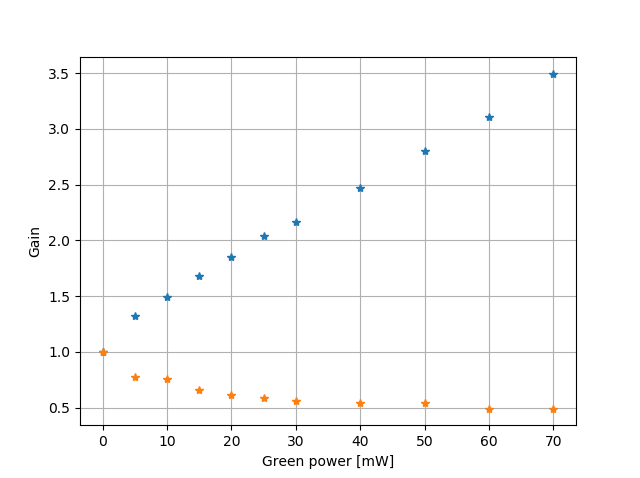
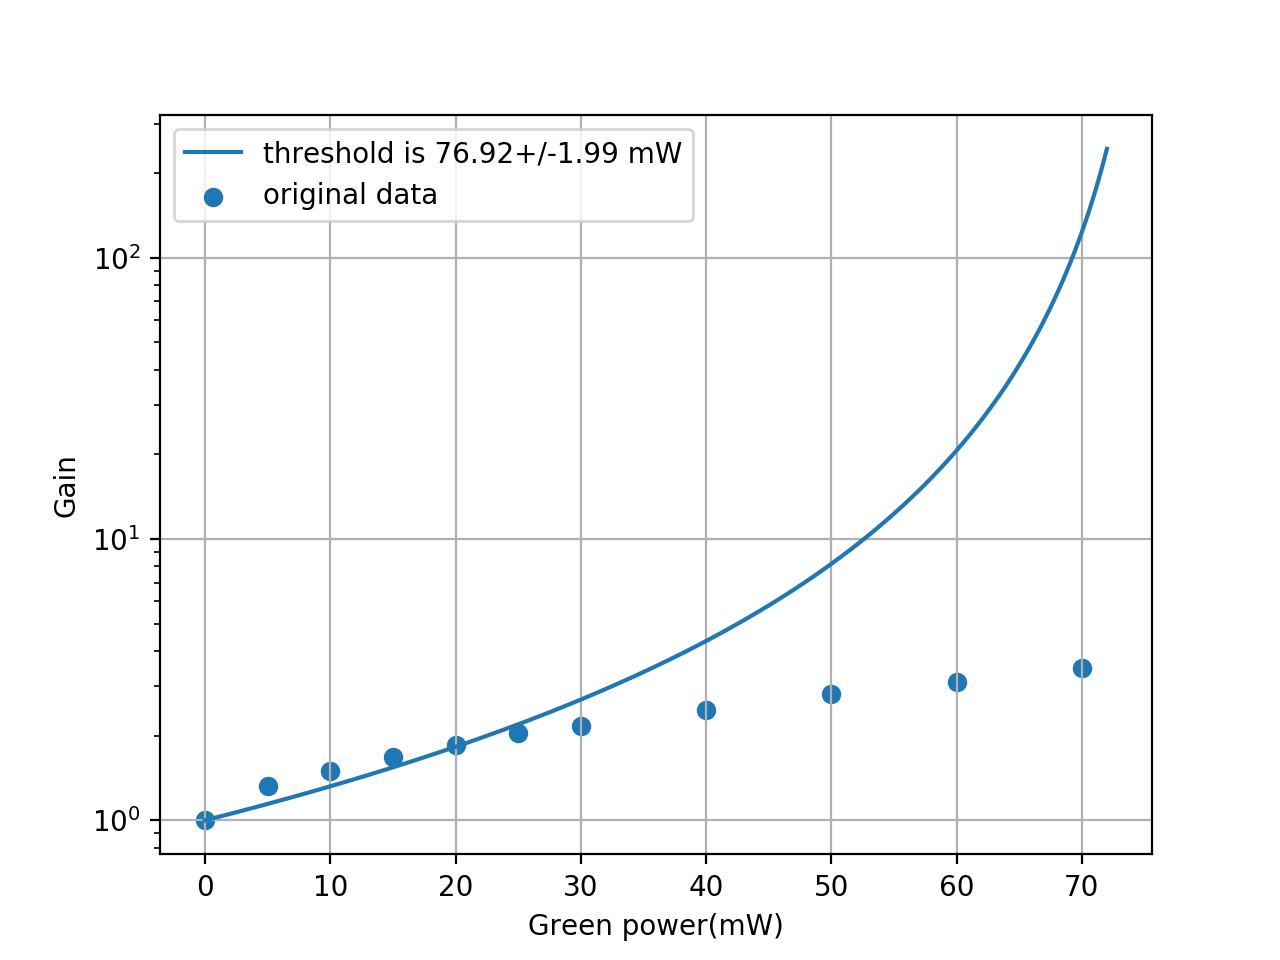
We did like this finally. Manually put the transmission of the seed beam on maximum pk-pk. Don't use p-pol lock and PLL. For different pump power, we measured the amplification and deamplification. See attached figure 2. We did the fit and found the threshold now should be around 140mW.
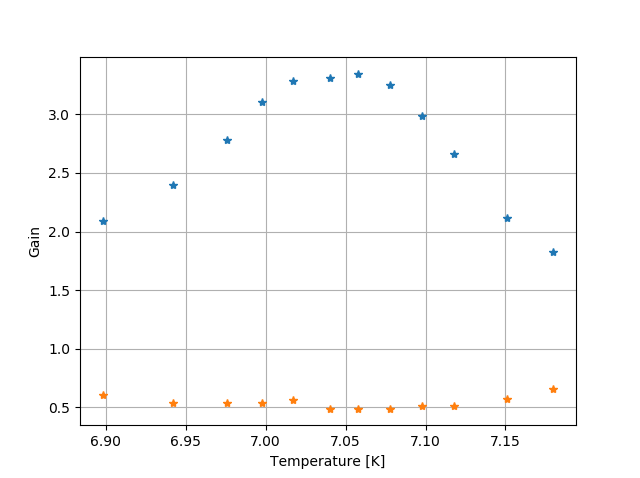
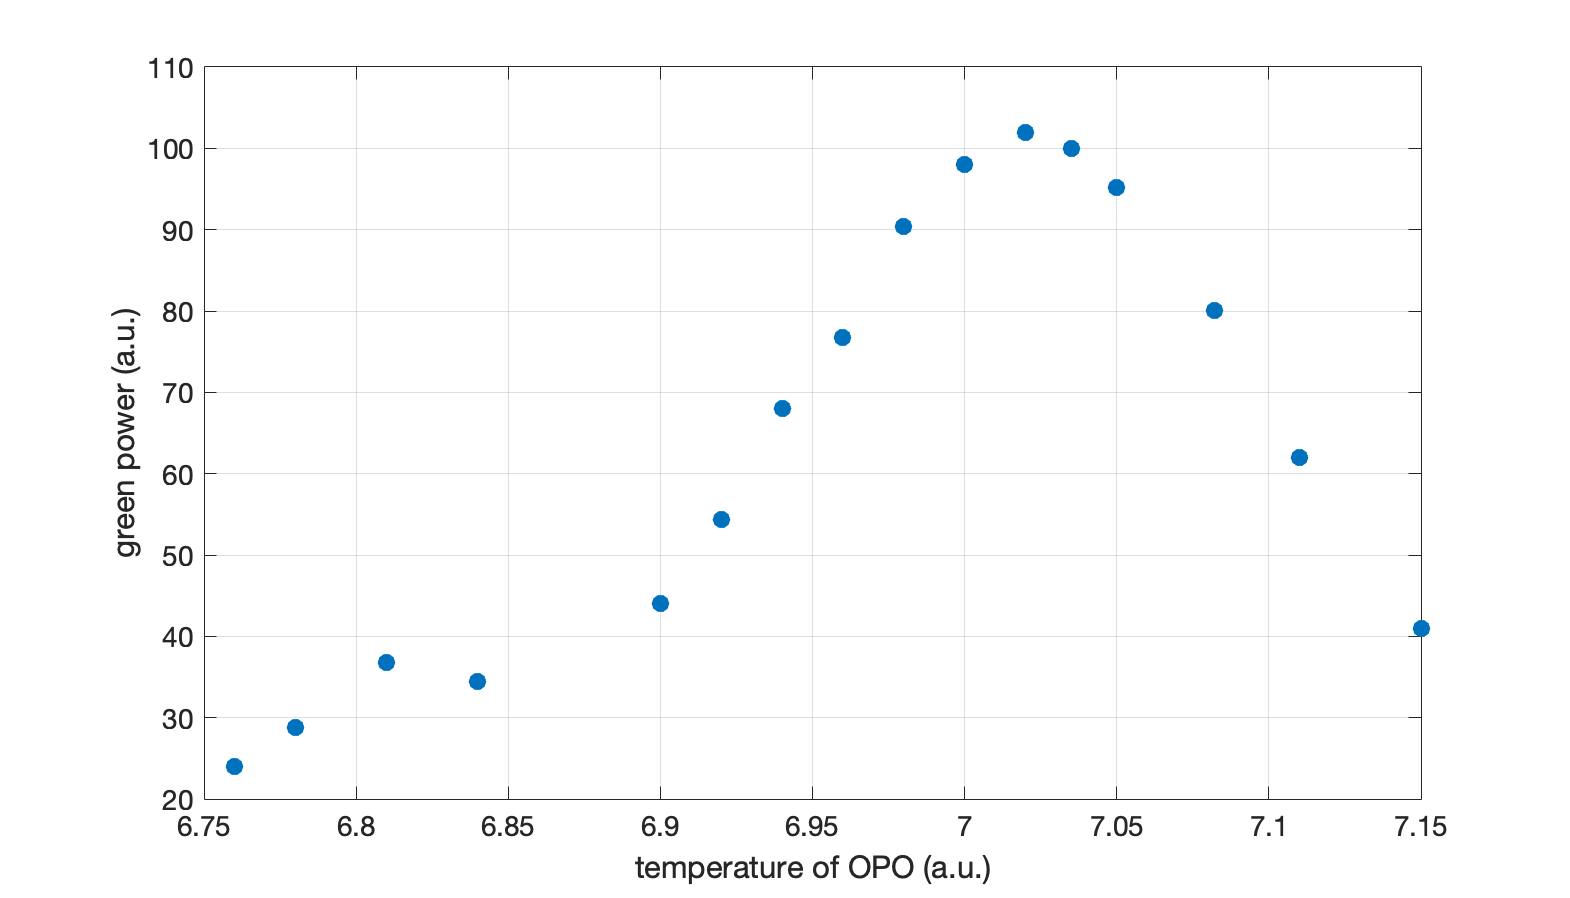
Since we know the green changed the temperature of OPO crystal, we also checked the temperature influence. For a green power of 60mW, we changed temperature from 6.9kOm to 7.2kOm. Now the optimal temperature seems to be 7.06kOm, which is 0.04kOm far from previous optimal temperature 7.02kOm. However, the influence of temperature change caused by green power seems not crucial. In any case, the non-linear crystal is still working in the broad optimal region.
However, we decided to check the matching.
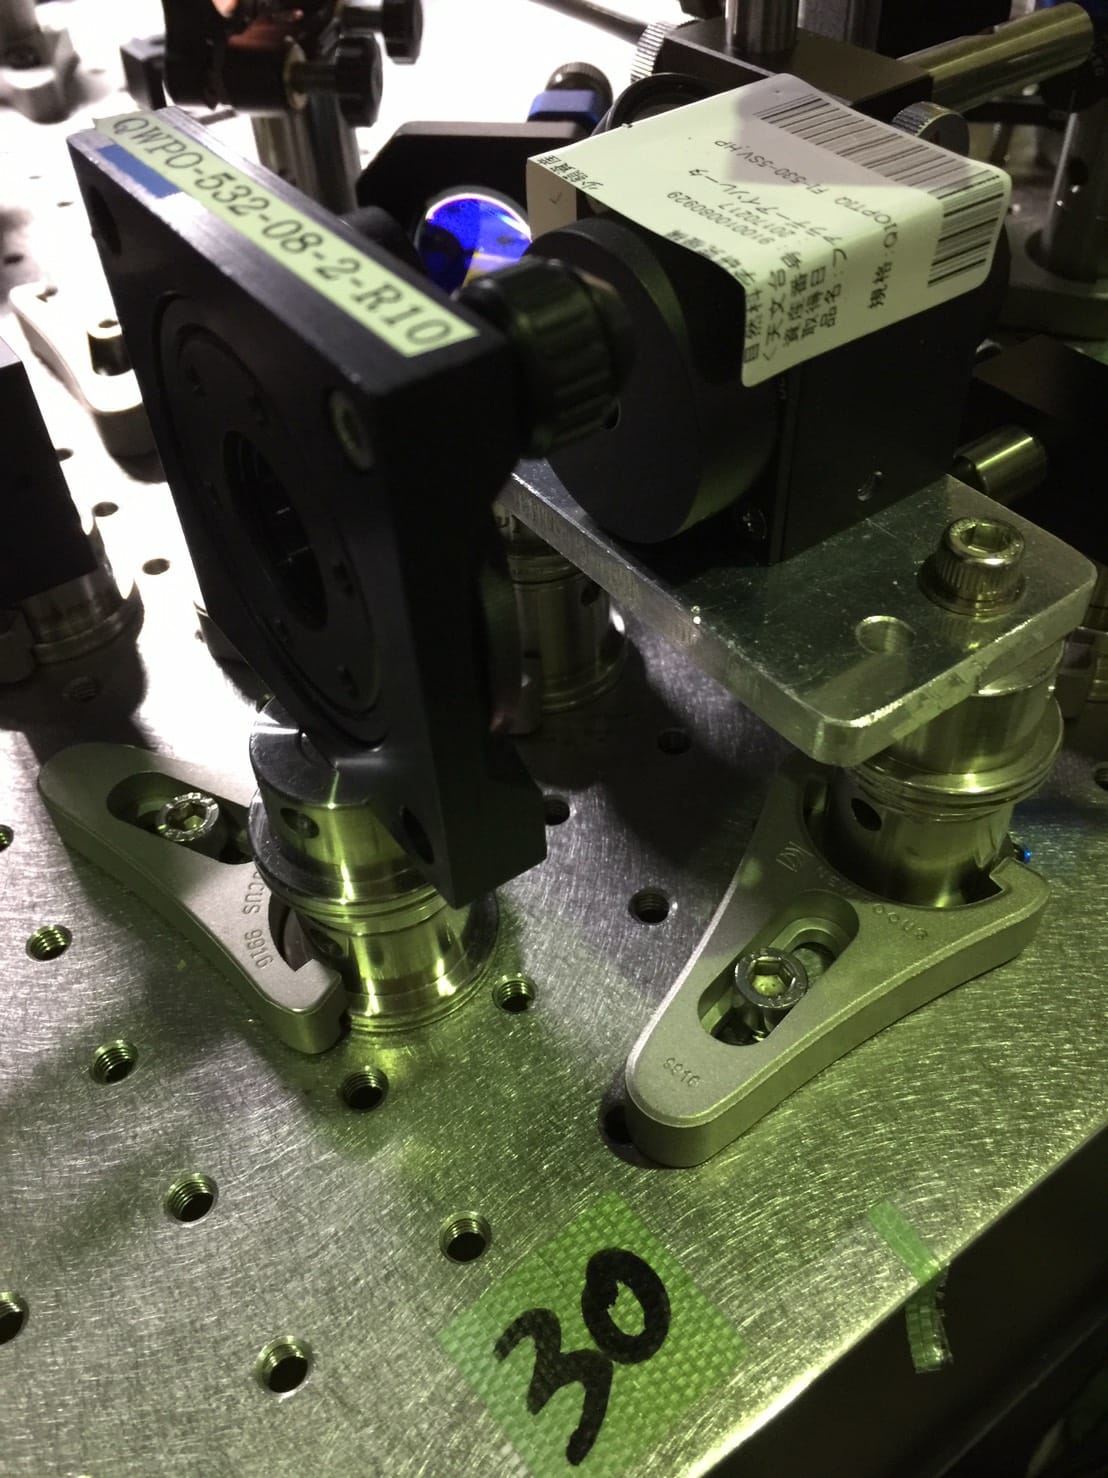
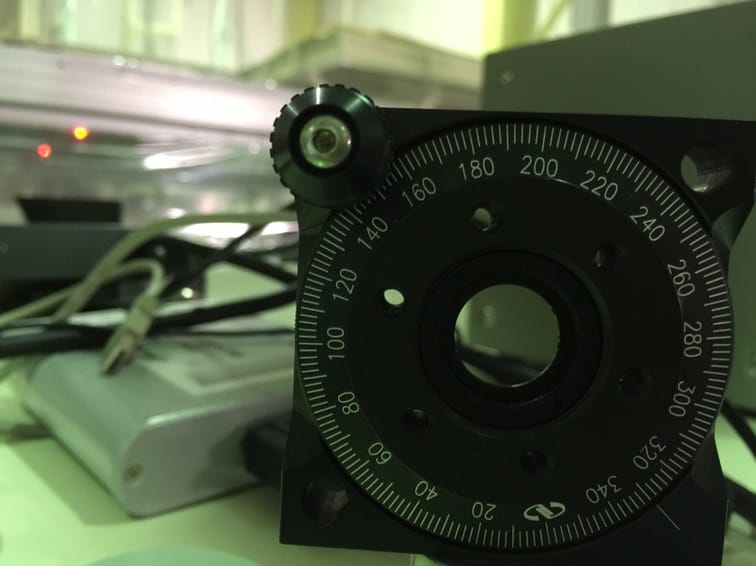
Since we could not find any spare half-wave plate for 532 nm, we have temporarily removed that placed just after the last green faraday isolator, before the filter cavity.
We use it to operated the green mode cleaner in p-pol. The value of the angle in the original configuration is shown in pic 2.
We will need to buy (or find) some new ones.
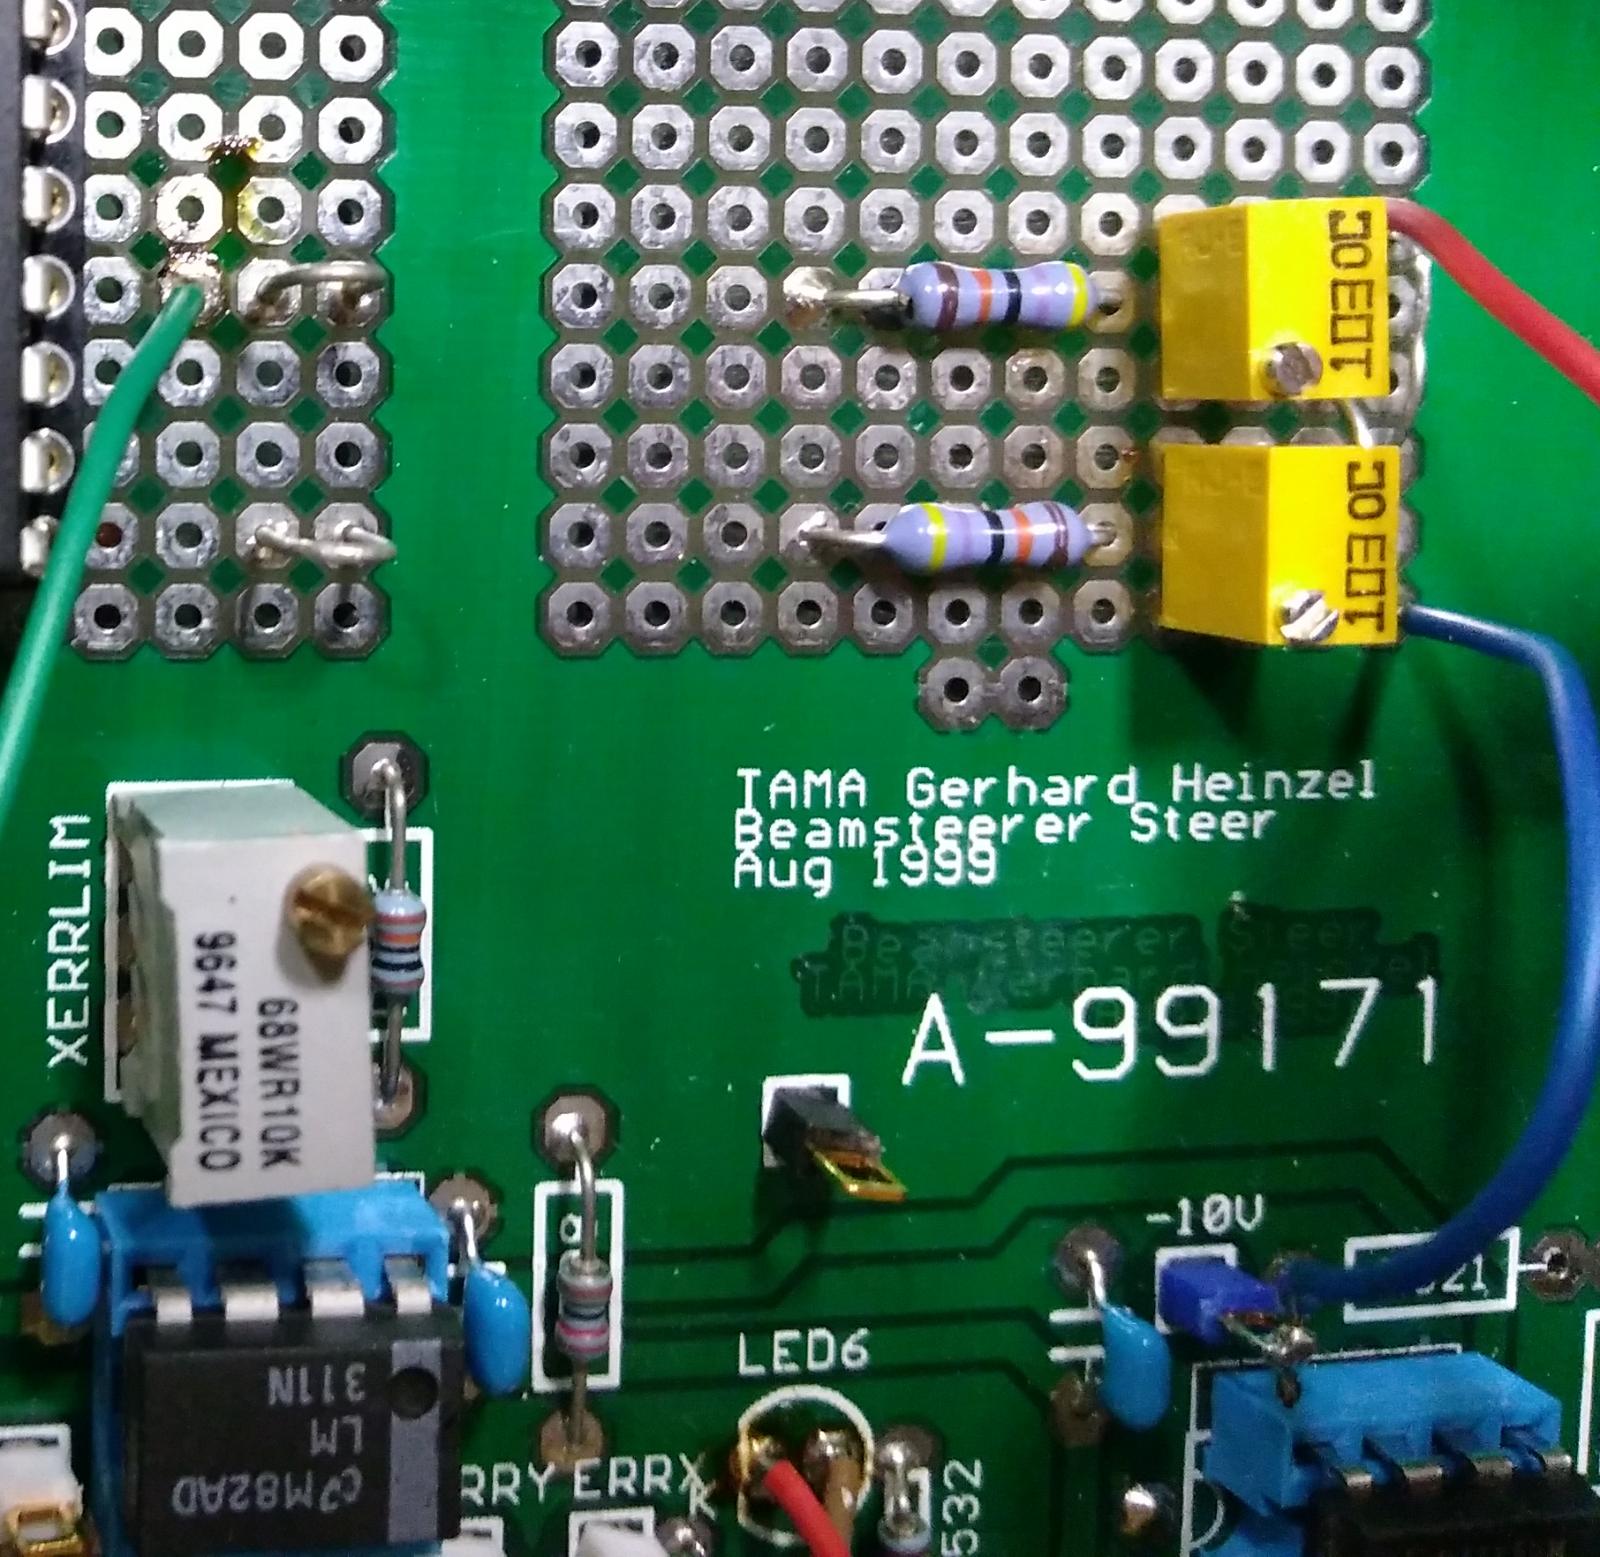
We did more detailed test to the board last week.
Since last week when we powered up the board with NIM rack, it heated up very soon and had some bad smell. Just in case the NIM rack we have doesn't give the right power and may cause some damage, this time we powered up the board with external power supply. The first problem we found out, it is the 8V power supply of this board which give power to drive the galvo, has a much large current than it is supposed to be, that is also the reason why they board heat up so soon we guess.
At the beginning, we just powered up the 20V part of the circuit, and sent a sine wave instead of the quadrant signal to A,B,C,D port one by one. By checking each check-point inside the board, we could see clear sine wave.
Then we powered up also the 8V part, the signal at the check-point started to have high frequency oscillation in MHz range. We traced it back, found out the oscillation was already there since the beginning of this path.
When we wanted to do more investigation of the problem, we were looking for some checking point on the board according to the design, but we could not find them. So we checked the date written on the board, it has been done in Aug 1999, but the design was finshed later than that, so we guess there may be newer version of this board in TAMA and they could have better performance than the one we have in Nikhef now.
[Yuhang, Eleonora]
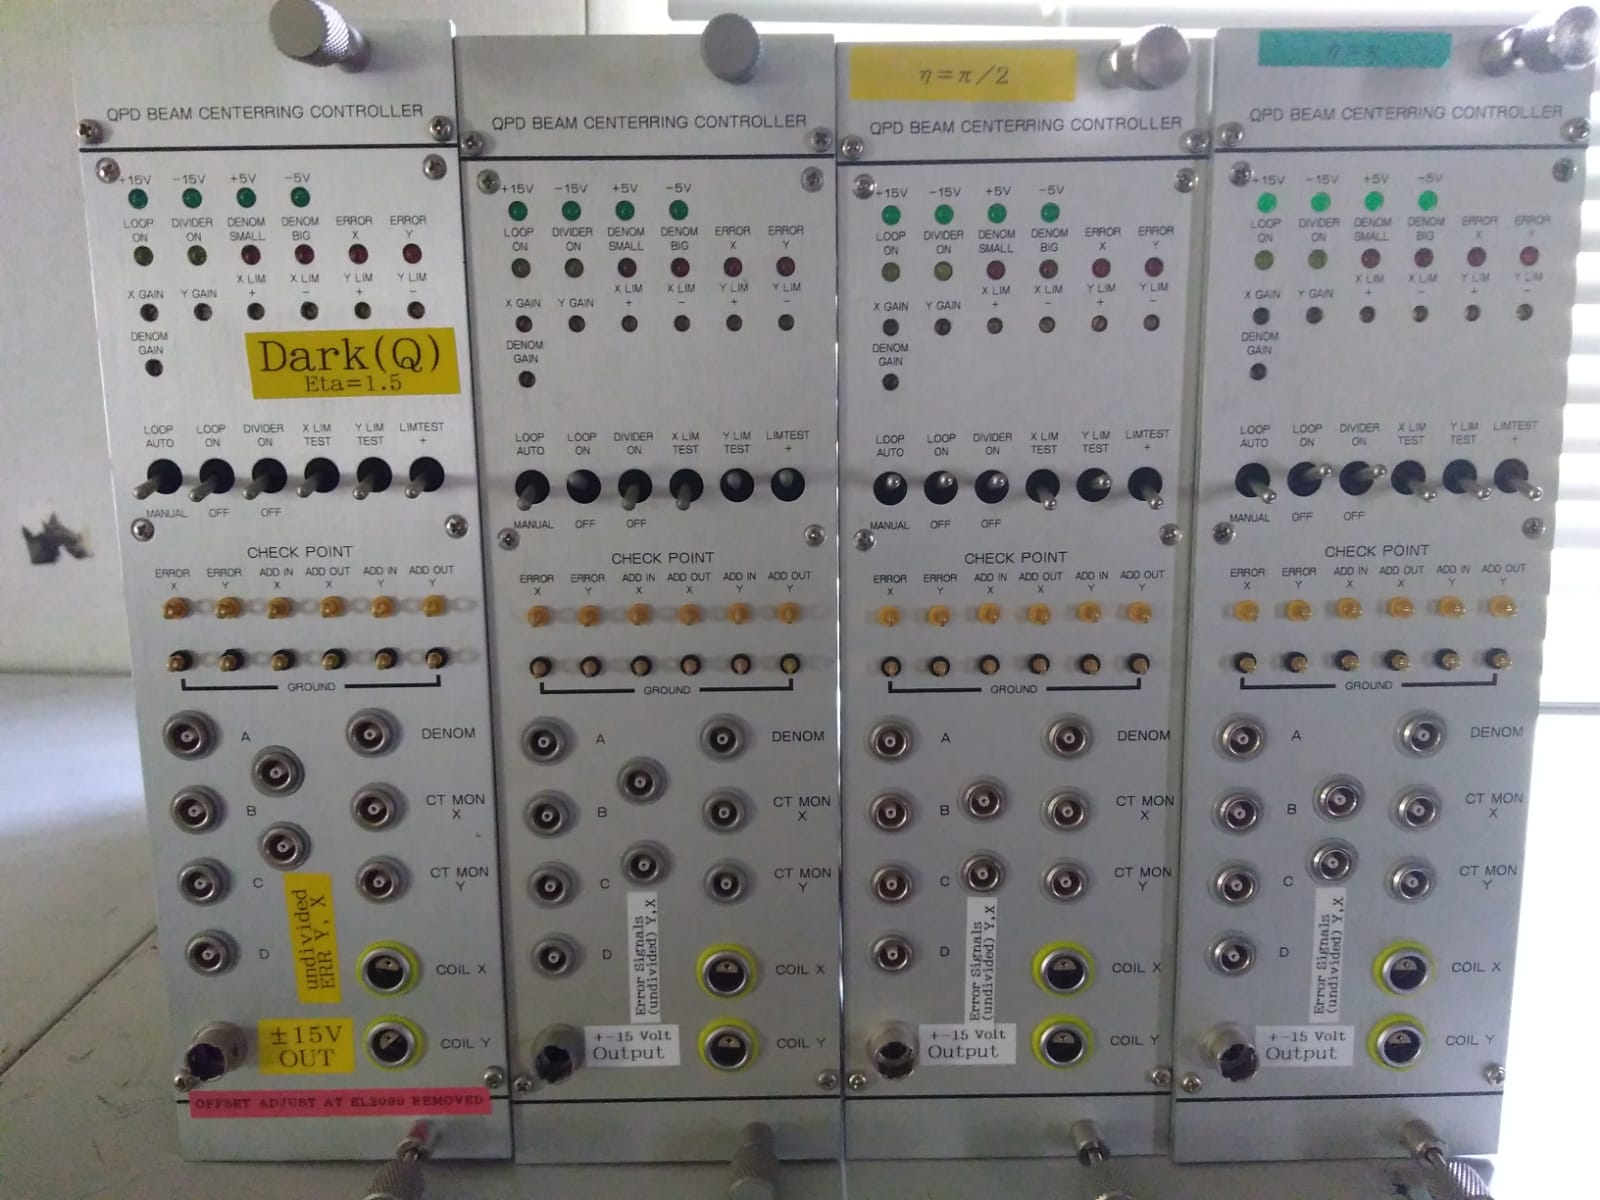
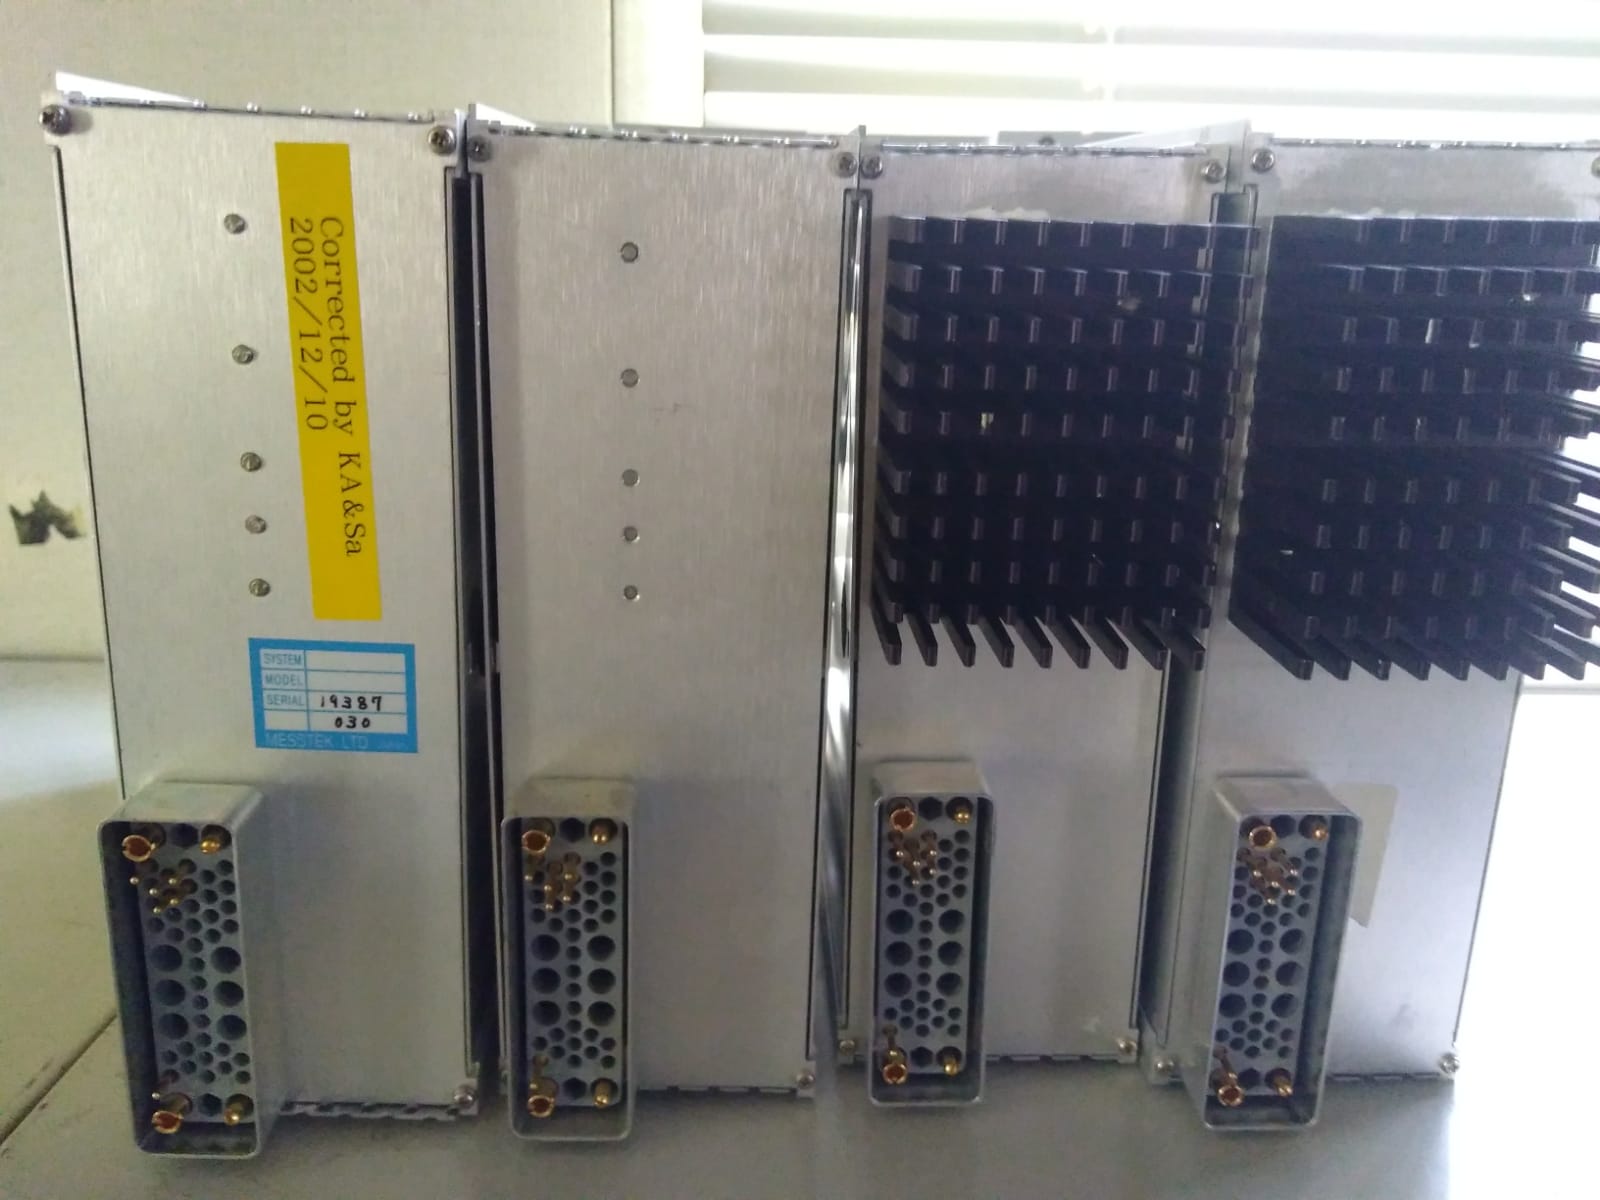
We found four more boards for the galvo control. Two of them were in the shelves of TAMA entrance, the other two (those on the right in pic1) were installed in one of the TAMA injection rack
All the board are dated Aug 1999 (see pic 3) but one reports the writing "corrected by Koji Arai & Sa 2002/12/10 " (see pic 2)
See entry #831 for more details about galvo and boards.
Participaint: Matteo and Yuhang
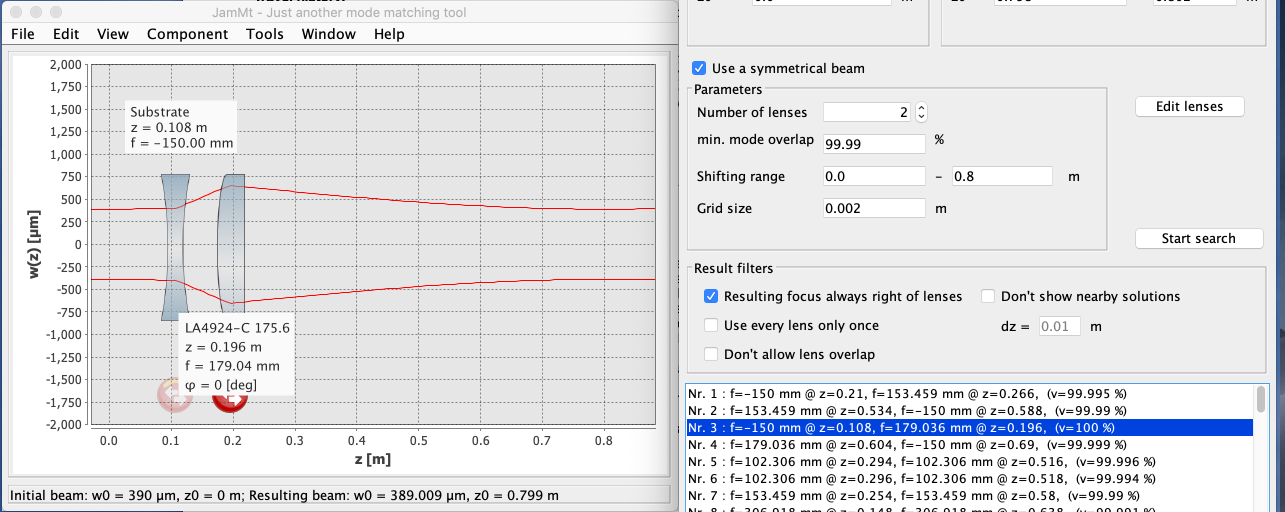
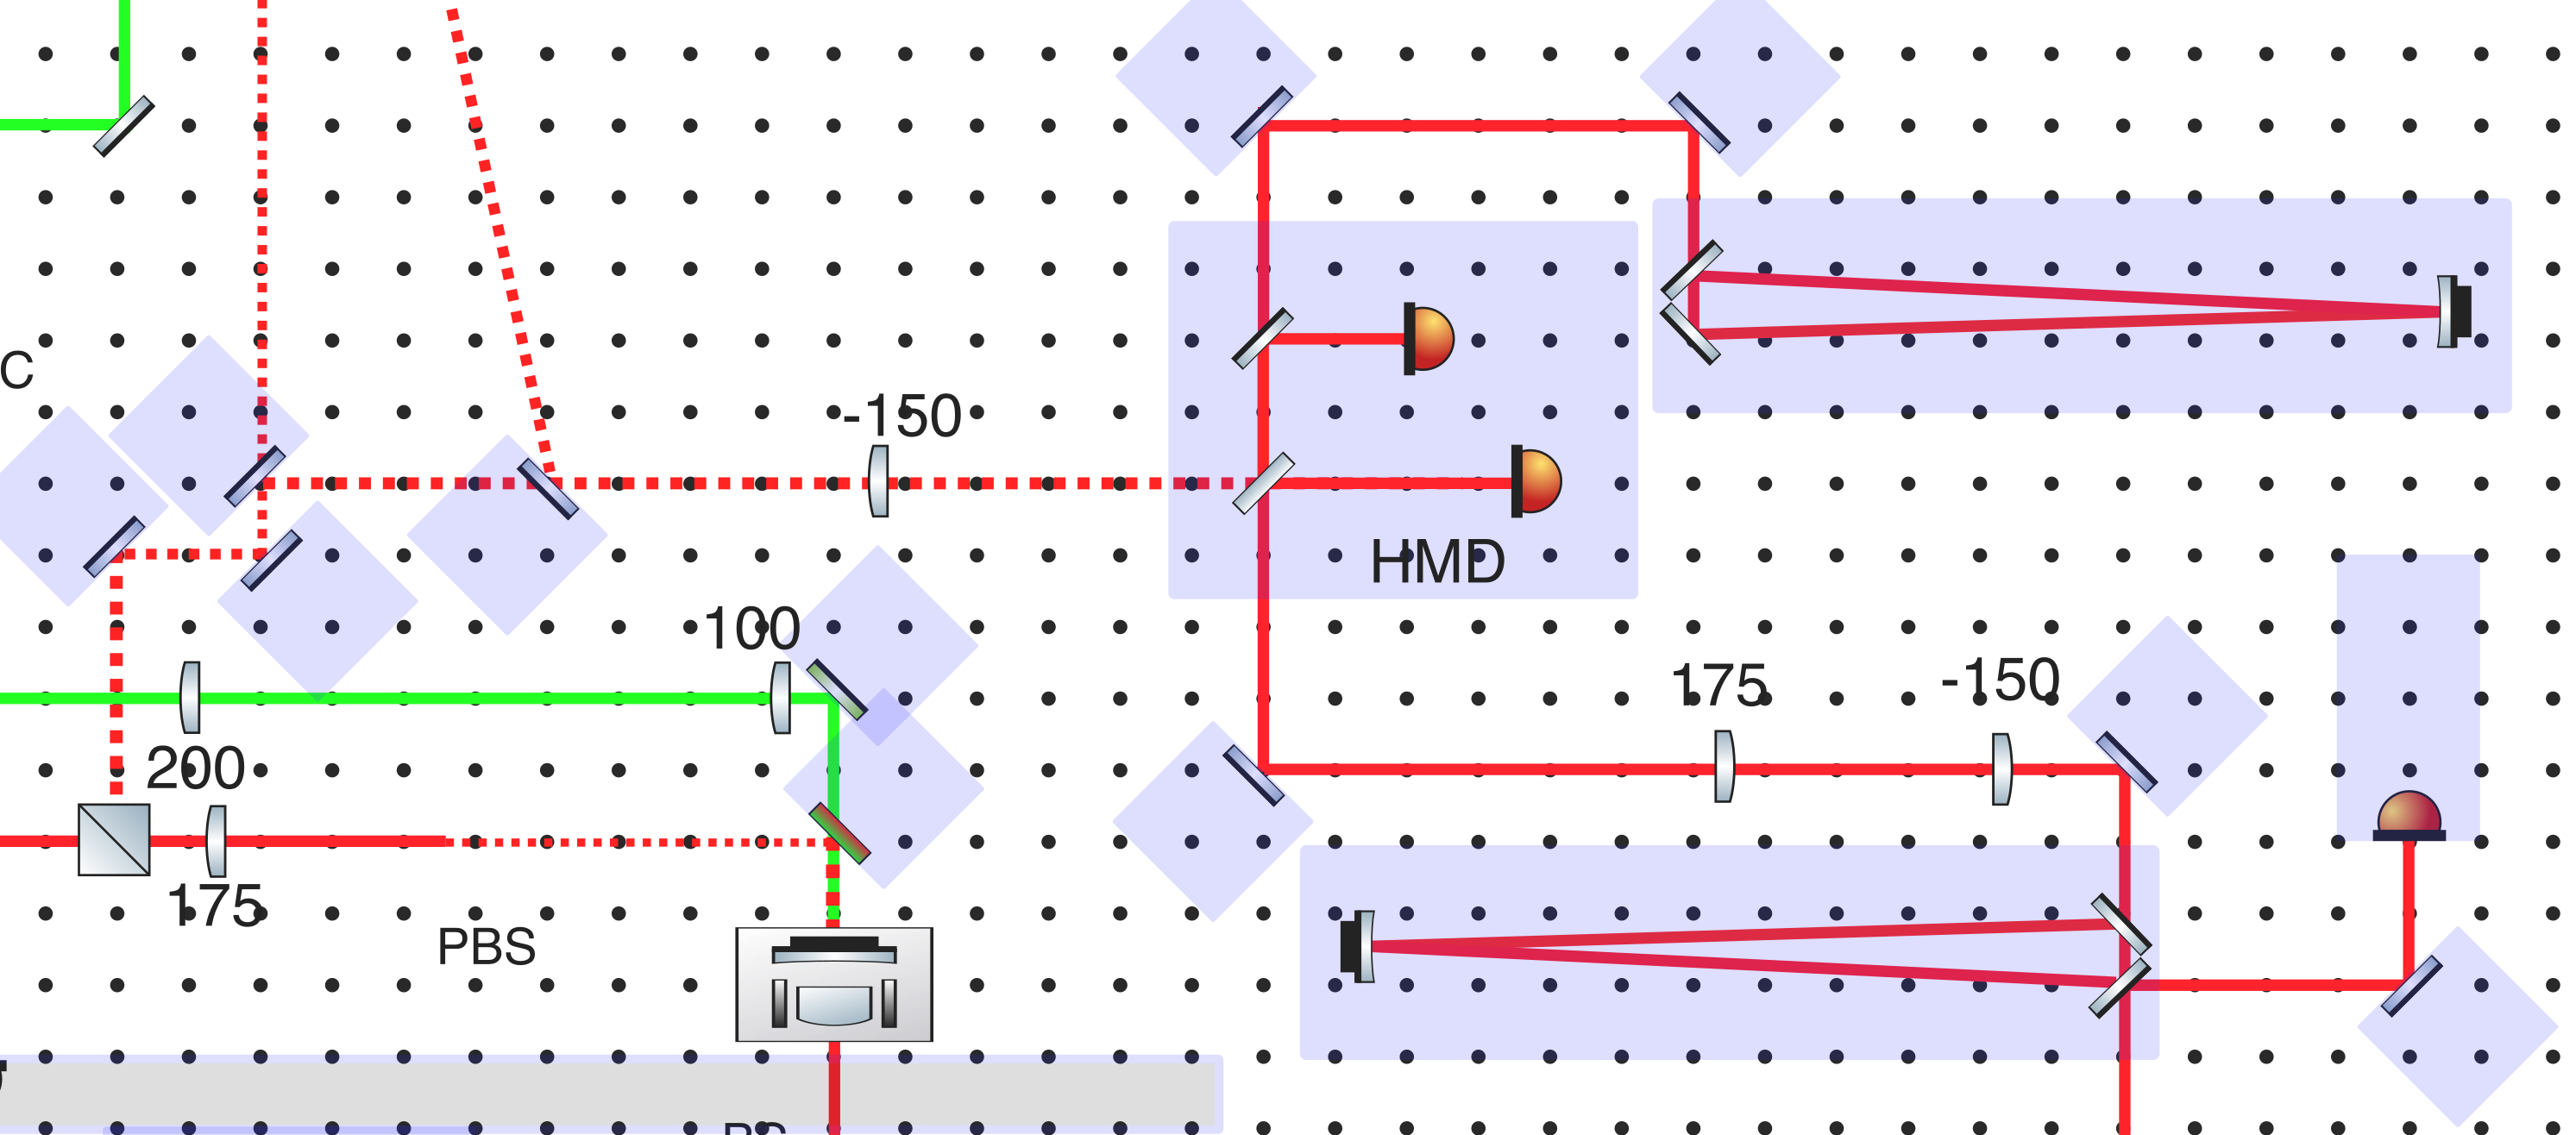
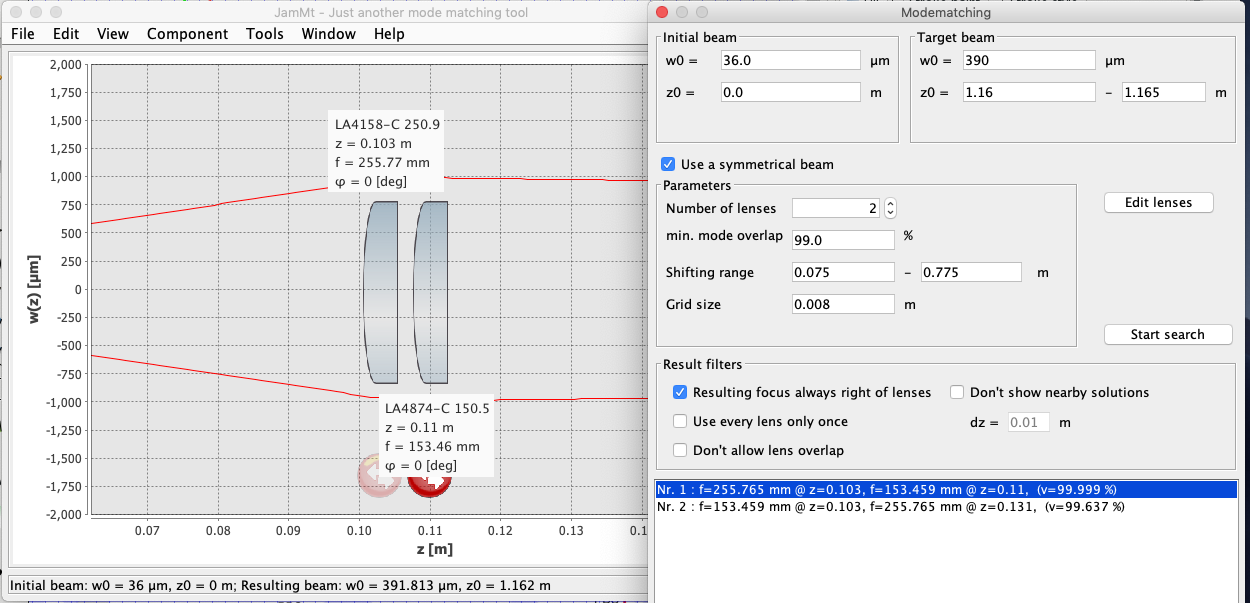
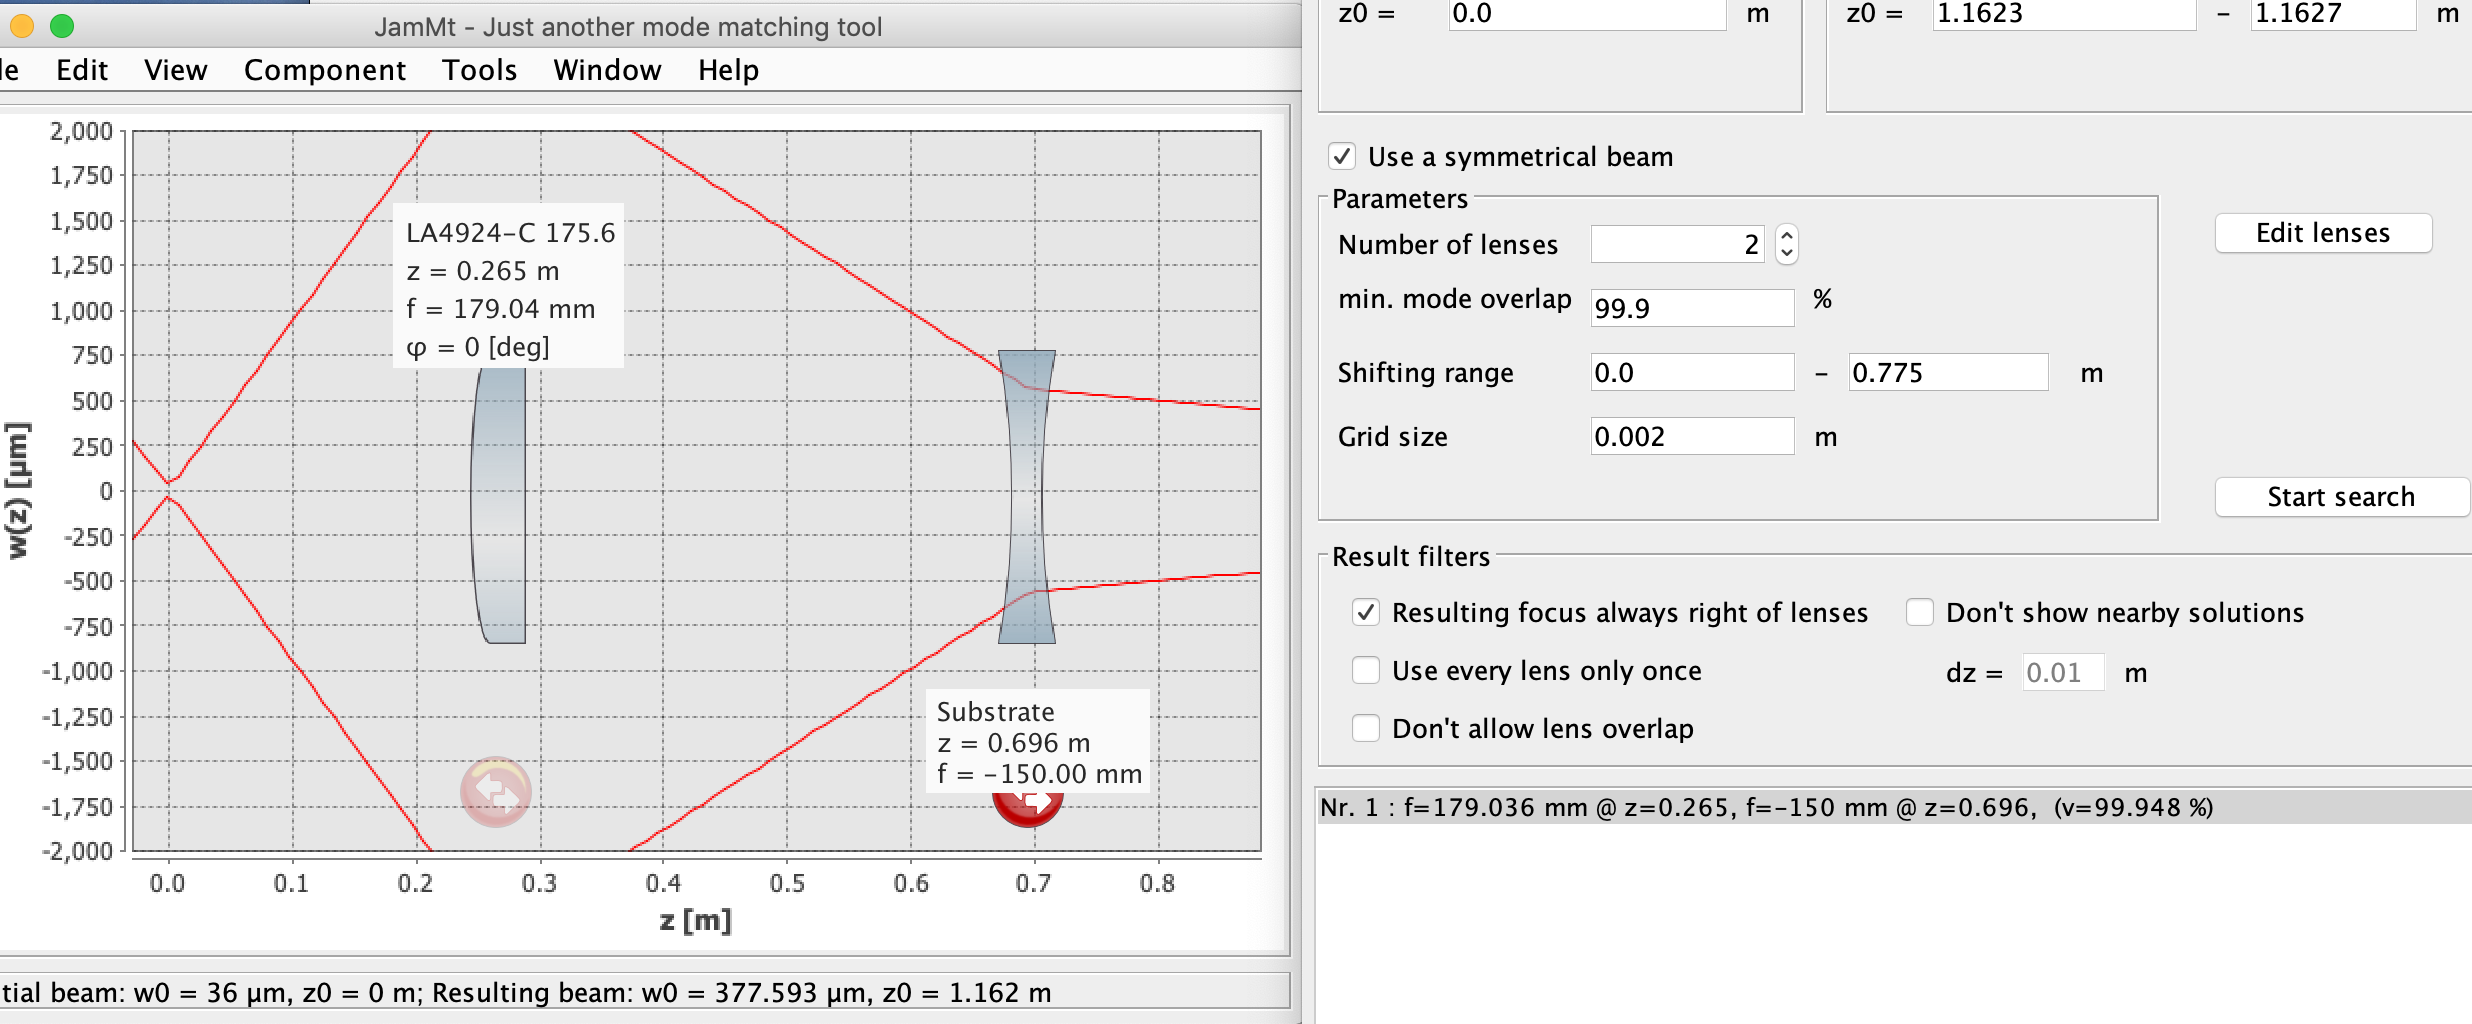
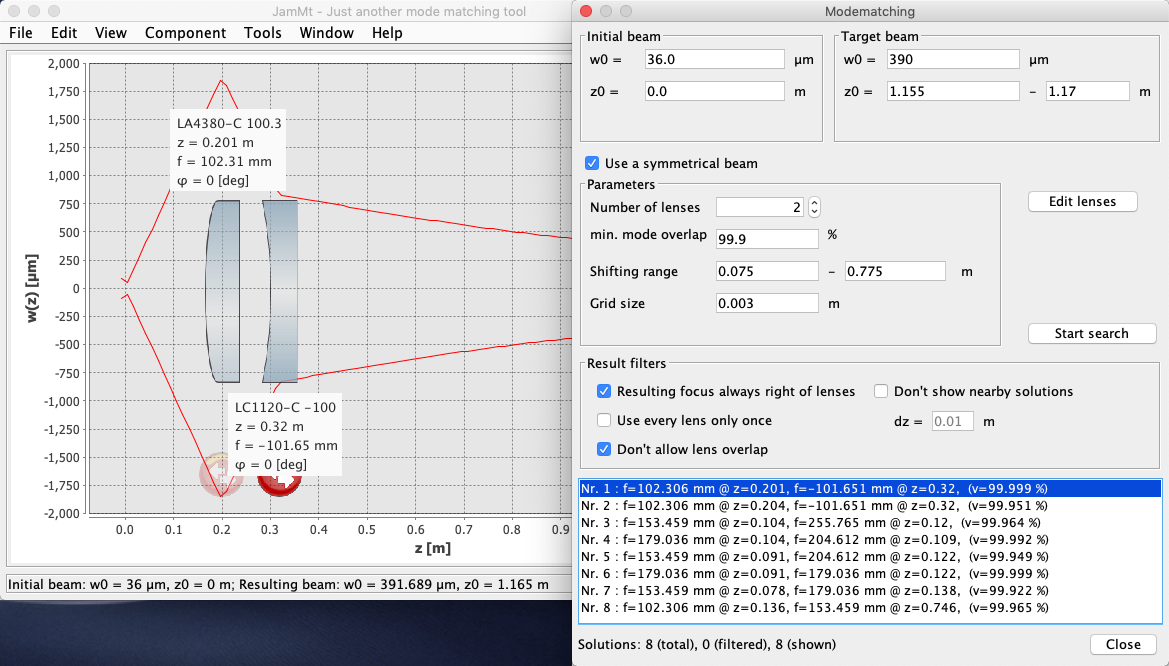
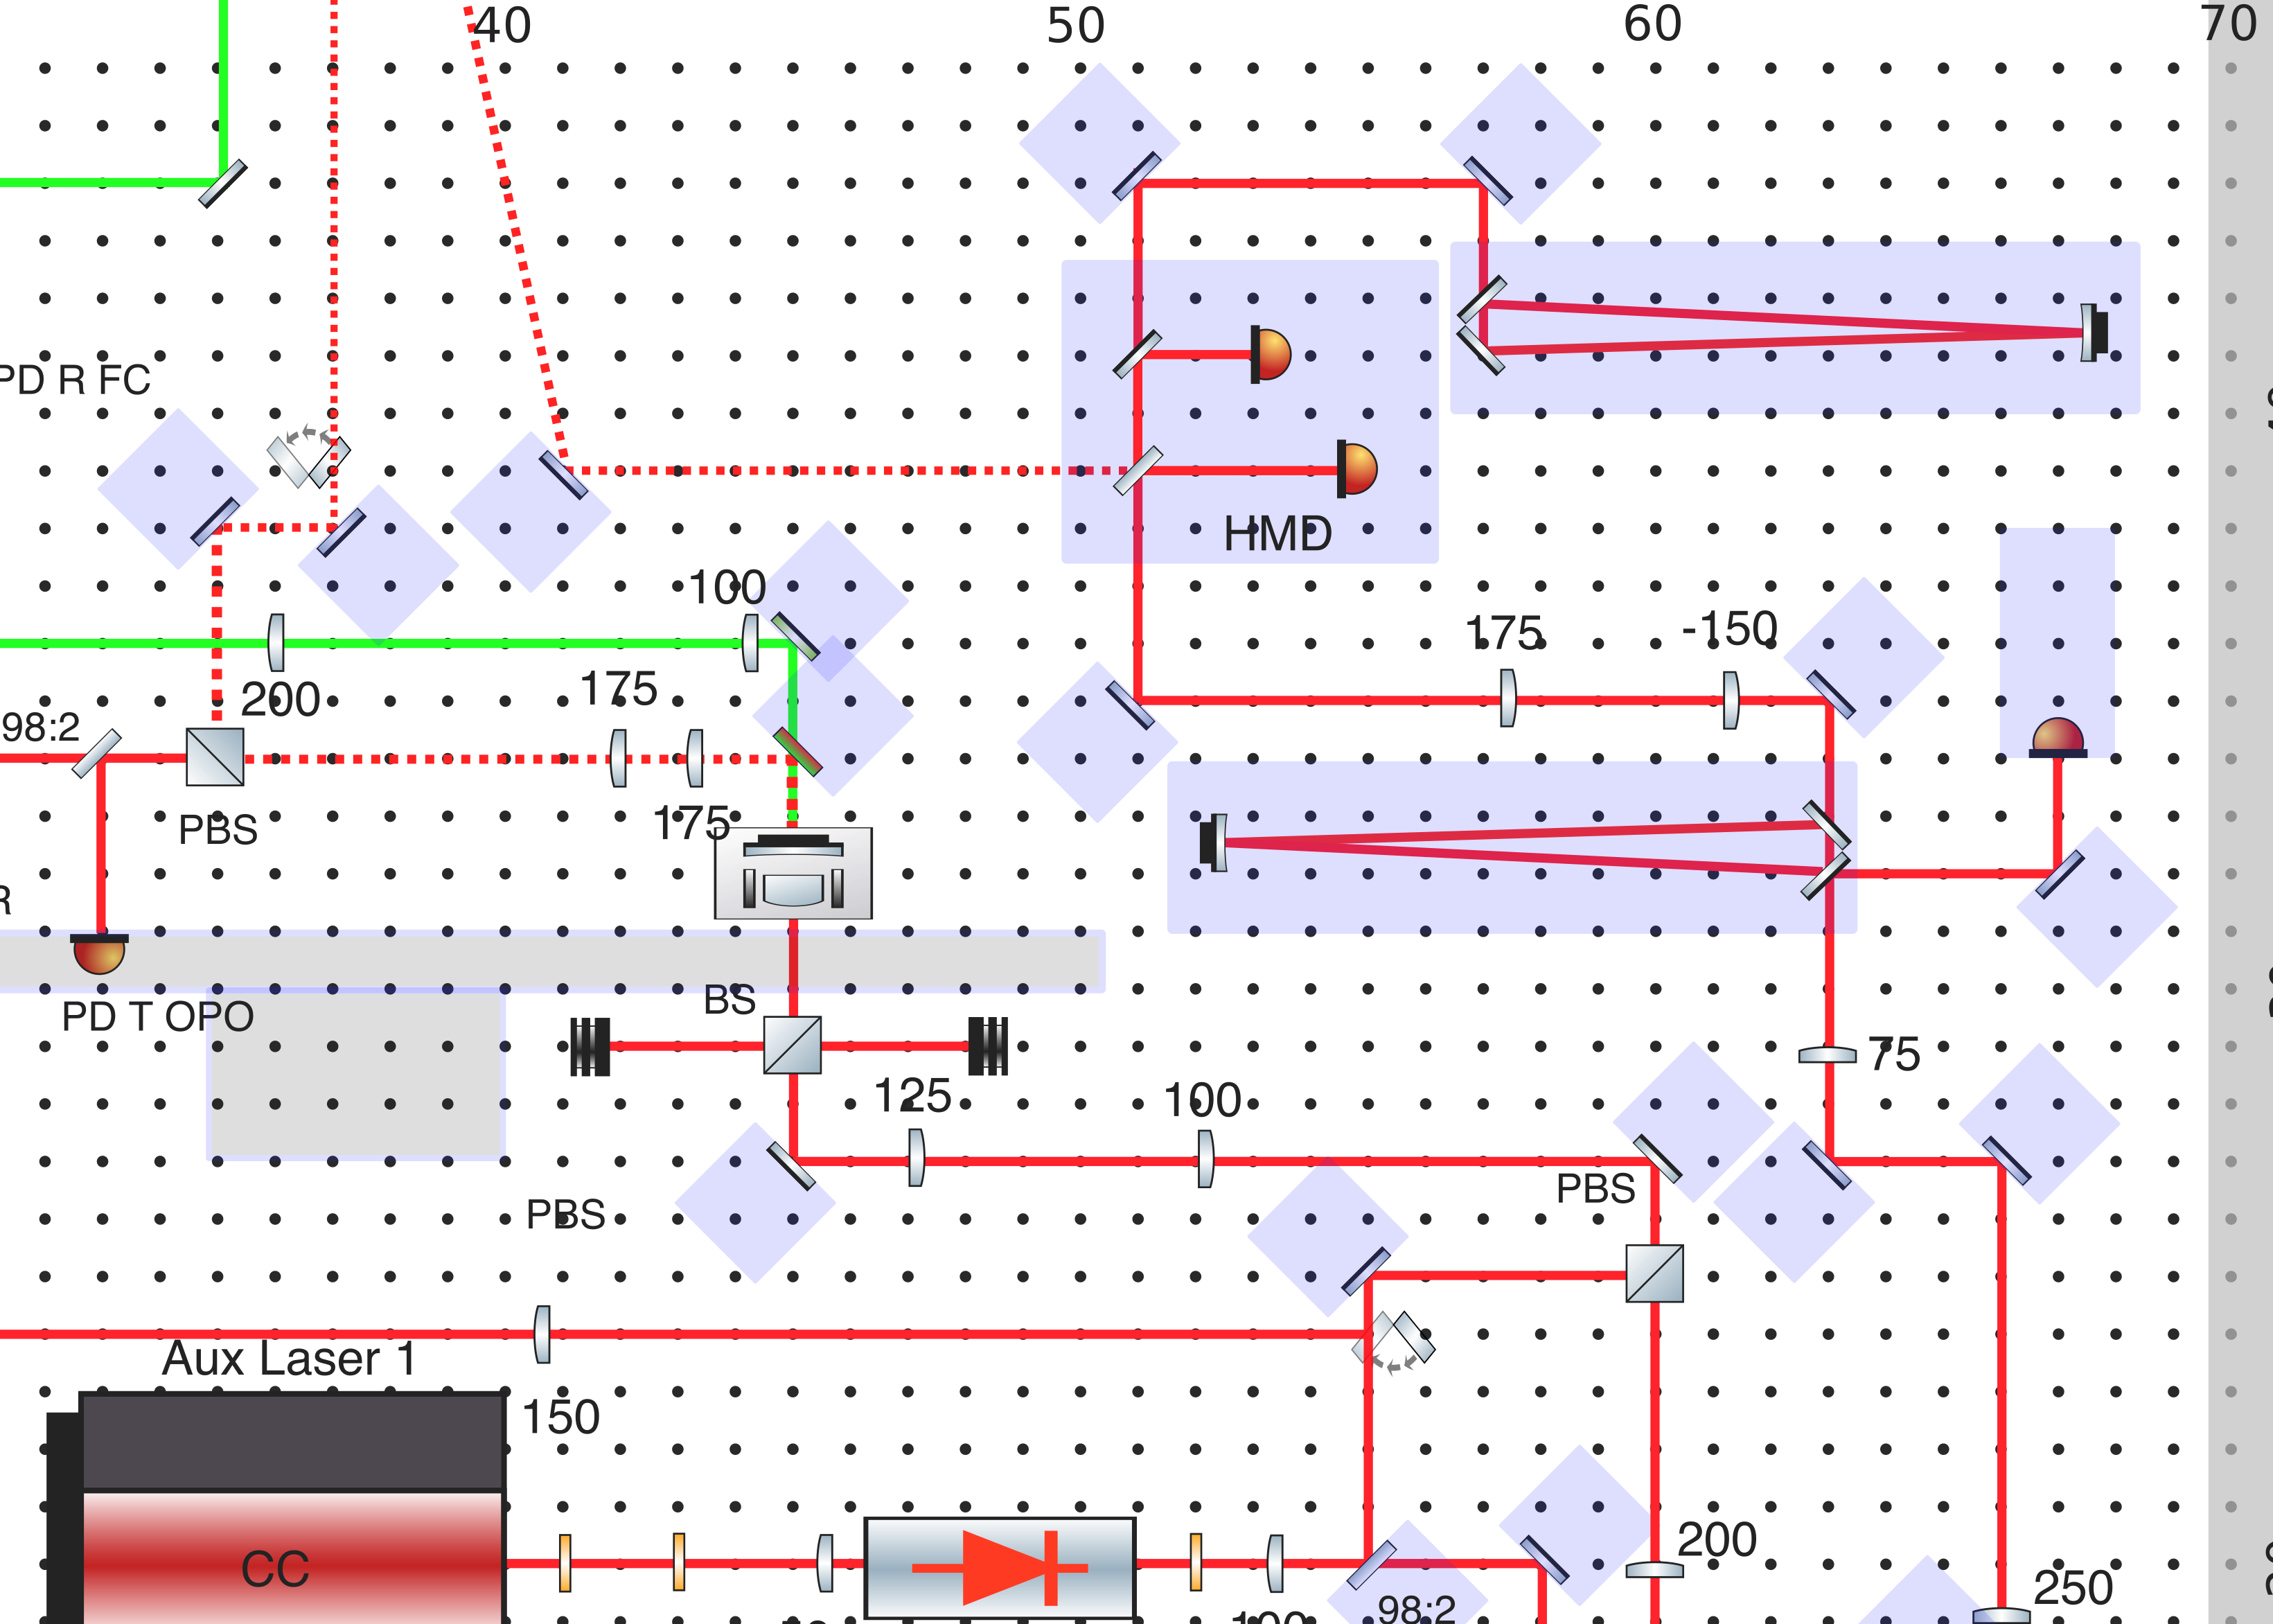
By considering the space and alignment of homodyne detector(HMD). We designed the telescope for both beam coming from local oscillator and bright alignment beam(BAB).
The attached figure 1 and 2 show the telescope. The attached figure 3 shows the overall situation in the future implementation.
Participaint: Aritomi, Chienming, Eleonora, Shurong and Yuhang
Today we achieved the lock of OPO on both p and s pol. The method is to lock OPO with p-pol (PDH signal goes to PZT of OPO) and then use PLL to lock s-pol to p-pol. Actually, before locking PLL we made sure the p and s both resonant inside OPO with peak overlaping.
The tricky part is to lock PLL as following:
1. We found that the frequency diffrerence of p and s is ~360MHz while the main laser current is 1.4A. However, this frequency increased ~420MHz after we increased main laser current to 1.8A.
2. Locking PLL for 420MHz is not possible. According to datasheet, we can provide VCO frequency only below 400MHz. At this moment, we decided to not use optimal temperature(optimal is 7.2kOm) but use 7.171kOm.
3. We investigated quite a long time and found we can use the built in divider to lock beatnote smaller than 400MHz. Since the phase detector can hold frequency only below 104MHz(also from datasheet), so we can divide signal and make it smaller than 104MHz. Then we can use reference frequency to compare with it.
4. As we have already mentioned in the last entry, we can only lock one side of PLL. We further found that we can change the sign of correction signal inside PLL board. We need to find the good comnbination of correction signal sign and the original frequency side(lower or higher than locking frequency). However, we were think if there is a way to change the offset of correction signal and make it have both positive and negitive signal.
After locking PLL, it is easy to lock OPO. The locking parameters are single-pol low-pass at 300Hz, gain of 100 and invert for SR560.
The locking parameters are single-pol low-pass at 30Hz, gain of 2 for SR560.(for GRMC)
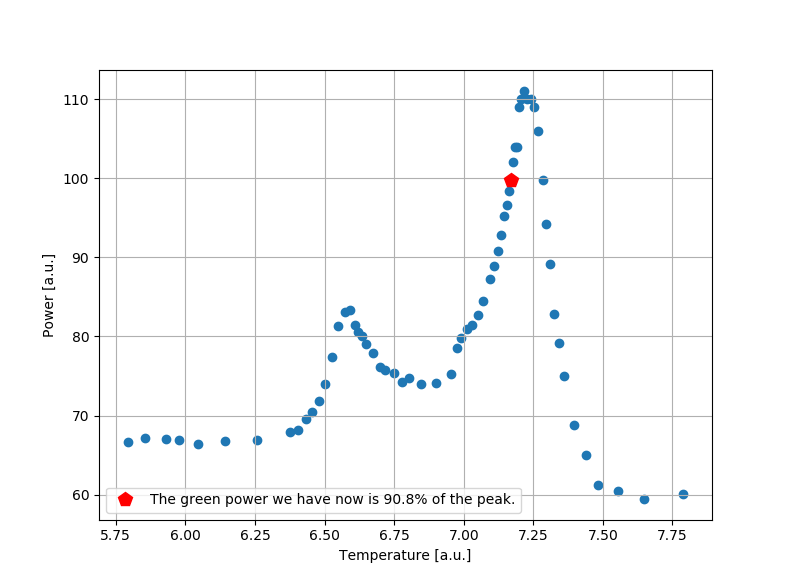
I did the simulation about how much green we can produce now. The temperature we lock is 7.171kOm. The green we produce should be 90% of the peak value. However, the green production will be even smaller if we consider the overlap of p and s is not perfect.
The design of the QPD telescope has been finished.
The idea is to seperate the reflected beam from the cavity into two path, and put one QPD on each path, in a way that the guoy phase on the two quadrants has around 90 degree difference. So one of the quadrant could sense the shift and one could sense the tilt.
The target beam is decided by the size of the quadrant sensor :
- The size of each quadrant element is 11 mm2
- The gap between the elements is 70um
So I chose the target beam size at QPD should be around 1~1.5mm
The lenses I used in the simulation are the green lenses I could found on Thorlabs website.
In both of the case, the origin is set at the beam extracting port of the FI.
1.
|
Convex lens(mm) |
Concave lens(mm) |
Distance between origin and the first lens(cm) |
Distance between two lenses(cm) |
Beam size at QPD(um) |
Distance between concave lens and QPD(cm) |
|
500 |
-75 |
17.5 |
43 |
1300 |
105 |
2.
|
Convex lens(mm) |
Concave lens(mm) |
Distance between origin and the first lens(cm) |
Distance between two lenses(cm) |
Beam size at QPD(um) |
Distance between concave lens and QPD(cm) |
|
400 |
-50 |
42 |
42 |
1100 |
30 |
The guoy phase difference at two QPD is around 98 degree. So I think we could go on with this design.
Participaint: Aritomi, Eleonora, Chienming, Shurong and Yuhang
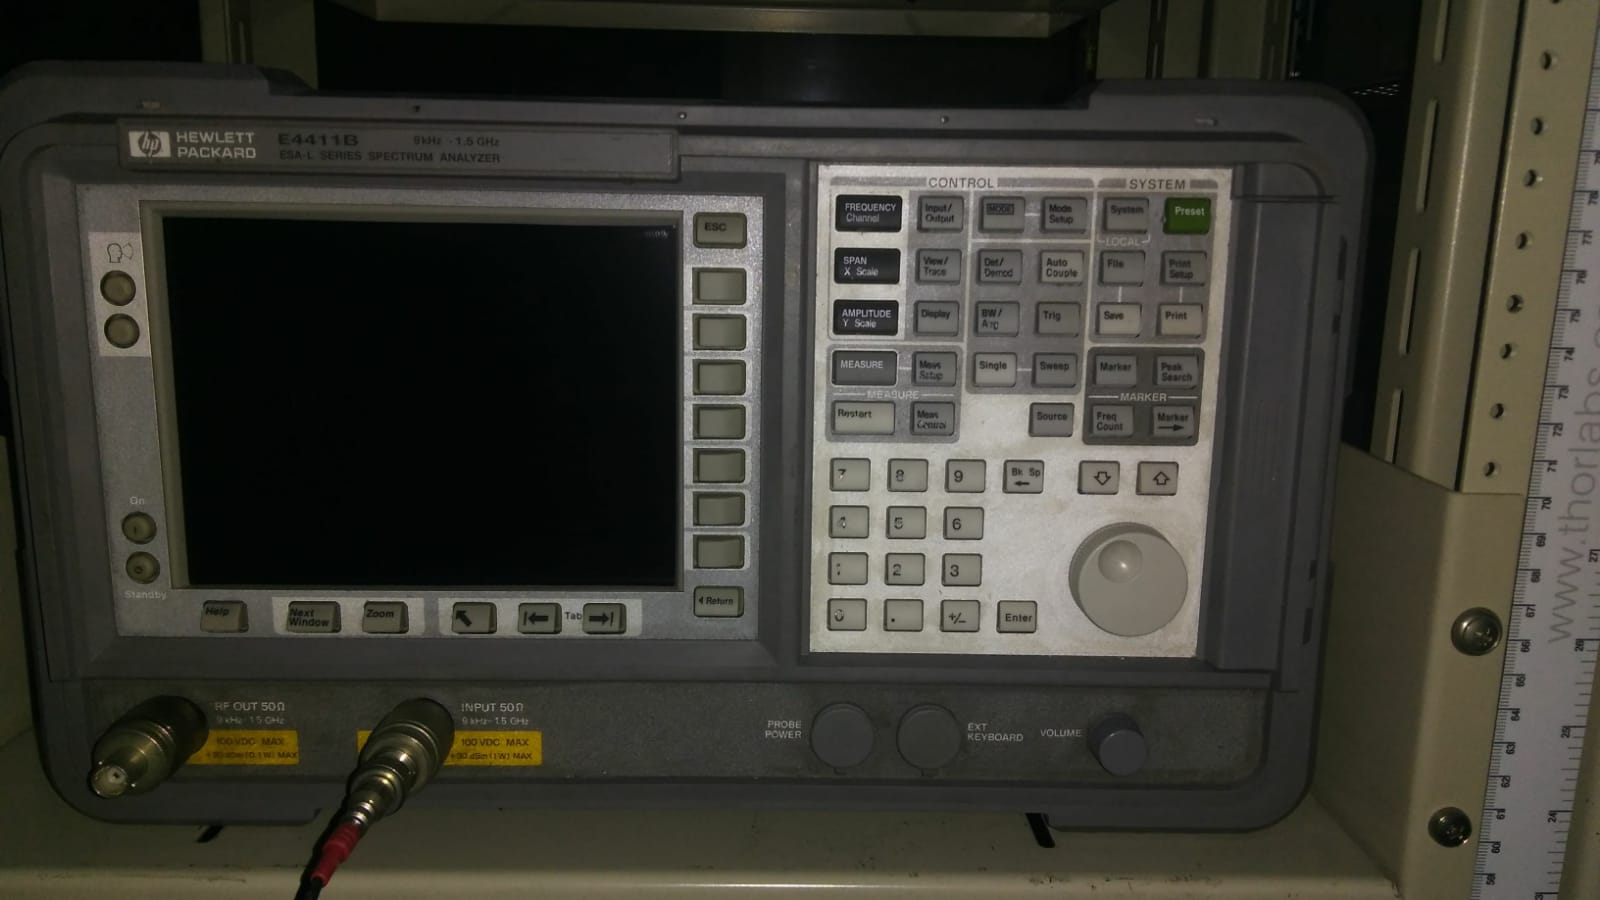
1. We checked the spectrum analyzers by signal generator. We found out
HP E4411B (the new one): Has a wrong amplitude value but higher bandwidth up to 1.5GHz.
HP 8563E(the old one which was used by Marco): Has a correct amplitude but the bandwidth is limited to 170MHz.
So we decide to check firstly by the new one and then tune beatnote frequency smaller than 170MHz. FIncally check amplitude by the old one.
2. The lesson we got from PLL locking
We need to load Marco set-up and remember to write this set-up into chip. How to change this set-up and implement it for the second board still needs to be investigated.
We checked the correction of PLL, we found now it is only positive. So we can bring initial frequency locked only when it is lower than reference frequency.
To do list:
1. investigate the amplification factor of each channel.
2. investigate the locking peformance of PLL(the highest locking frequency).
3. lock PLL to make both p-pol and s-pol resonant.
4. investigate how to apply lock for PLL board two.
DDS1:
| CH0 | EOM SHG 15.2 |
| CH1 | EOM MCGR 78 |
| CH2 | DEMOD SHG 15.2 |
| CH3 | DEMOD MCGR 78 |
DDS2:
| CH0 | EOM OPO 87.6 |
| CH1 | DEMOD OPO 87.6 |
| CH2 | - |
| CH3 | PLL |
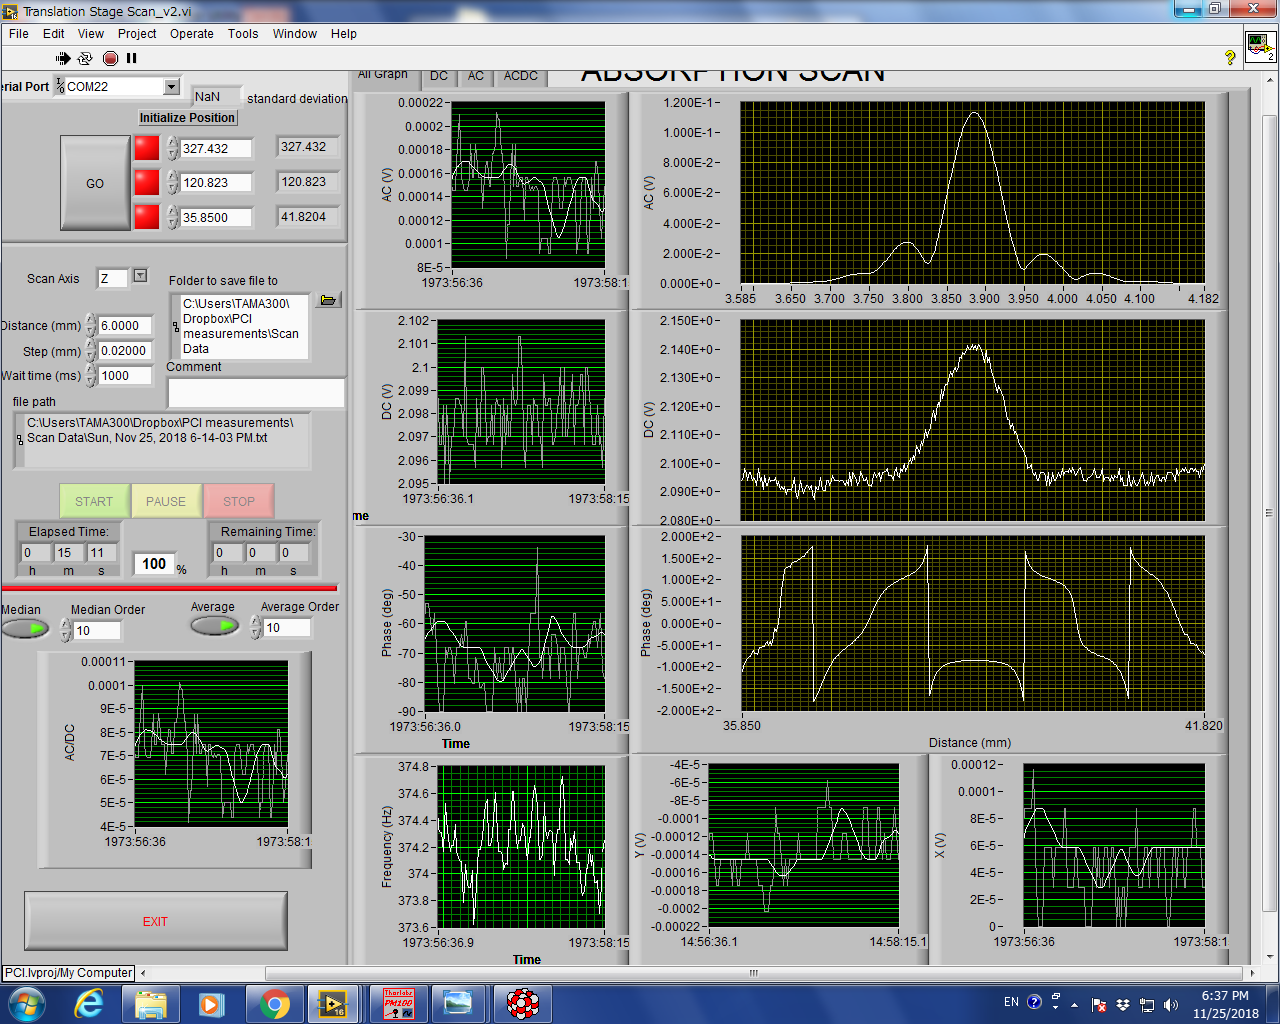
I made a scan of the calibration sample with the 1310nm. Attached first screenshot. AC=0.115V; DC=2.14; phase=-85; power=34mW -> R=7.9W-1.
Then I set the power at 10W and made a scan of the crystalline coating in the center, with and without loop. The loop doesn't make a lot of difference.
the peak signal is 380microV, with DC=1.65, the calibrated value is 2.9ppm. A lot more than expected.
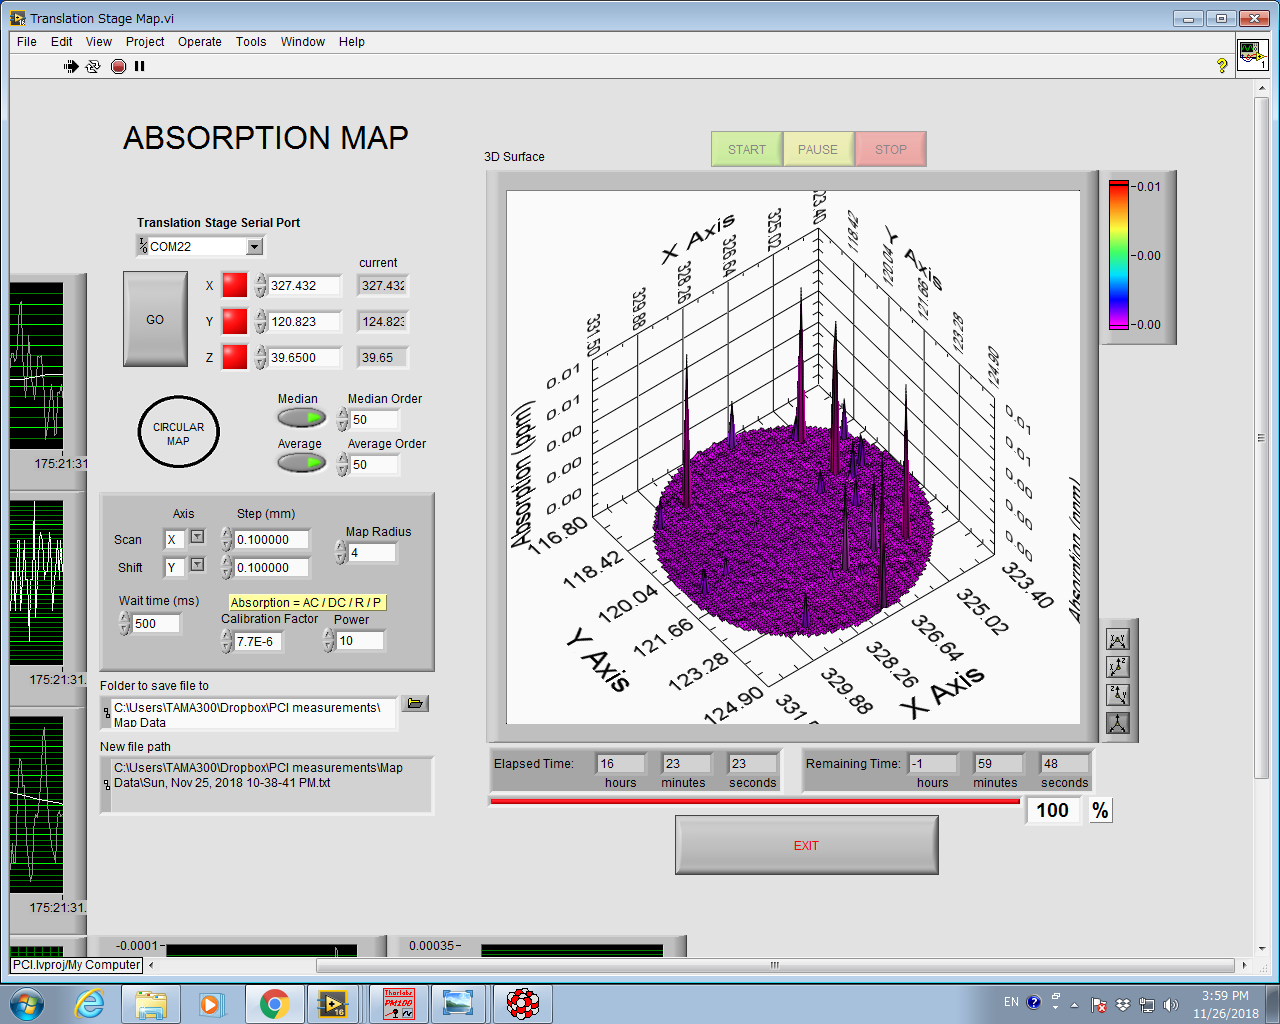
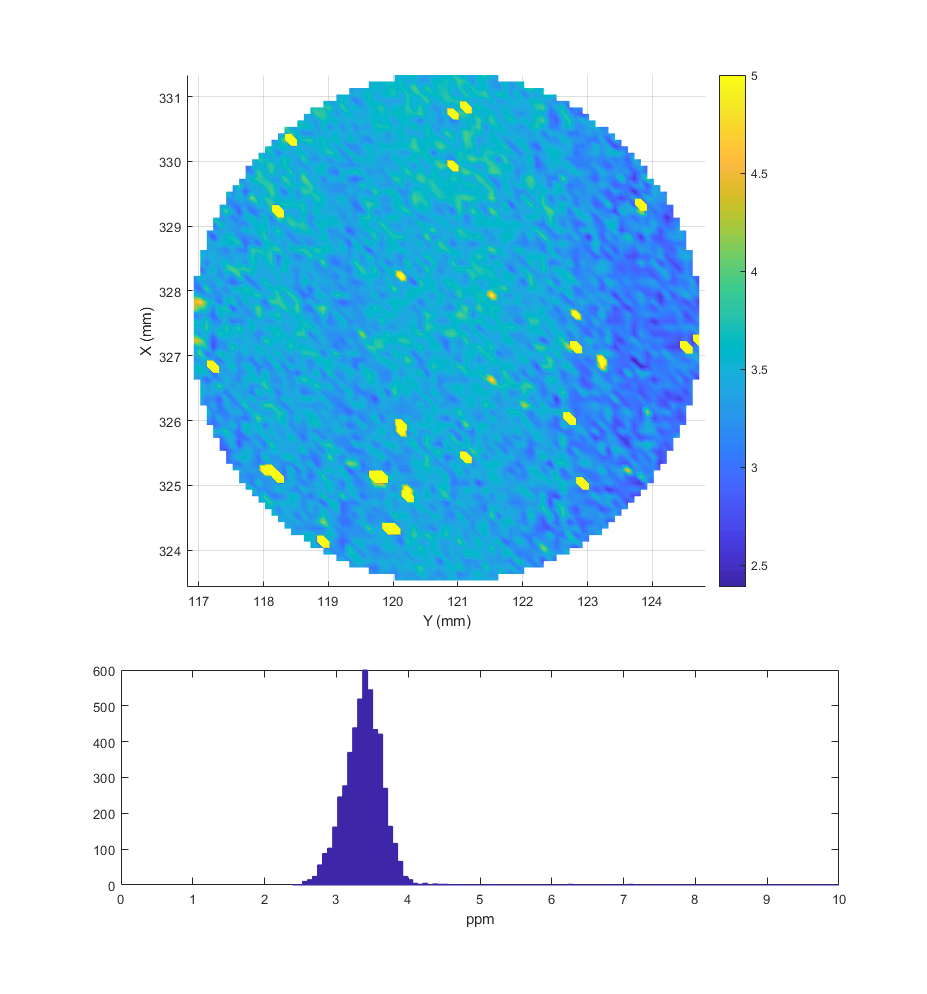
Then I made a map of radius 4mm around the center, resolution 100micron. There are a few peaks where the signal saturated the lockin scale, but most of the map is uniform at around 3.4ppm.
Chienming suggested to check the bandwidth of both SHG and GRMC. To make sure the BW of SHG should be smaller than the BW of GRMC.
From Eleonora's thesis, I found the FSR of SHG is 4GHz(infrared) and finesse is 75. So
BW(green of SHG) = 4000*2/75 = 106MHz
The scale information of GRMC can be found from entry before. So
FSR = c/L = 533MHz
finesse = pi*sqrt(r1*r2)/(1-r1r2) = 391
BW(GRMC) = 533/391 = 1.36 MHz
I did the calculation of Airy function(of SHG) intergration around maximum over 1.36MHz and 106MHz. The ratio is 1.5%.
Note: the bandwidth of mephisto laser is 1kHz.
With the pump open at the max power of 10W (after the chopper), I noticed that the control loop introduces a noise at a constant phase.
Without the loop, the cloud of points is 40microV large (radius) and centered at 20microV (phase around 150deg)
With the loop, the cloud of points is 20microV large (radius) and centered at 40microV.
This means that some residual stray light from the pump is still entering through the OD11 filters in the in-loop PD.
So I moved the in-loop PD to another position and now the noise is reduced from 40microV to 20microV and the cloud center keeps staying at 20microV.
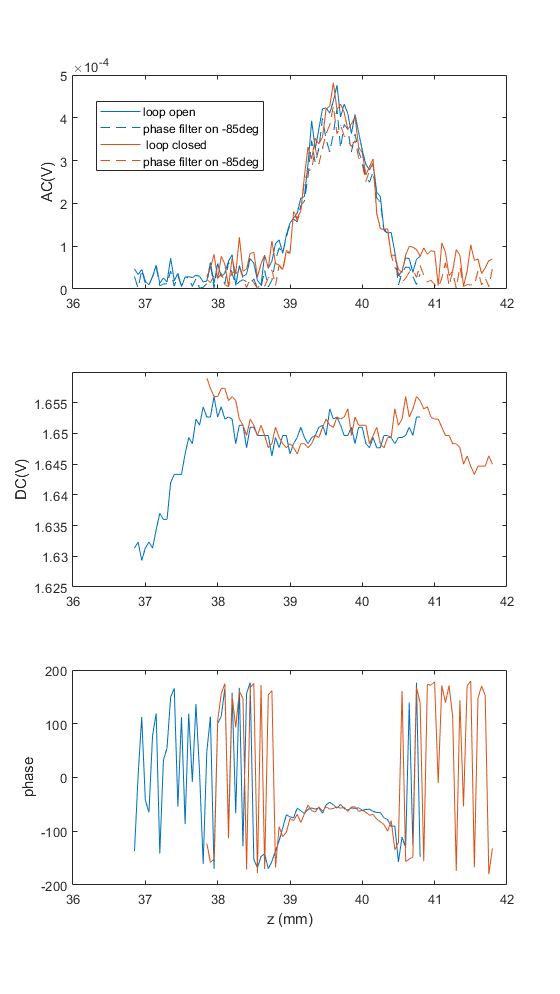
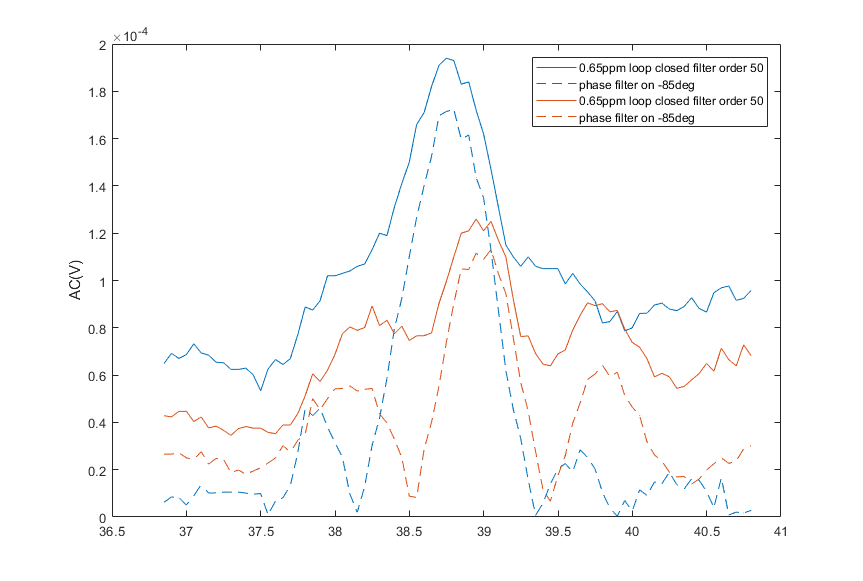
I scanned again the 0.65ppm-absorbing LMA sample. I Plot the AC signal scan and, with dashed lines the AC with phase filter applied (expected phase: -85deg, from the reference scan).
The phase filter removes the component orthogonal to the absorption signal.
The central peak of the dashed orange line is 110microV, which corresponds, with DC=2V, R=7.7W-1, and pump power=10W, Abs = 110/2/7.7/10 = 0.7ppm. In very agreement with LMA measurement (0.65ppm)
I assembled the filters on the PDs, now each PD has a FEL1250 and a FELH1250, for a total OD=11. On the spectrum analyzer the pump peak disappeared.
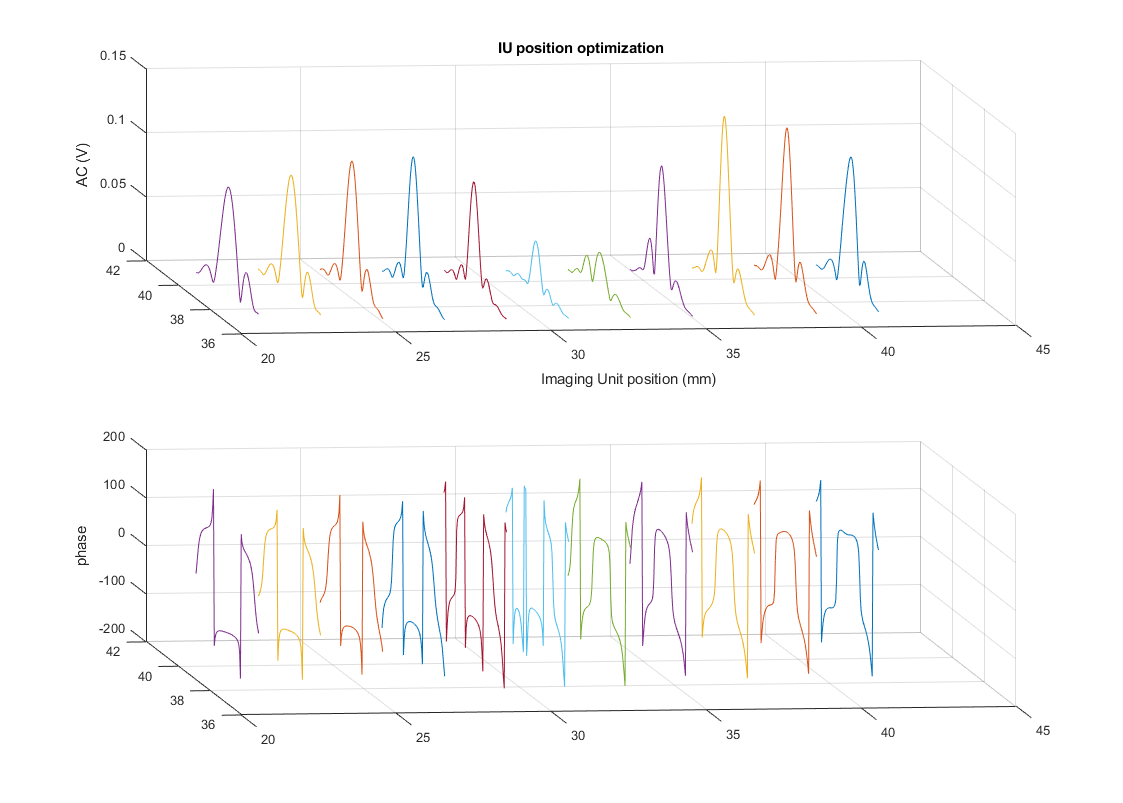
I moved the imaging unit closer to the sample to increase responsivity. I looked for the sharp image of the beam and maximized the signal with the surface reference sample.
I maximized the signal changing the imaging unit position.
I attach a screenshot of the best calibration scan I got. R = 7.7 W-1, similar to the expected half of the HeNe one. (R = 18 W-1)
I also plot all the scans in the same 3d plot. I chose to set the IU at 27mm.
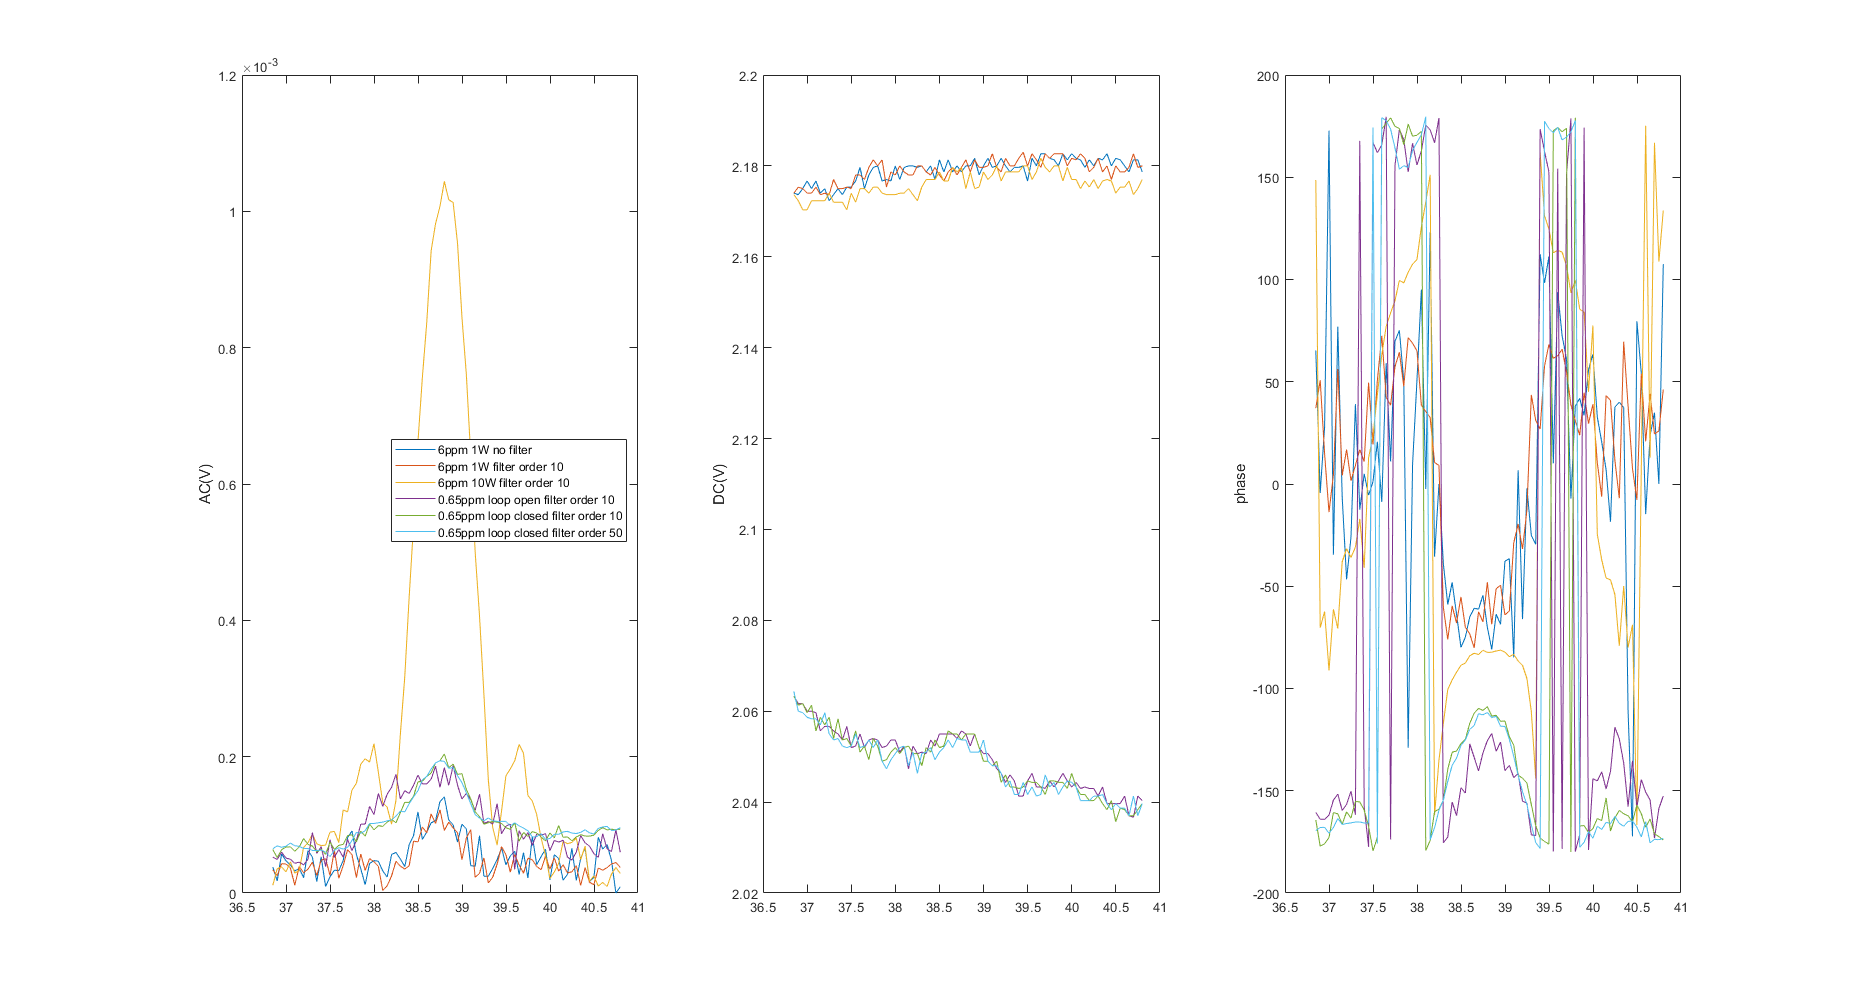
I measured the LMA sample that absorbs about 6ppm using 10W of pump power. I made some scans and a map.
I measured the LMA sample that absorbs 0.65ppm, with open loop and with closed loop.
I plot all the scans together

[Matteo, Eleonora]
In order to lock the PLL, the beating note detected by the fibered PD is sent to the PFD (Phase Frequency Detector) ADF 4002 which provides the error signal for the loop.
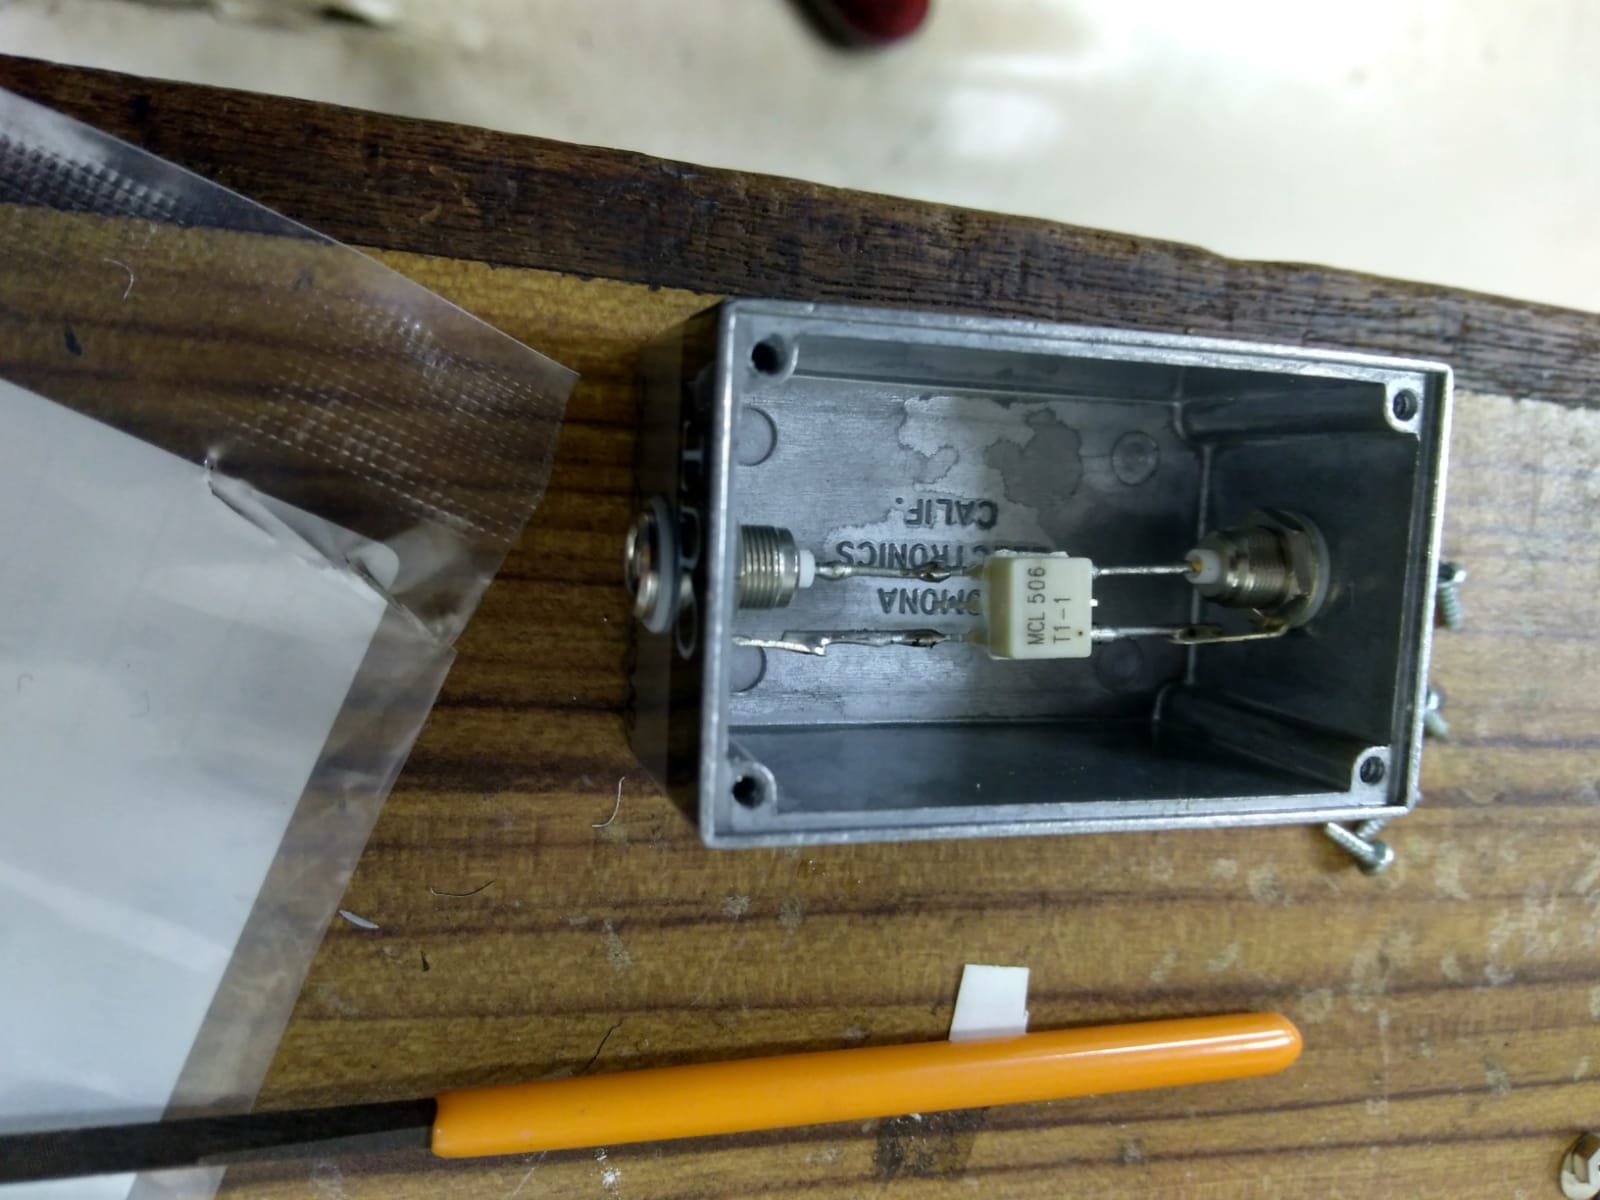
The DC component of the PD signal should be removed and for this purpose we used a transformer.
The transformer used for the first PLL was soldered by Marco Vardaro and Matteo (pic 1). Yesterday we soldered 3 more trasformer (identical to the first one) to be used for the second PLL and for the two monitor channels. (We want to use the other output of the fiber BS as a monitor and avoid the 90:10 splitter used up to now)
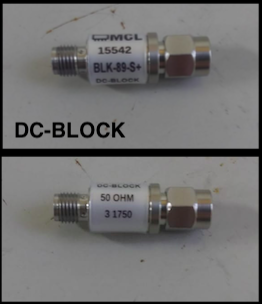
We tried also to use a minicircuit DC block (pic 2) but for some reasons we could not see the beating note on the spectrum analyzer.
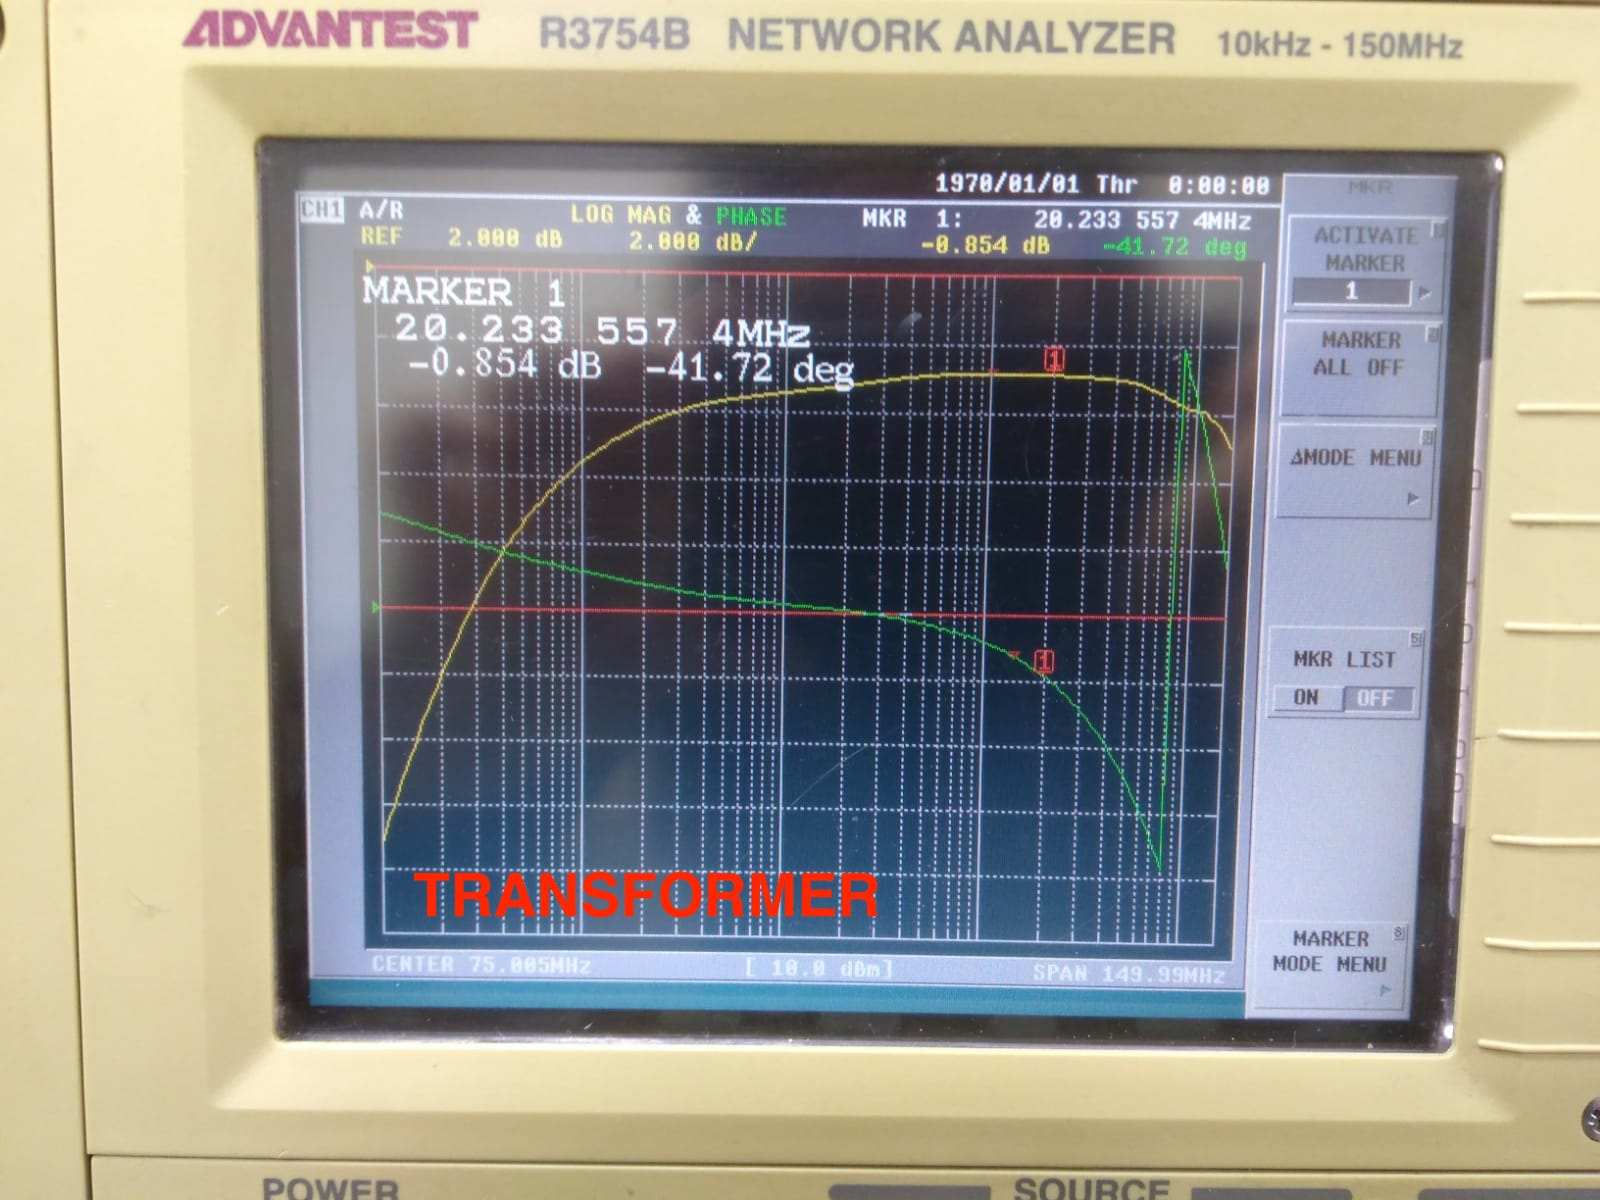
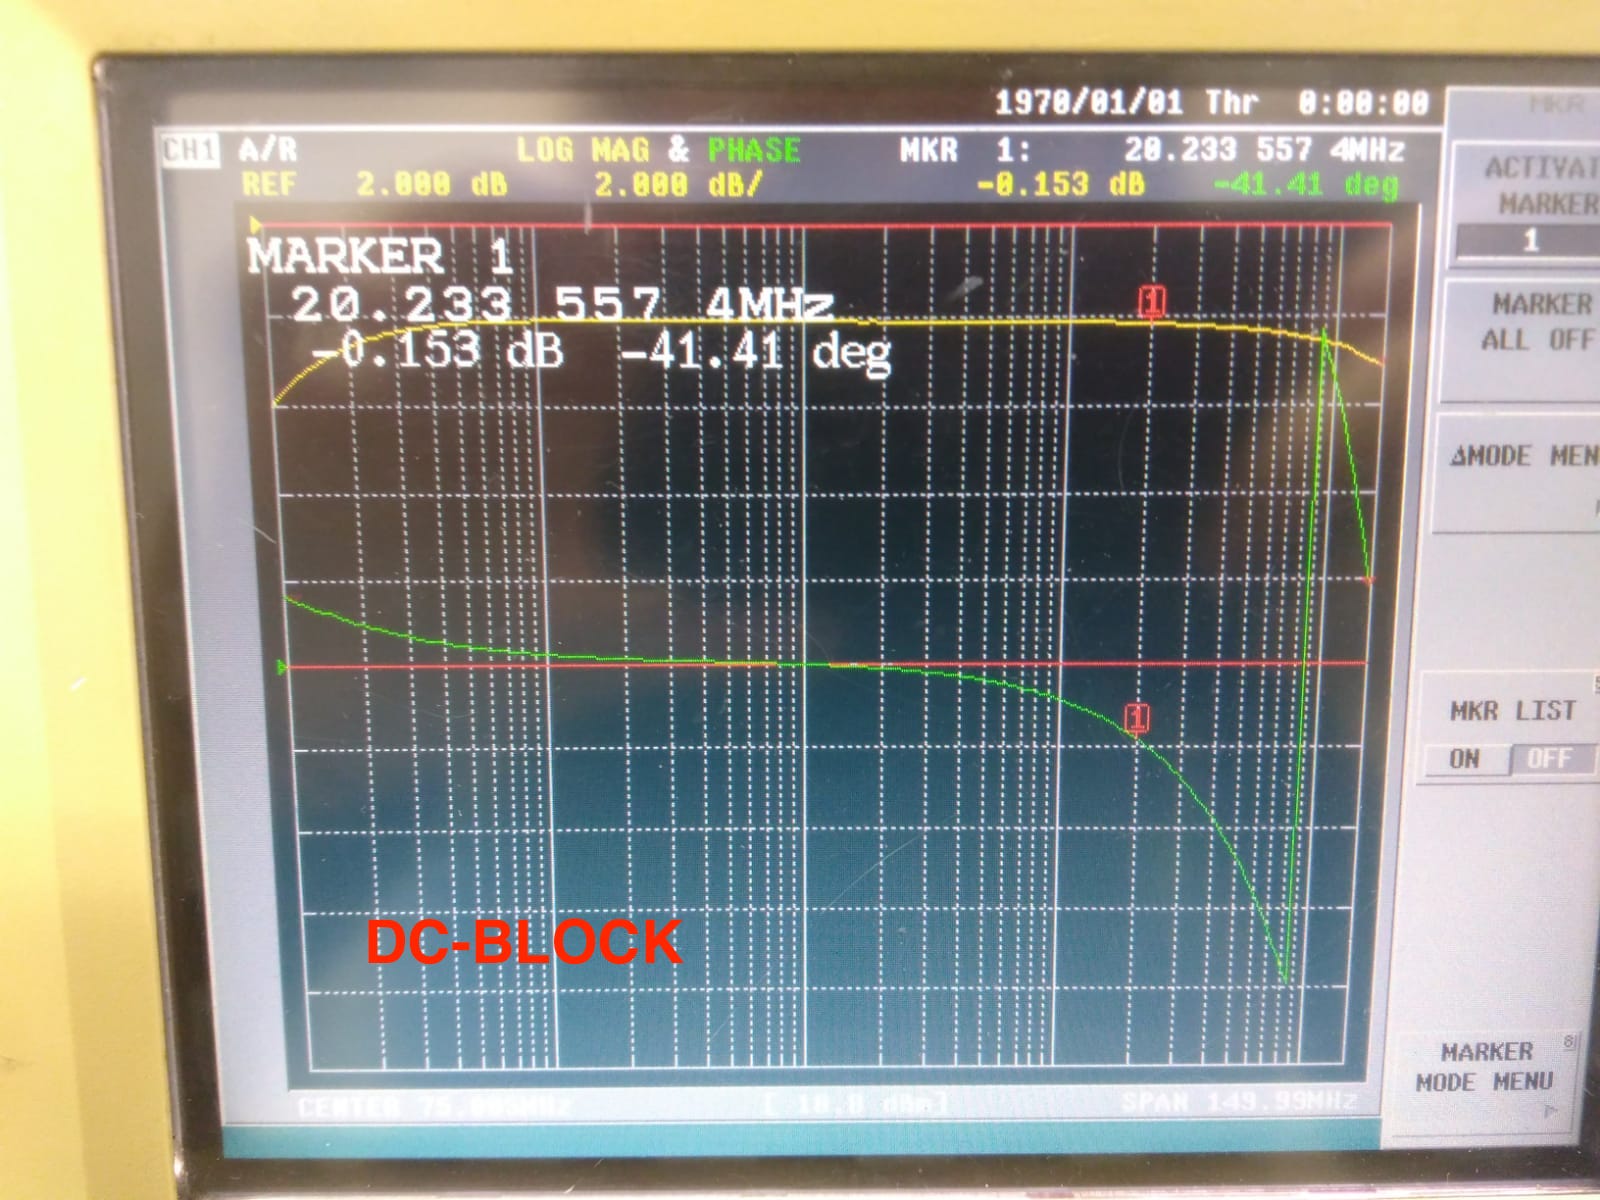
We have characterized the TF of the transformer (pic 3), and compared it with that of a minicircuit DC block ( pic 4).
The behavior is similar but the cut-off frequency seems lower for the DC block. ( Is this the reason why we cannot use it?)
In the two cases the attenuation is negligible but the phase loss is about 40 deg at 20 MHz (Is this relevant for the PPL loop?)
Issues about the characterization
During the characterization we had some problems (probably due to impedance mismatch) which brought to very strange TFs with large peaks and notches at high frequency. At the beginning we were using an oscilloscope and a function generator for the caraterization, then we swiched to a network analyzer (50 ohm impedence) which gave us more reasonable TFs (shown in pic 3 and 4).
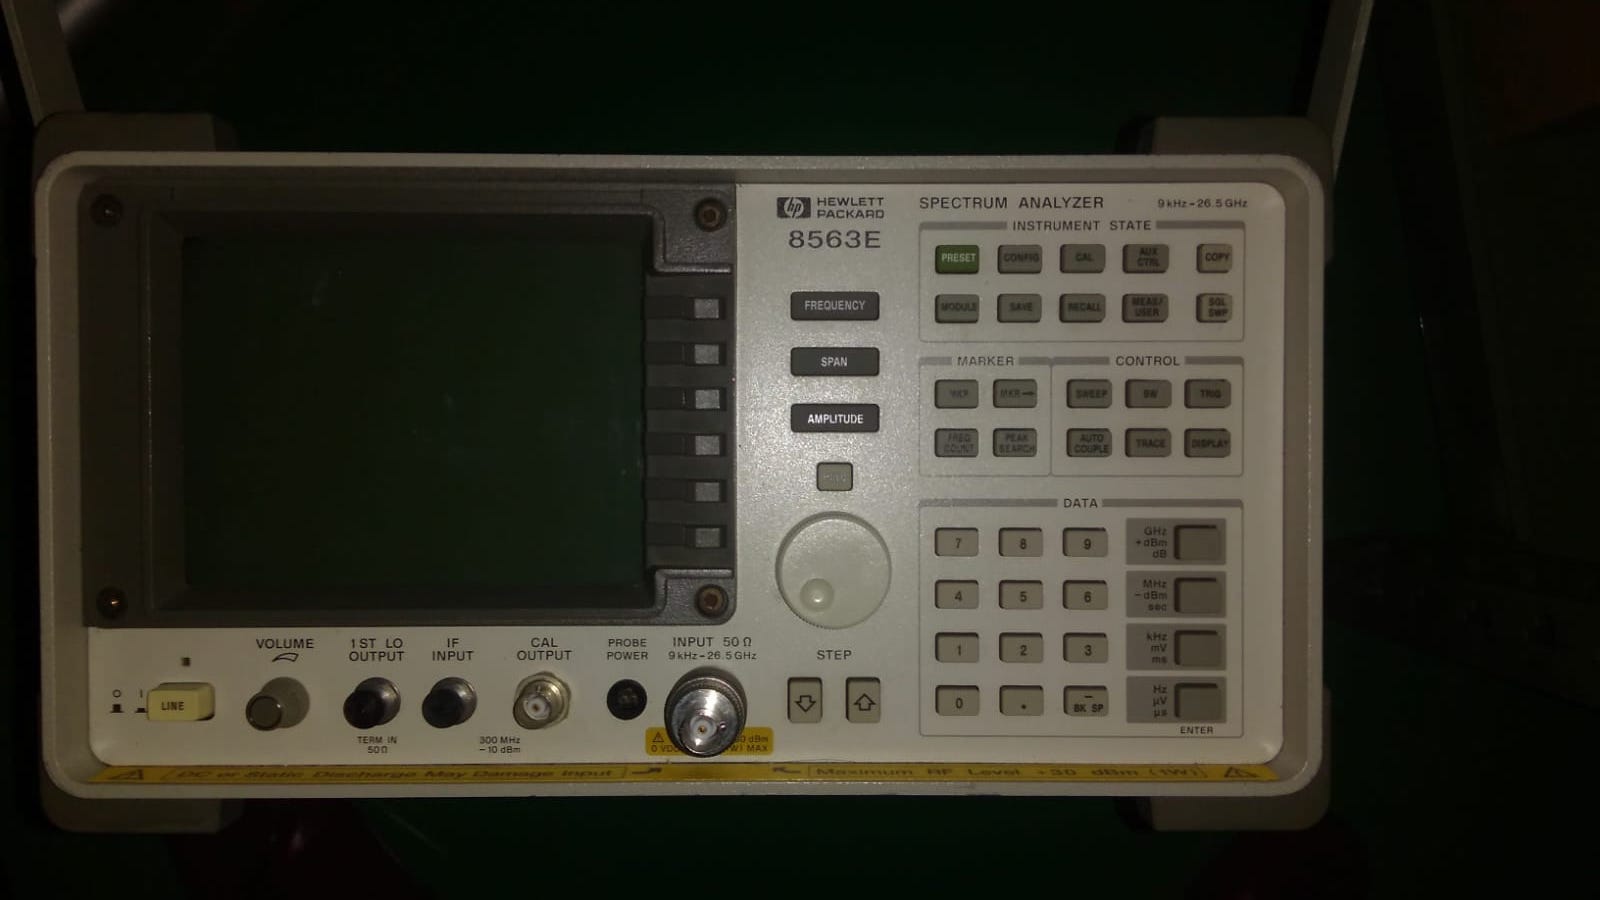
Two days ago, while trying to recover the PLL lock, we found that the spectrum analyzer we used to montor the beating note (HP 8563E - see pic1) was not working properly.
It shows a reduced bandwith: the beating note disappears when its frequency becomes larger than about 130 MHz and the peak amplitude was lower of about 15 dB.
We replaced it with another one (HP E4411B - see pic 2) which seems to work better (correct bandwith and peak height).
The behaviour seems to suggest a impedance matching problem but since the its settings and the configuration of the setup are exactly the same used before we cannot understand the origin of the problem.
More investiagations need to be done.
Participants: Chien-Ming, Shu-Rong, and Yuhang
Today we succeed in locking the green mode cleaner (GRMC) by using the SR560 with setting the low pass at 3Hz. The S/N of PDH error signal is 300mV/3mV= 100.
We replaced the end curved mirror of GRMC to a higher reflectivity one 0.9996 ( the previous one is 0.9993), but the transmission efficiency is still around 52~54% not improved. Fig. 1 and Fig. 2 are the transmission spectrums of the GRMC with previous and current end curved mirror. The reason why we can't have higher transmission efficiency may be because of the impedance mismatching of the GRMC.
We also successfully locked the Mach-Zender, but have not optimized the locking parameters and measured the output power fluctuation of both MC and GRMC. Without locking the Mach-Zender, the ratio of the maximum laser power after Mach-Zender and before green EOM is 15.5mW/23.3mW = 66%.
The last thing is to successfully lock the OPO by using the same SR560 with setting the low-pass at 100Hz and the gain is 100.
Participaint: Aritomi, Eleonora and Yuhang
Today we finally recovered the PLL. The problem we had during this recovery is listed as following.
1. We didn't record the current value and temperature value of main laser and auxiliary laser. The situation now is listed as following.
| Current(A) | Temperature(deg) | |
|---|---|---|
| main laser | 1.410 | 24.17 |
| AUX1 | 1.210 | 34.77 |
| AUX2 | 1.308 | 34.98 |
2. The spectrum analyzer is broken so that we have only bandwidth of 130MHz. This is too small range and brings diffculty to find the beat note. We found a new one and now it is placed in the place of former spectrum analyzer.
3. The transformer cannot be replaced by DCclock of minicircuit. Fortunatly, Matteo and Eleonora made quite a lot of new transformers. We guess the DCblock doesn't block enough low-frequency signal.
4. The set up of PLL board still needs to investigated. Up to now, the lock of beat note 20MHz seems fine. However, we need to know how to change set-up if we want to lock it on a different beatnote frequency.
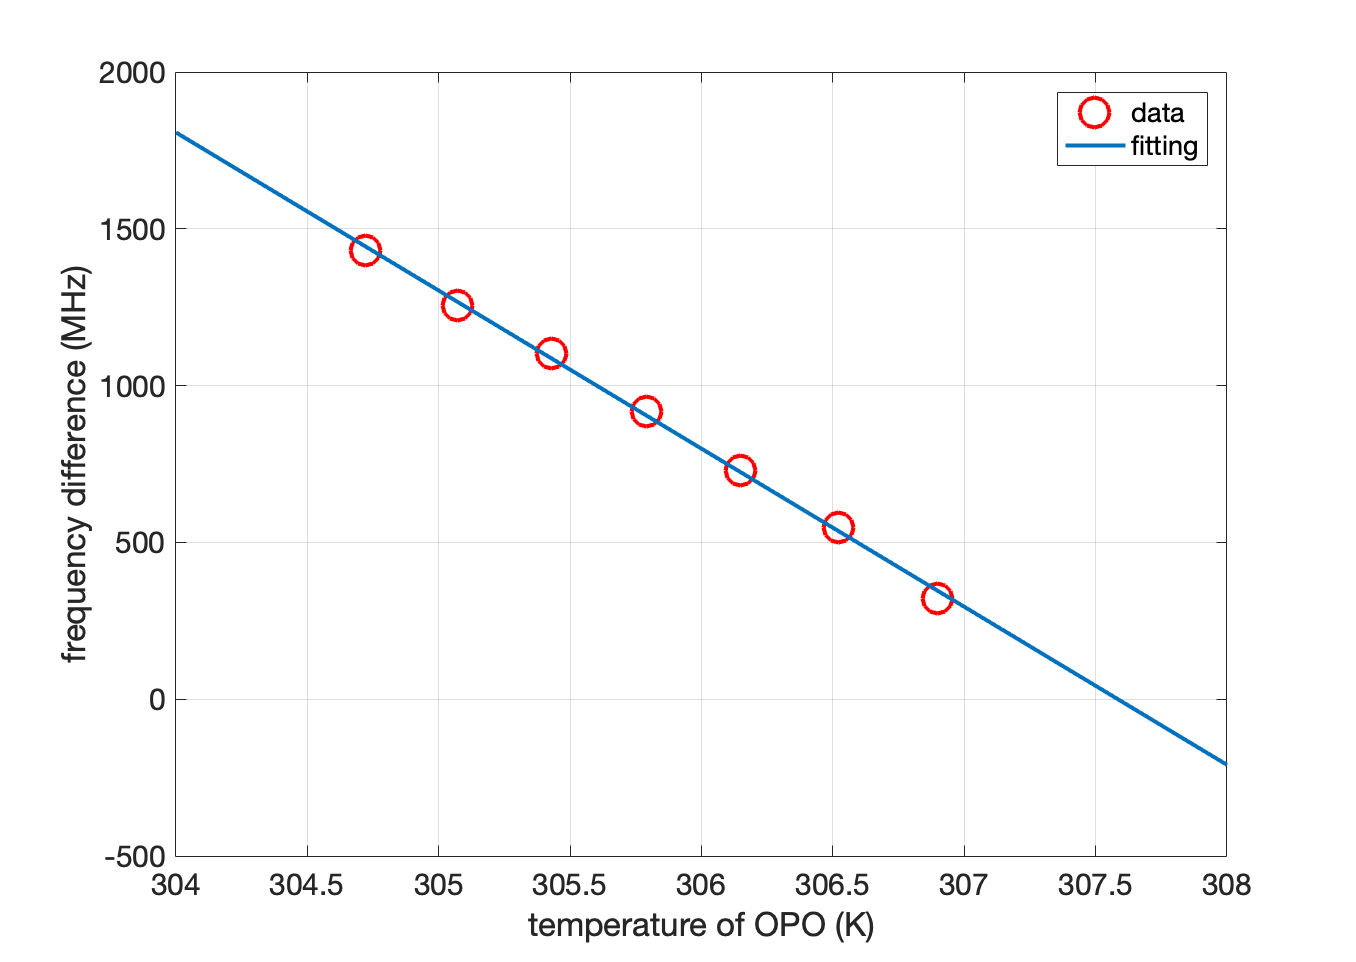
The measurement of birefringence effect is like this. We send both bright alignment beam(s-pol) and p-pol beam inside OPO. We set up temperature of OPO from 7.2kohm to 7.8kohm. At each temperature we change the temperature of p-pol laser so that to make s-pol and p-pol overlap on the oscilloscope. However, this measurement is also not very precise. Because it is very diffcult to know the exact frequency in which two polarization overlap. What we did is just to make the overlap peak as high as possible.
11/20~21 Participants: Chien-Ming, Shu-Rong, and Yuhang
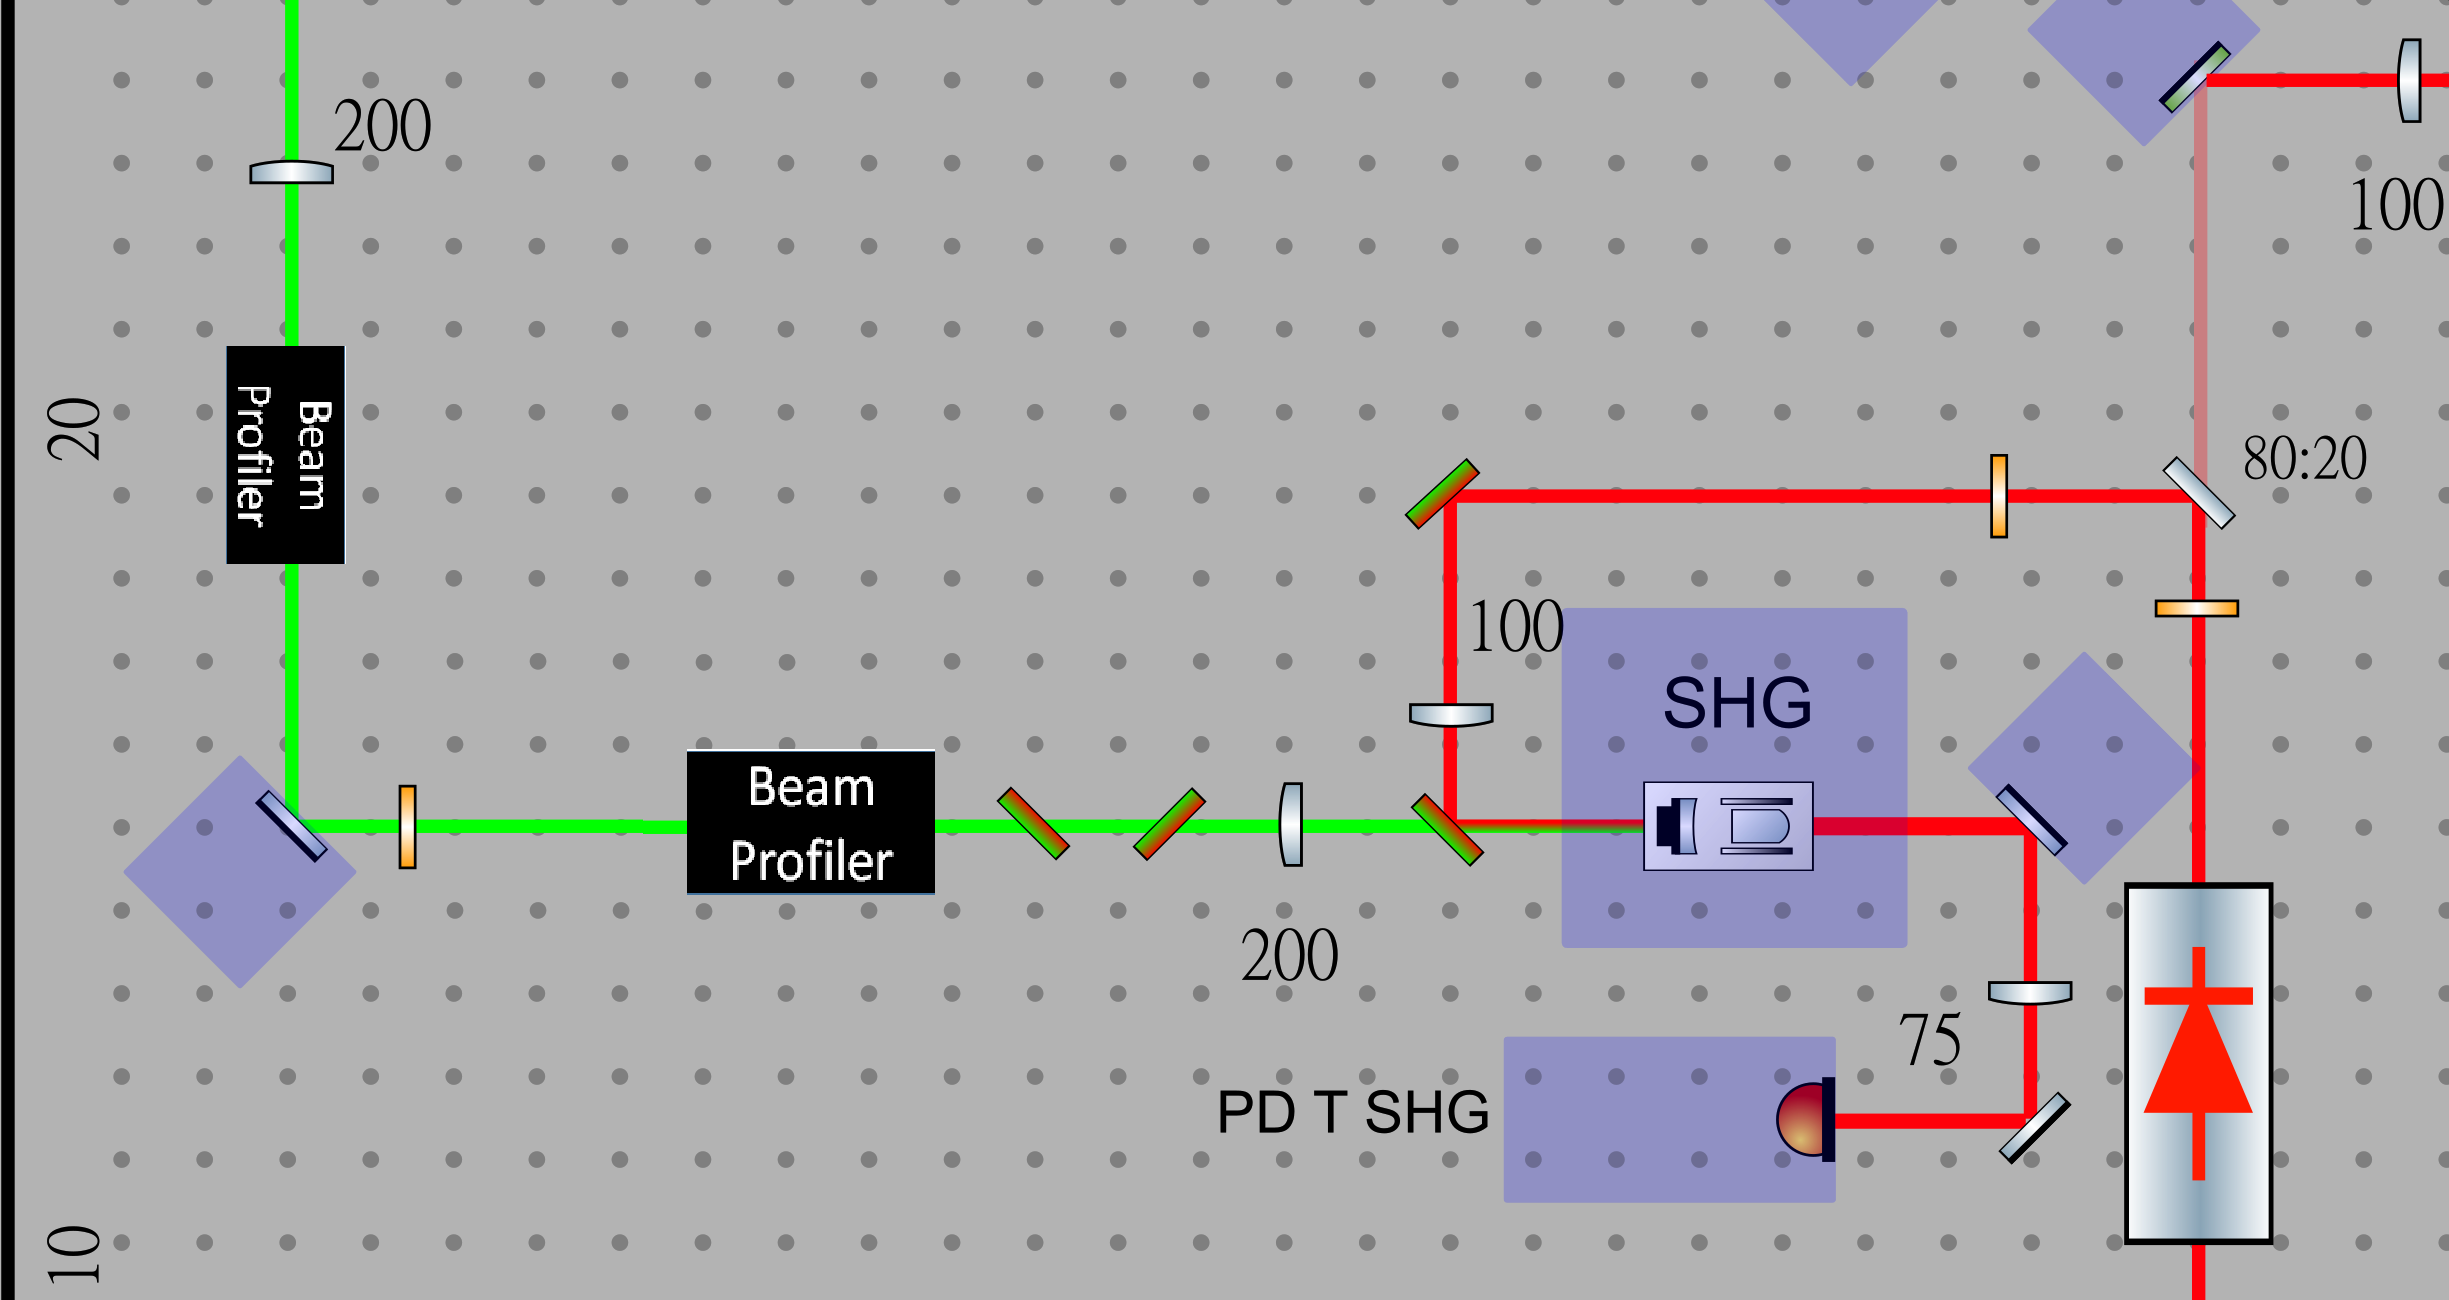
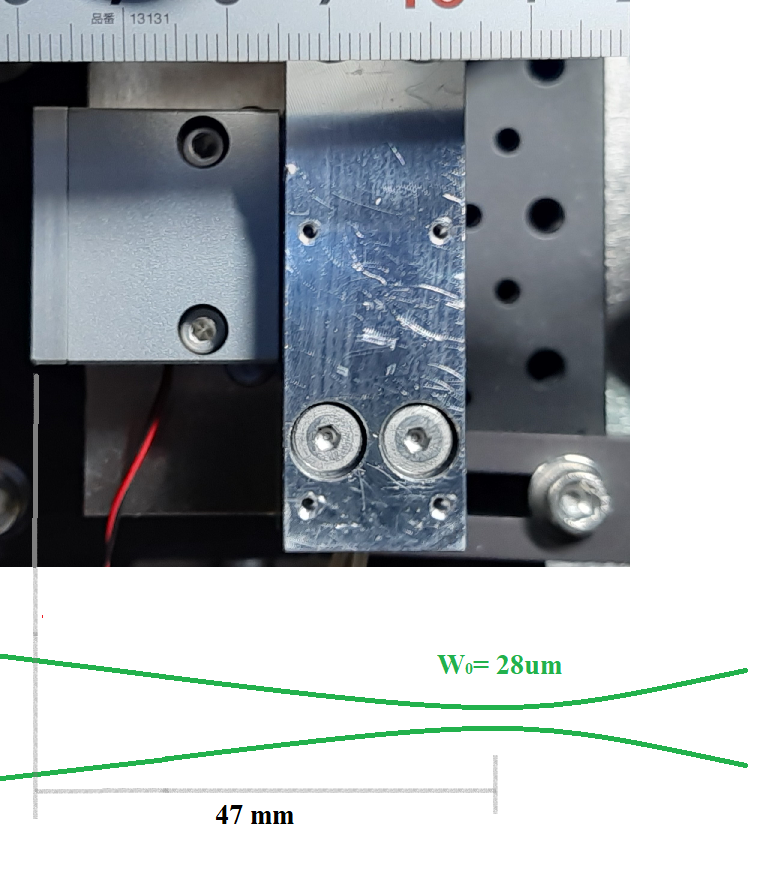
Yesterday we measured the SHG output green beam size again by removing the Faraday isolator and placing the beam profiler. (See Fig.1)
The fitting results indicate that the waist is 28 um inside the SHG and 47 mm from the edge of SHG output port. (see Fig.2)
This result is in the case where the SHG cavity concave mirror is not considered.
Yuhang found that he used the incorrect wavelength in his fitting on 11/19.
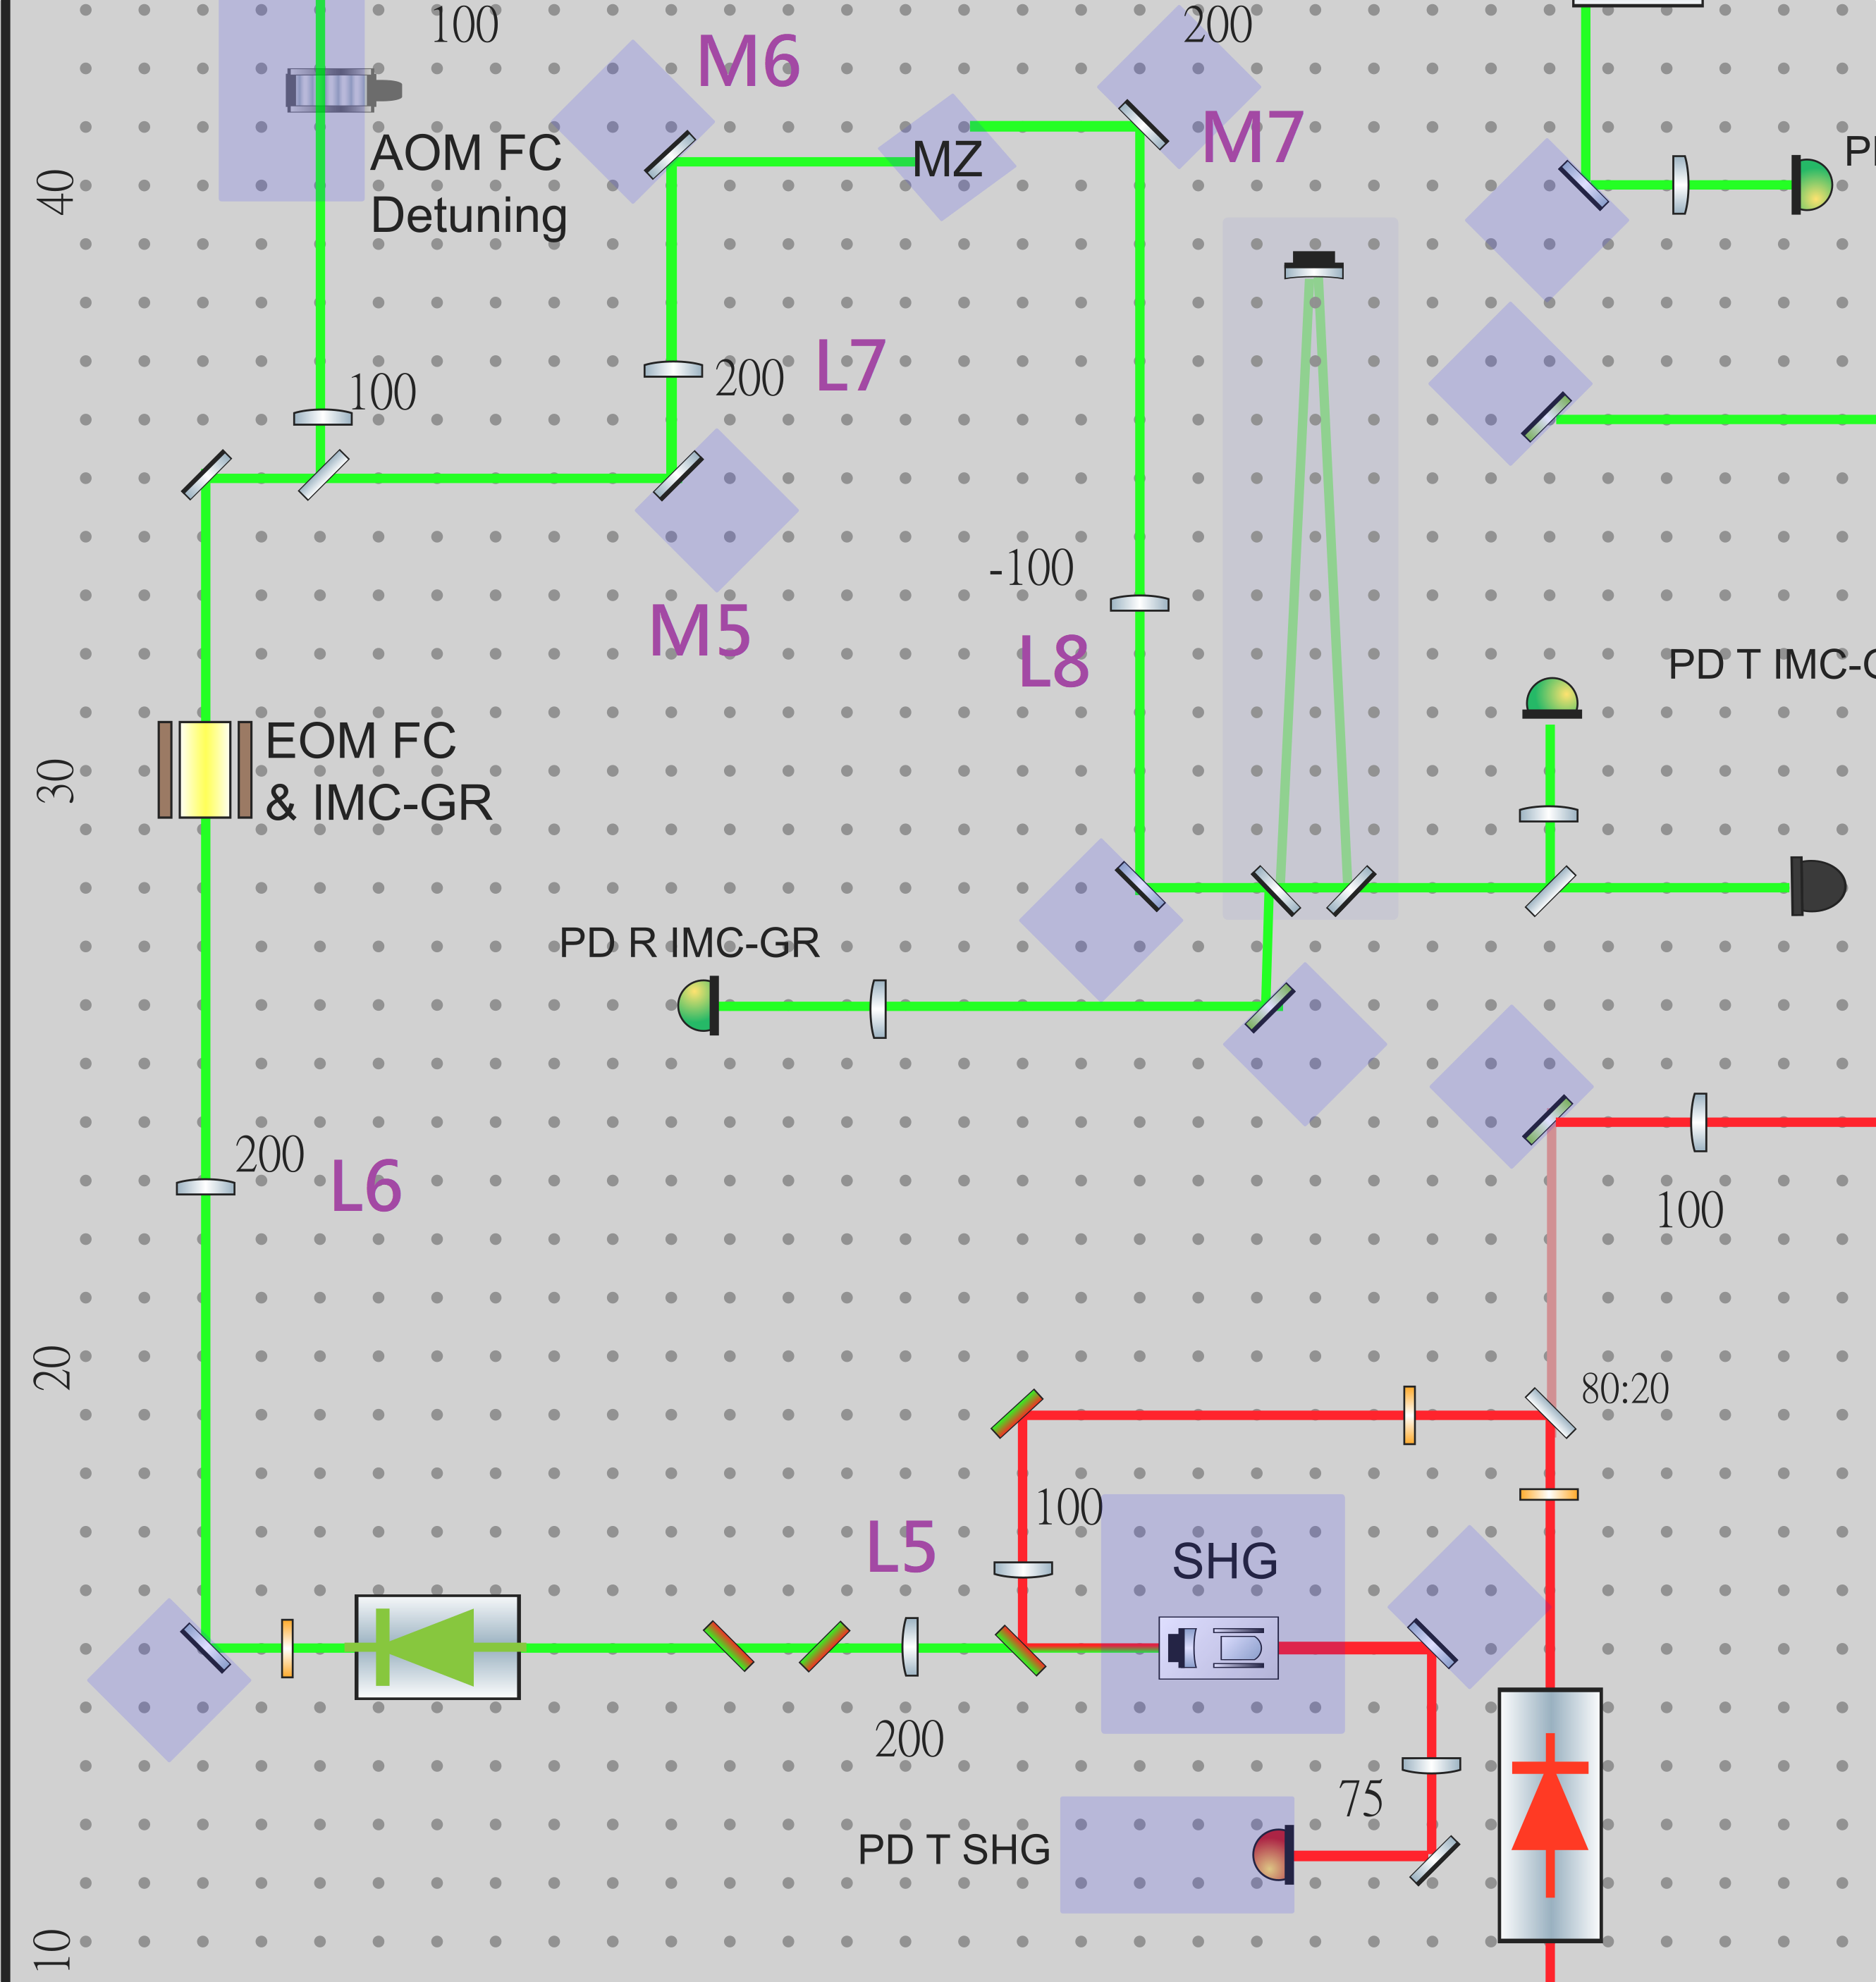
Today we tried to recover the mode matching of the green mode cleaner (GRMC) by only adjusting the position of the lens L6 and the alignments of mirrors M5, M6, and M7 as showing in Fig.3.
After optimizing, the new position of L6 on the rail moves from 48mm to 41.5mm (Equal to moving 6.5mm towards the EOM)
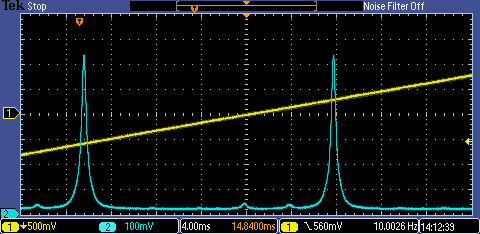
Fig.4 shows the mode matching transmission spectrum of the MC when the incident beam is p-polarization.
And Fig.5 is s-polarization.
The transmission efficiency of the MC is 77.7% when using p-pol incident beam and 54% when using s-pol beam. This means that if we want to reach 100 mW GRMC output power when using s-pol incident beam, we will need SHG to provide 270 mW green output power.
Participaint: Aritomi, Chienming Eleonora, Shurong and Yuhang
Since I reported the beam parameter has been changed after we did the mode matching of SHG. So we measured the beam coming out again and we decided to recover the beam before BS to recover the situation as before. (The BS we talk here is where the beam is seperated and goes to FC or GRMC seperately)
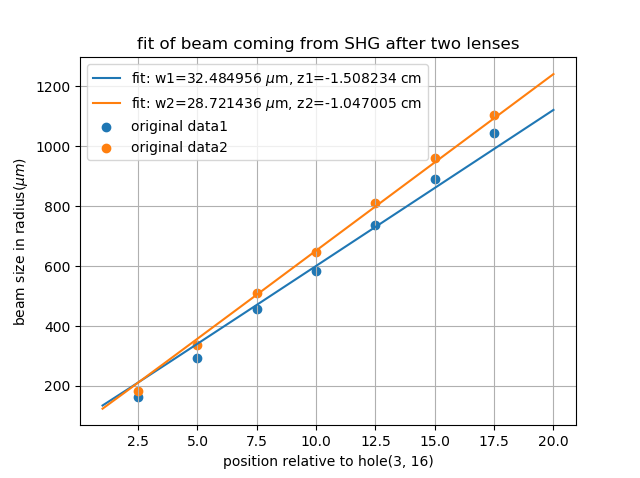
We put a 150mm lens 9 holes before the first measurement point(3, 17).(now between SHG and measurement point, there is a 200mm 13.8 holes before the first measurement point already there). We dismounted the second lens after SHG to have space measuring beam parameter. The measurement region is between a steering mirror and EOM. The measurement result is shown below.
326, 588, 914, 1165, 1477, 1779, 2090
364, 676, 1018, 1296, 1623, 1921, 2210
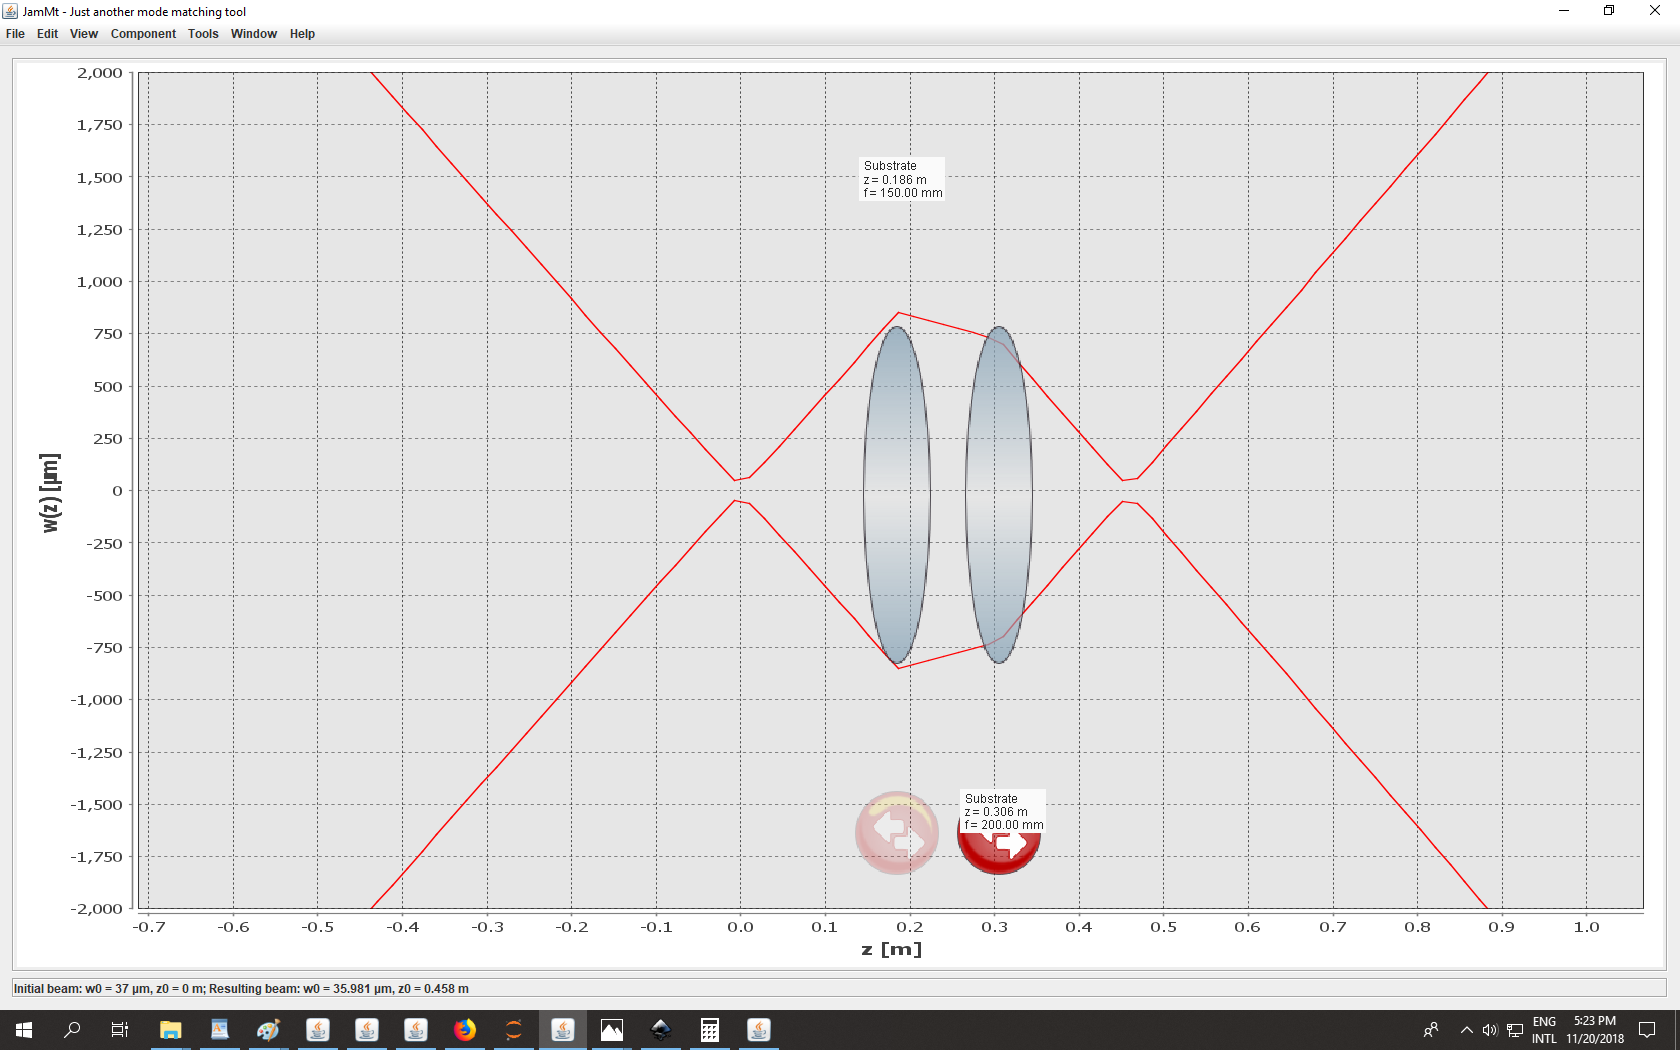
The fit result is shown in the first attached figure. Then we use this result to trace back beam to SHG. This trace back process is shown in the attached figure 2. This is an important result, the beam waist size is 36um inside SHG.
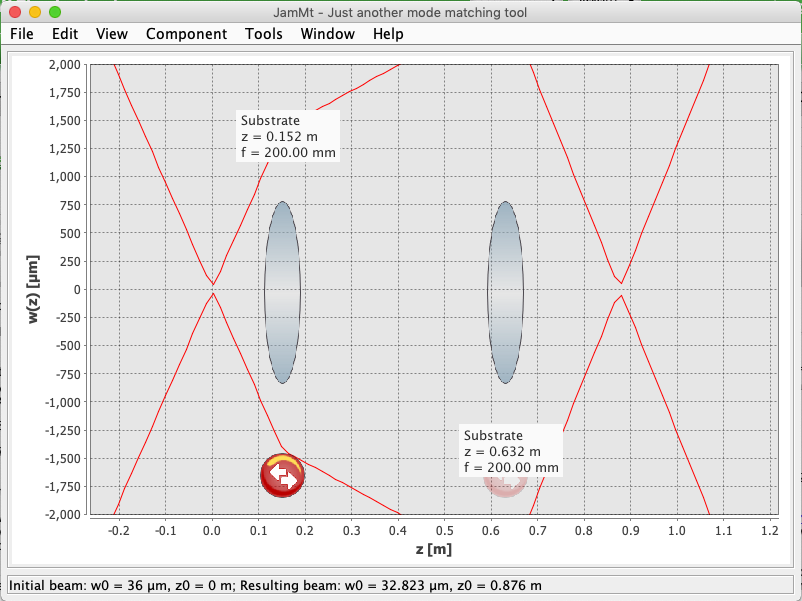
Then we used this SHG new waist size and the current set-up to propogate it to the waist around BS. Because we have the measurement we did before to compare. We found the beam waist before was 26um. But now according to the measurement and some necessary simulation, the waist size now is 32um. Since it is close to our good value, we foresee the recover of mode matching by moving only the second lens.
The recover is done by looking at camera image and pd spectrum together. At the beginning, we found the pitch alignment is quite large, we recovered this degree of freedom first. Then we clean and center all the steering mirrors and lenses going to mach-zender. By keeping the TEM00 on camera and maximazing it, the alignment is recovered. Now the green mode cleaner is recovered.