NAOJ GW Elog Logbook 3.2

Simon
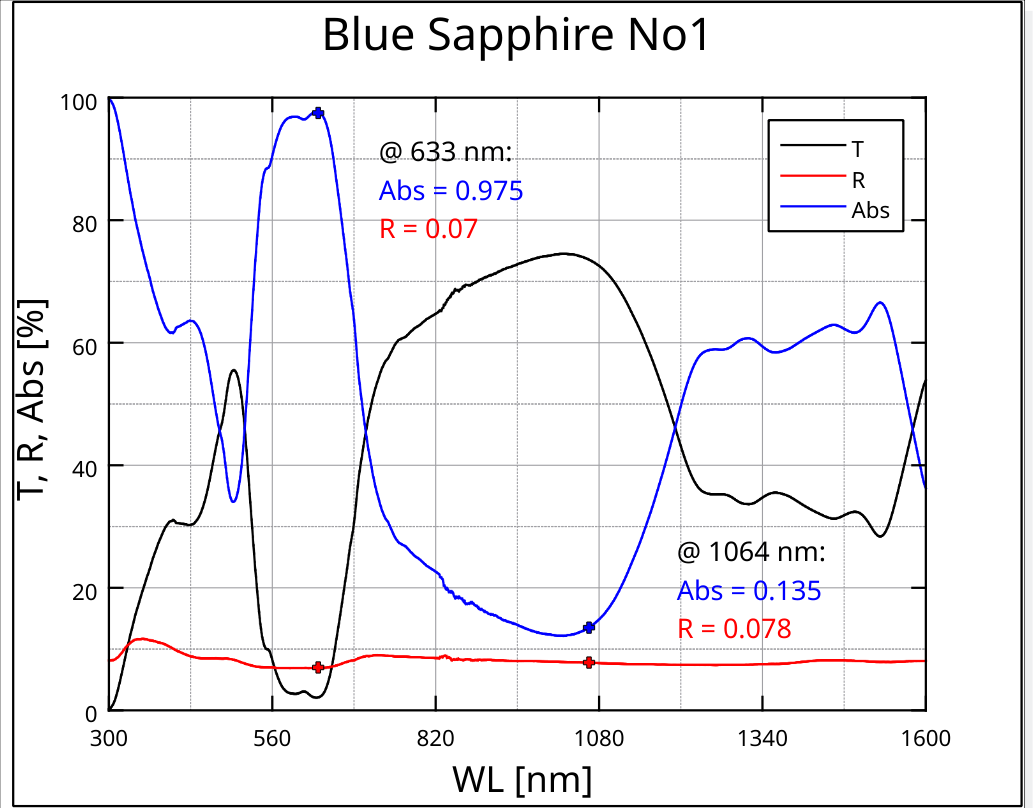
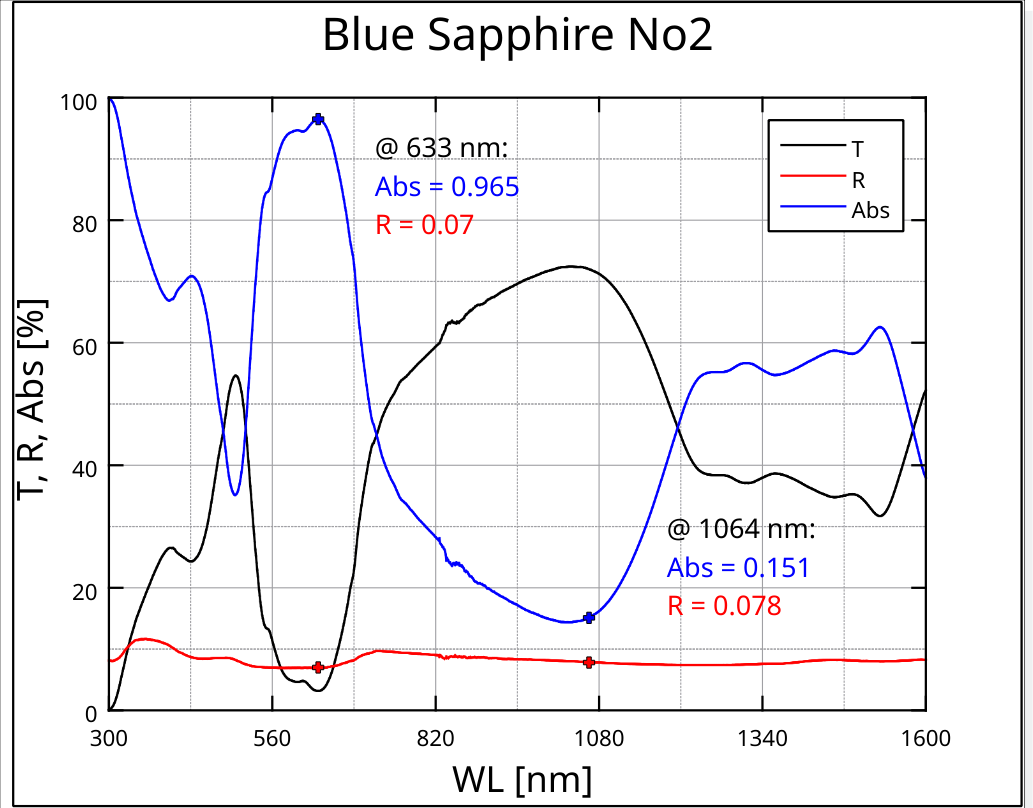
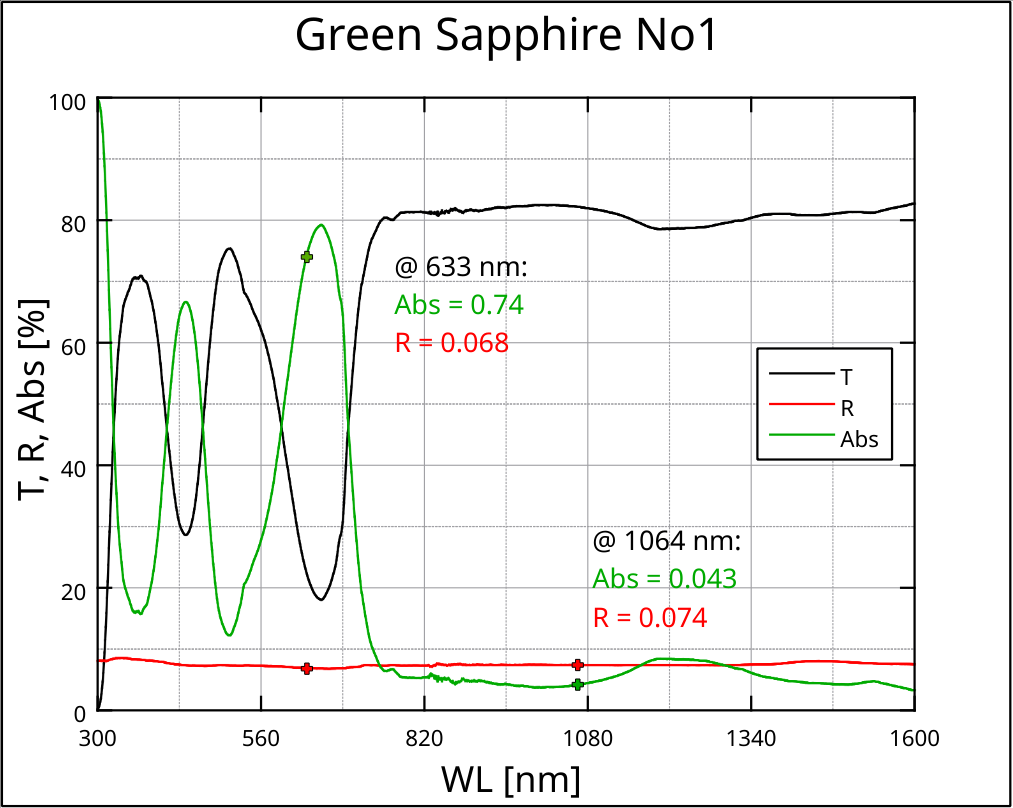
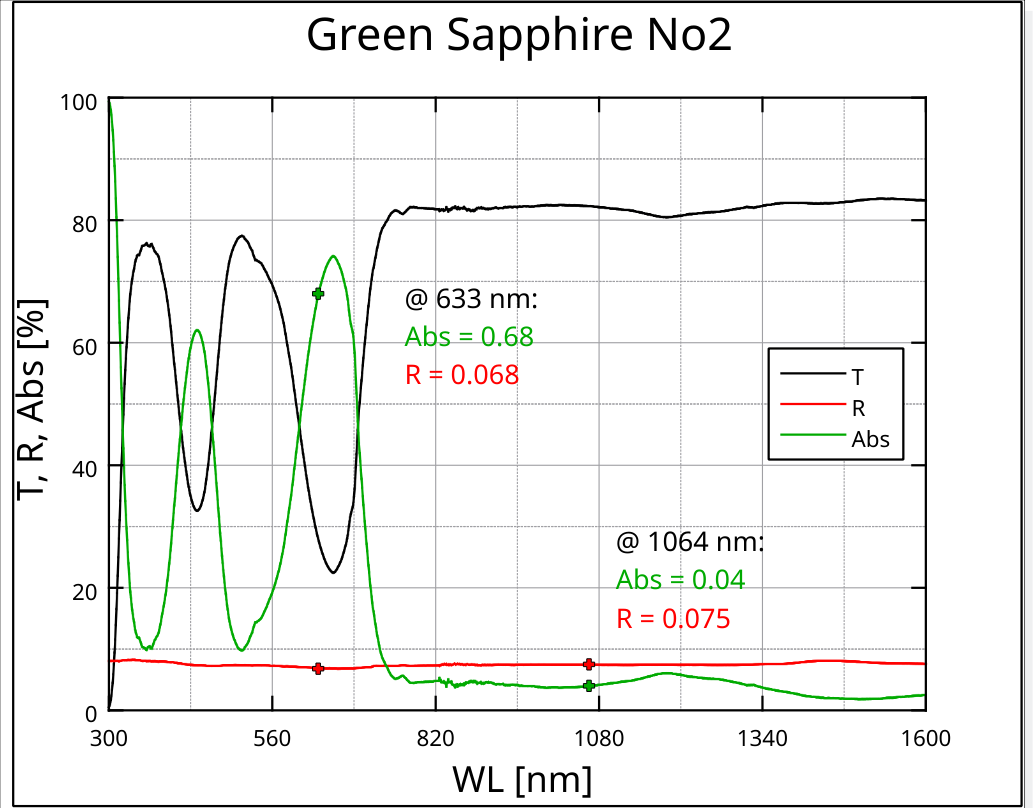
I recalculated the absorbance values to take into account the small transmittances we got from the spectra taken at the ATC for all colored Sapphire samples.
The new spectra, now also with reference values at 633nm, can be found in the attachement.
Pengbo, Simon
We removed the OSTM and packed it again. It is now located in the small shelf inside the clean room.
After that, we recalibrated the system.
The calibration values are:
R_surf = 17.86 1/W
(AC = 0.54V, DC = 4.58V, P_in = 0.030W, abs_surfref = 0.22)
R_bulk = 0.8 cm/W
(DC = 0.105V, AC = 5.42V, P_in = 0.030W, abs_bulkref = 1.04/cm)
Then, we exchanged the calibration sample with the first of the 5 small Shinkosha Sapphire samples: S5 (2" x 20mm)
We located the center of the sample as [X,Y,Z] = [327.25, 122, 33.5].
The transmittance of the sample is T ~ 0.85
Since we cannot set 10W as an input power and leave it as it is while moving the sample into the beam and out again (the sample holder will cut the beam otherwise), we set the power to its minimum trough the polarizer while it is feeded with 7A current and used the beam-shutter for moving the sample holder. In the center position, we set the power to maximum. The transmitted beam power has been measured to be 8.4W.
Now the map is being taken with 15mm radius.
Aritomi and Yuhang
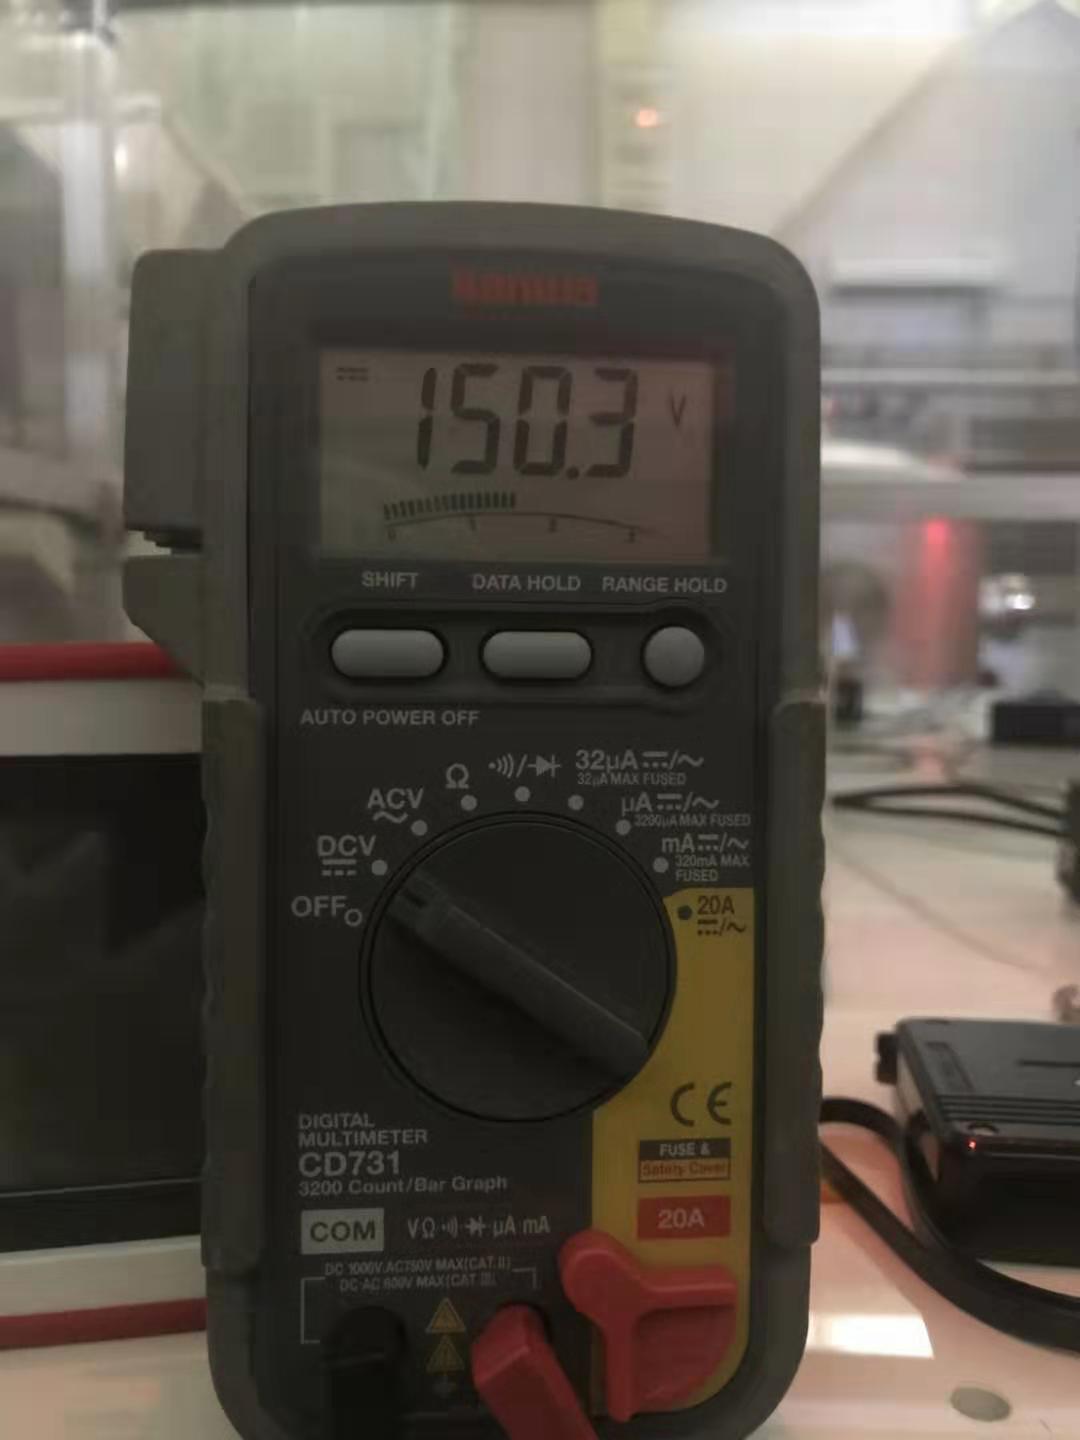
We found the problem of the small RF signal of the AA's quadrant (elog1670). Matteo T suggested checking the bias. We turned on the button on the quadrant box and measured the voltage at the end of the power cable. We checked with multi-meter and it shows 150V reached quadrant.
So bias seems not to be a problem.
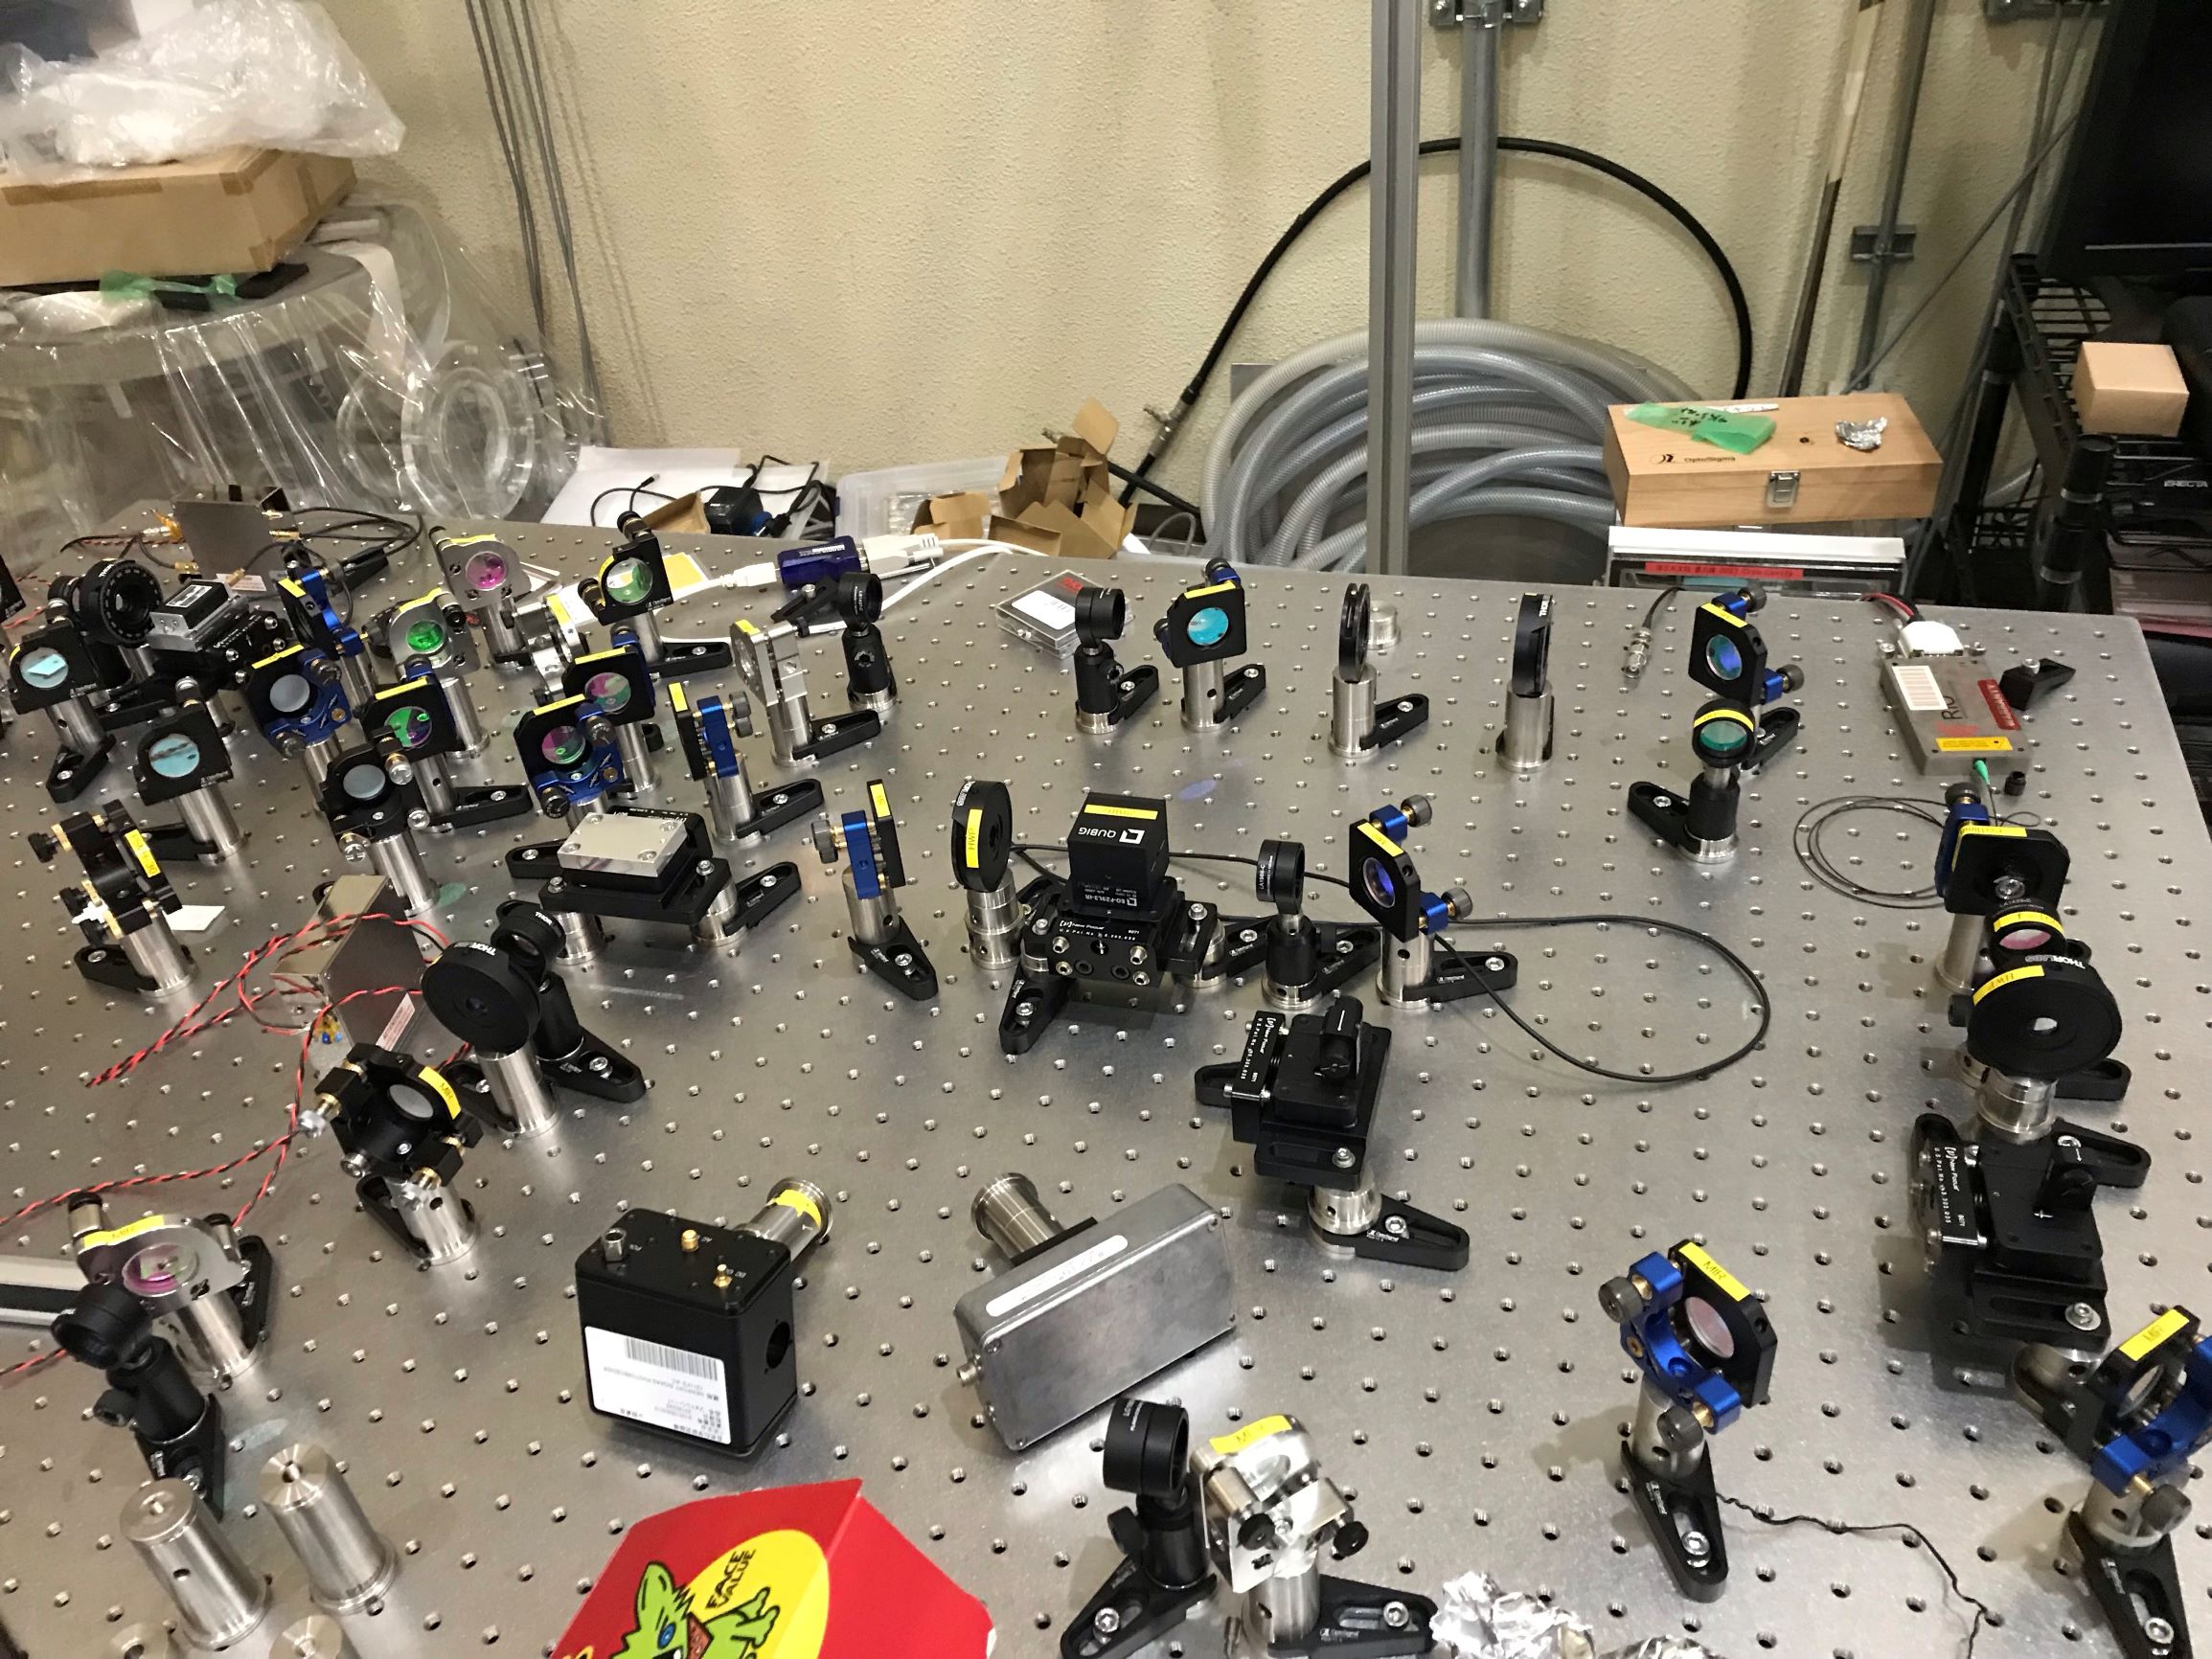
I installed 3 steering mirrors for HOMs beam paths to roughly decide where to put PDs for intensity stabilization.
2 HOM-beams are roughly alinged into STMs which are for the alignment for cryogenic cavity.
Attached is the picture of current situation of optical table.
- fluctuation of IR transmission from filter cavity (entry 1701)
- large CC2 phase noise from filter cavity (entry 1695)
- large bump in shot noise spectrum at low frequency (entry 1529)
[Aritomi, Yuhang]
We measured mode matching when filter cavity is aligned with pitch dithering. The result is as follows. Mode matching was around 90%. We found that when pitch dithering was engaged, pitch misalignment became less, but yaw misalignment became more.
| Mode | AOM frequency (MHz) | IR transmission |
| TEM00 | 109.03607 | 3000 |
| HG10 | 109.43128 | 350 |
| HG01 | 109.43219 | 200 |
| IG02 | 109.8288 | 115 |
| offset | 94 |
IR TEM00 transmission was fluctuating even when dithering was engaged (attached movie). Time scale of the movie is 2s and DC offset is 94.
We measured BAB reflection when BAB is on/off resonance. Off resonance reflectivity is 82% and the reflection might be still cutted.

I modified the simulink model to include the possibility to feedback the CC2 correction signal to the length d.o.f. of the input mass.
The ADC channel where to inject the CC2 signal is the n 13 in the top BNCtoDsub converter in the clean room (named ADC0 Ch16-32).
I modified the medm screen accordingly. Next step will be to optimize the length driving of the input mirror.
On Wed 02/10 we had another timed-out error on diaggui. It was solved by restarting the standalone. It happened ~13 days after the previous one. (entry #1650).
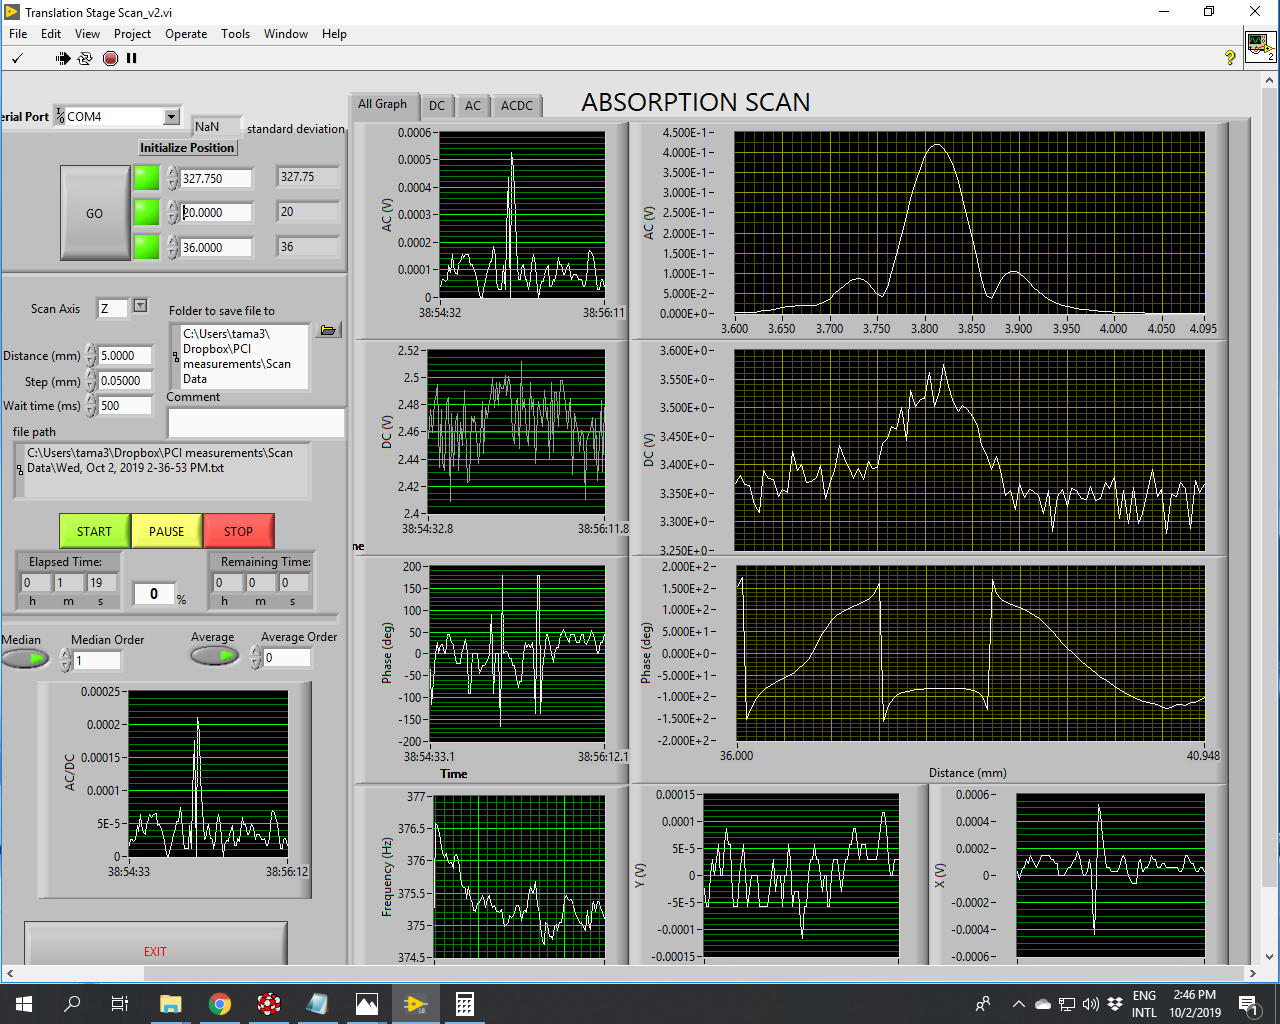
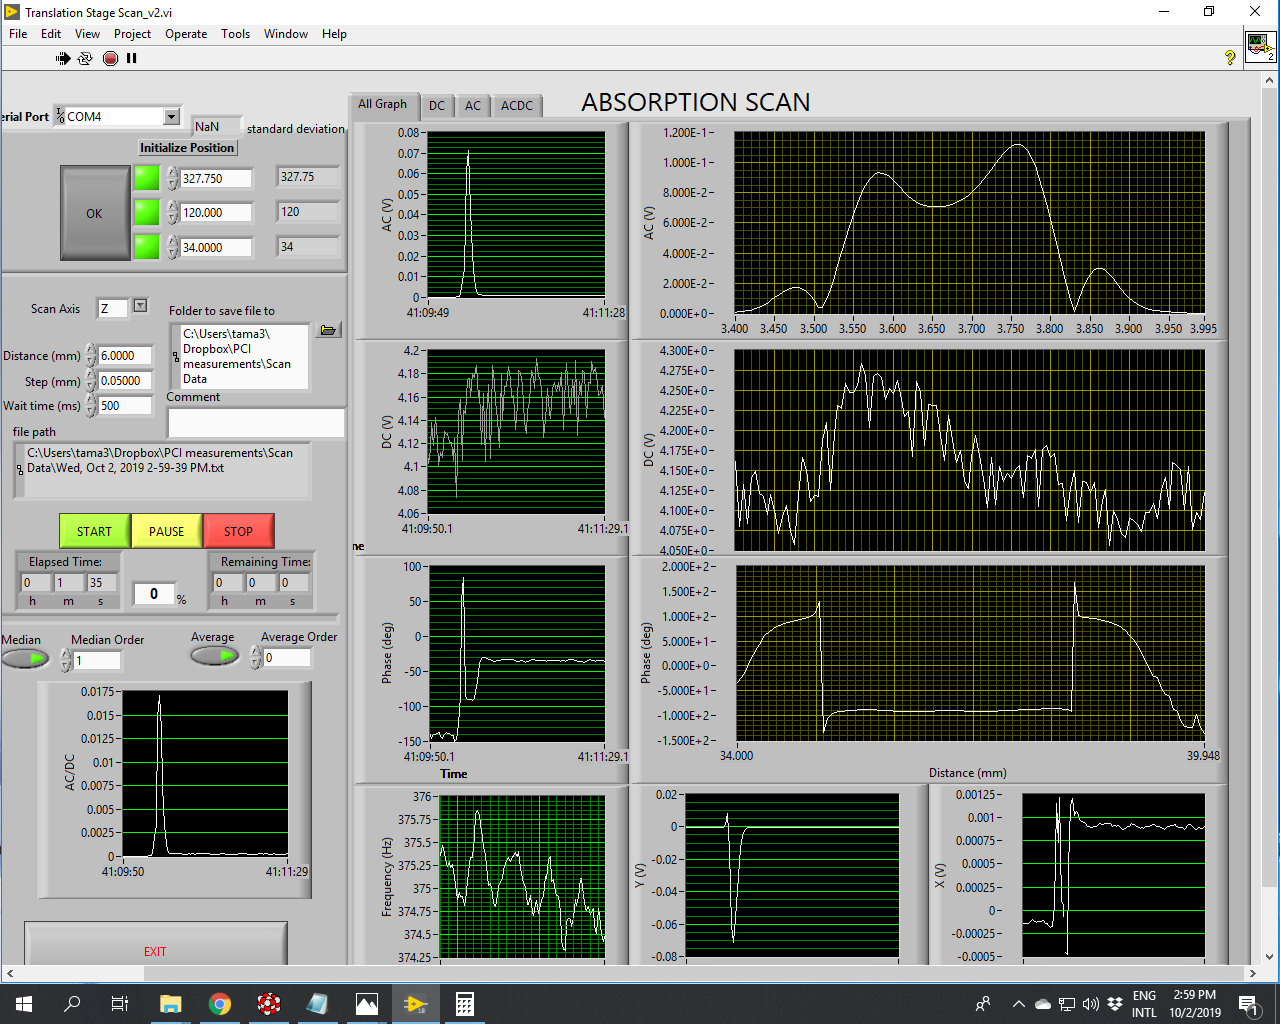
Pengbo, Simon
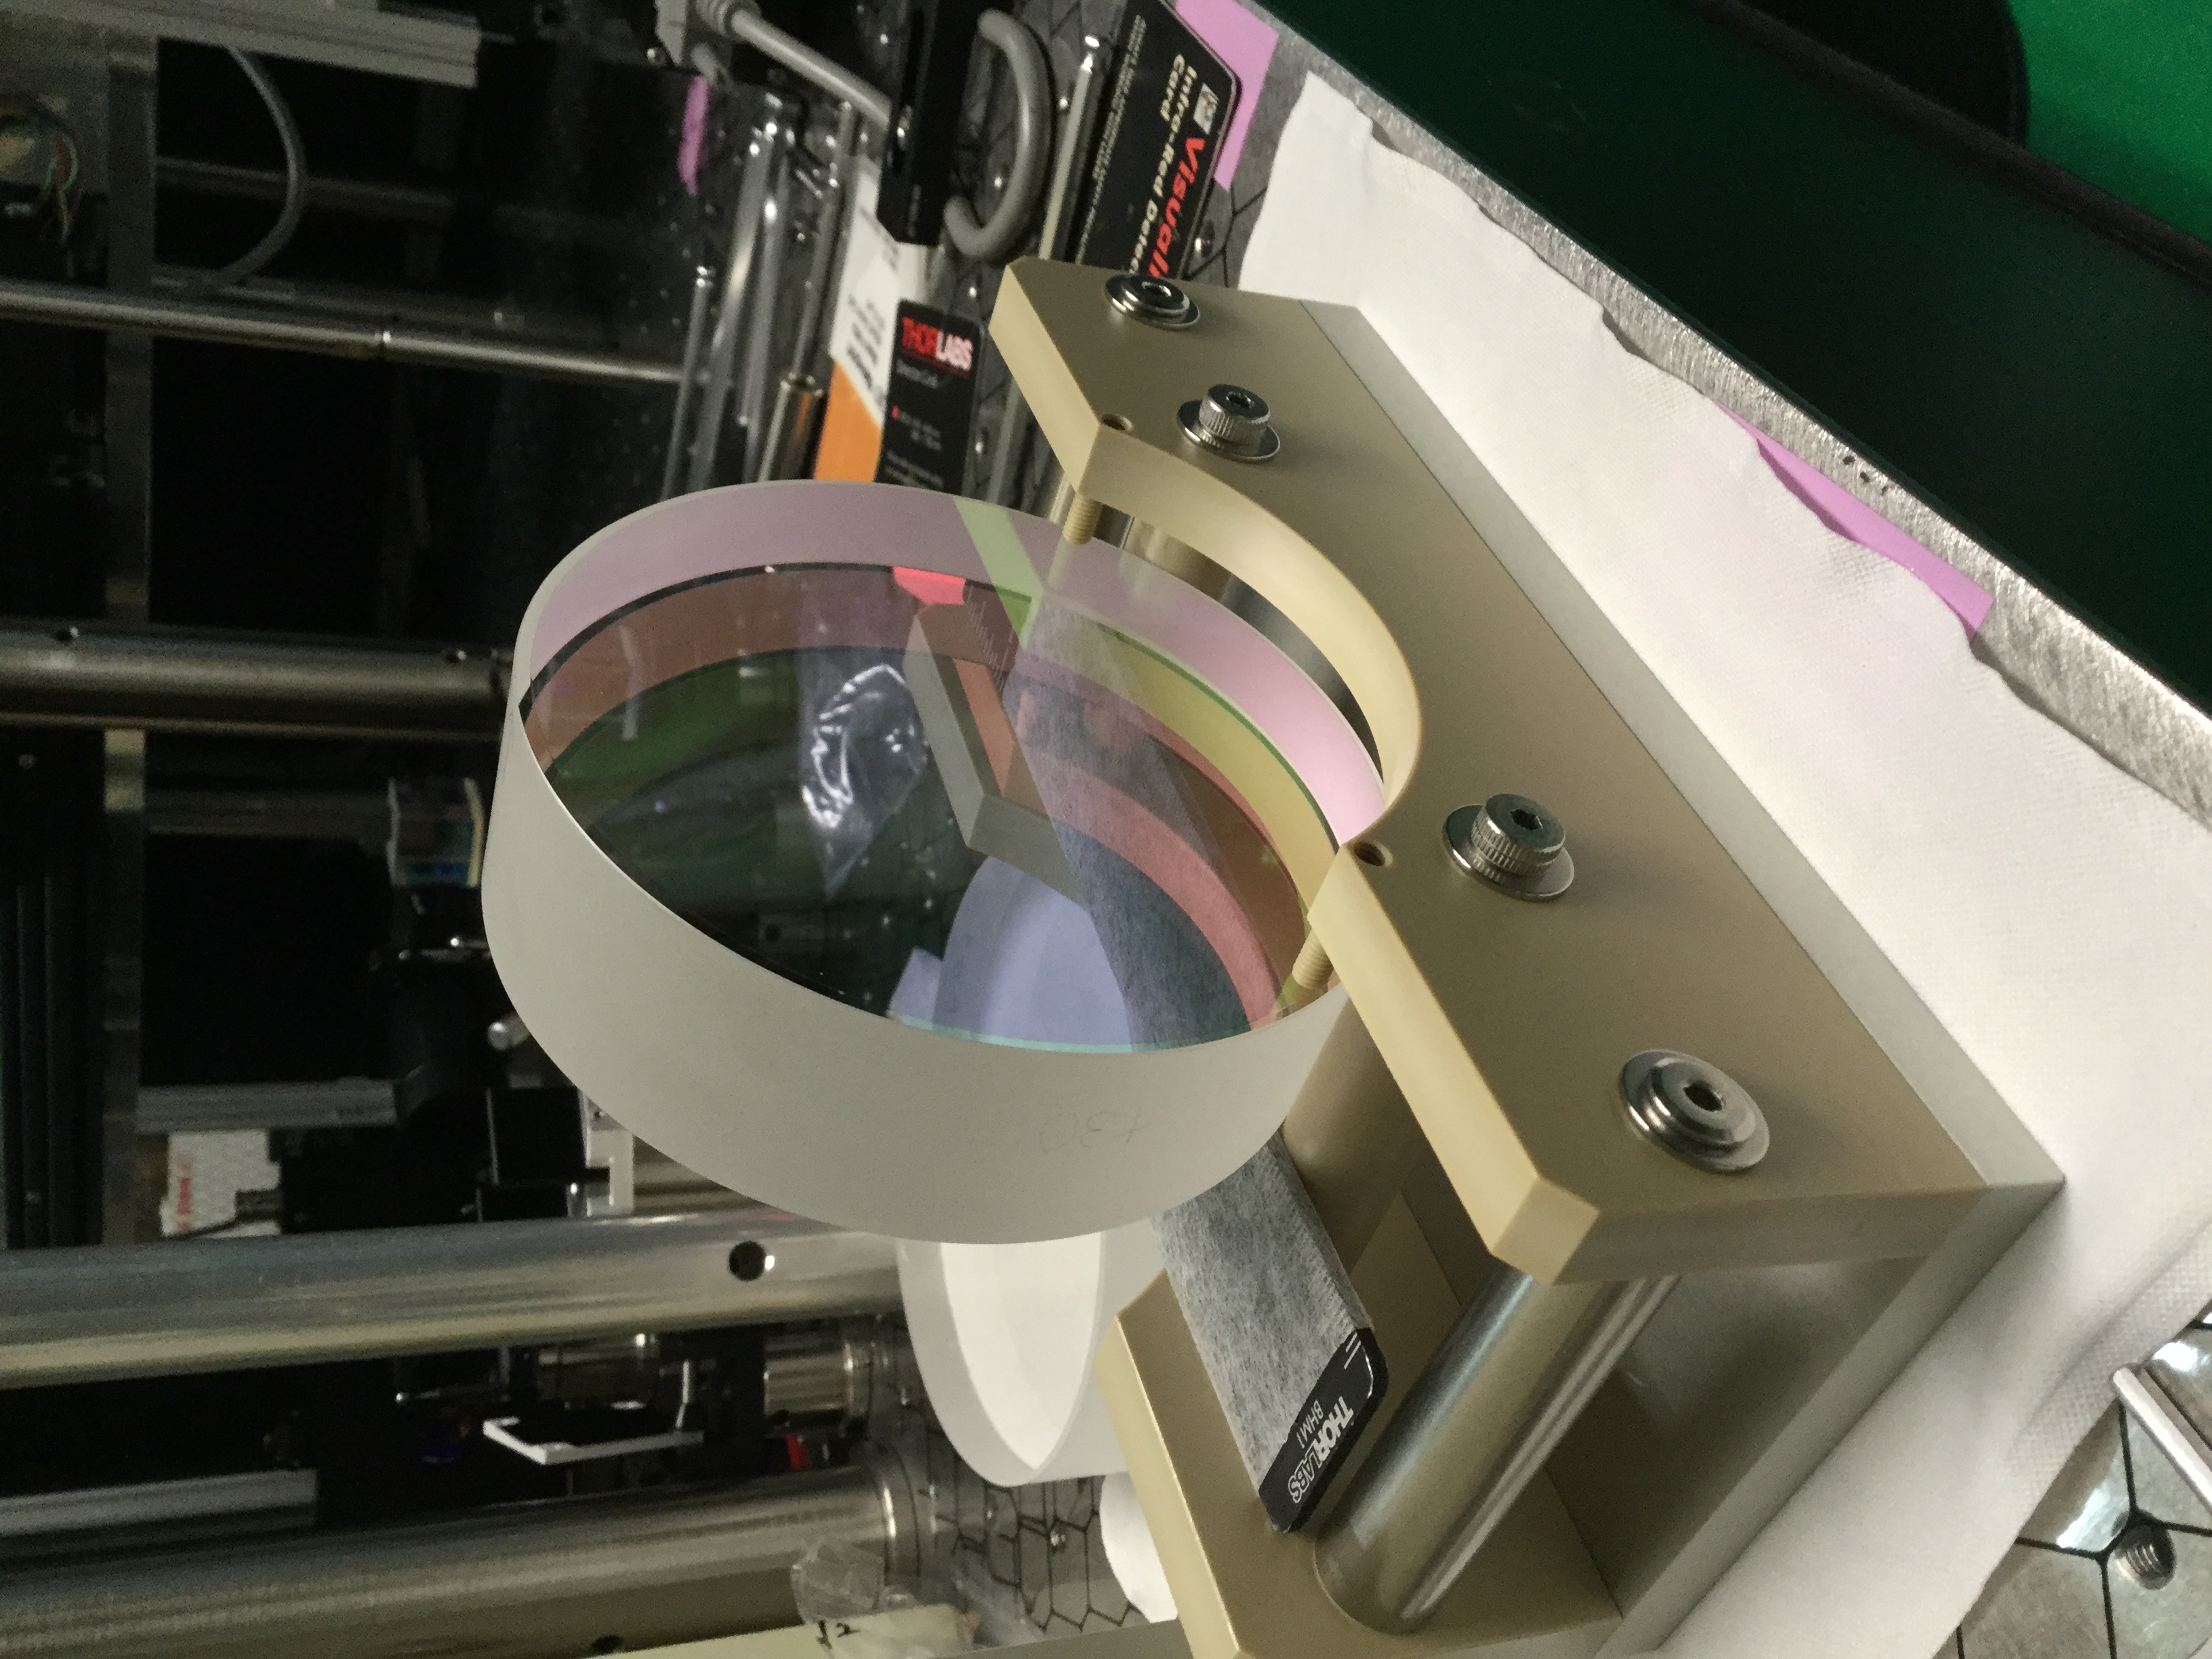
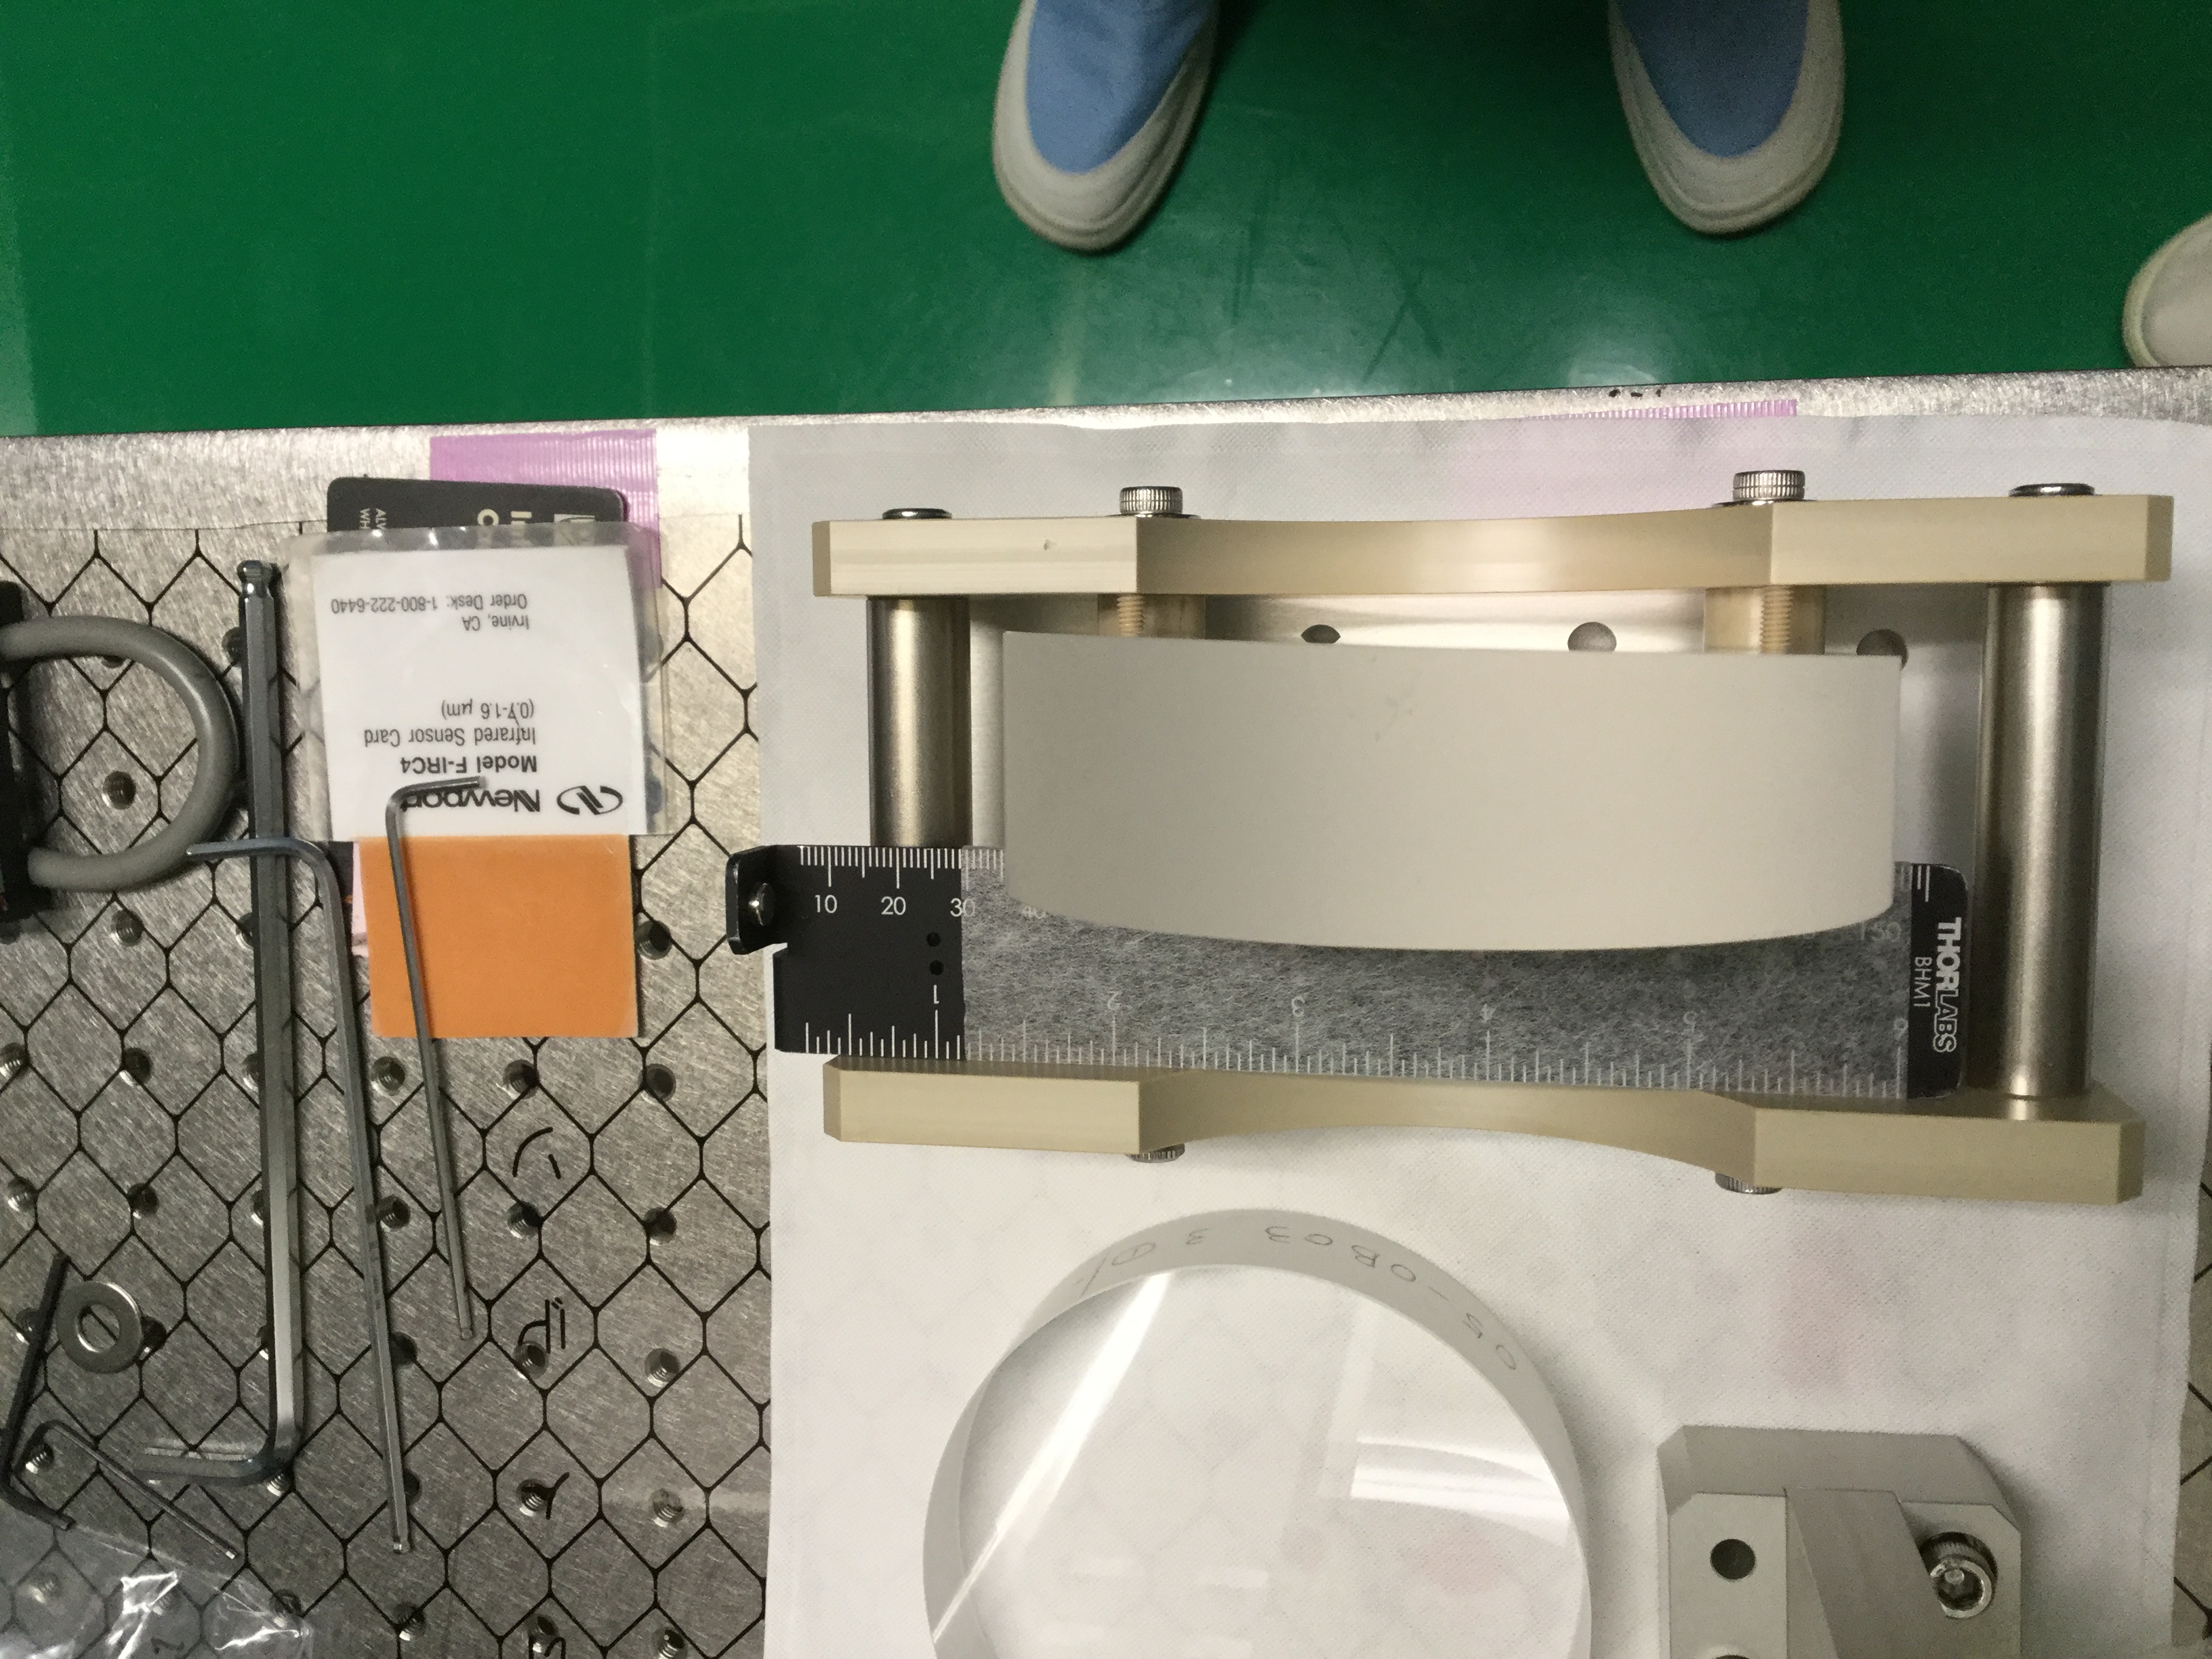
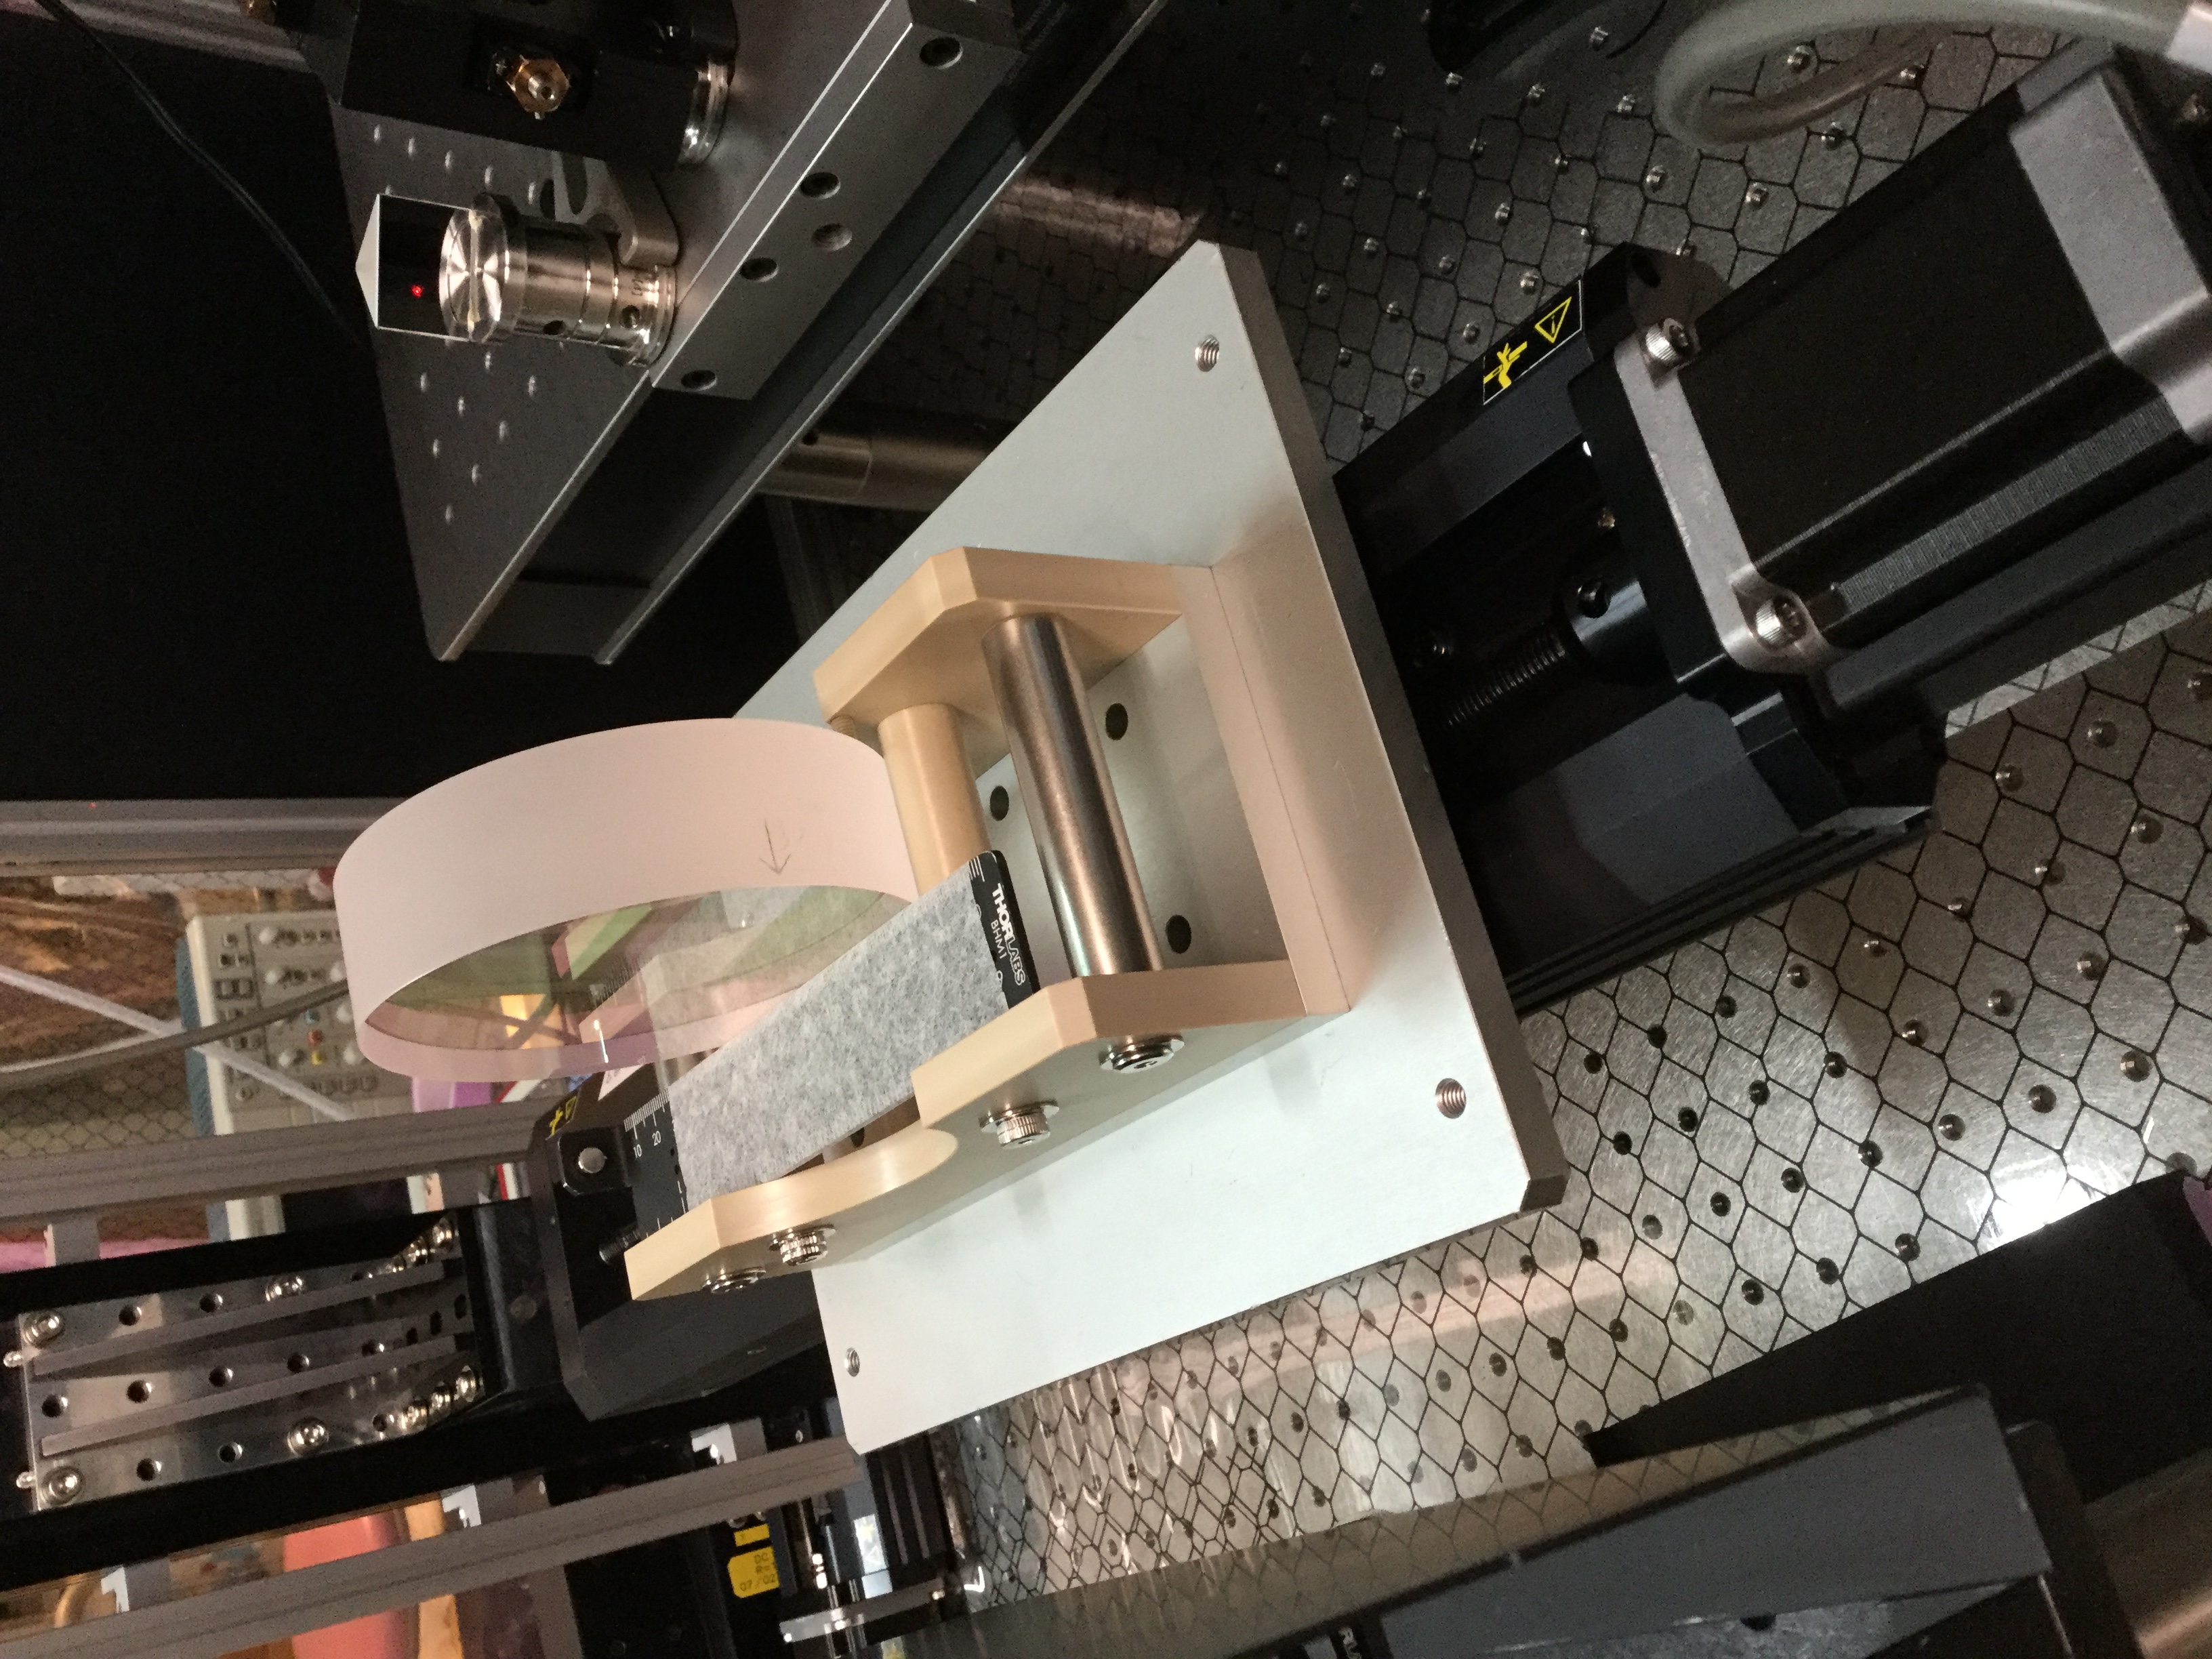
We have started to analyze the coated OSTM from Shinkosha regading the absorption of the HR side.
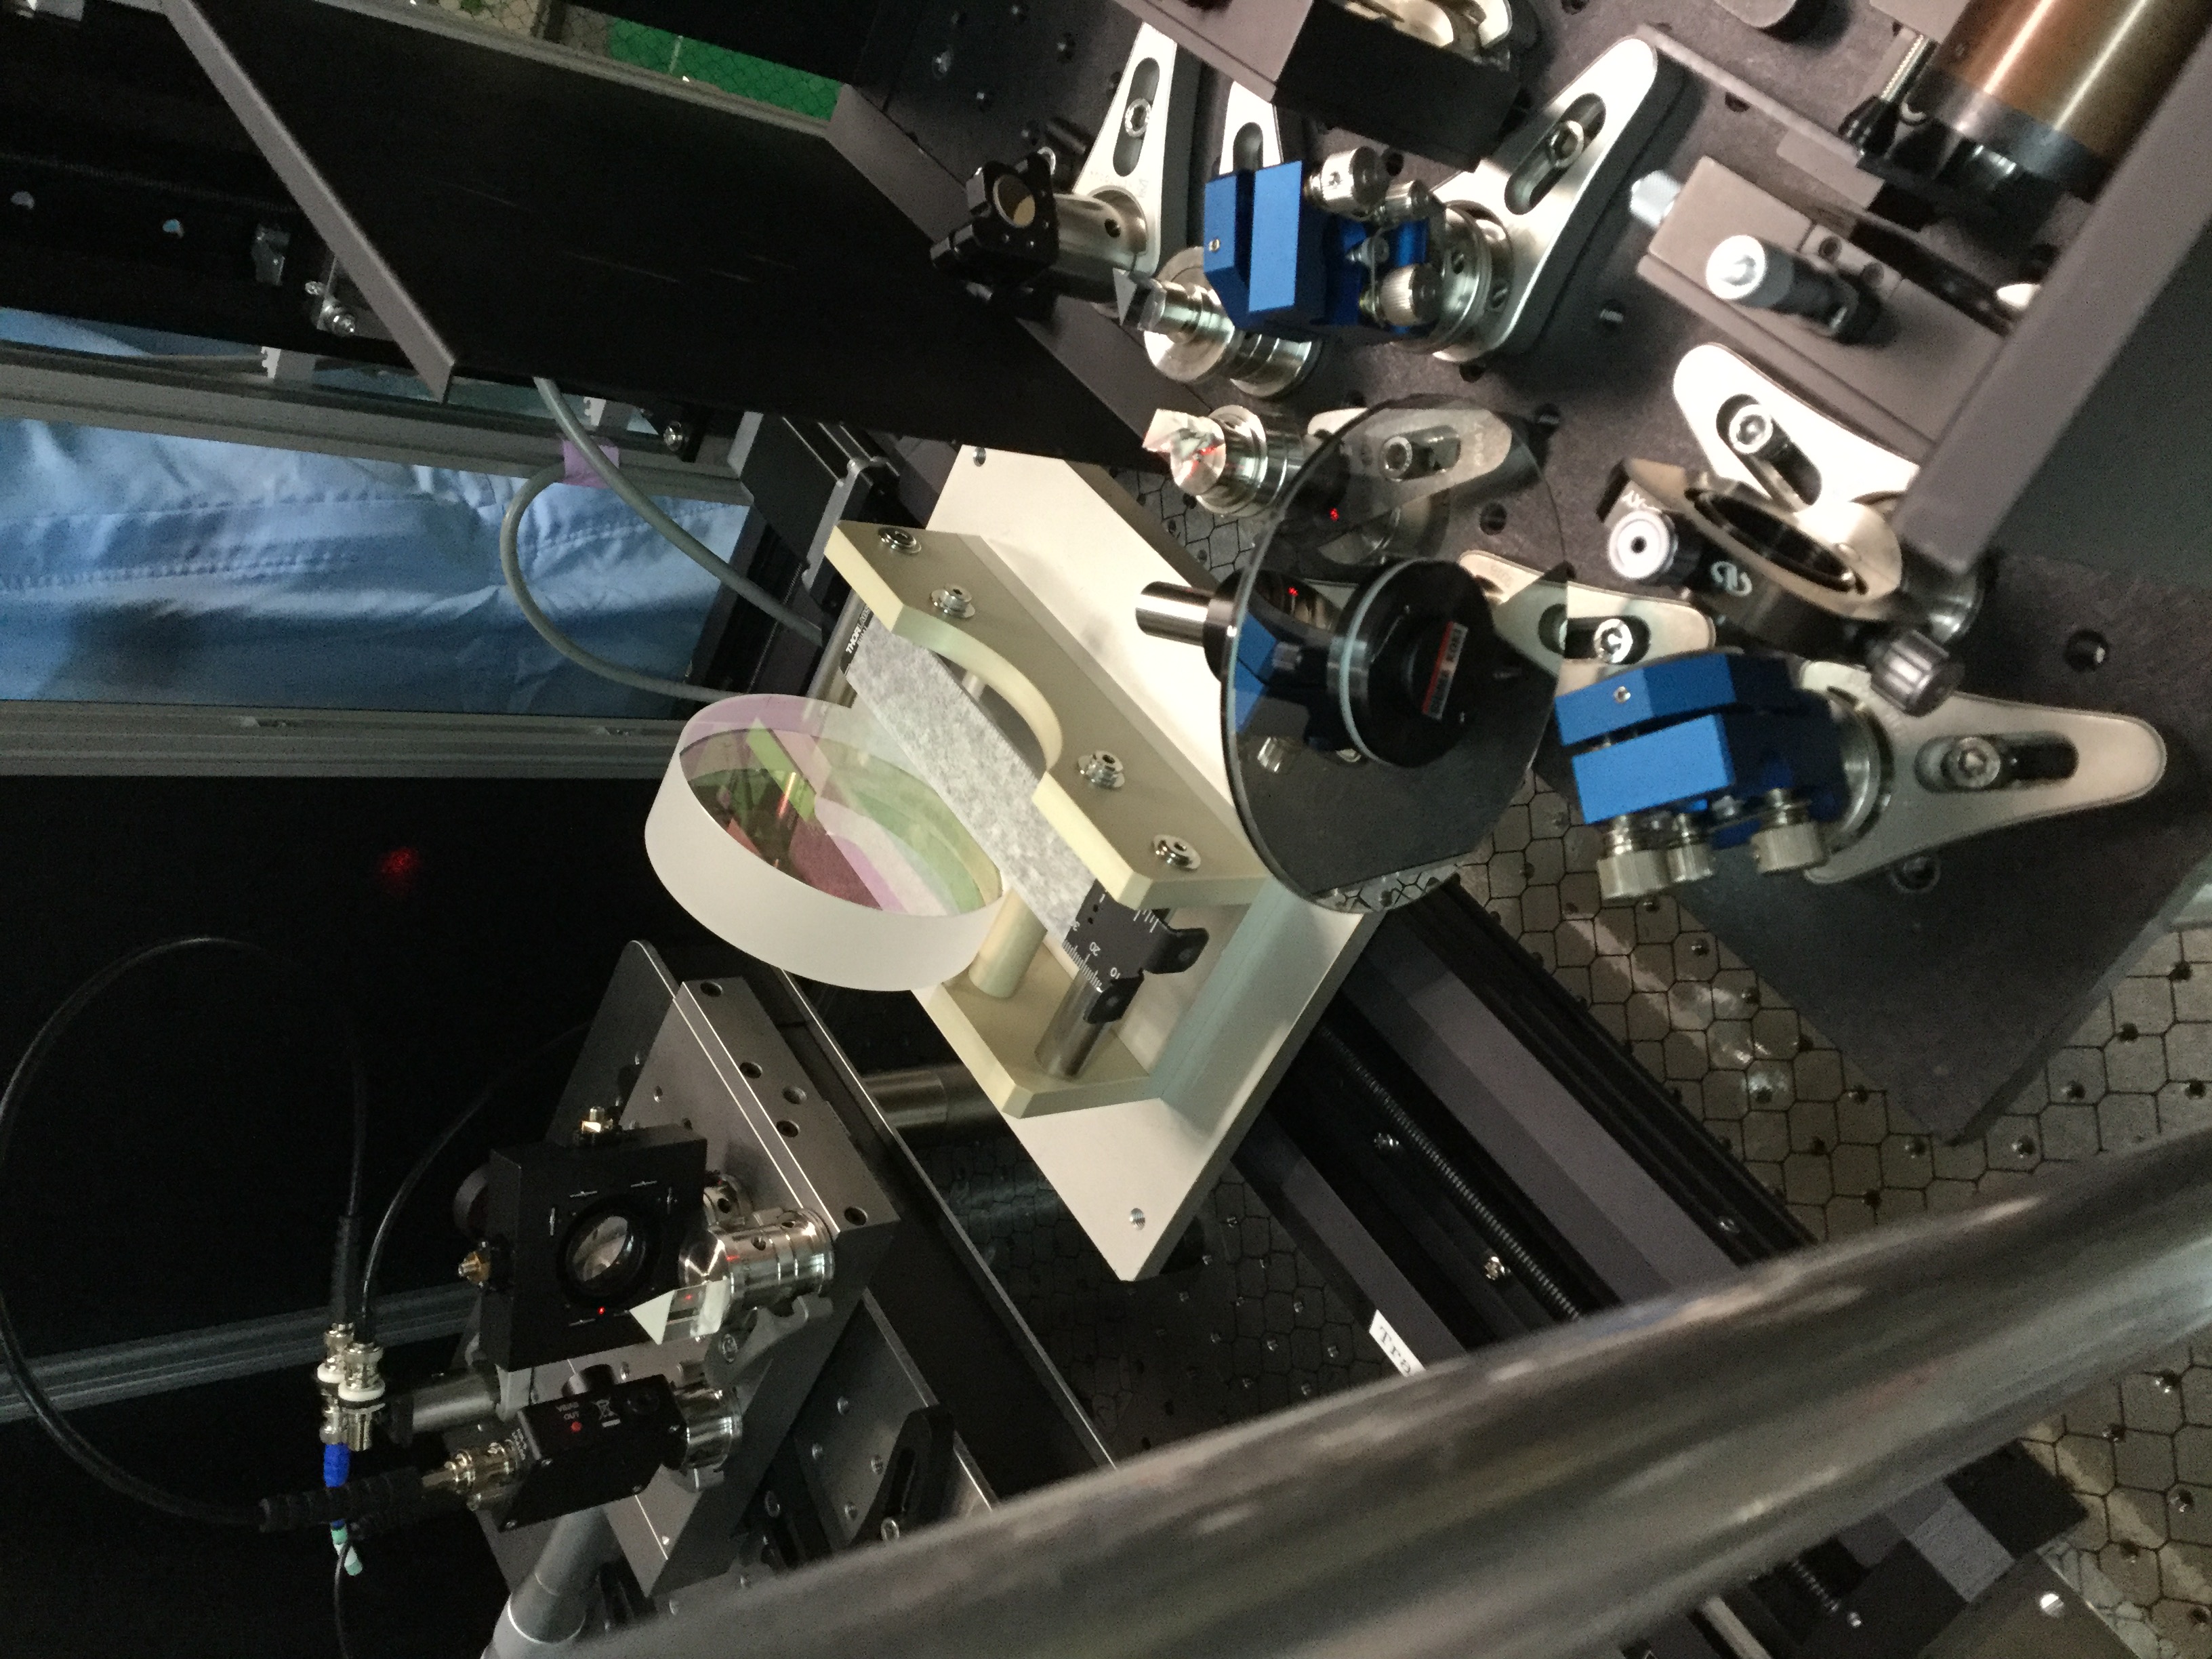
First, we took out the OSTM and inspected the mirror visually. We found pencil marks on the barrel and among them an arrow that indicates the thicker side of the wedged substrate and shows toward the HR side of the mirror (see attached photos).
The actual orientation of the sample inside the sample holder was a little bit tricky mainly because of the wedge and the size of the sample-holder which is basically too large for such a mirror.
- At first, we tried to put the thicker side upside to have a somewhat parallel orientation between sample-holder and mirror-plane (as can be seen from the pictures, we are using a - with optical tissue - covered ruler as a spacer). However, we recognized that this will distract the pump-beam so that it cannot be measured anymore regarding its power.
- Therefore, secondly, we rotated the mirror by 90 degrees so that the distraction of both pump and probe beam is only parallel to the optical table which can be counter measured by a respective relocalisation of the IU and the photometer. However, with this position, the HR coating is facing the pump but also the spacer, which we originally wanted to avoid
- Especially regarding the probe, we had to change the IU position by ~3mm less than it would have been the case for a wedge-free substrate
After the alignment of the sample, we looked for the exact position of the HR-coating by applying Z-scans. We carefully increased the laser power to take care that the coating is not damaged (initially, we did this on the outer edges of the mirror of course).
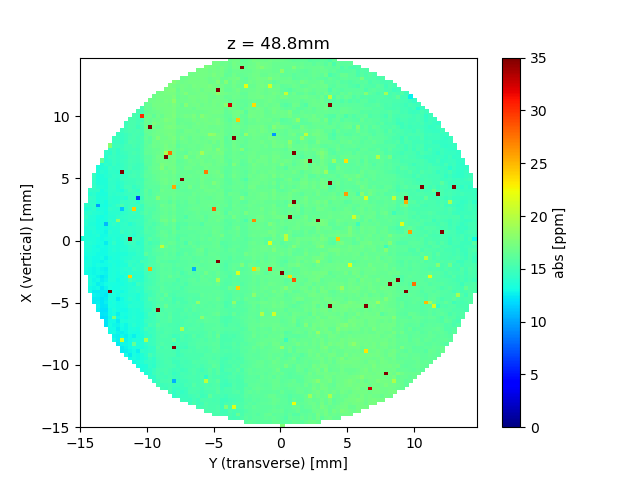
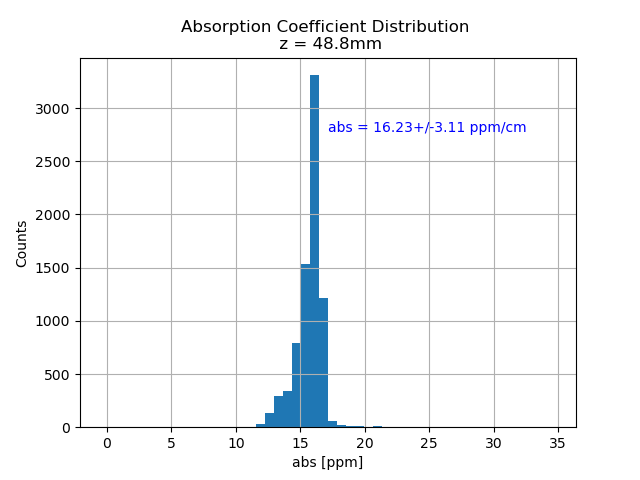
Then, we ran a map-scan in the center with 15mm radius in the position were we identified the coating (Z = 48.8). The results of that scan can be seen also in the pictures attached. Our main result is a quite homogeneous mean absorption of 16 ppm (+/- 3ppm) with some point-like excesses indicating the positions of either dust or defects within the coating, most likely.
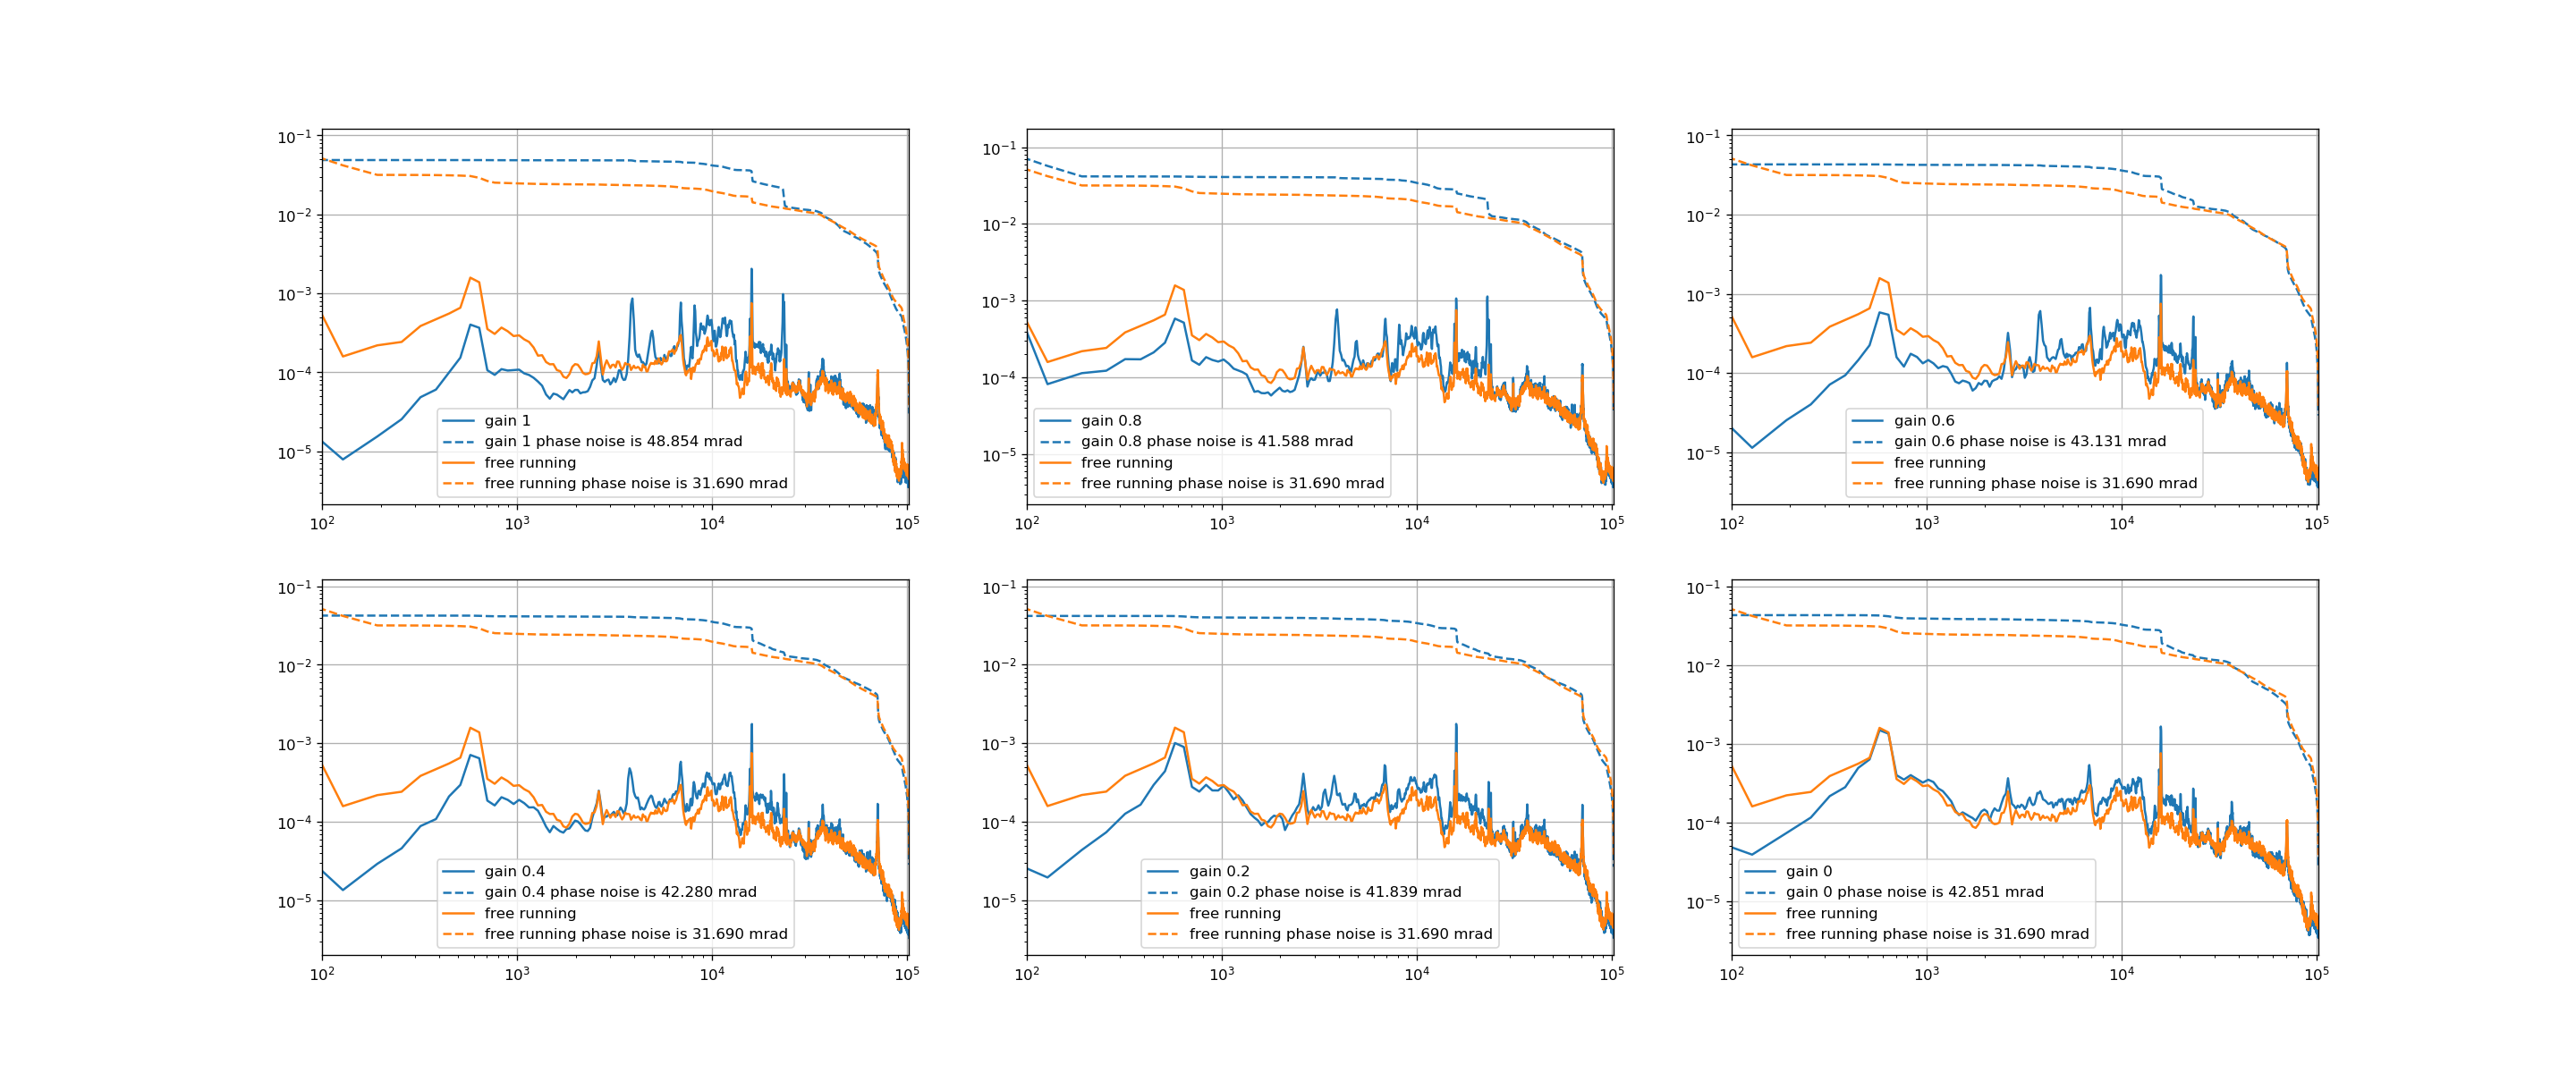
Now we could lock CC2 loop with unity gain frequency of 2kHz. To see the difference of CC2 phase noise with different gain. We measured phase noise with different gain.
As expected, higher gain make noise lower at low frequency. But also the higher gain excites resonance at higher frequency.
From the measurement, it seems the gain of 0.2 is the best case. (Although they are all quite similar)
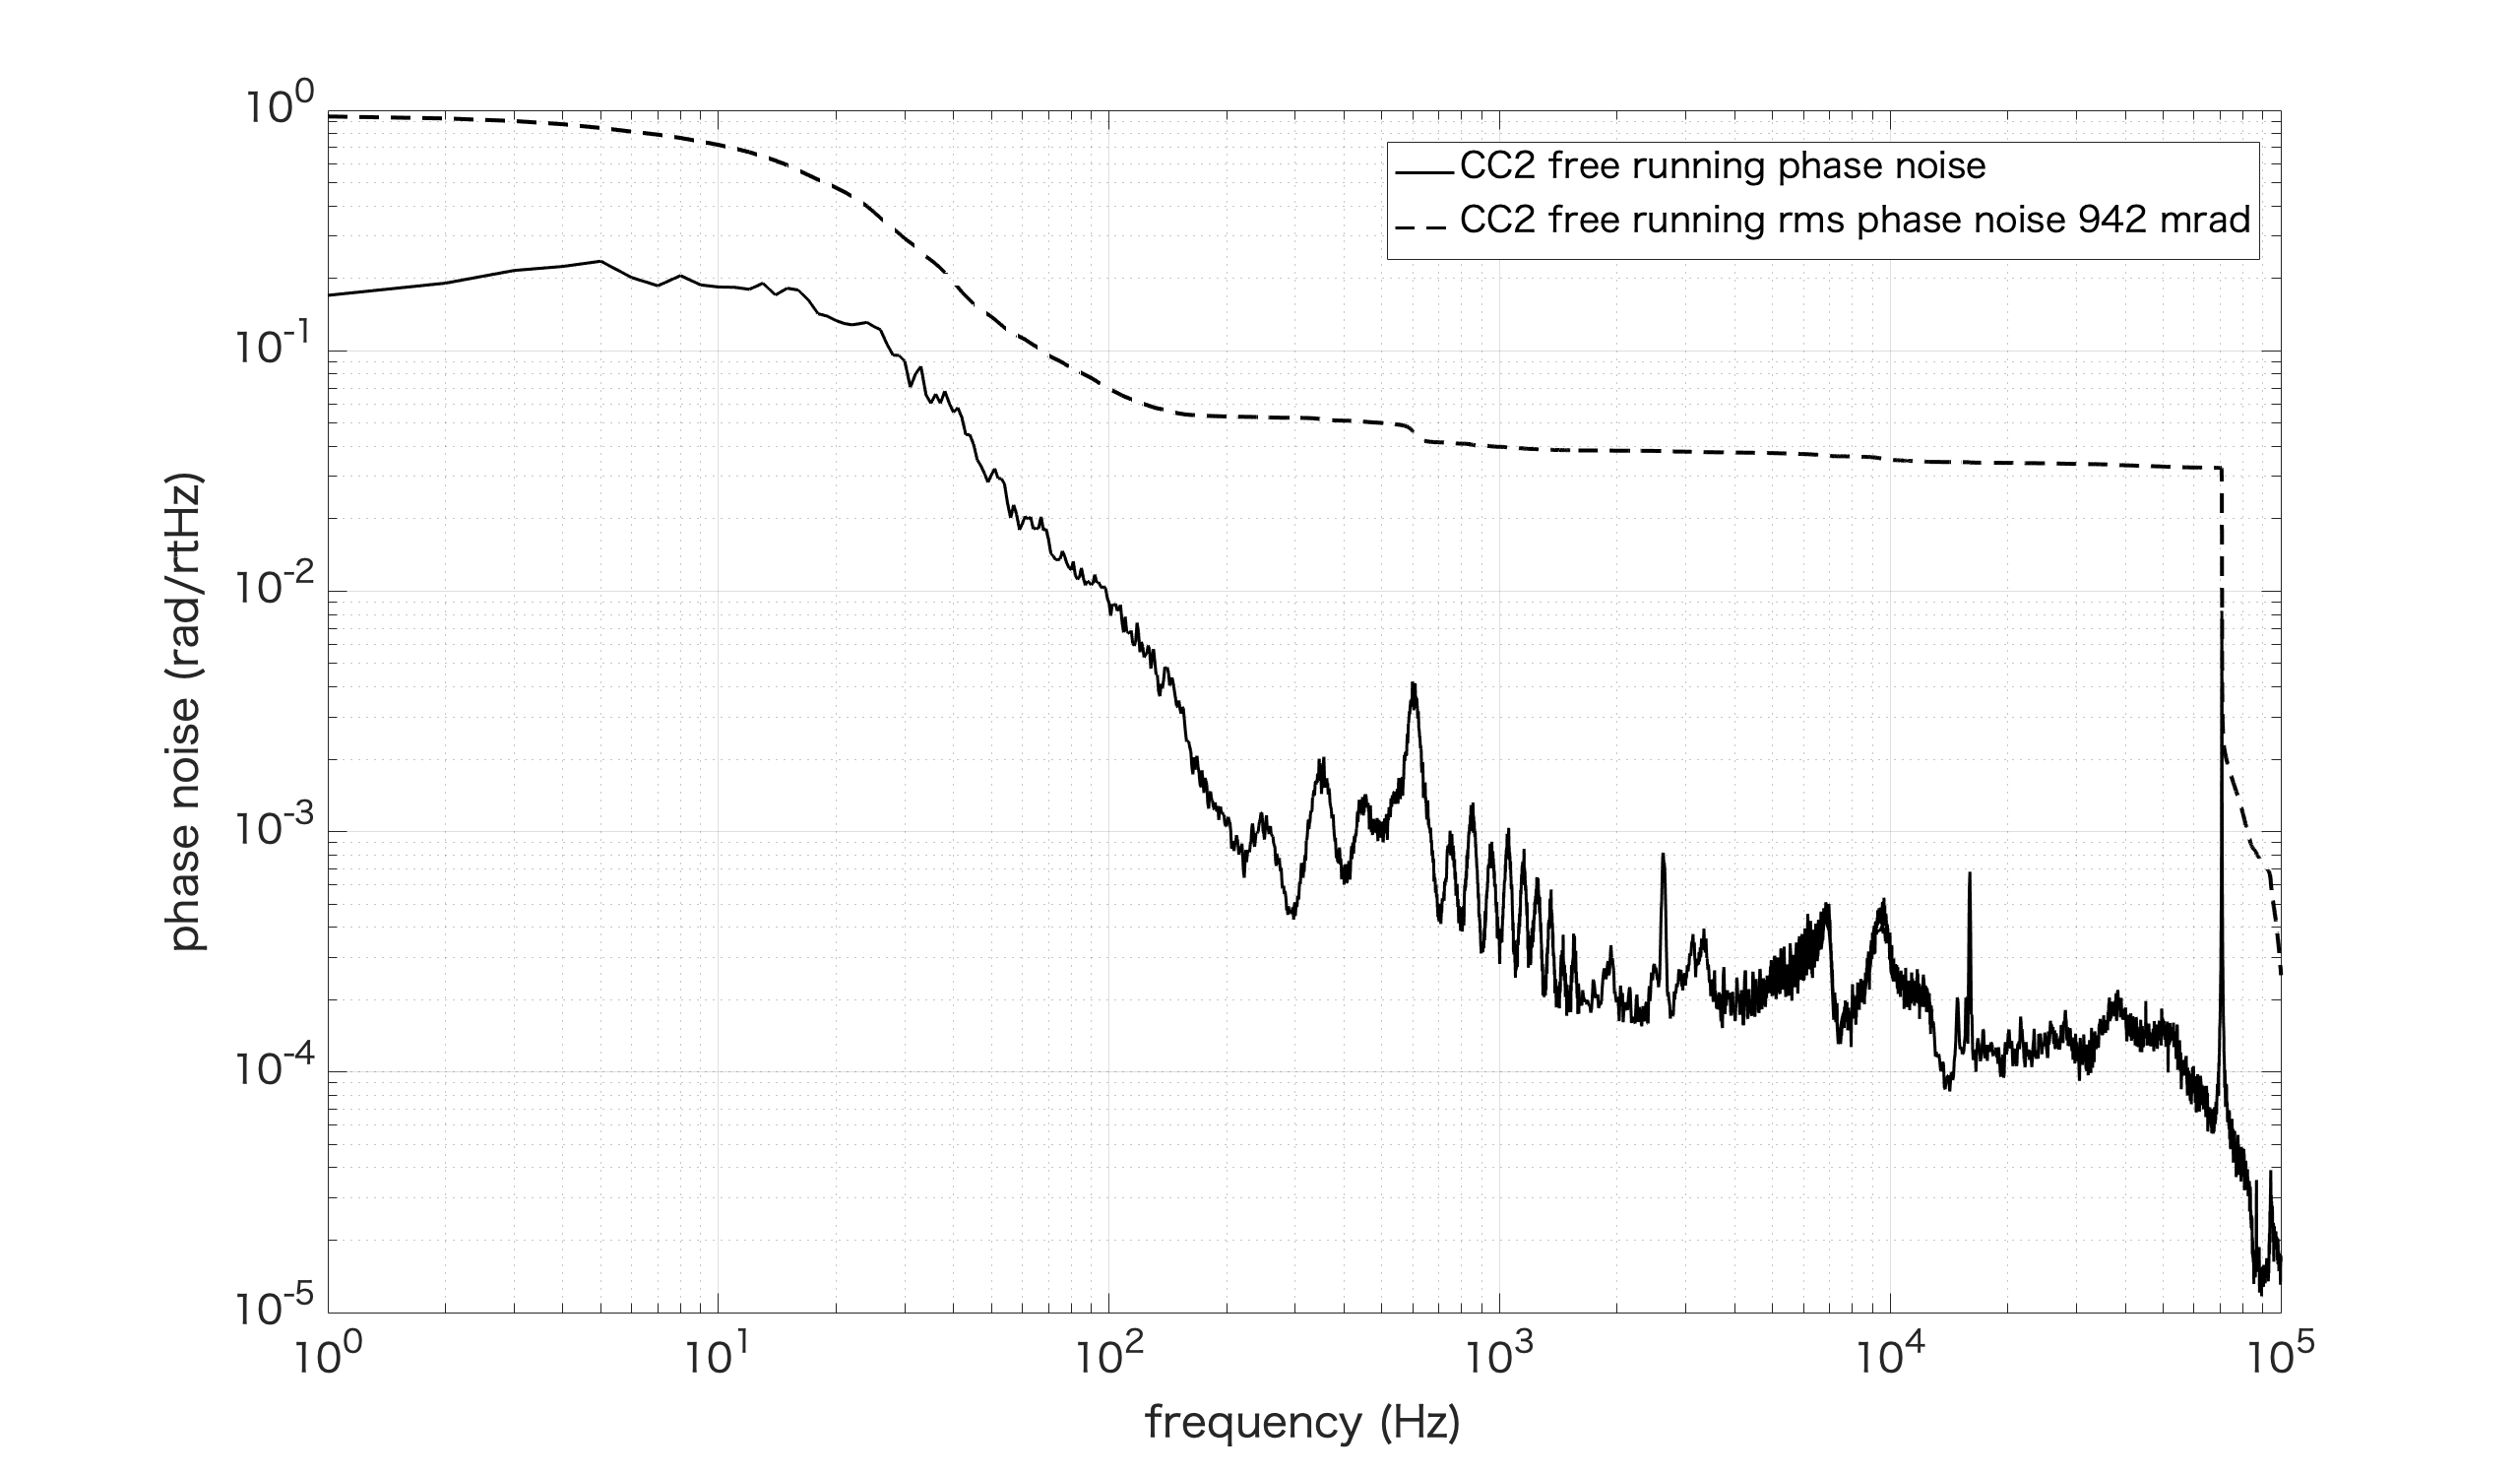
[Aritomi, Yuhang]
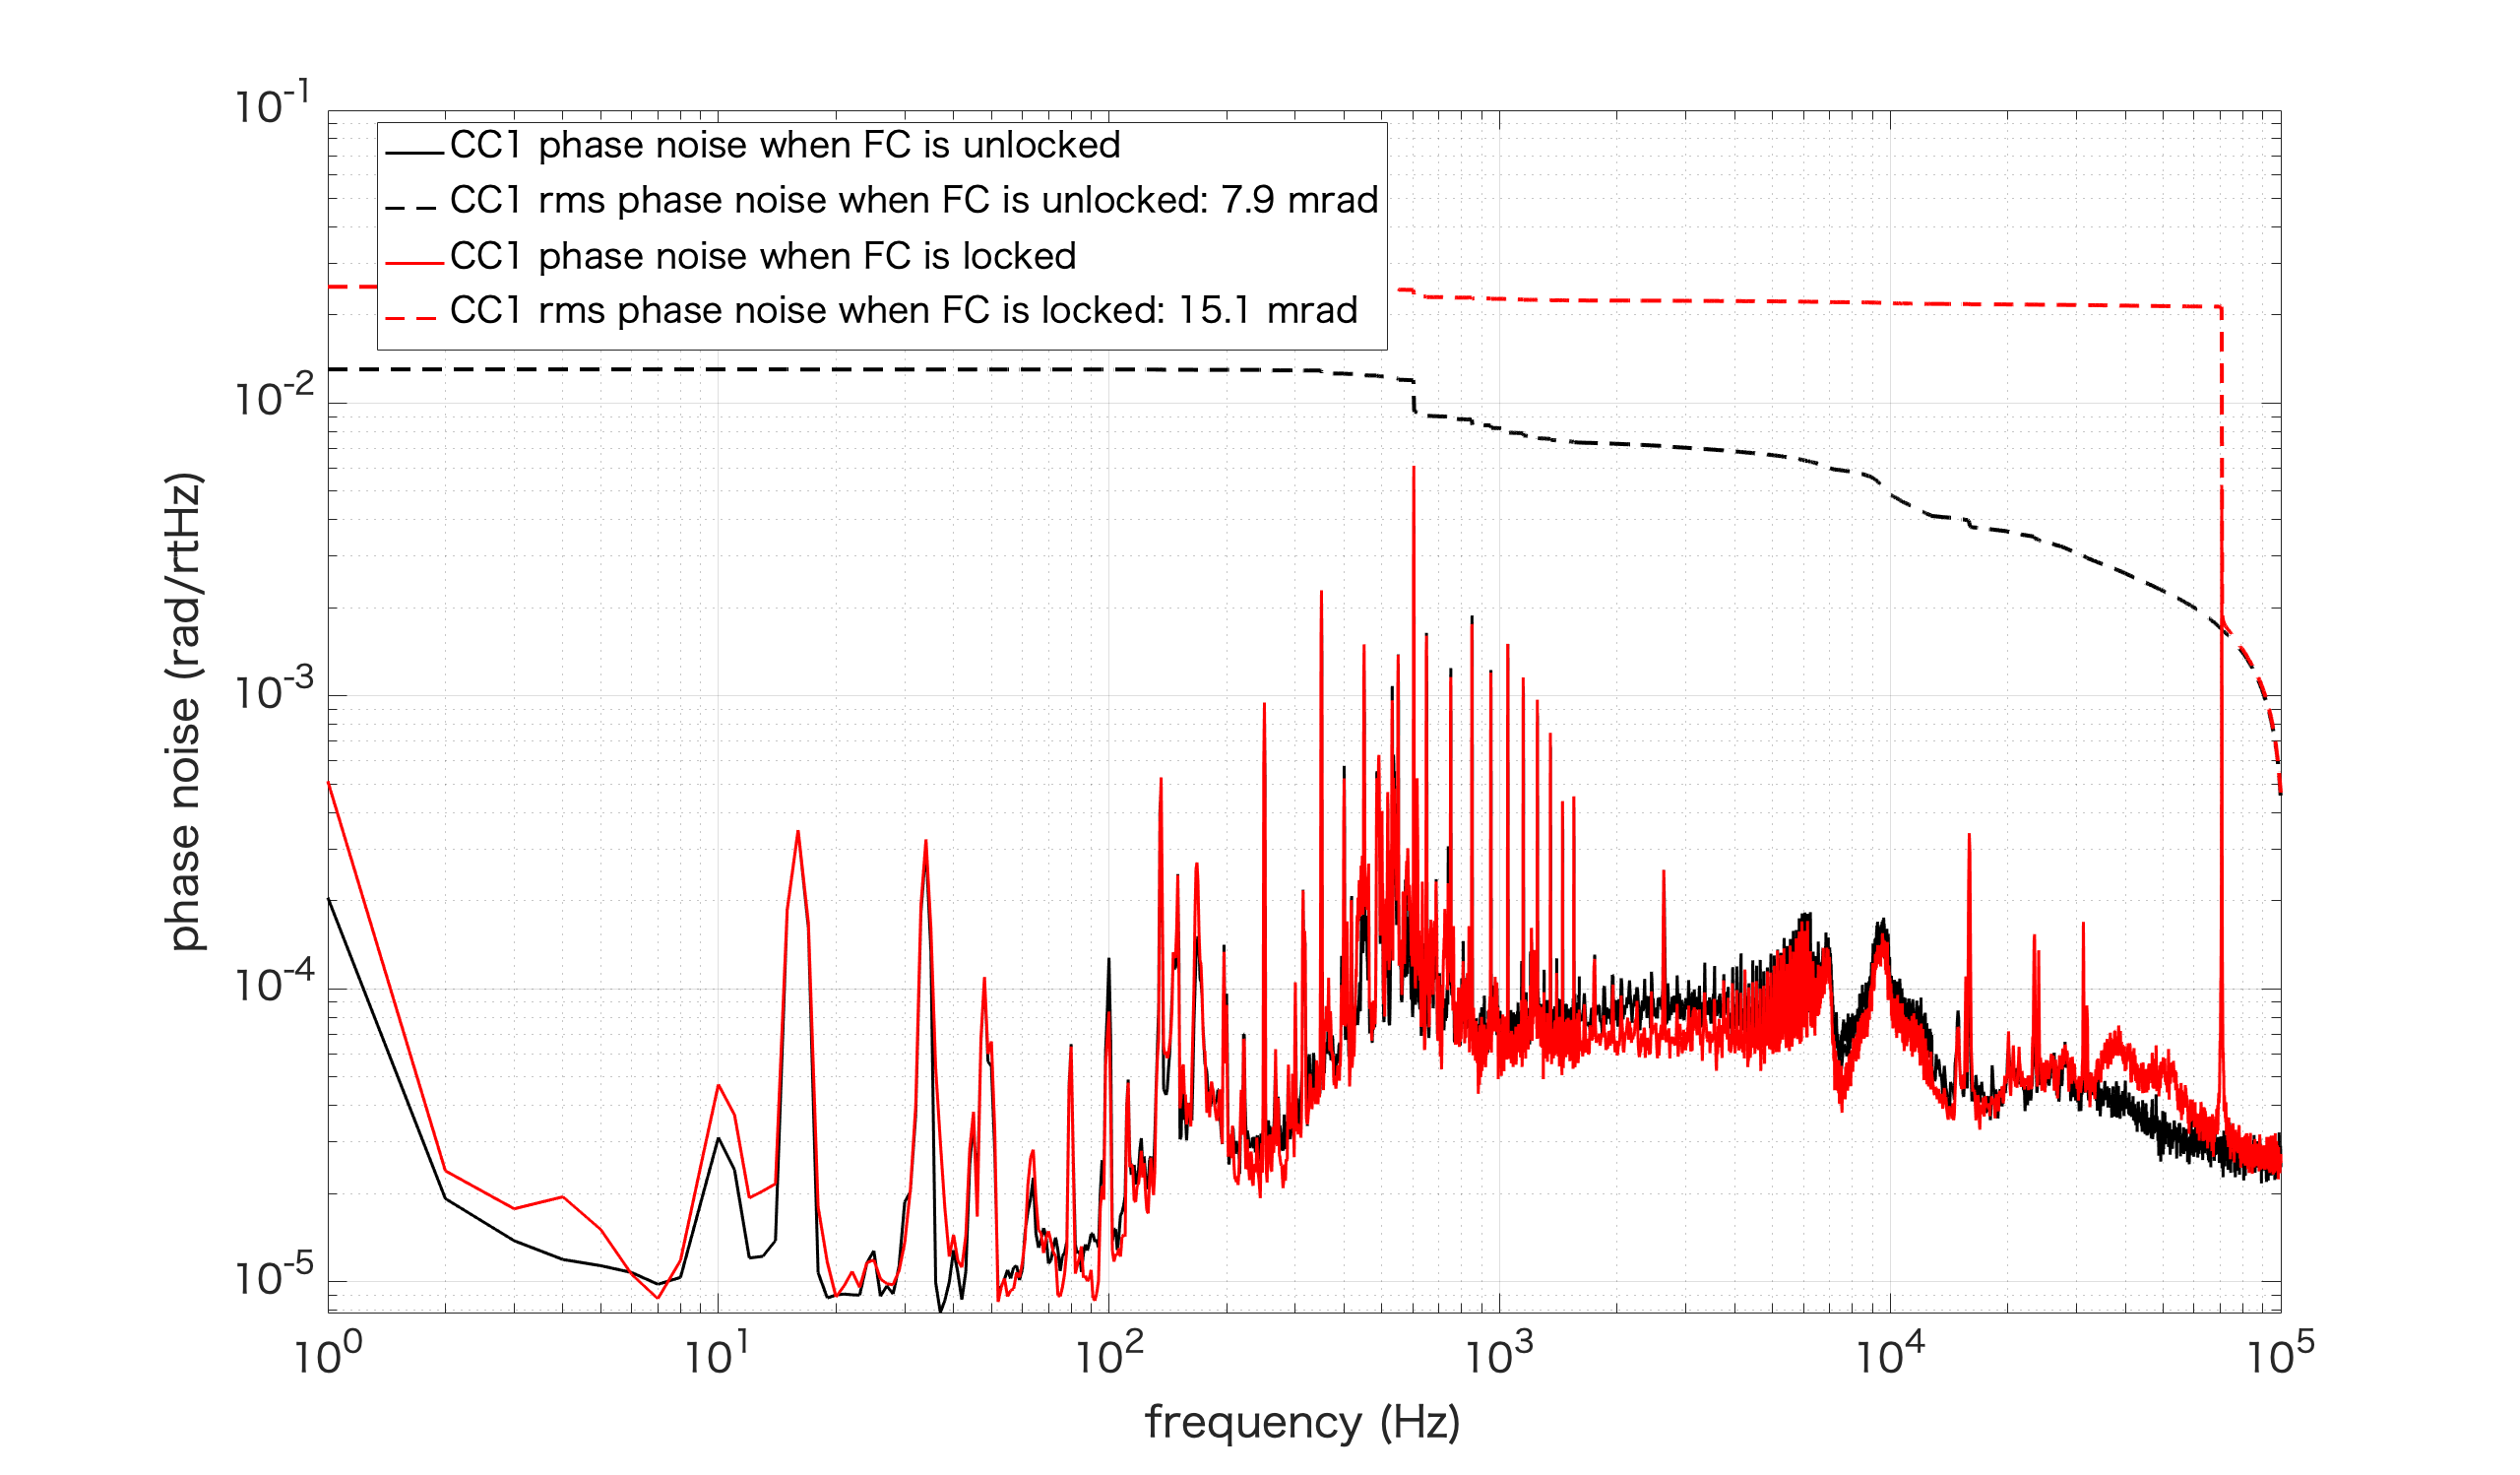
We measured CC2 free running phase noise when filter cavity is locked and aligned with dithering (attached picture). We cannot lock CC2 stably since piezo actuation range is not enough. We'll try to feedback CC2 error signal at low frequency to input mirror of filter cavity.
R_surf = AC_surfref/(DC_surfref*P_in*abs_surfref) = 18.1 [1/W]
where AC_surfref = 0.425V, DC_surfref = 3.55V, P_in = 0.030W and abs_surfref = 0.22
R_bulk = AC_bulkref/(DC_bulkref*sqrt(T_bulkref)*P_in*abs_bulkref) = 0.741 [cm/W]
where AC_bulkref = 0.072V, DC_bulkref = 4.2V, T_bulkref = 0.55, P_in = 0.030W and abs_bulkref = 1.04/cm
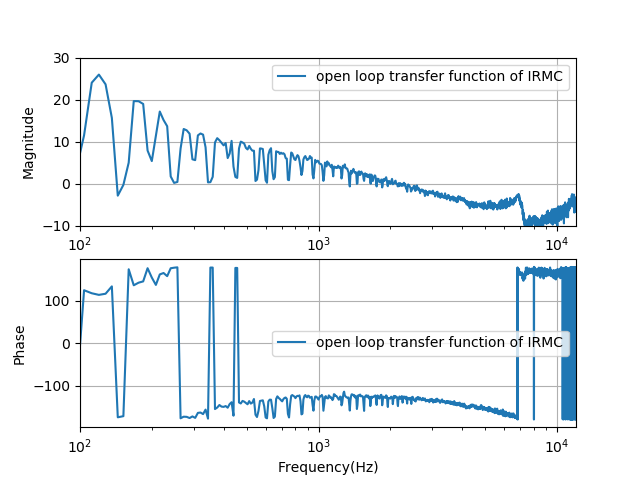
Aritomi and Yuhang
We checked power at several points this Monday and make IRMC transmission set at 1.7mW.
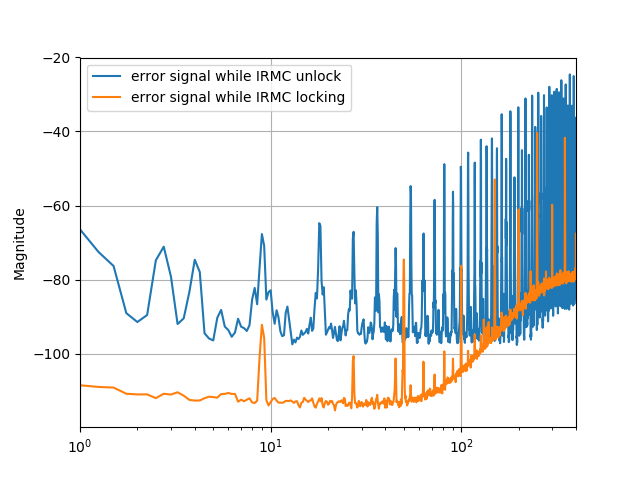
Actually, this means we increased also the error signal(or increase gain). Today we checked the error signal, and actually, it was quite close to oscillation. So we adjusted the gain while looking at the error signal and measured transfer function again. In the end, we put the gain value of the control board from 1.3 to 0.8.
The open-loop transfer function now is as the attached figure 1.
We also measured the IRMC error signal spectrum while IRMC is unlocked and locked. As shown in the attached figure 2. From this locking performance, we could see that the loop suppresses the even harmonics of a fundamental 9Hz oscillation while there are still some odd harmonics left. Also, the 50Hz and its harmonics are introduced after closing the loop. So the PD doesn't introduce any 50Hz noise.
Aritomi and Yuhang
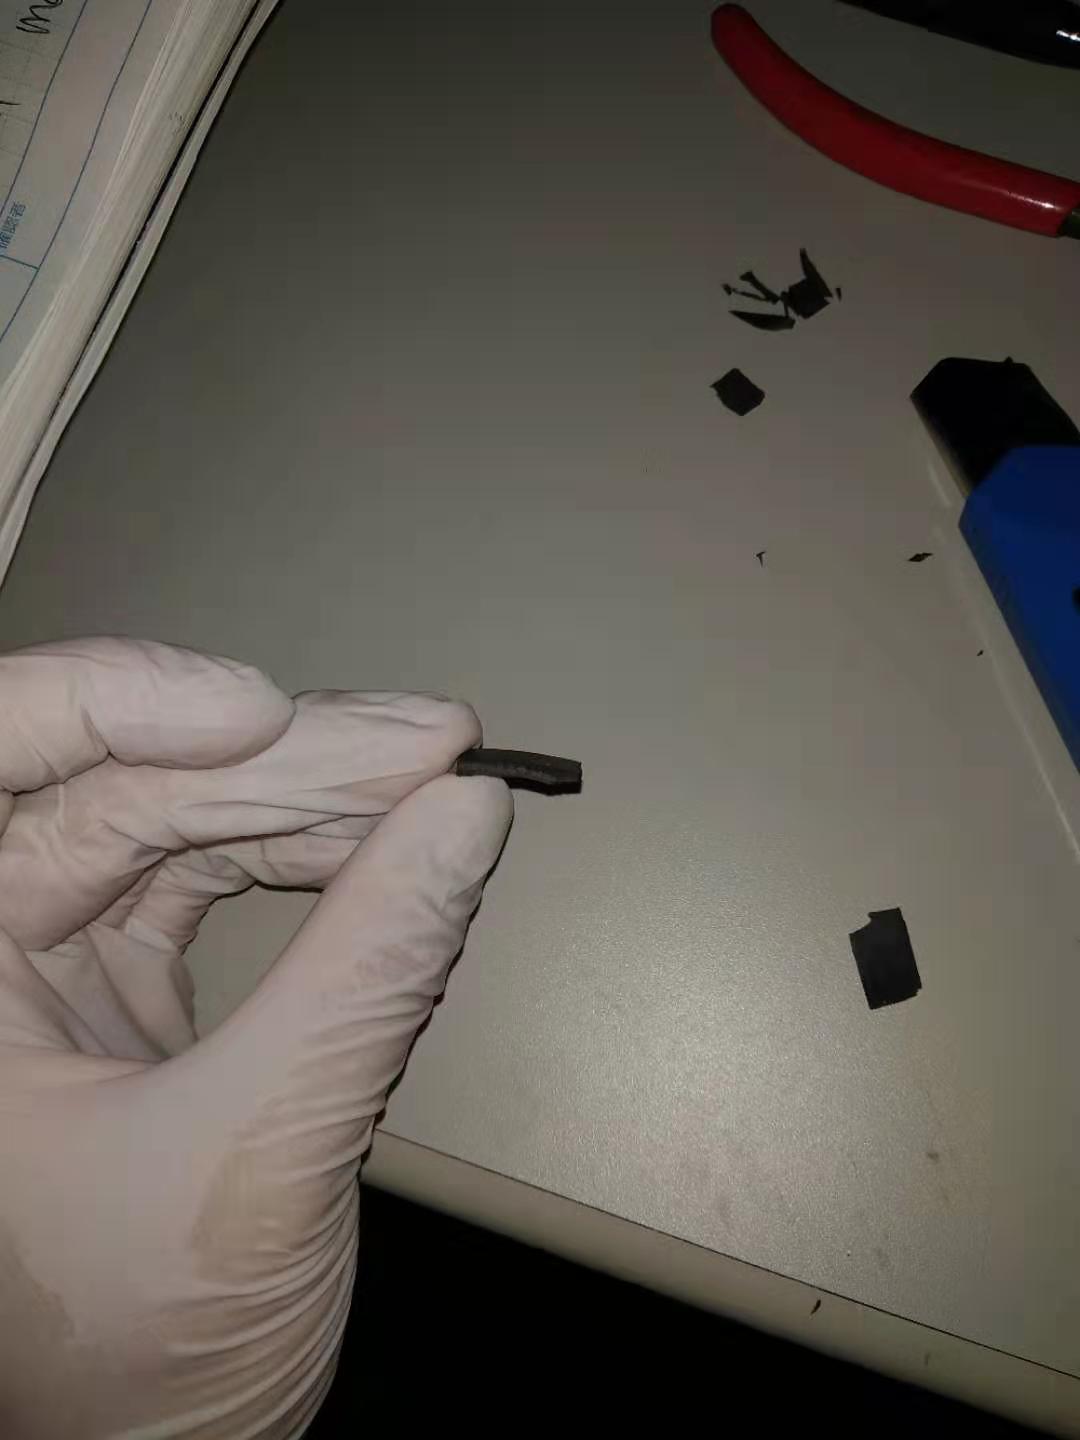
Since the unity gain frequency of CC2 was only ~400Hz because of some resonance. We decide to put some more damping material.
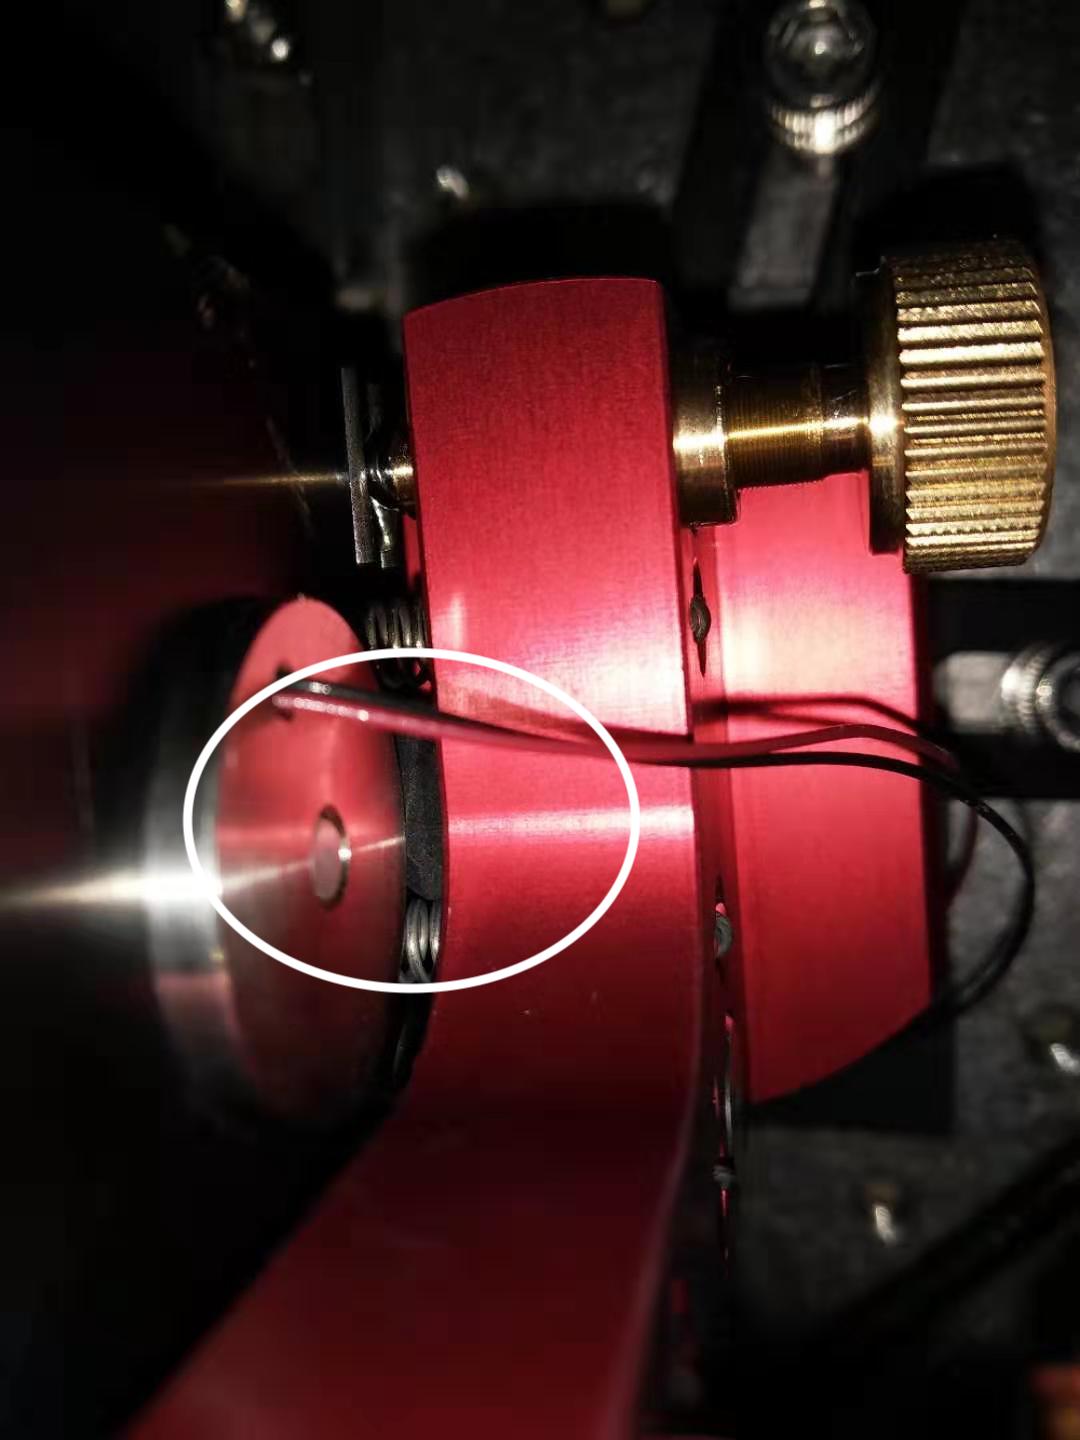
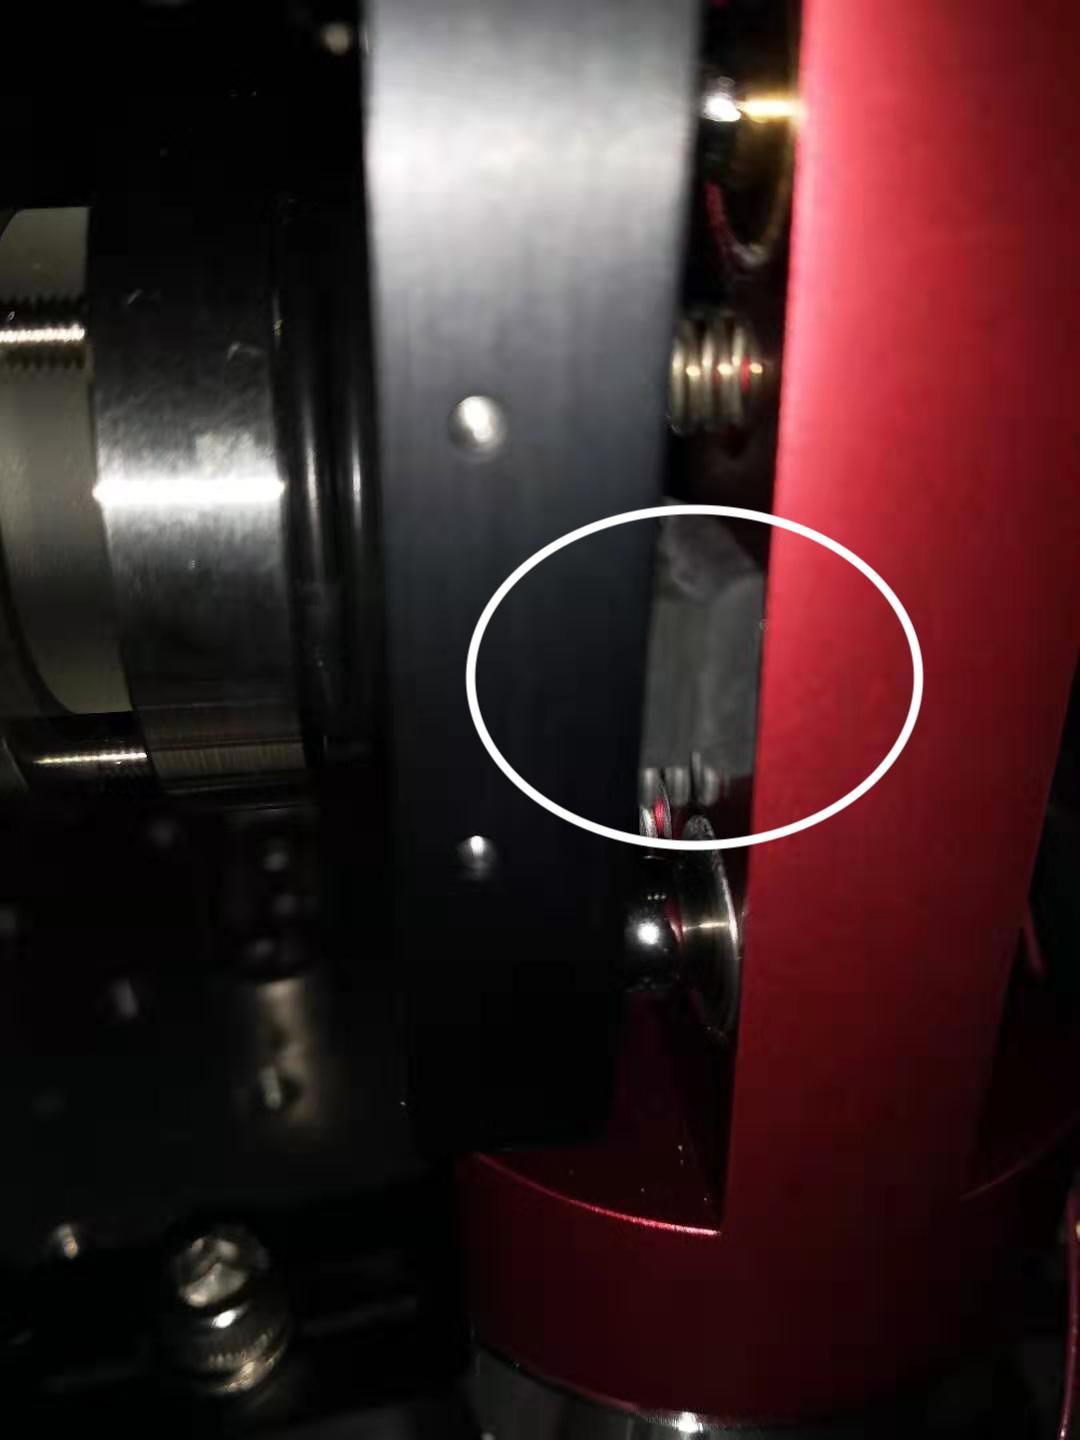
So we put some double layers bent rubber(as shown in the attached photo1) in the position where there may be some spring resonance(as shown in attached photos 2 and 3).
Then we measured OLTF, which is shown in the attached photo 4. And it is shown that the unity gain frequency is around 2kHz now. We also tried to increase the gain, we measured the resonance frequency when there is oscillation. As shown in the attached photo5, the oscillation is at ~23kHz.
We also measured OMTF. By comparing the measurement we did before putting this new damping rubber, we found the peak around 1 and 2kHz disappeared(as shown in the attached figure 6).
[Aritomi, Yuhang]
First we measured squeezing when filter cavity is locked/unlocked (Pic. 1). We expected more squeezing since we improved reflectivity of dichroic mirror by 4%, but squeezing level is still around 6.1dB when filter cavity is unlocked. Squeezing level when filter cavity is locked/unlocked is similar, but phase noise seems suppressed when filter cavity is locked.
Here are some information of this measurement.
| green power (mW) | OPO temperature (kOhm) | p pol PLL (MHz) | Demodulation phase of CC2 (SQZ) (deg) | Demodulation phase of CC2 (ASQZ) (deg) |
| 40 | 7.19 | 165 | 105 | 135 |

[Eleonora, Matteo]
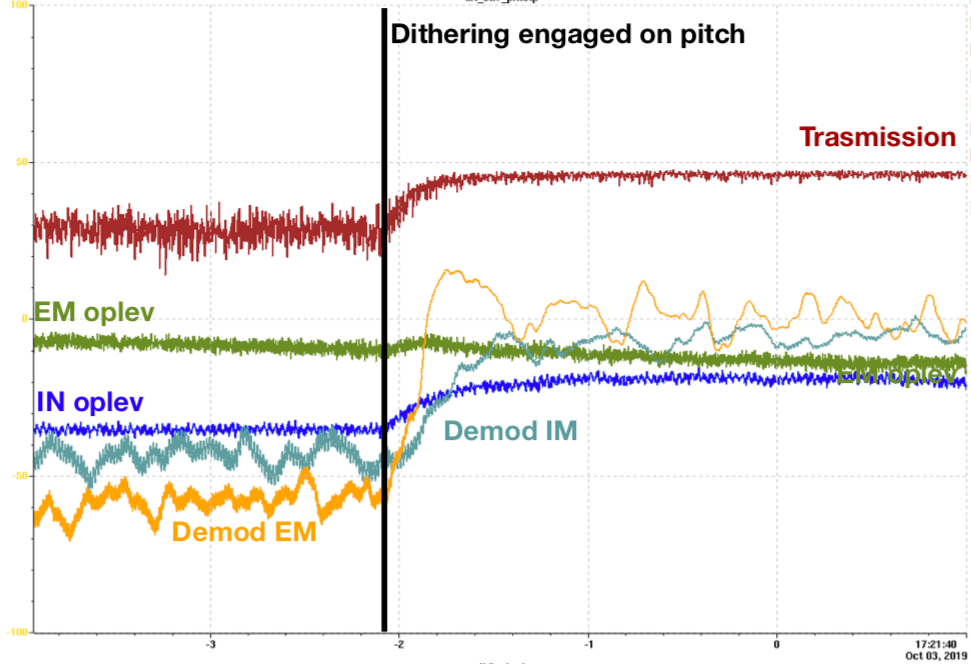
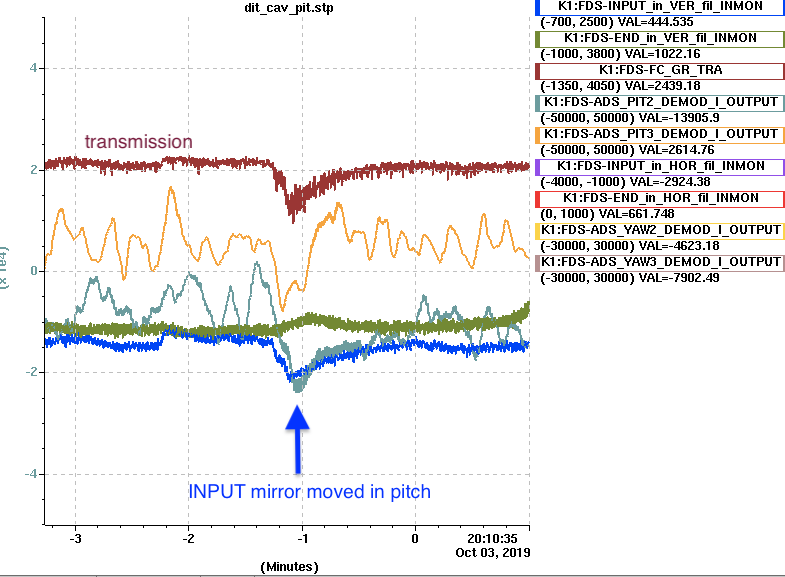
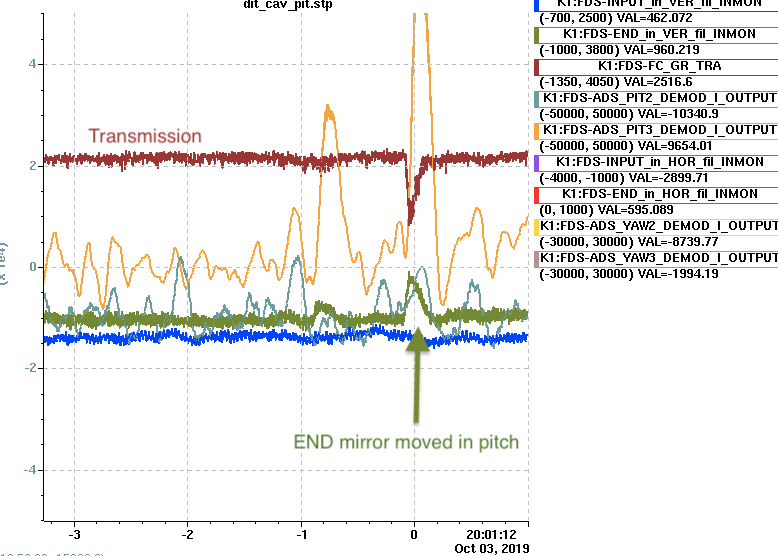
Today we did good progress on the dithering.
We gave up on measuring the sensing matrix and we tried to close the loops by simply feeding back each demodulated signal to "its" mirror.
This seemed to work surprisingly well. (See pic 1-2). The transmitted power increased and became quite stable as well as the lock.
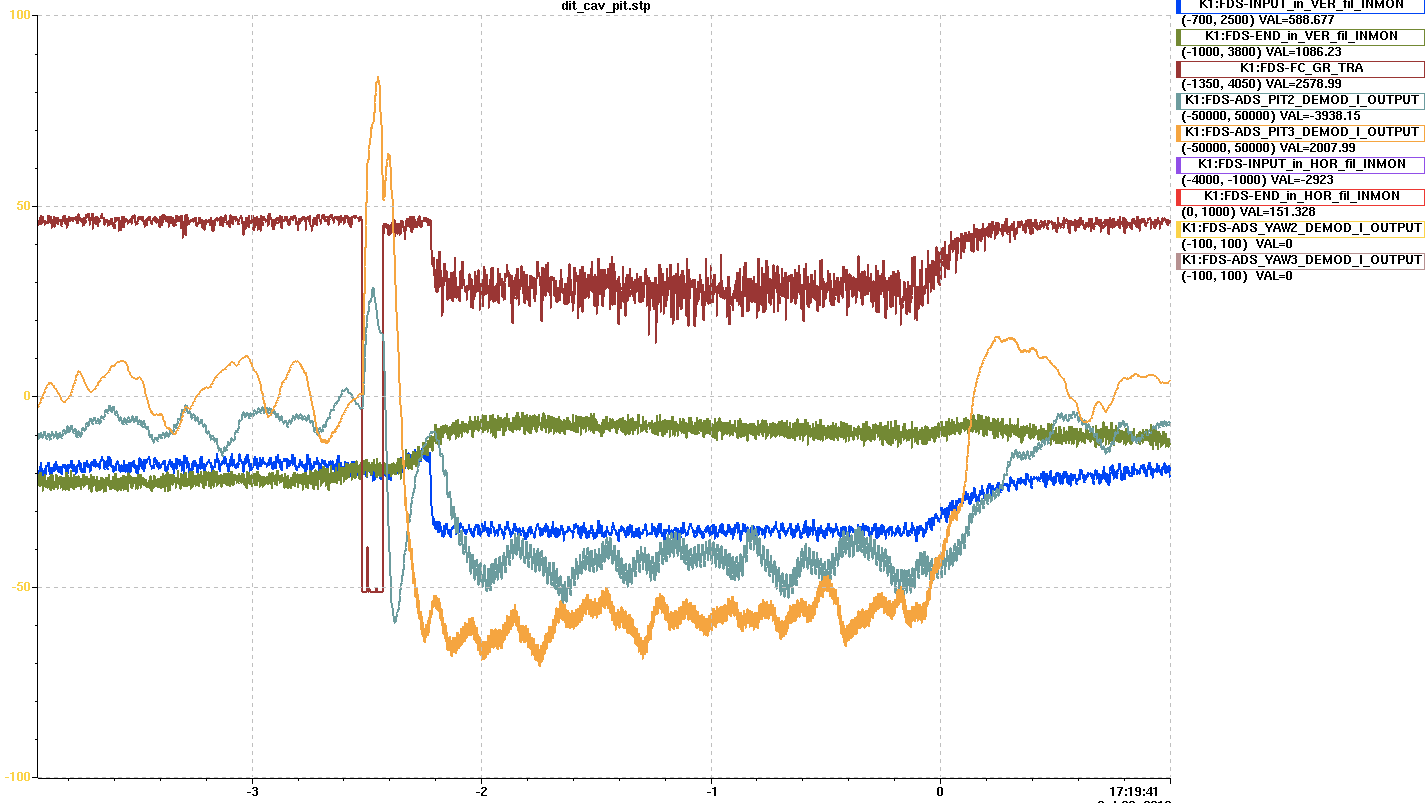
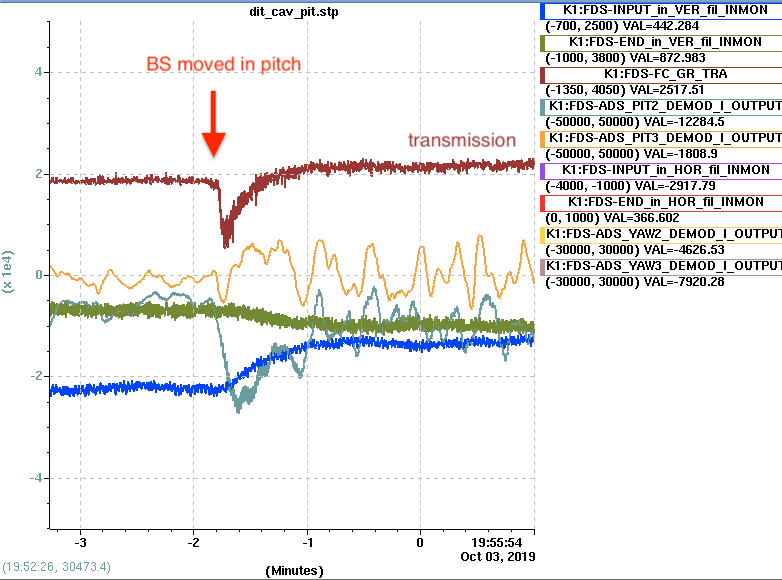
I tried to move one by one the BS, the INPUT mirror and the END mirror when dithering is engaged and the loops seem able to move the cavity mirrors to recover the good alignment. (See pic 3, 4, 5)
From the last two plots we can also check the level of coupling of our error signals, and possibly improve the driving.
The main problem I see is that the error signals are not oscillating around zero but they have an offset and the dithering lines are still well visible in transmission. It shouldn't be like this but I'm not sure about the reason.
Currently the corrector filter is a simple pole at 0.001 Hz. Maybe we should move it to zero. I will also try to put a offset in the loops and see if it can improve the transmission and reduce the dithering line in transmission.
Even if the transmitted power is very stable because we were mostly affected by pitch misalignment, I also tried to close the loops in yaw. They seem not to work well. The error signal is always around zero, so it is not easy to tell the difference when I close the loops, but when tried to misalign the BS in yaw they didn't recover. I didn't spend much time to investigate the problem but I will do it soon.
Since the error signals get crazy if the cavity unlocks I decided it was safer to stop the lock for the night. The cavity kept the lock for more than 5 hours (best record ever) and the lock was stopped on purpose before I go to sleep. It will be good to implement some kind of guardian that will open the dithering loops when the cavity unlocks.
Some details:
- The gain of the input and end loops are respectively -1 and -0.5.
- I reduced the amplitude of both dithering lines from 10000 to 5000 counts.
The wire inside the AOM driver box for supplying DC voltage was disconnected.
I fixed it by soldering, then it was conducting.
Also I soldered the power supply cable with 2 capacitors.
I forgot to take pictures.
I will upload them tomorrow.
We have one flat silicon mirror which will be used for measurement.
It has a wedge, 50arcmin.
On the other hand, fused silica input and output mirrors' wedge are 30min.
We have to take it into account to make a mirror cap.
Aritomi and Yuhang
We measured the green power reflected from the quadrant(used for the AA system). The incident power is measured as 1.2mW while the reflected power is measured as 0.46mW.
Almost 40% of power is reflected from it.
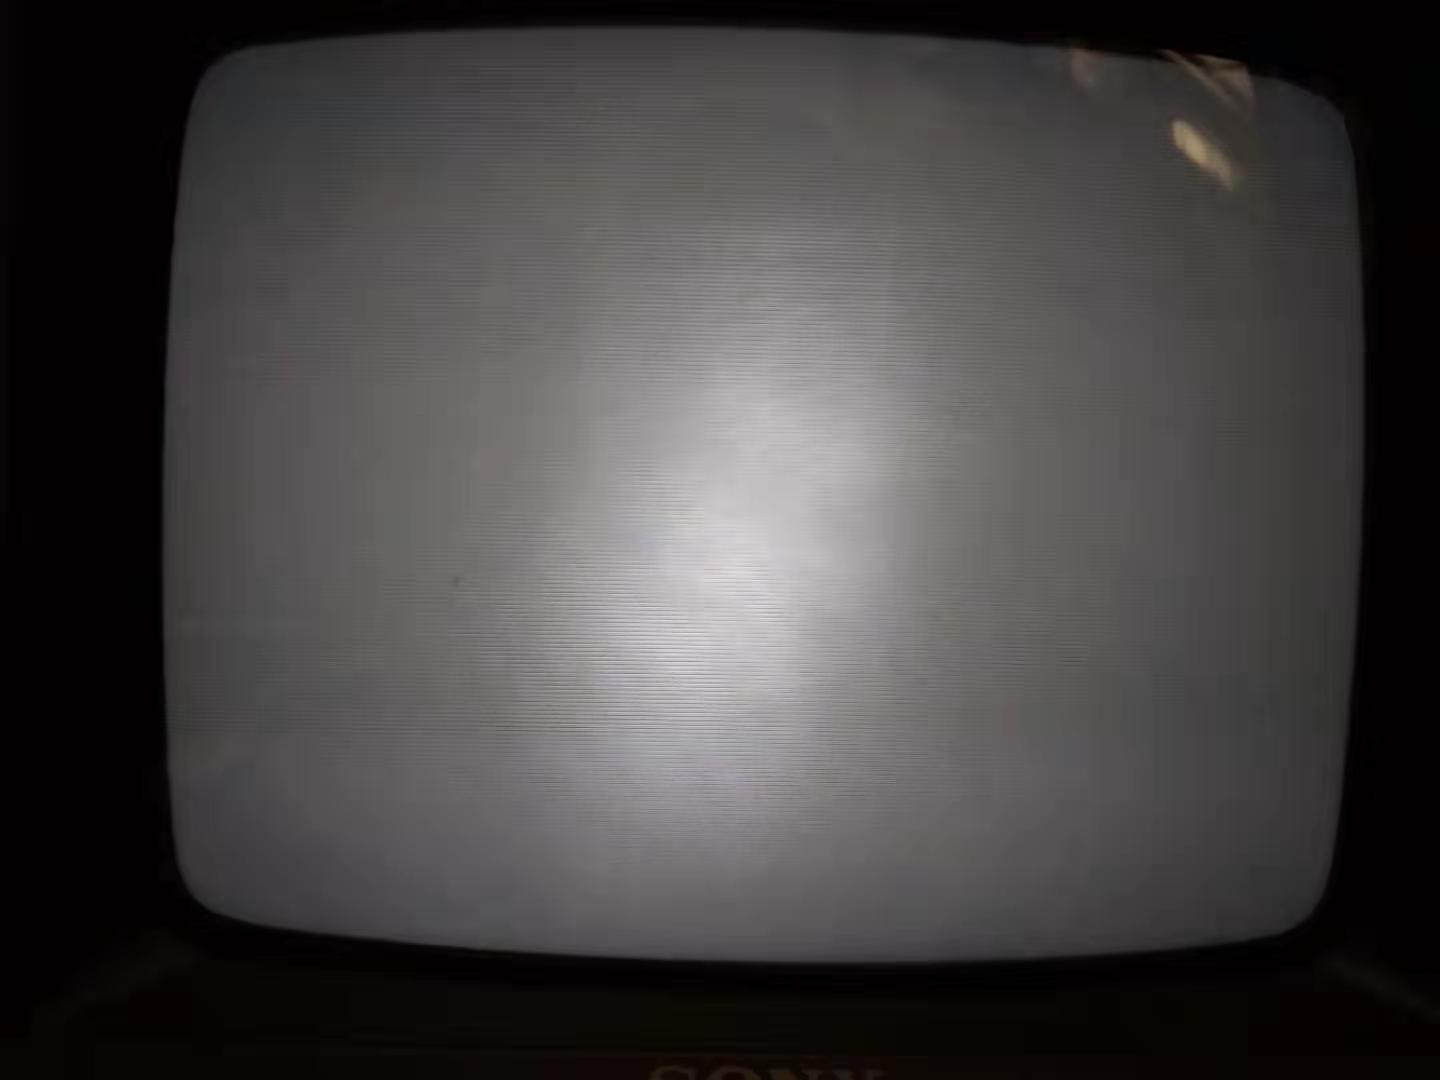
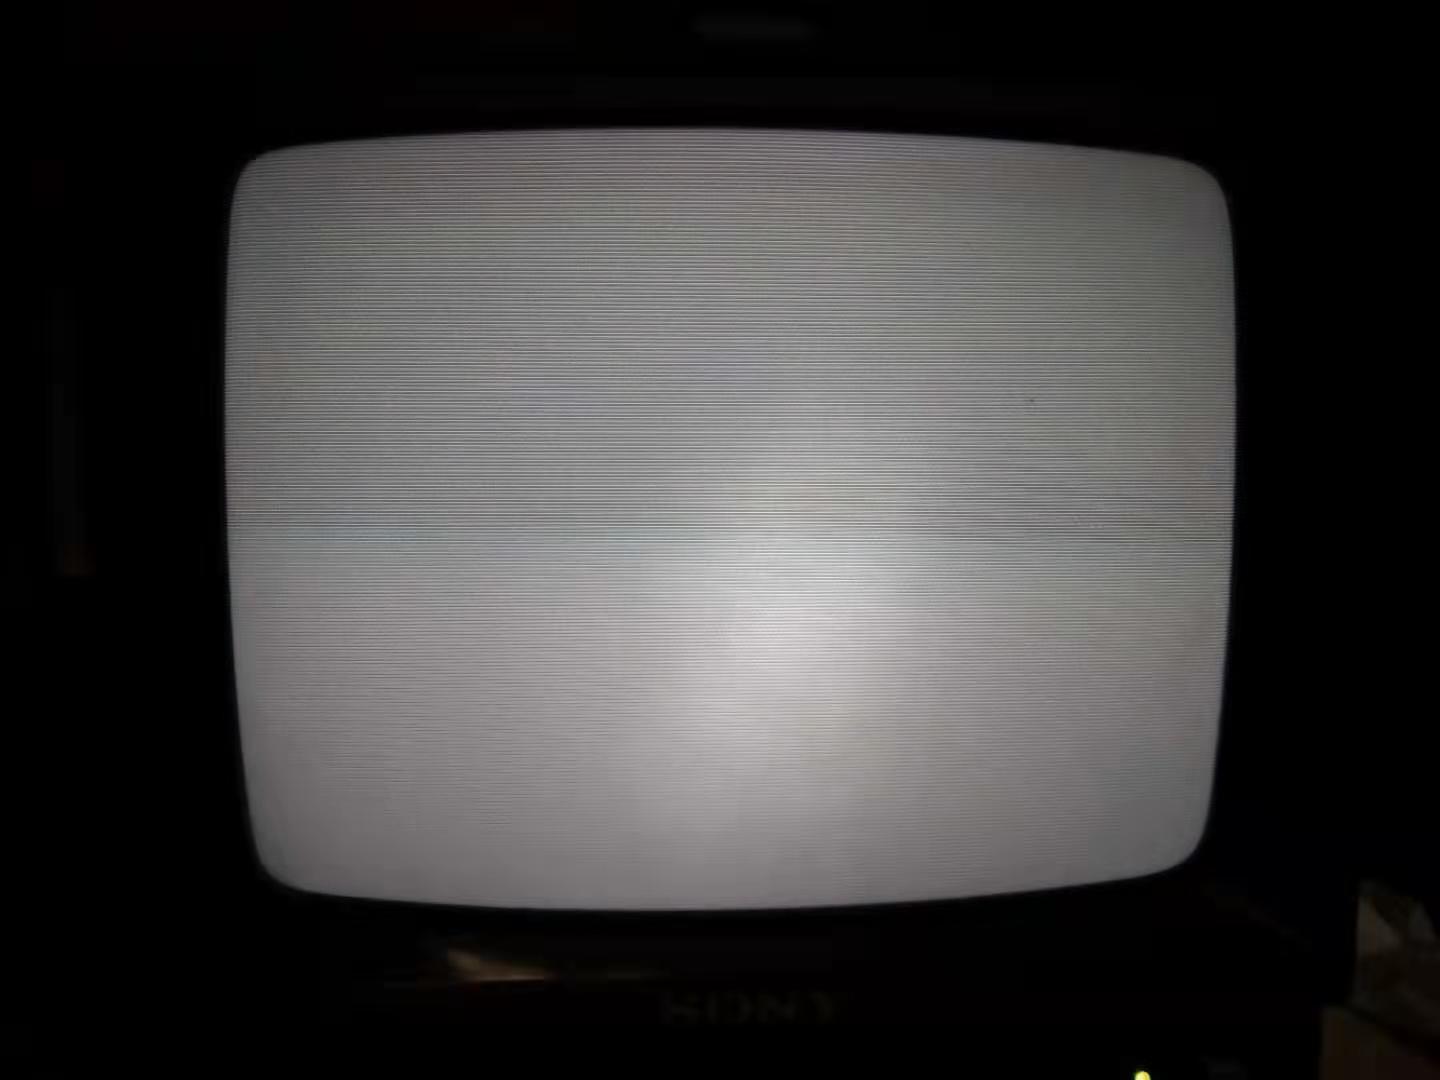
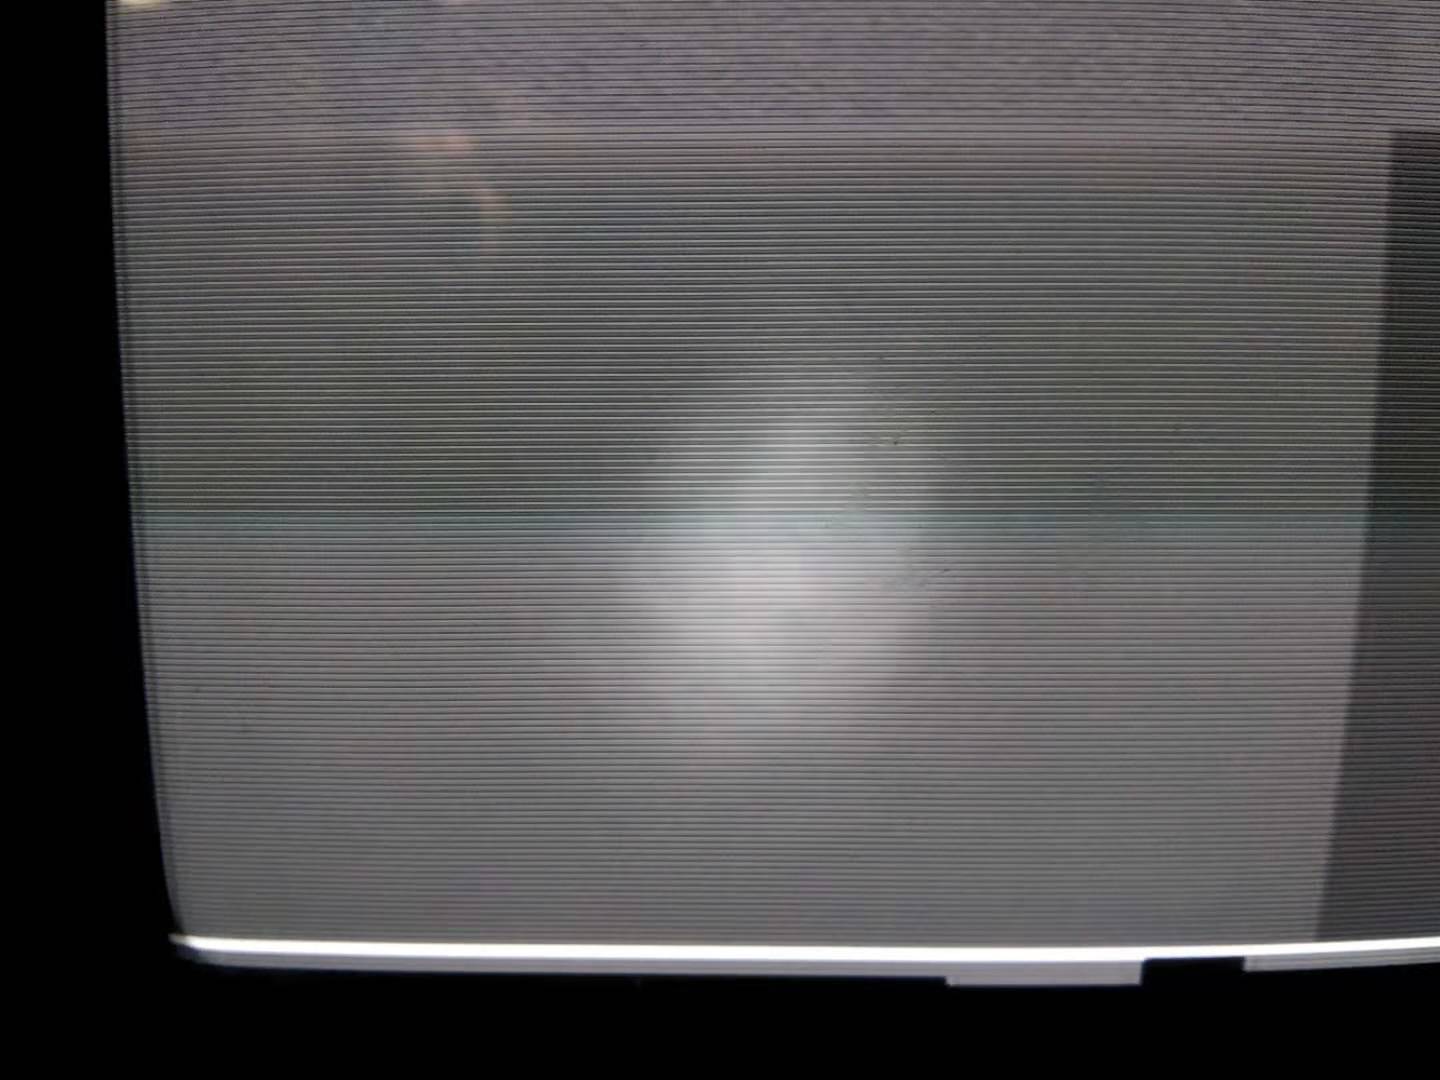
I took a picture of the green beam shape from the filter cavity transmission more than one week ago (11 days ago). Shown in attached figure 1.
I took the same picture last Thursday after the flatting of green beam height. Shown in attached figure 2.
I also took the same picture again today after correcting the beam cut issue on AOM/iris. Shown in attached figure 3.
I think it is clear that the filter cavity transmission has less astigmatism.