NAOJ GW Elog Logbook 3.2

As it was found that AA loop is introducing locking accuracy problem (elog2227), and I also tried to reduce the coupling from y/p to l(the improvement is mainly the coupling from y to l) (elog2229).
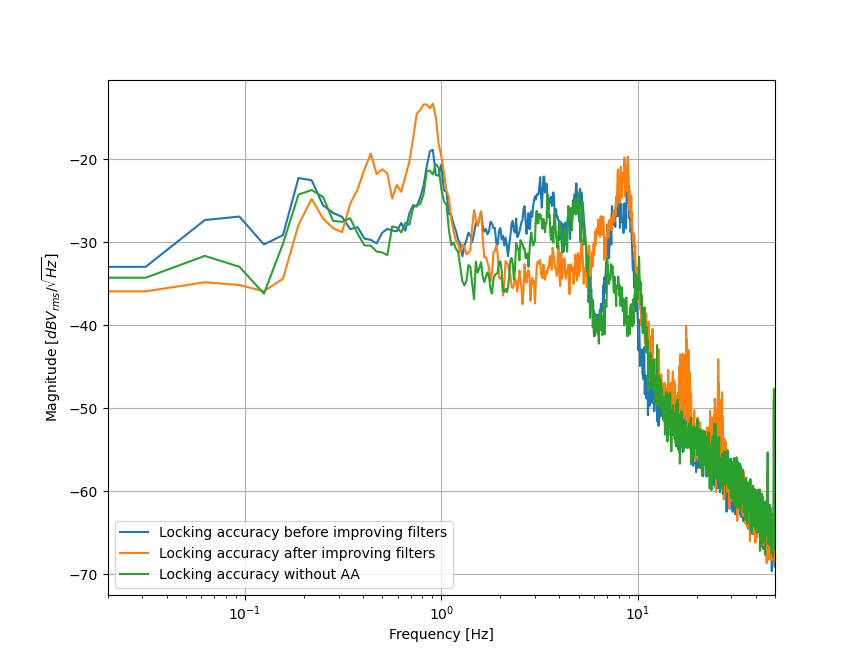
After that I did the comparison in the following three different situations:
1. No AA loop but local control engaged for input/end mirrors.
2. With the same AA loop (compared with elog2227)
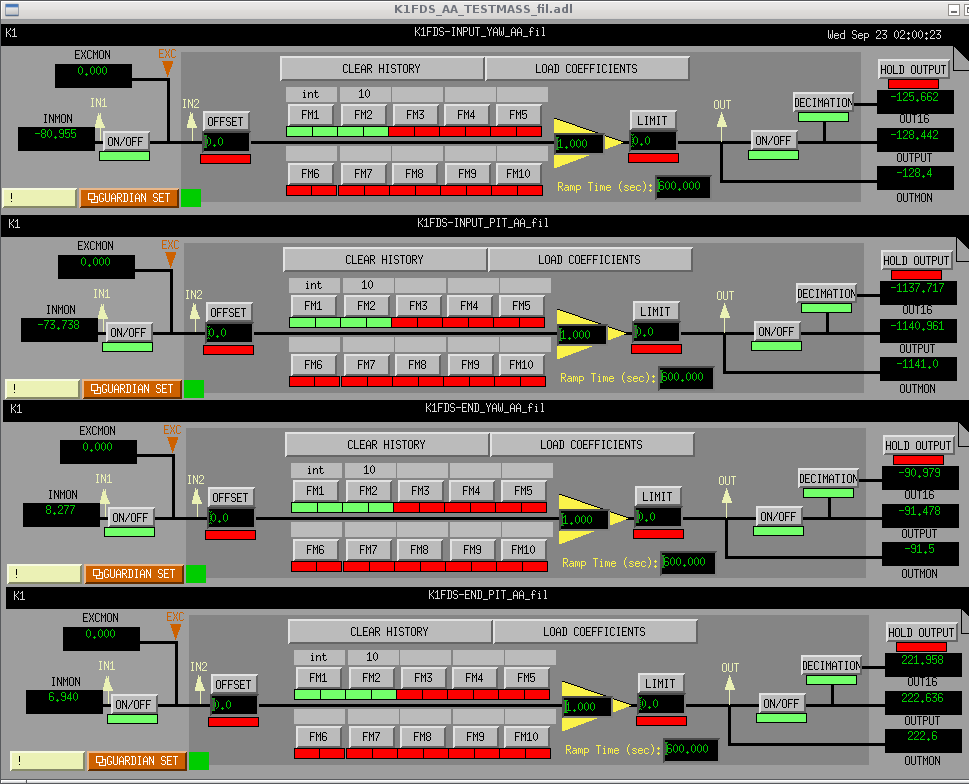
3. With AA loop but the gain of yaw control was increased by a factor of 10 for end mirror, the gain of end/input mirror pitch were increased by a factor of 2.
The comparison is shown in the attached figure 1.
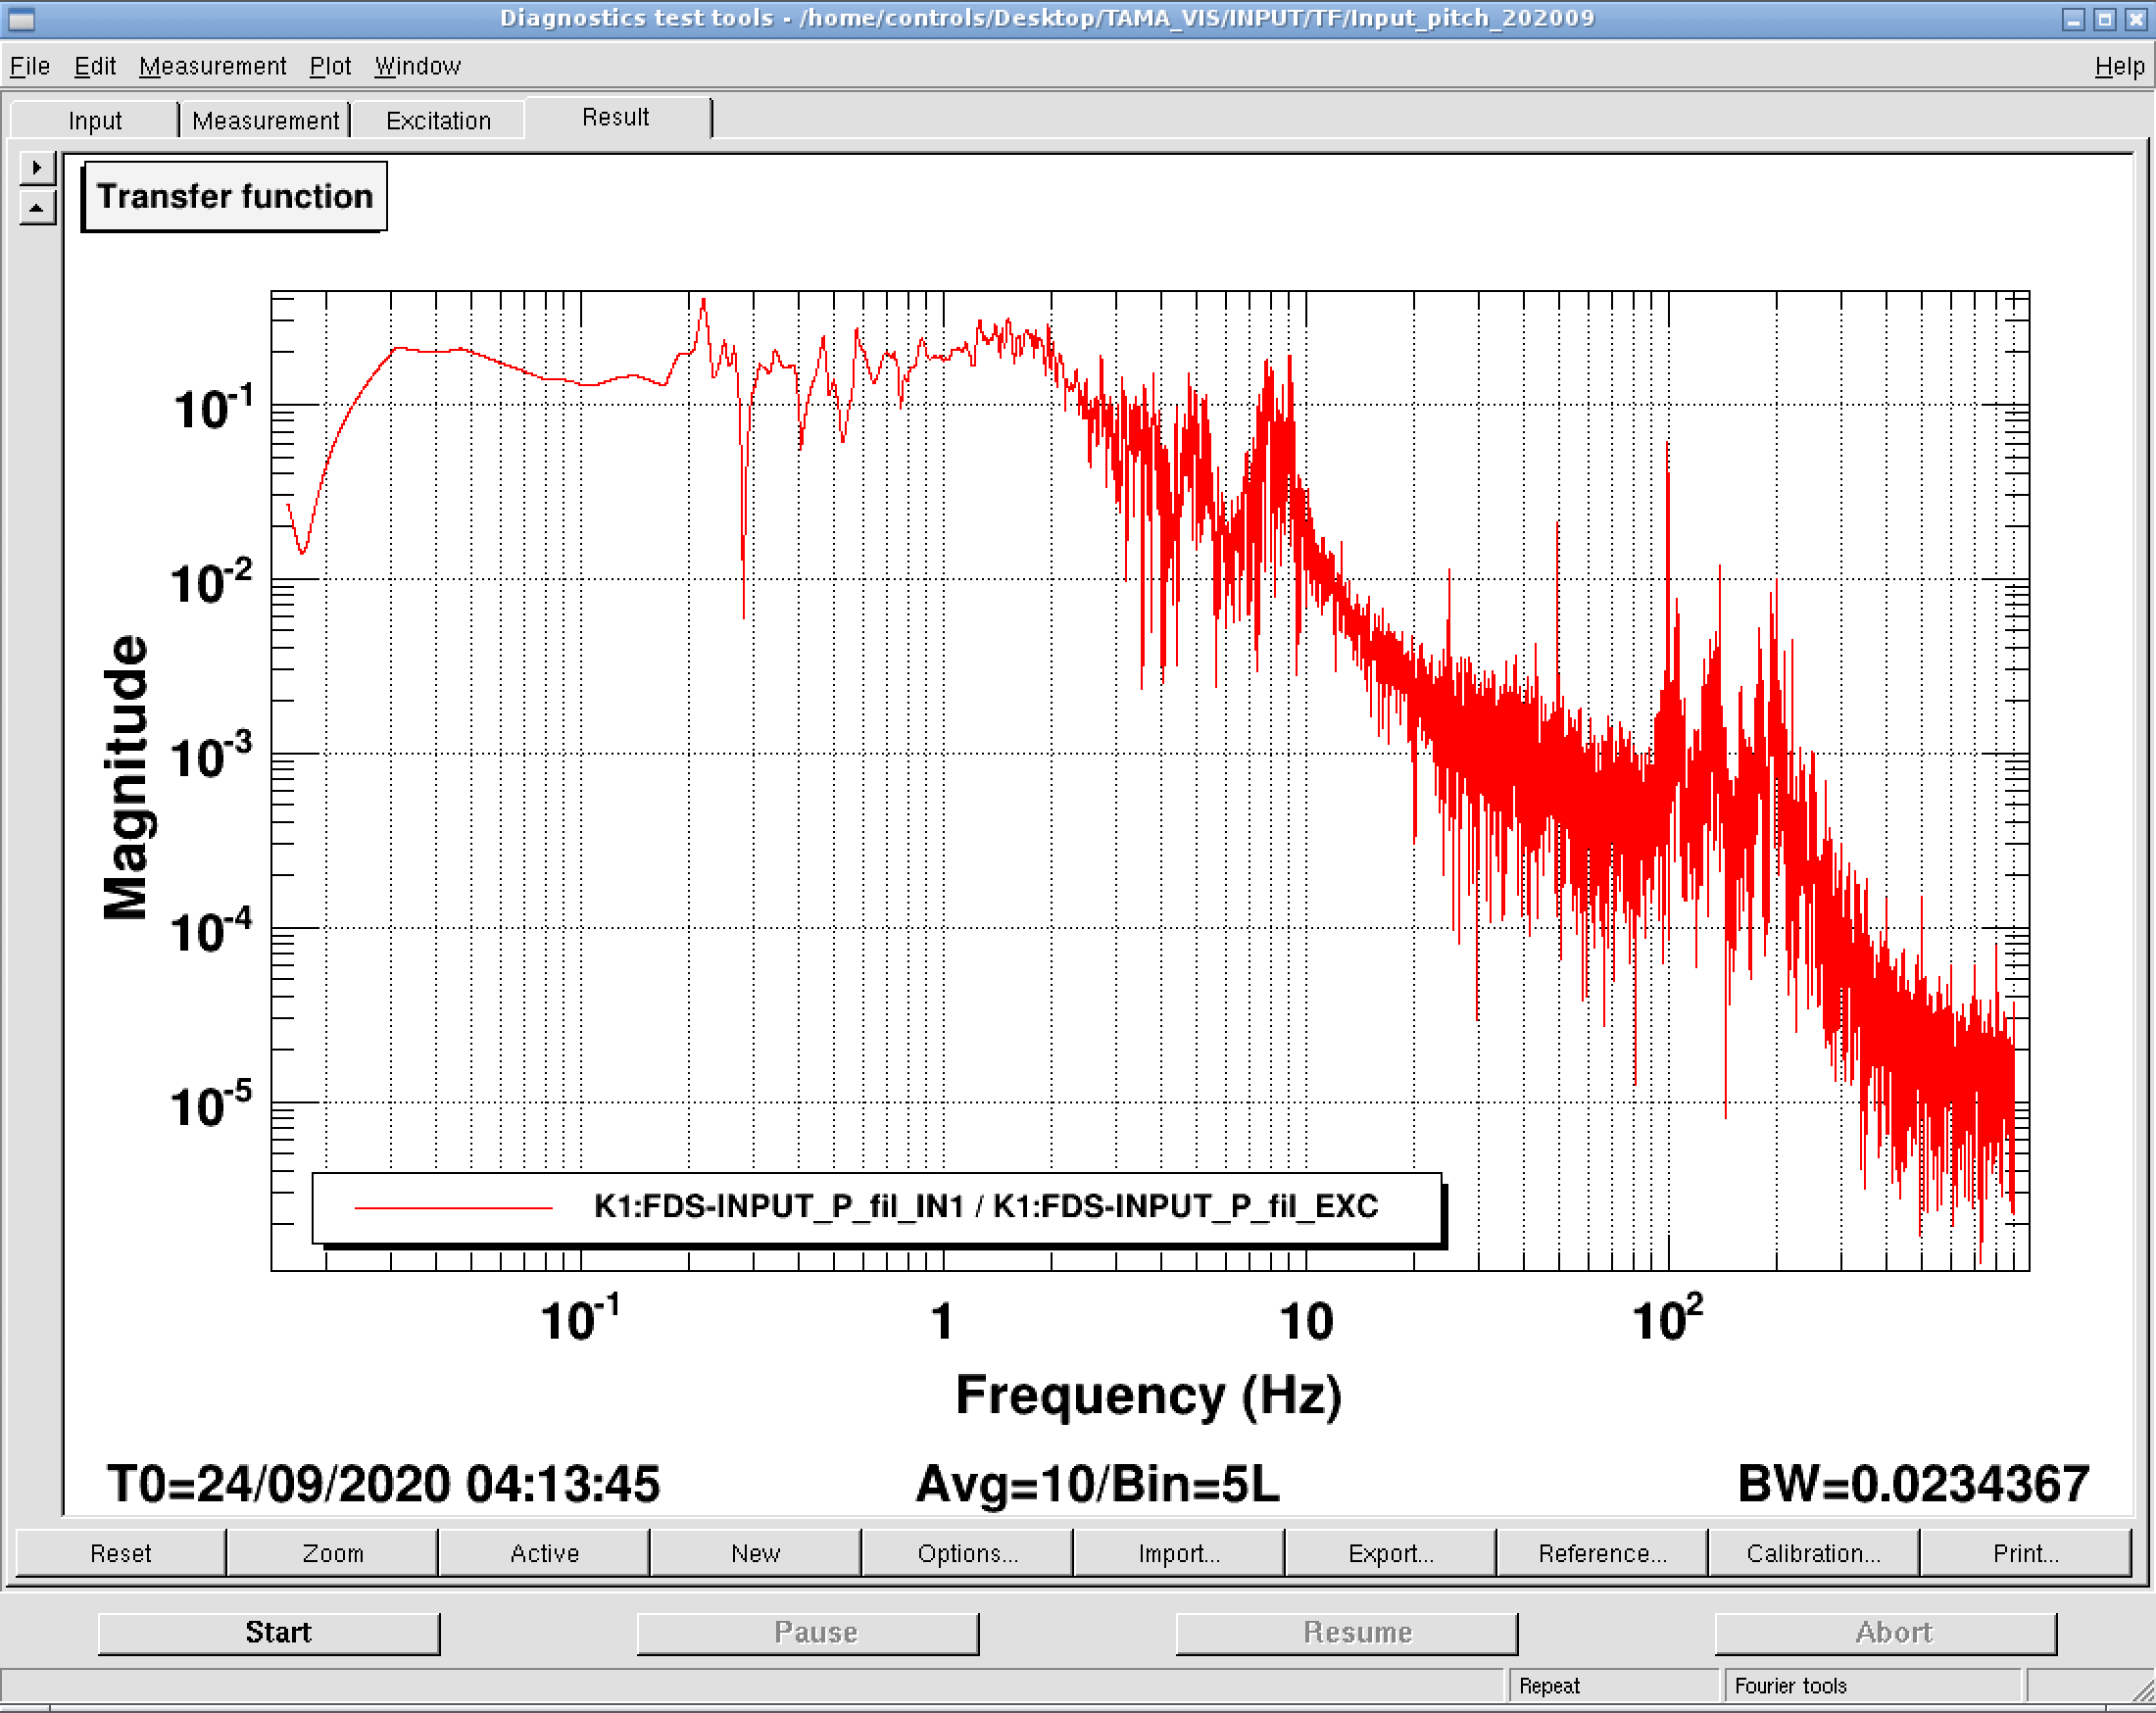
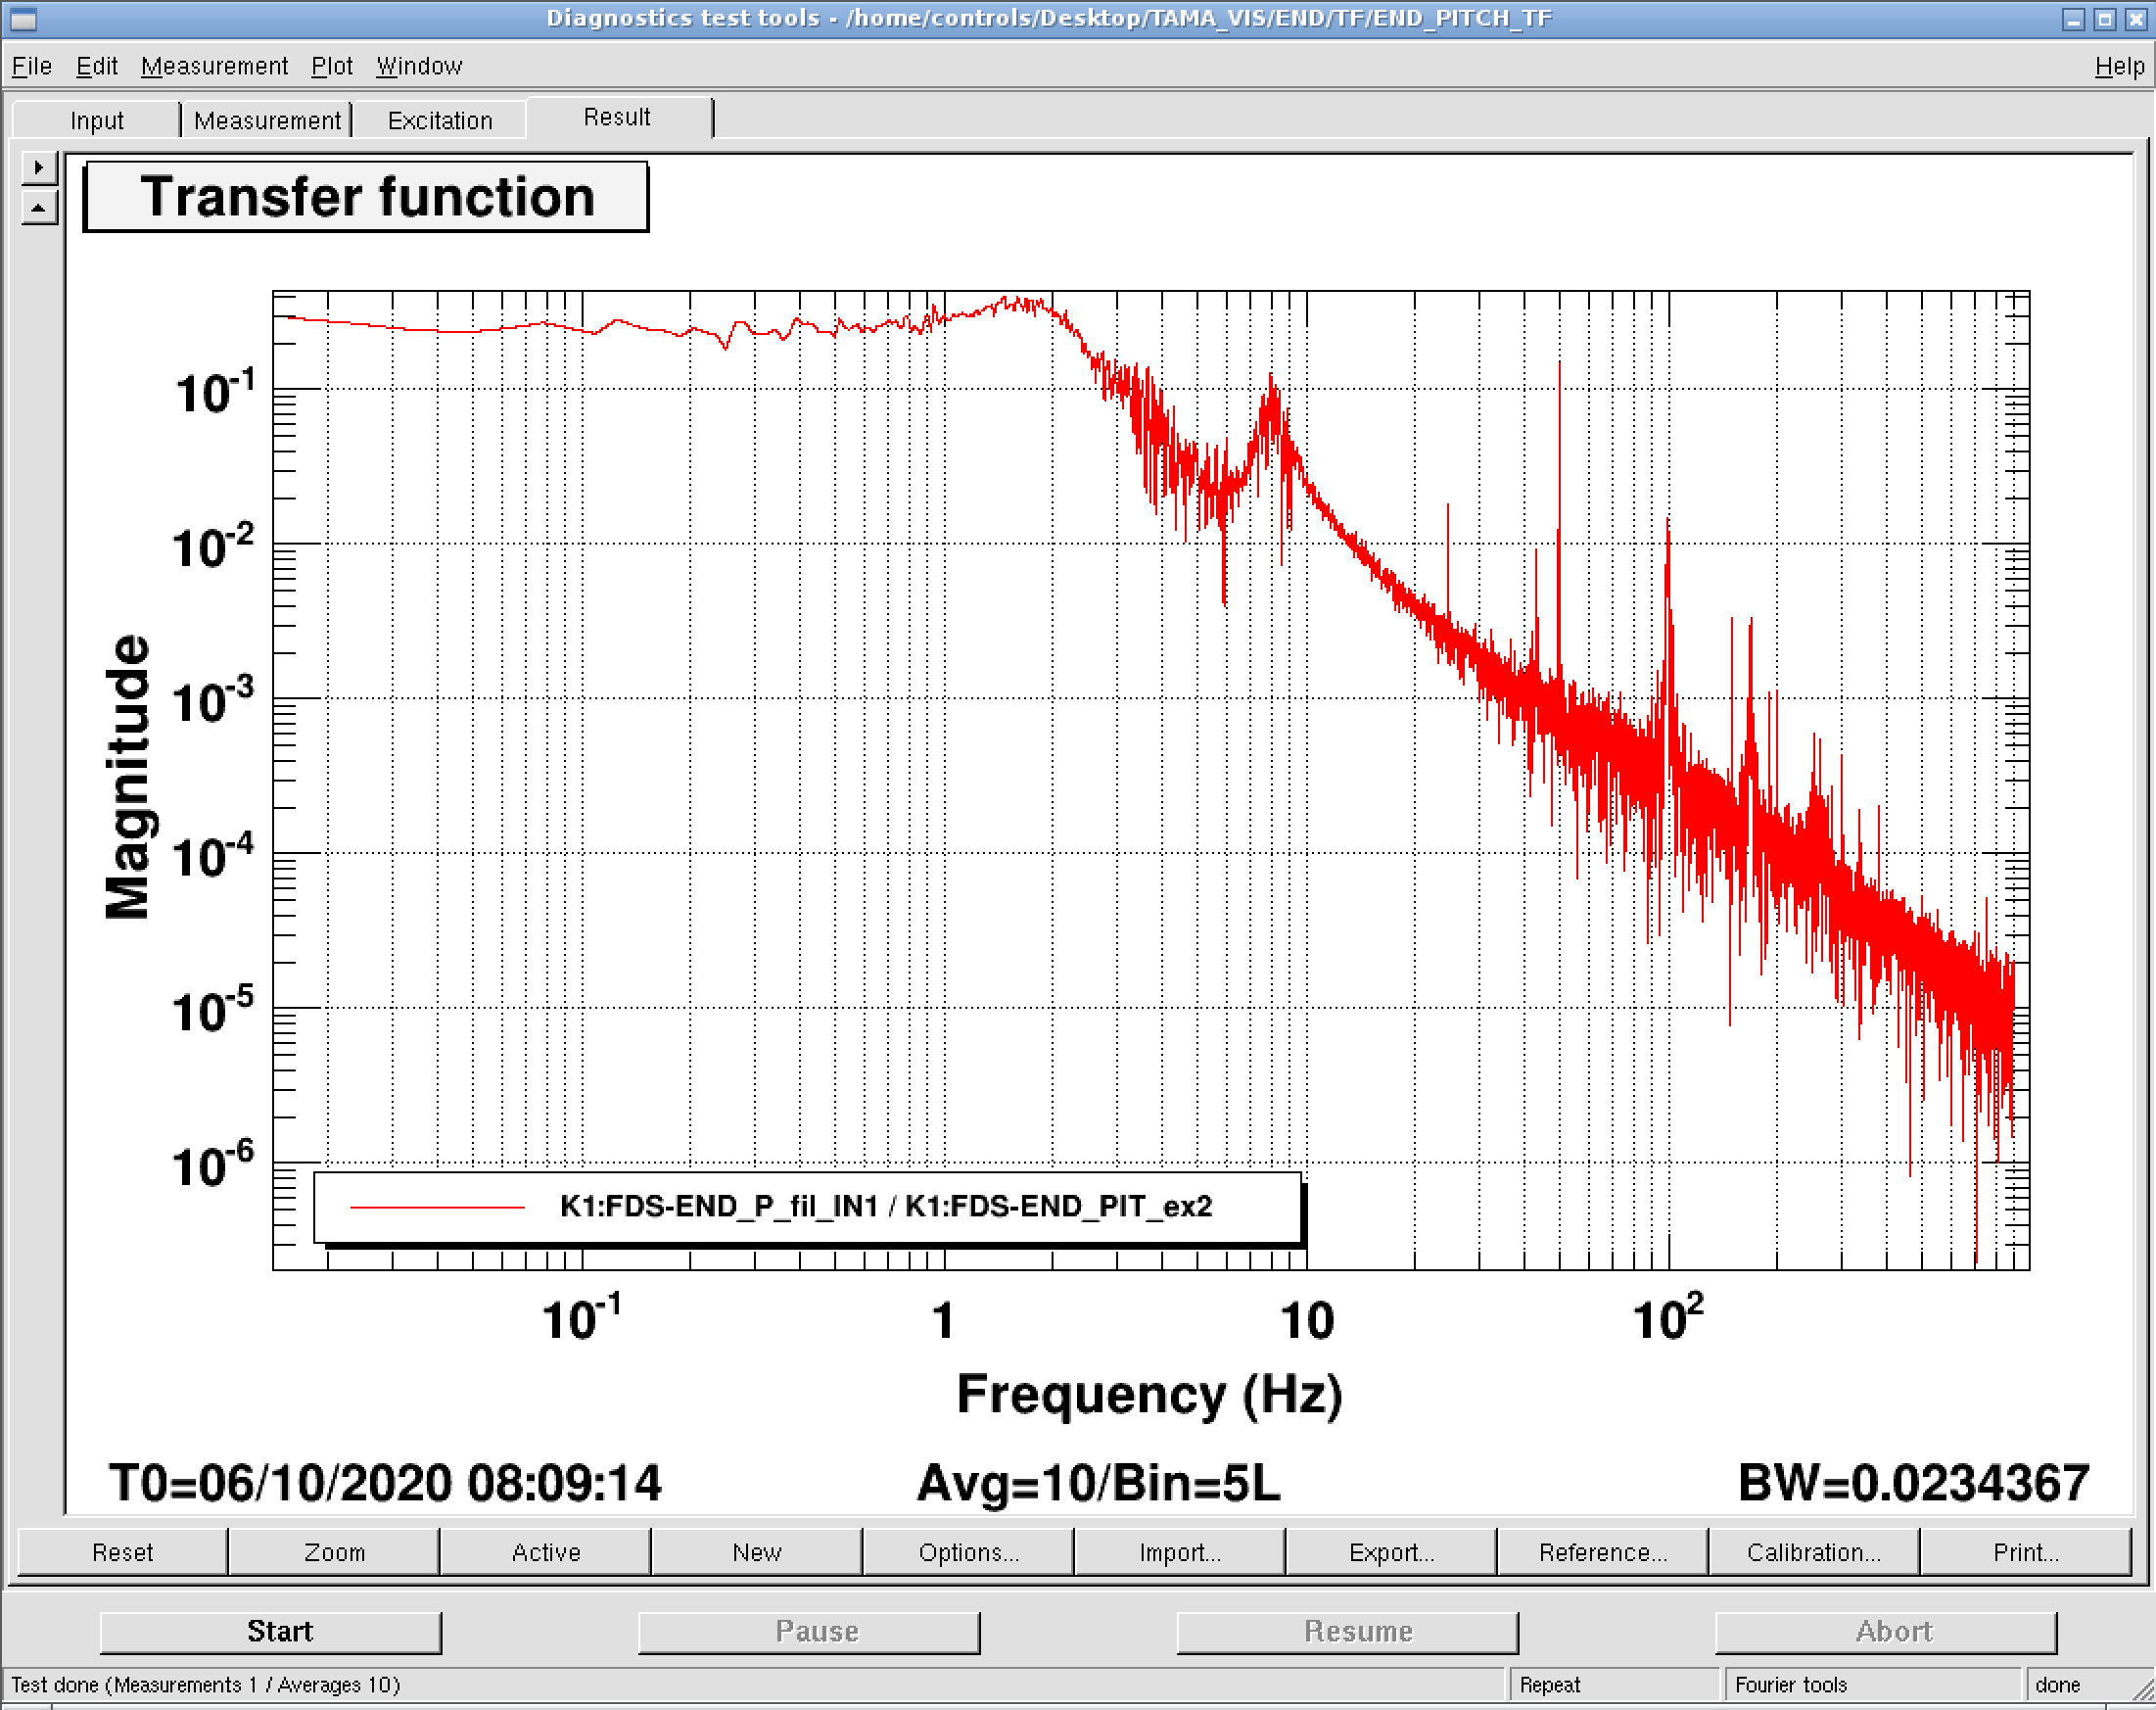
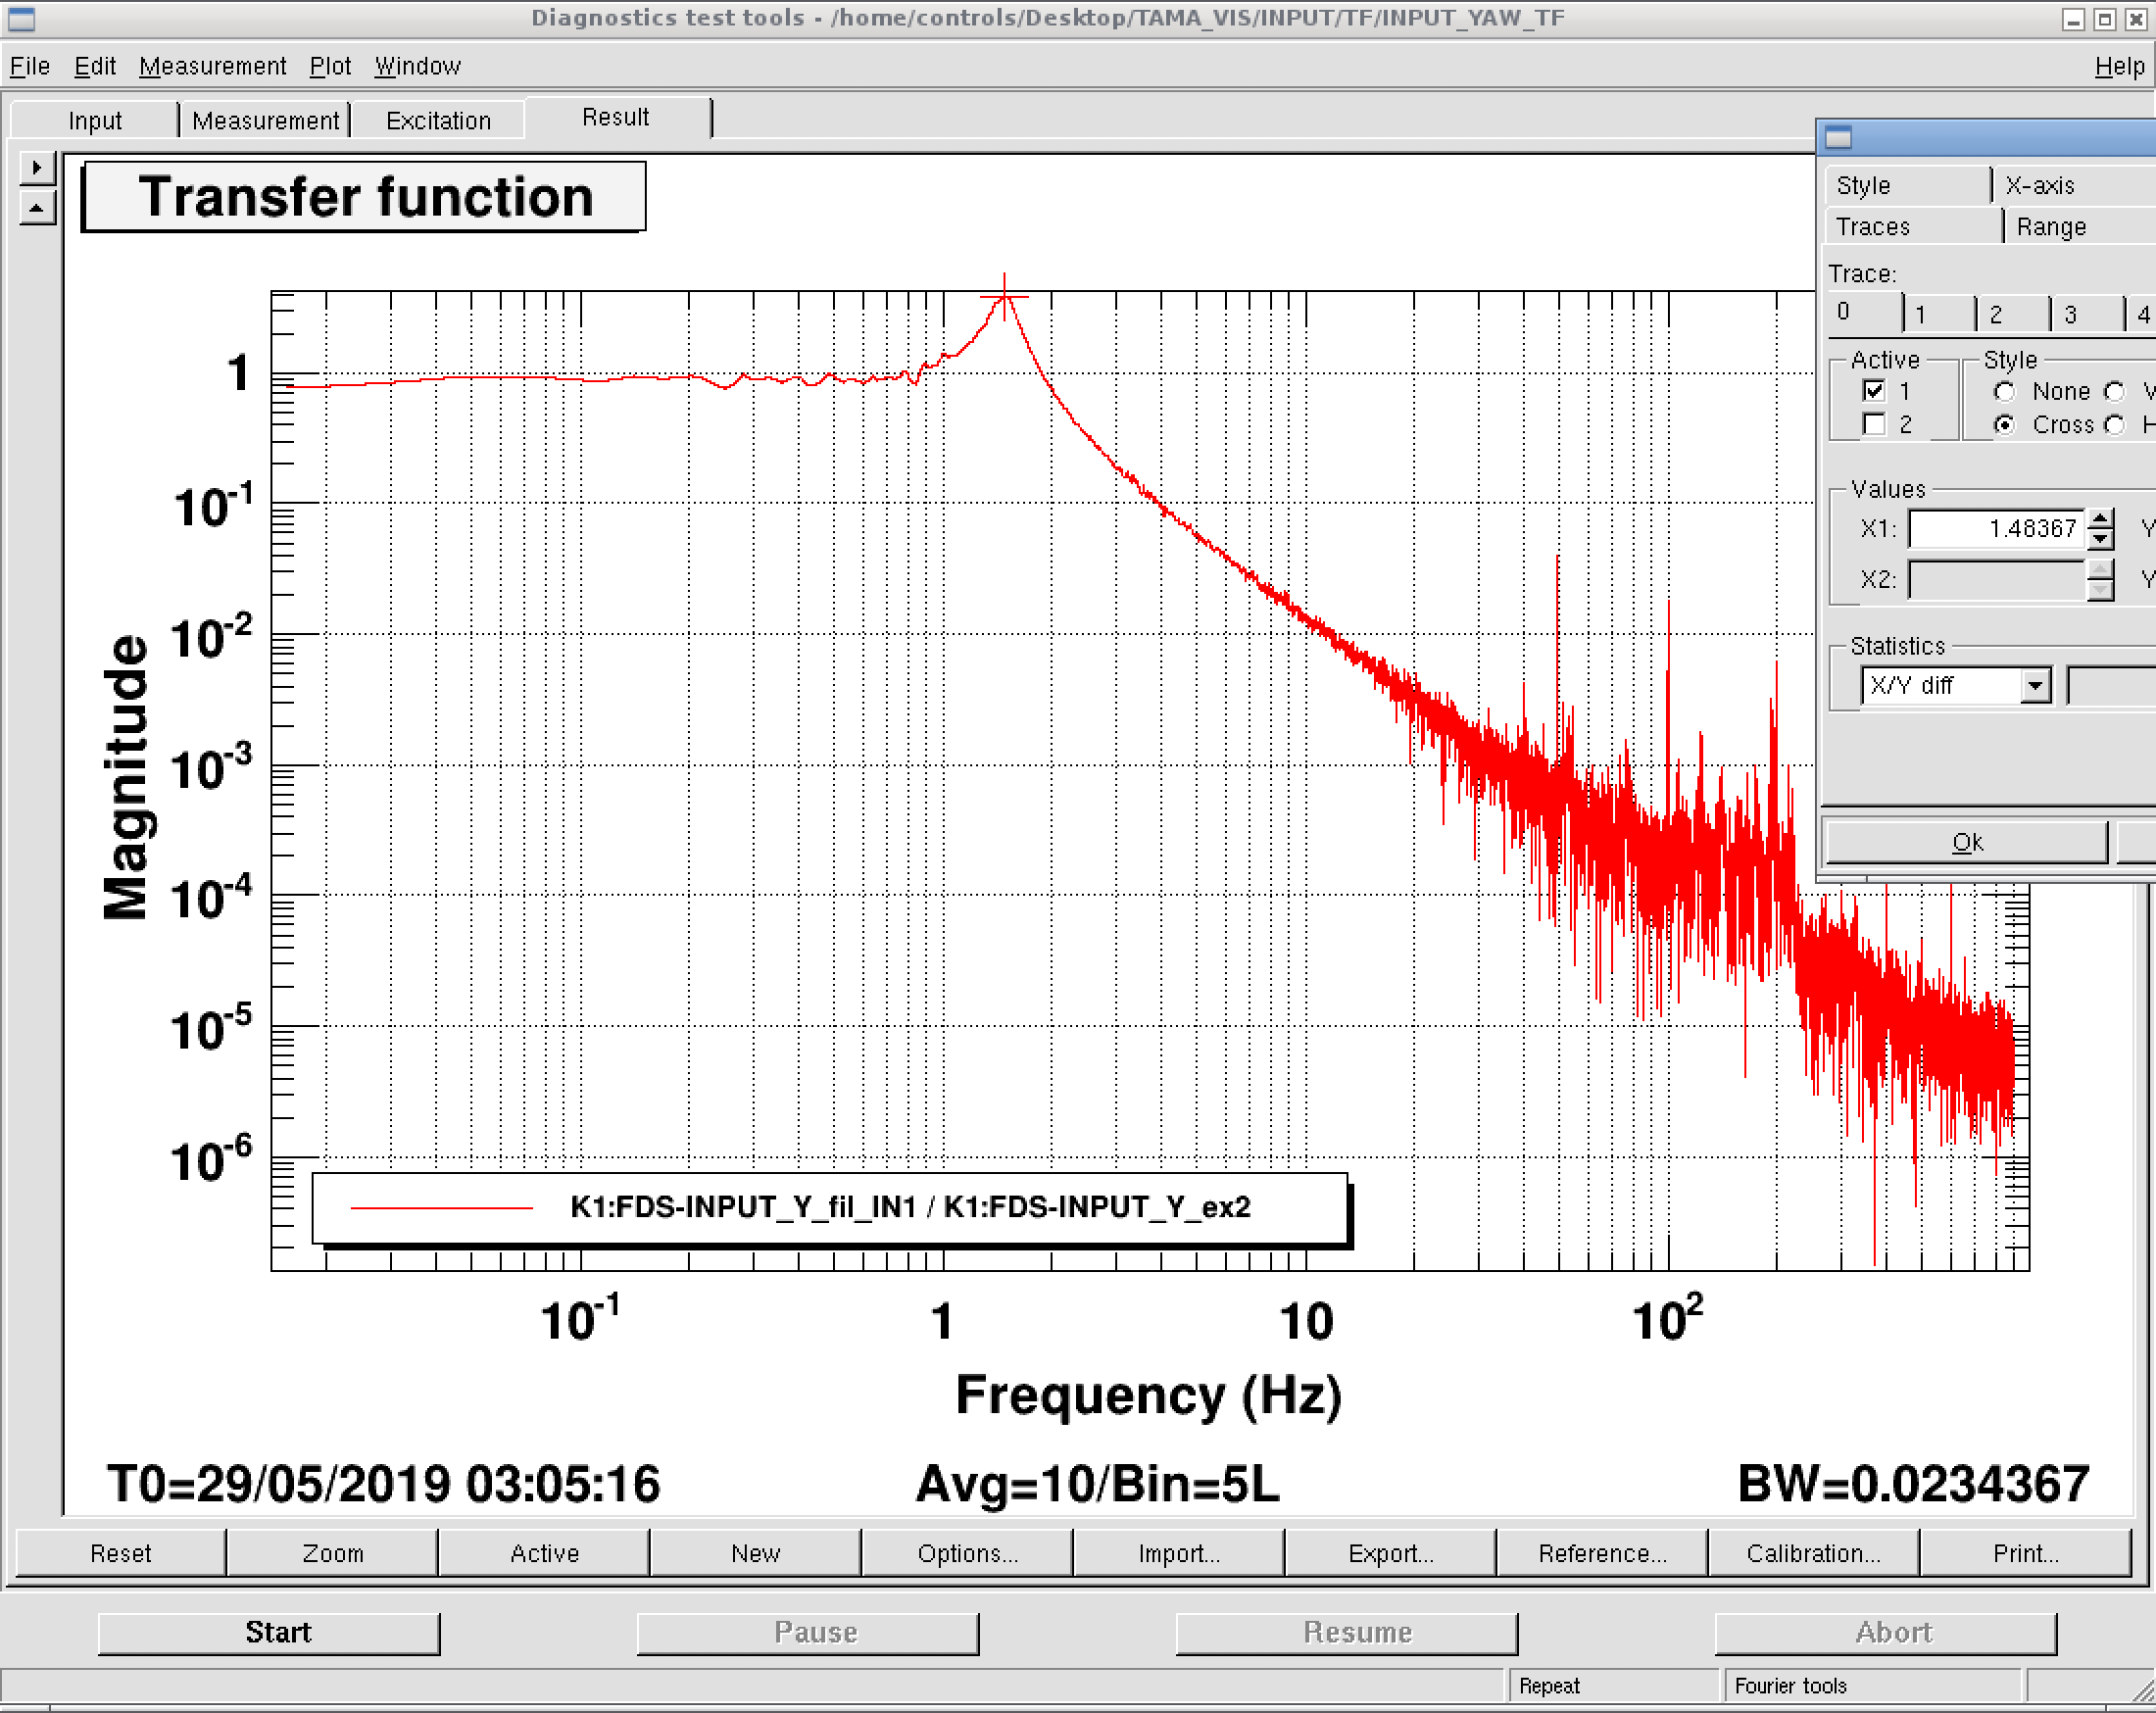
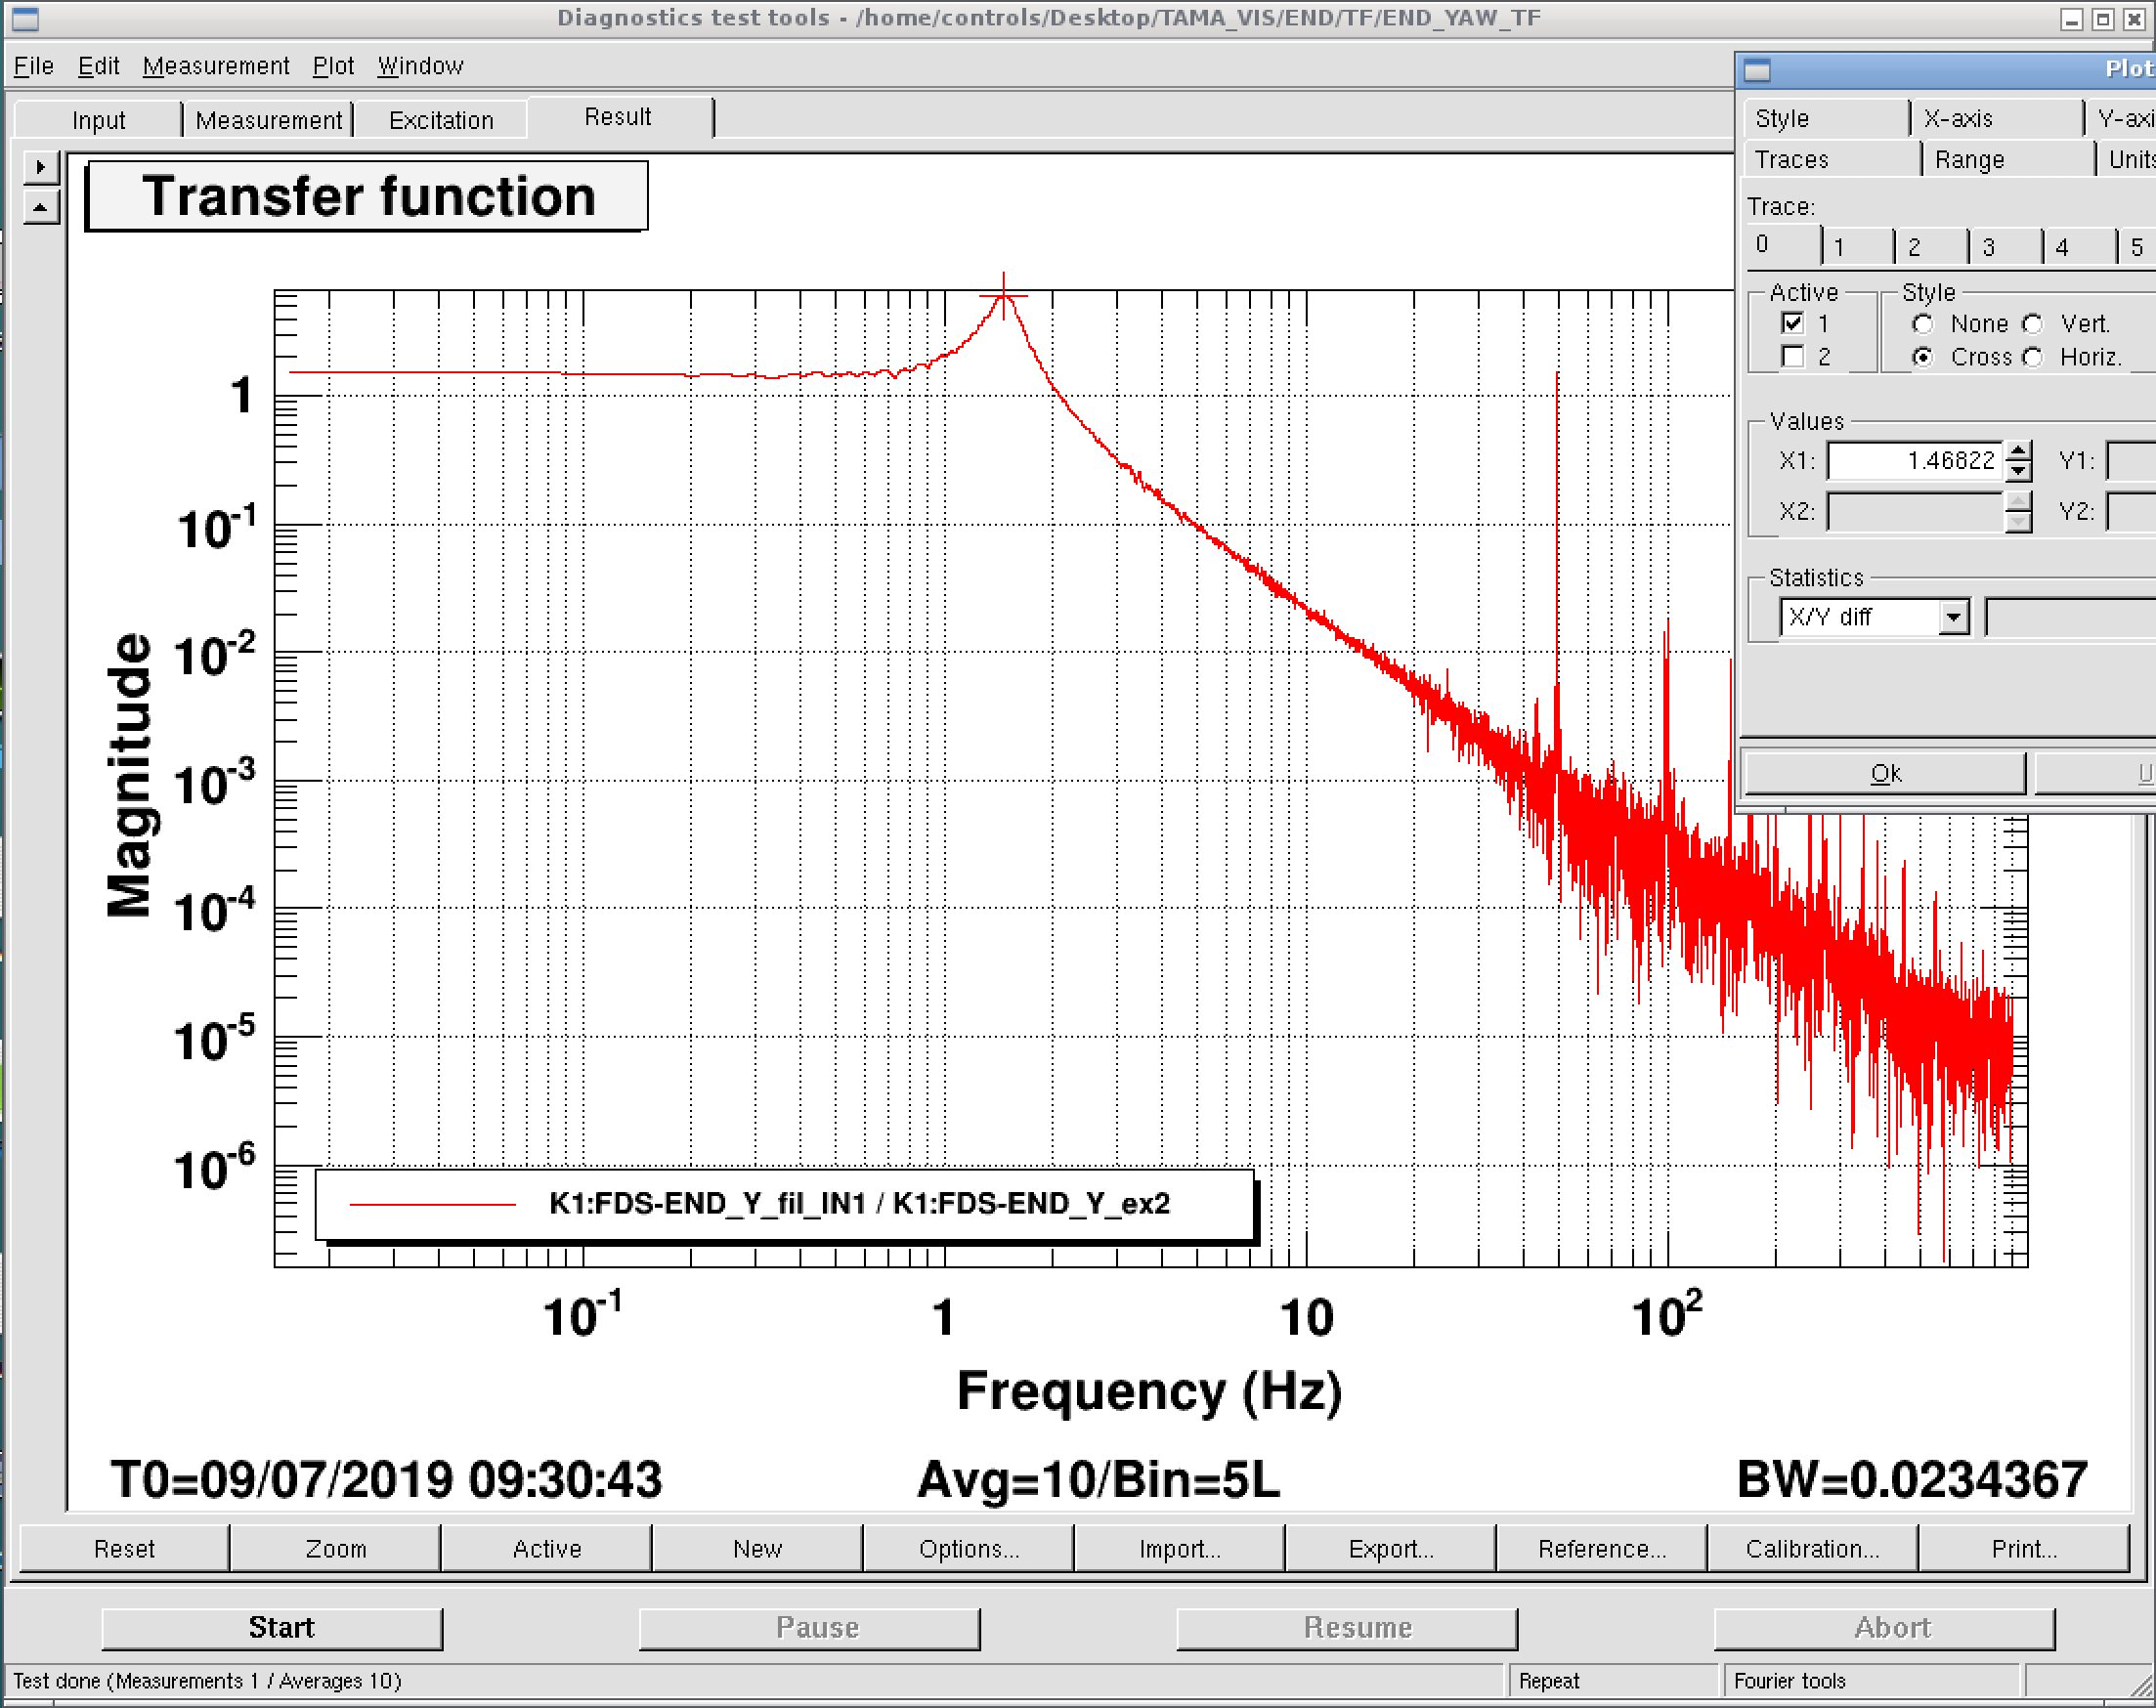
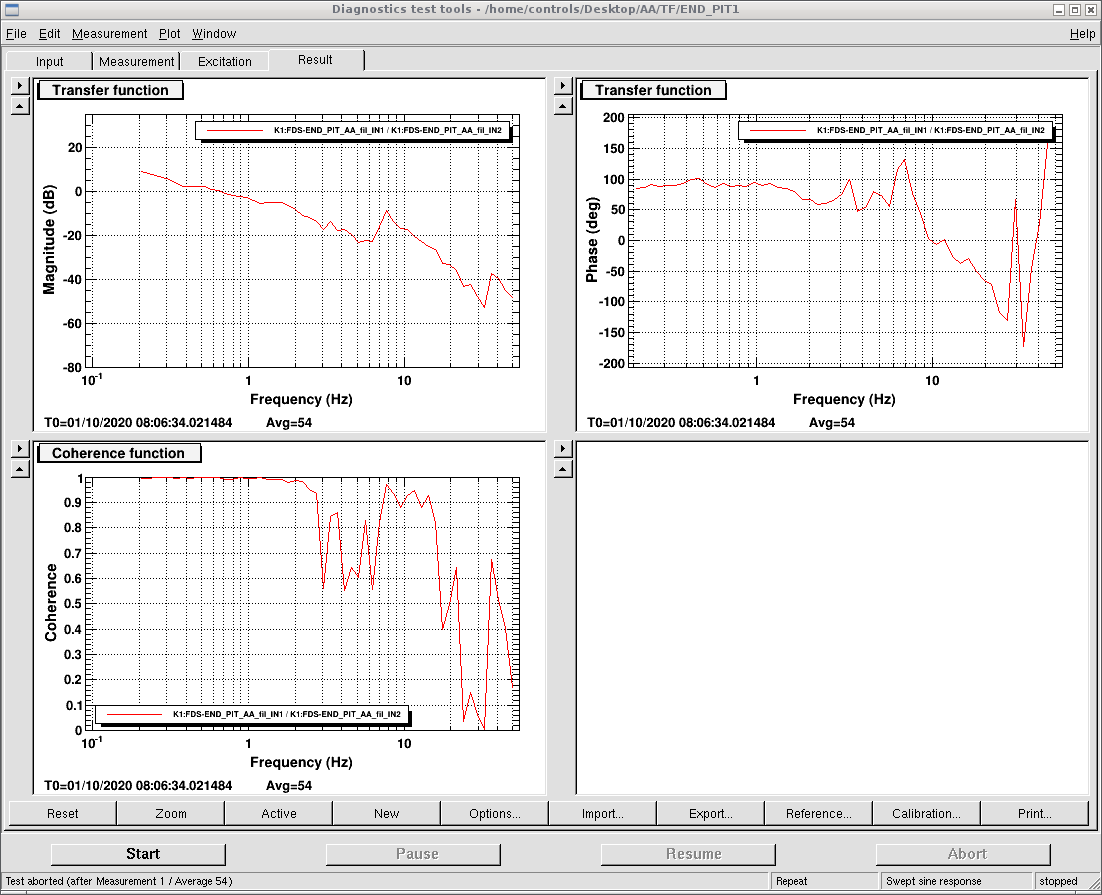
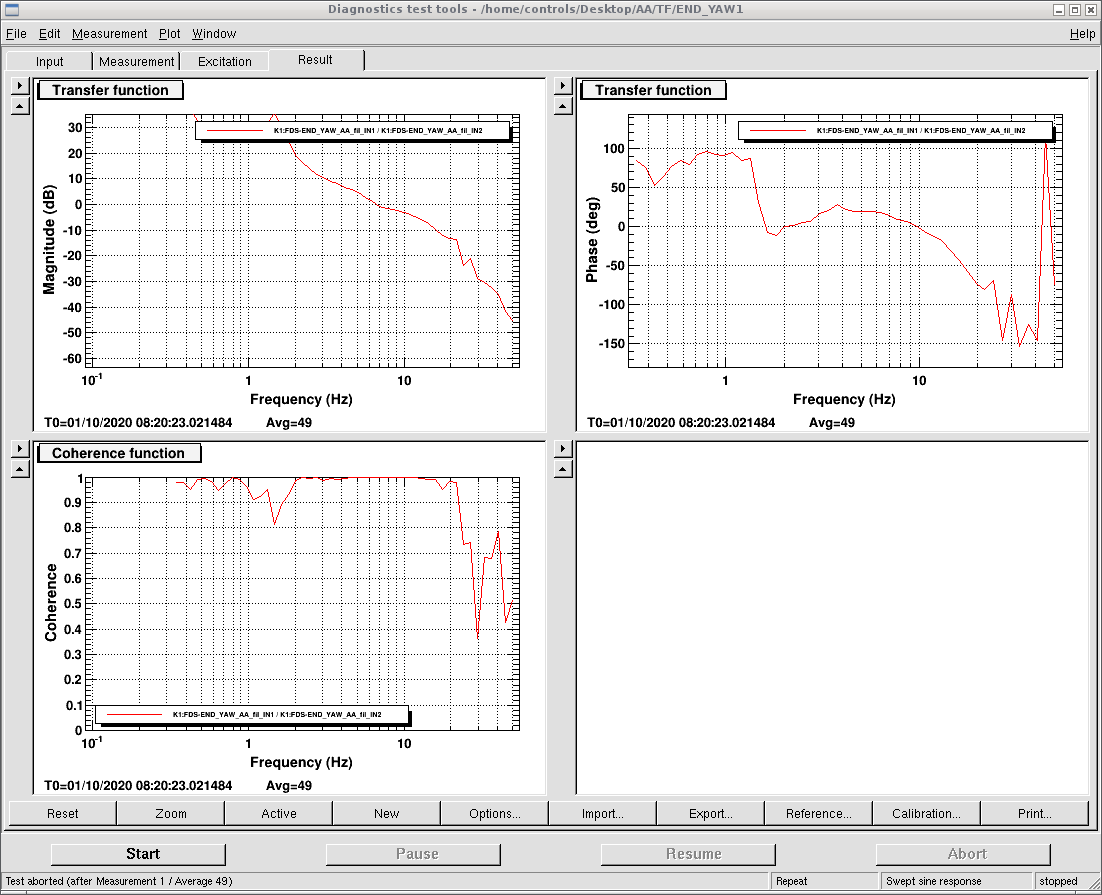
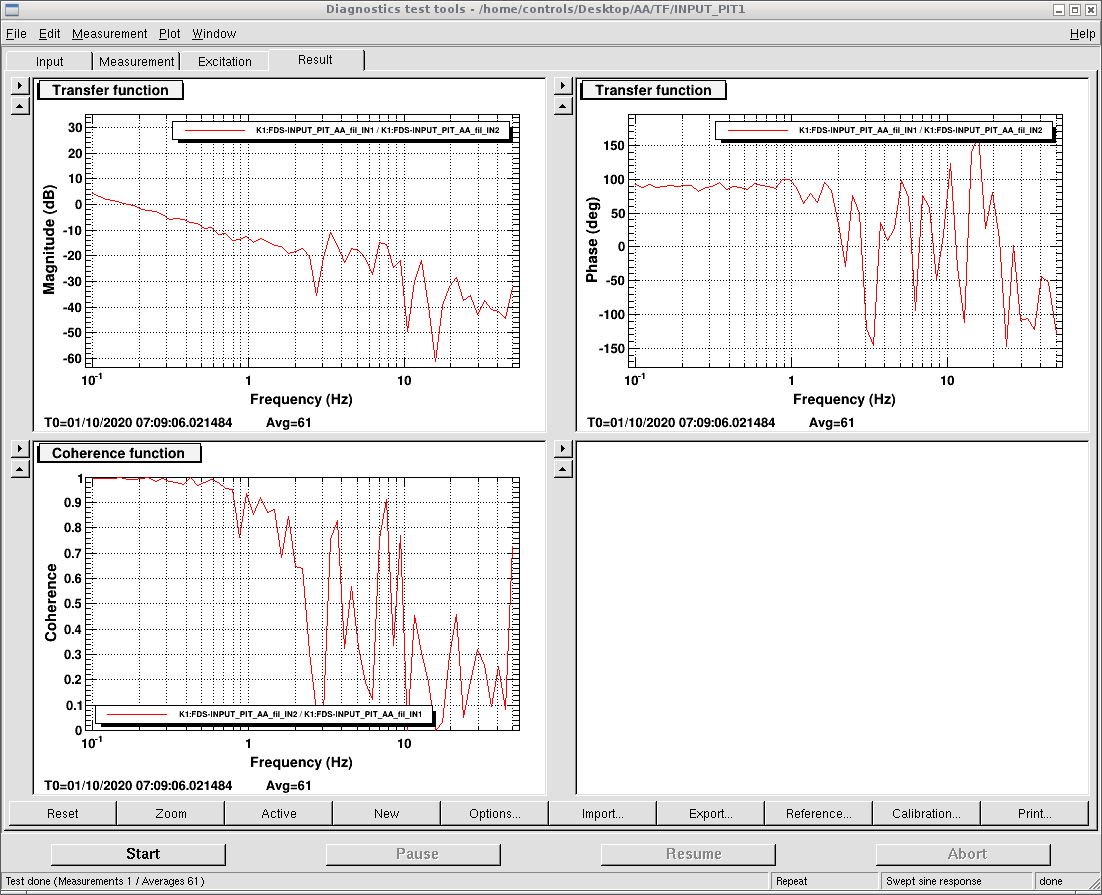
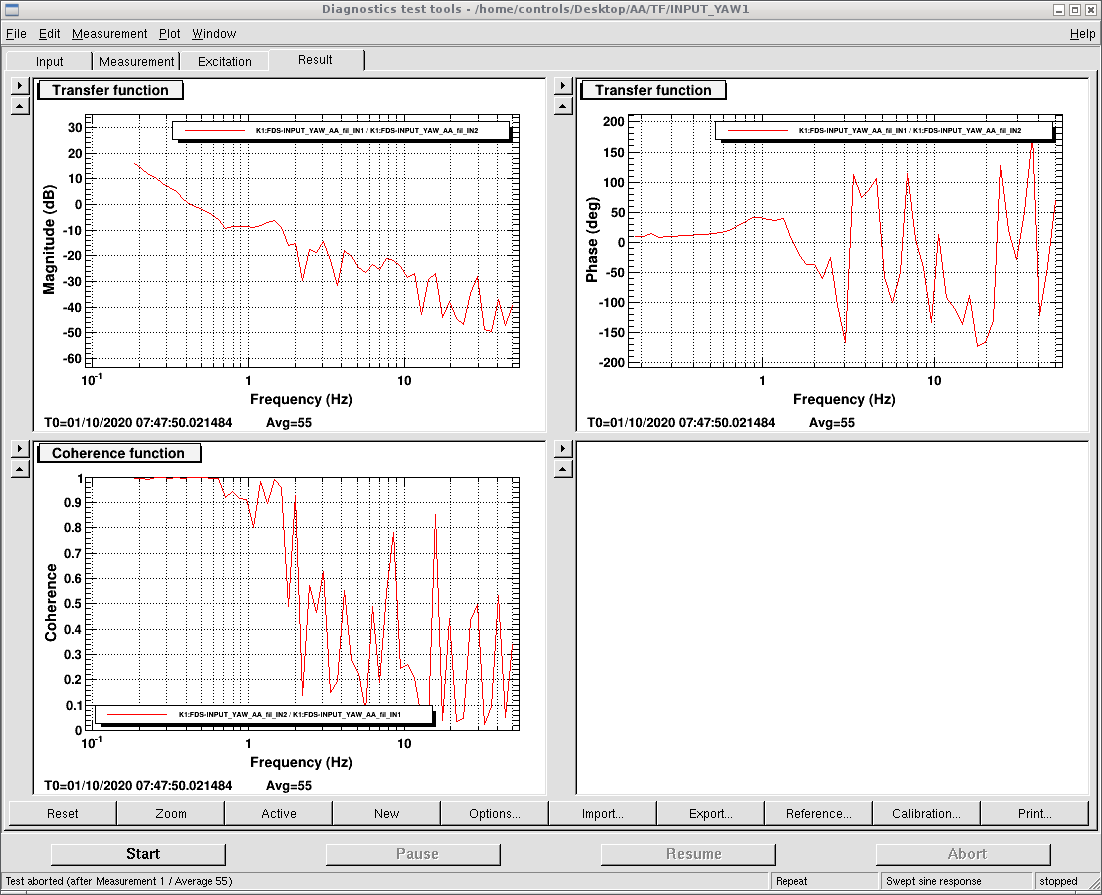
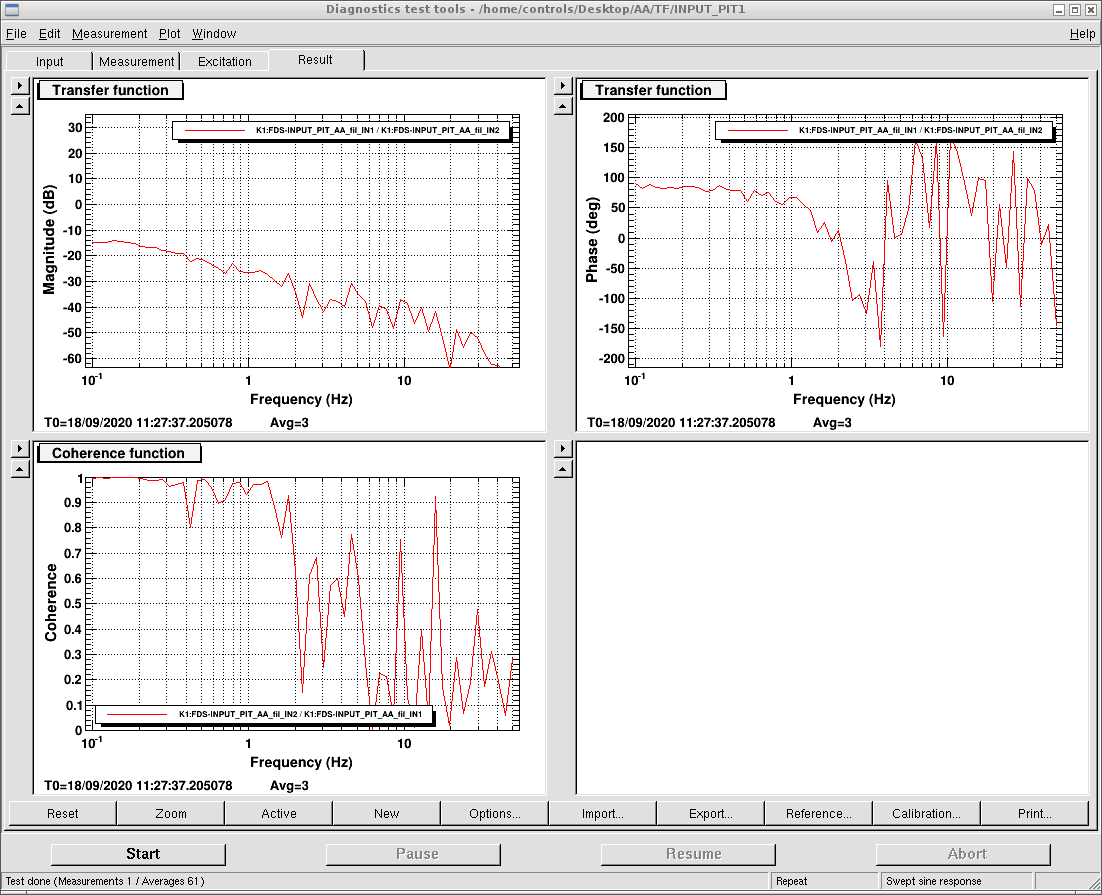
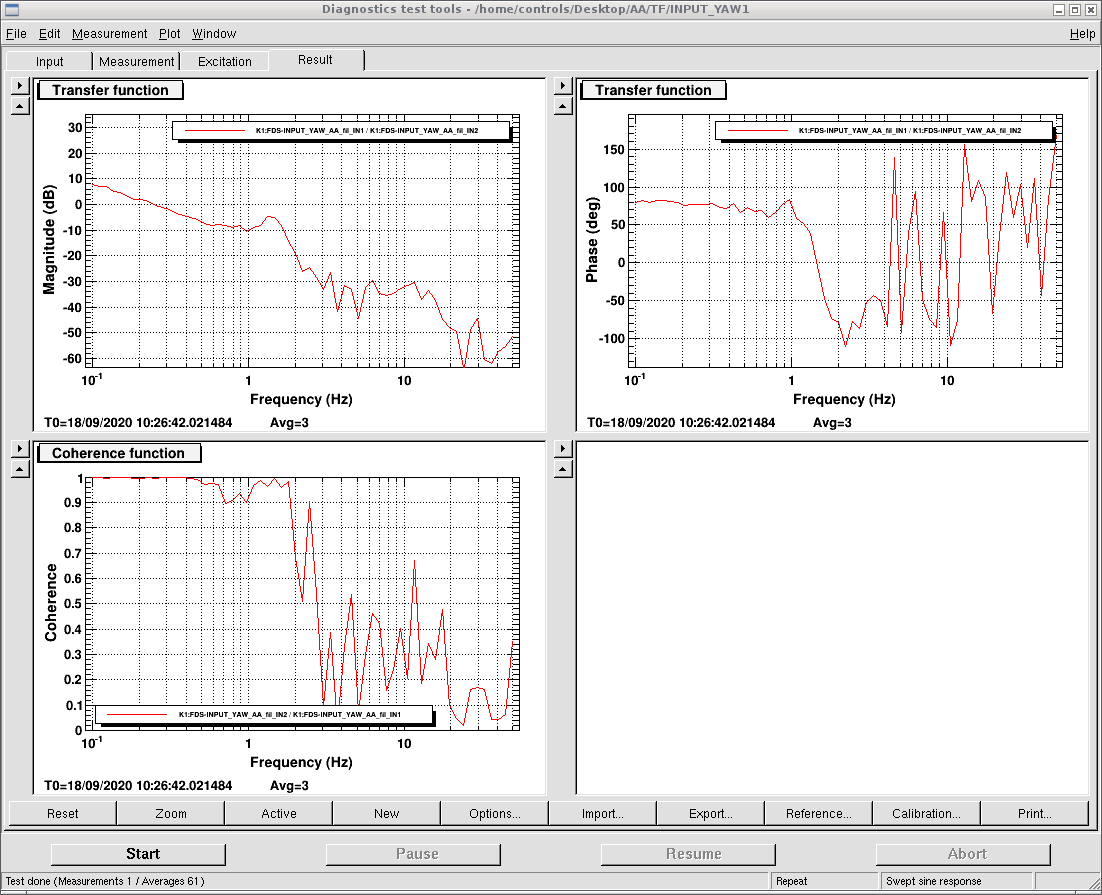
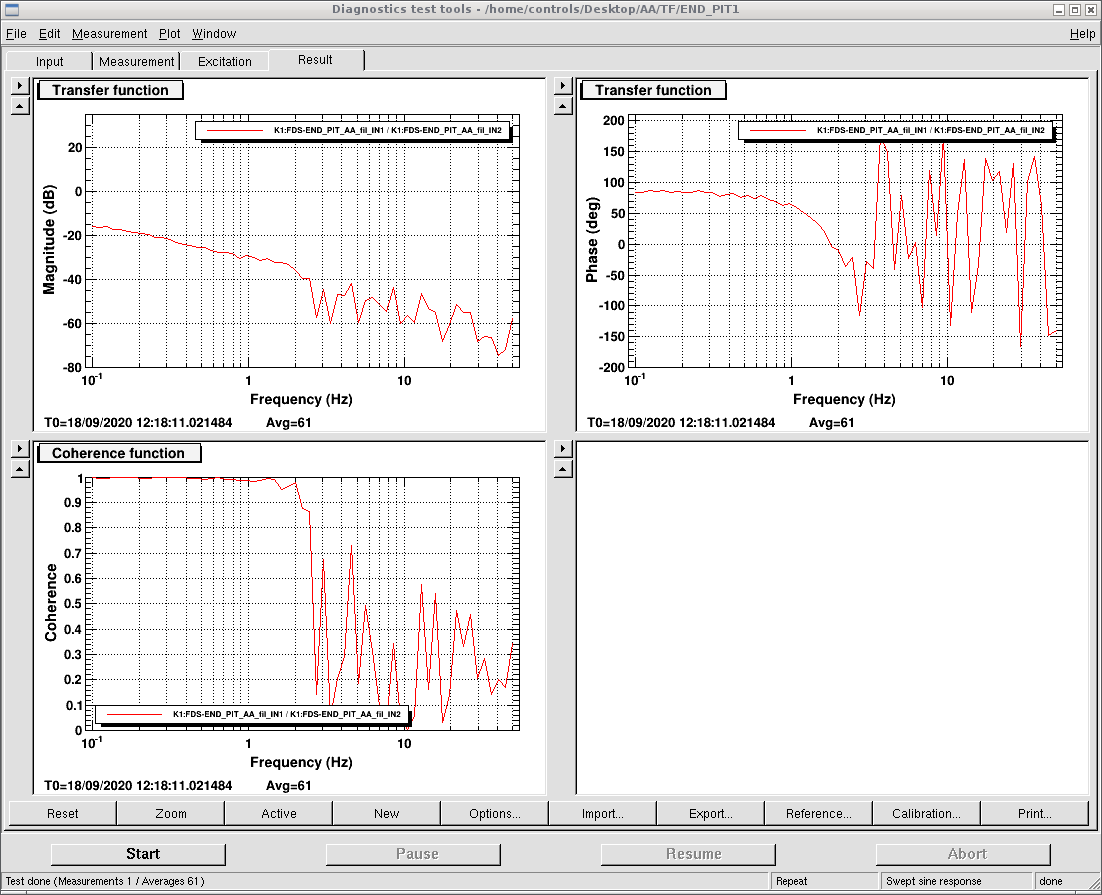
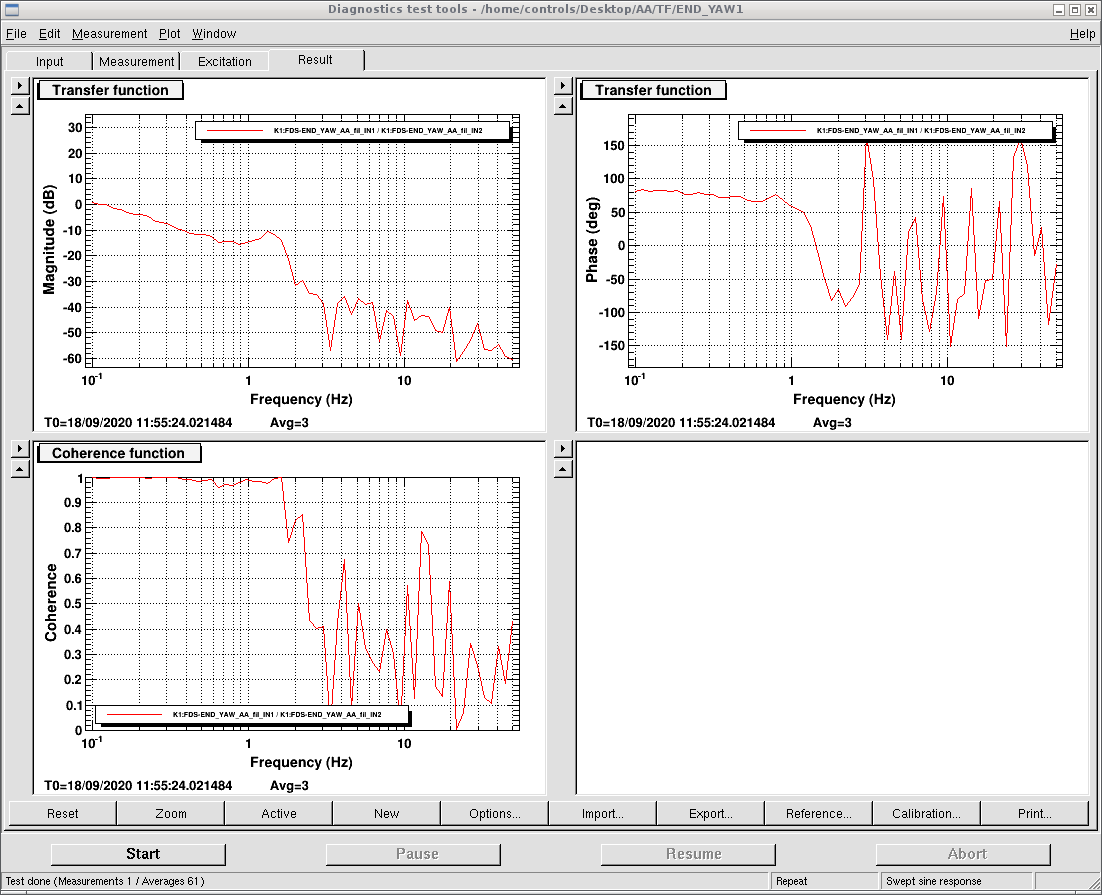
1.According to the transfer function of INPUT/END pitch (figure 2, 3), it seems the resonance around 8 and 9Hz is feed back a lot. But according to the transfer function of INPUT/END yaw (figure 4, 5), it seems the resonance around 1.45Hz is only obvious in the orange line.
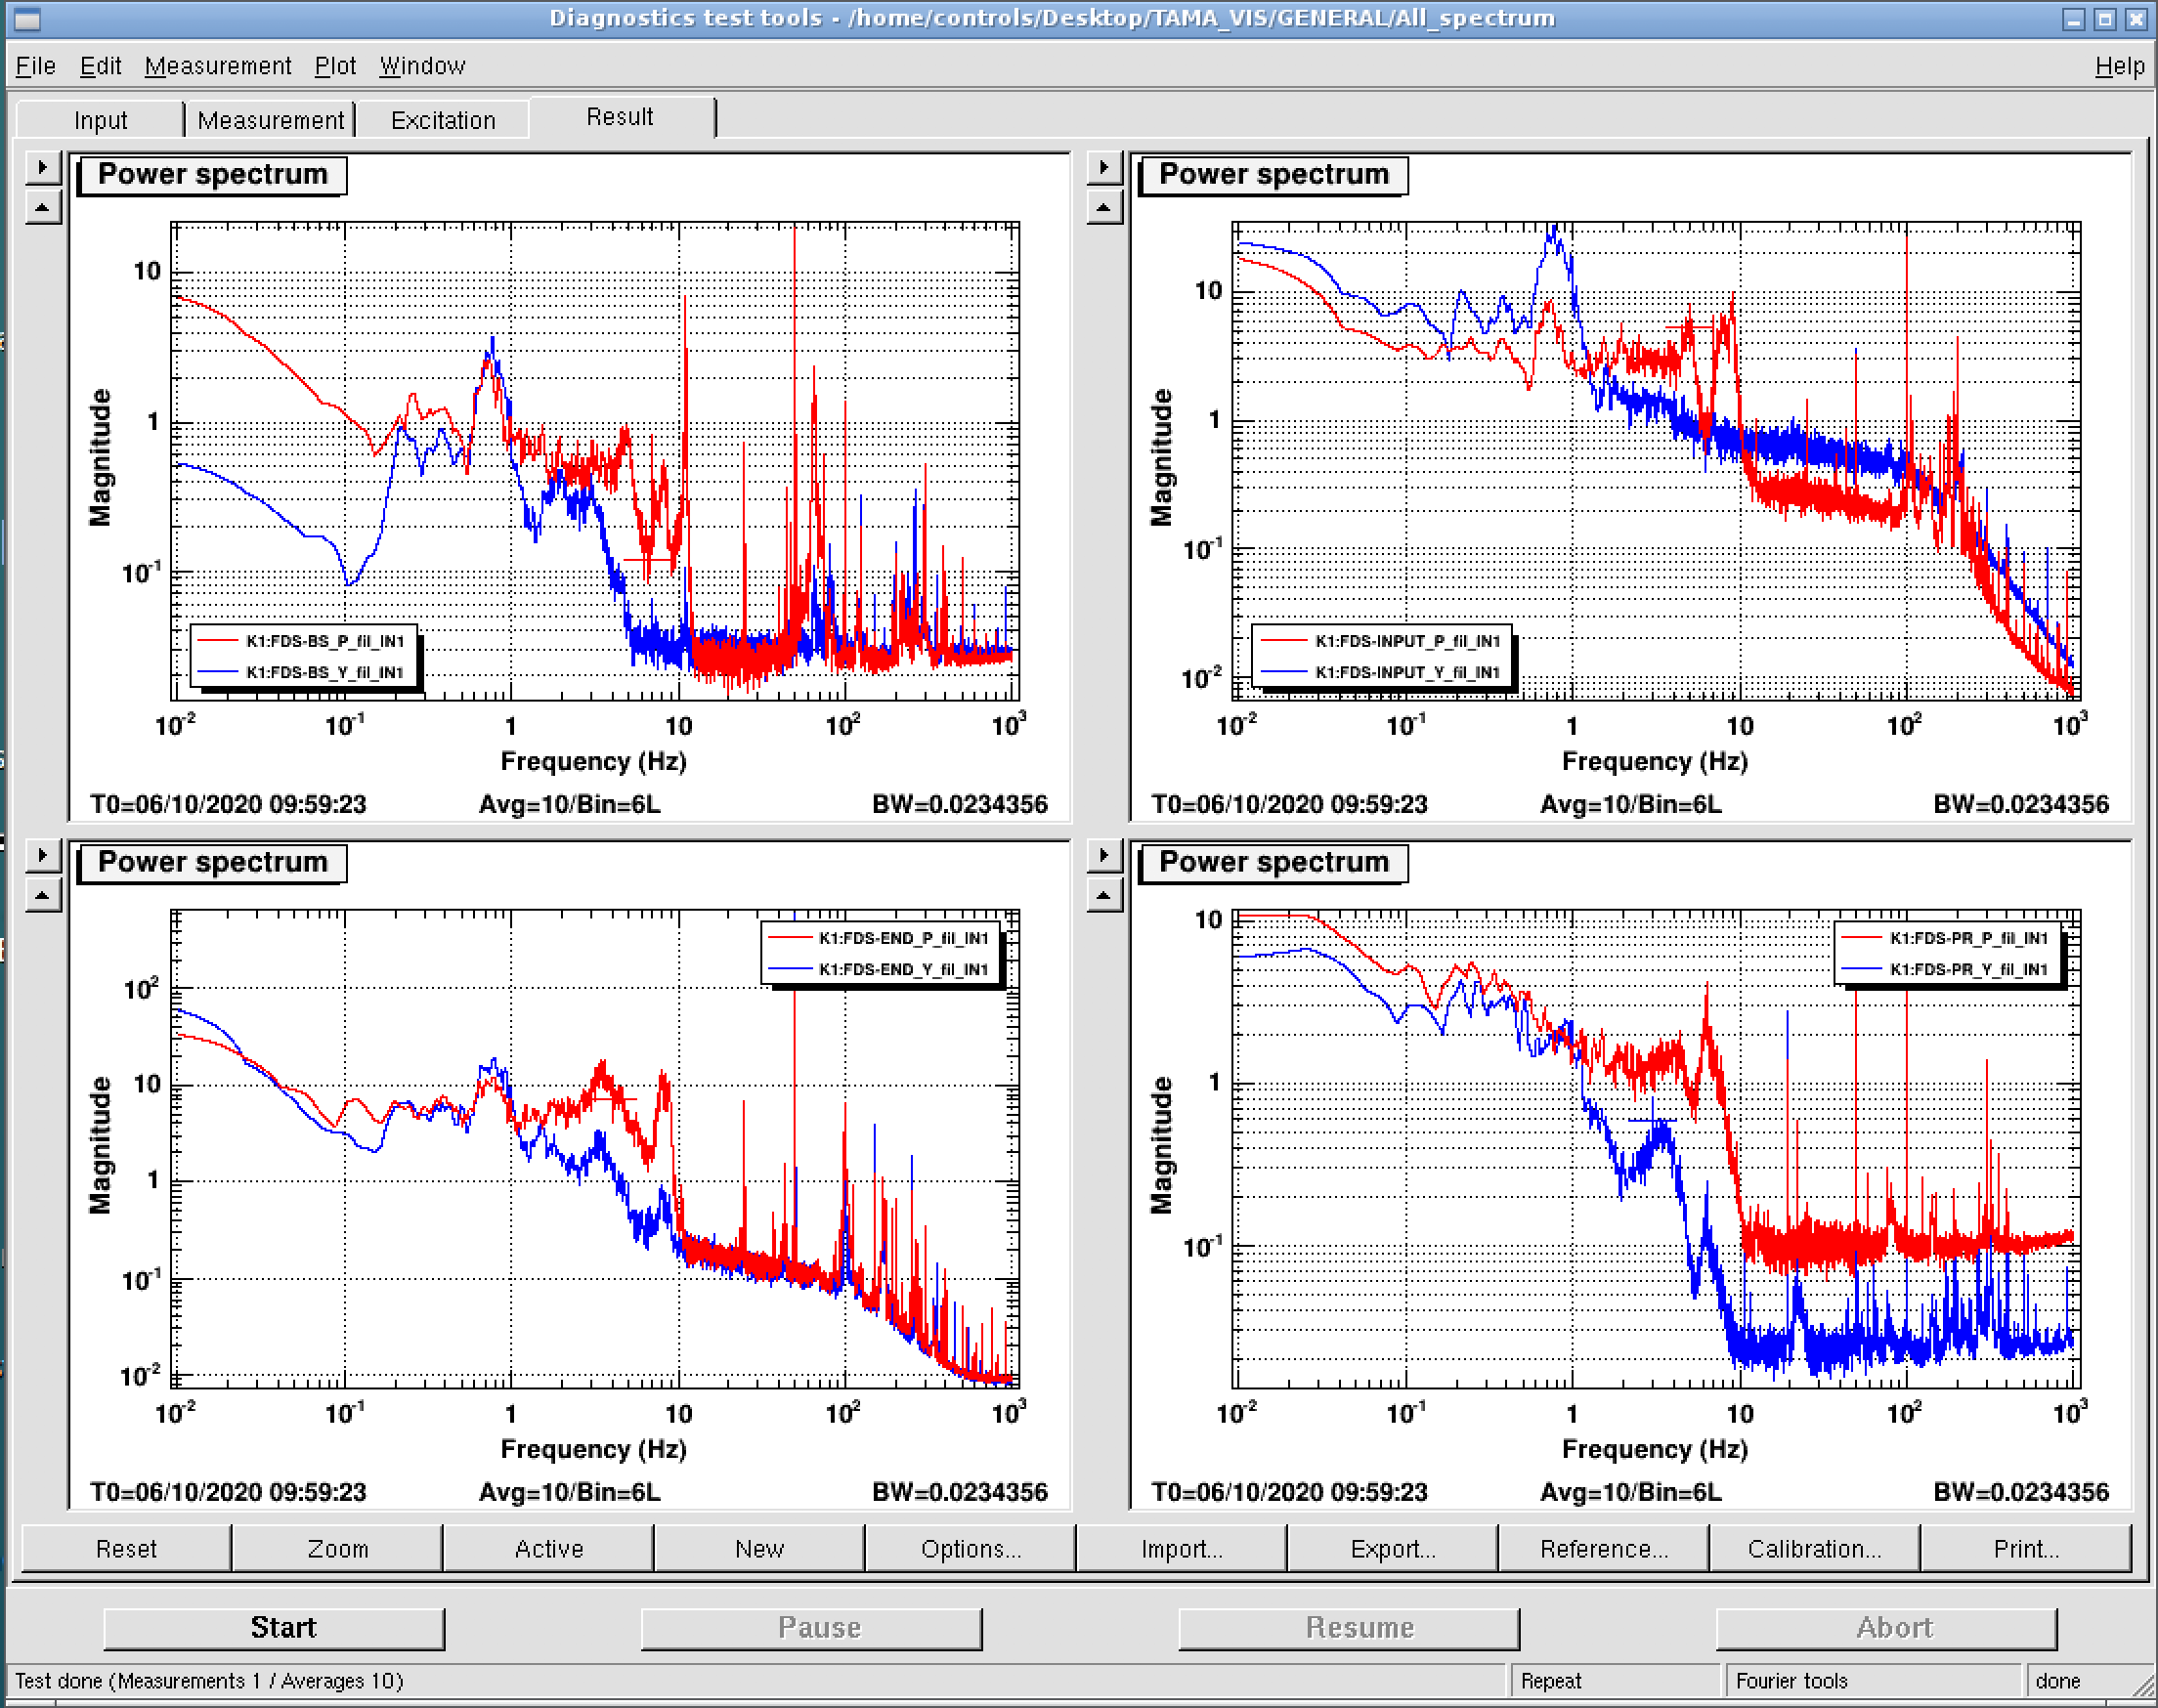
2. By checking the noise spectrum of each mirror motion, the new peak in orange line around 6.5Hz should come from the Pitch/Yaw of PR.
3. By checking the noise spectrum, the orange ~3Hz peak's reduction may be due to END mirror pitch is controlled better. The orange ~5Hz peak's reduction maybe due to INPUT mirror pitch is controlled better.
Note that: the green and blue lines were measured within almost 5mins. But the organge line was measured almost 4hours later.
The setting of AA loop is as follows:
|
|
Poles |
Zeros |
Gain |
|
END_pit |
0, 20(Q=1) |
2(Q=1) |
2 |
|
END_yaw |
0, 20(Q=1) |
2(Q=1) |
20 |
|
INPUT_pit |
0, 20(Q=1) |
2(Q=1) |
0.3 |
|
INPUT_yaw |
0, 20(Q=1) |
1.3(Q=1) |
2 |
|
|
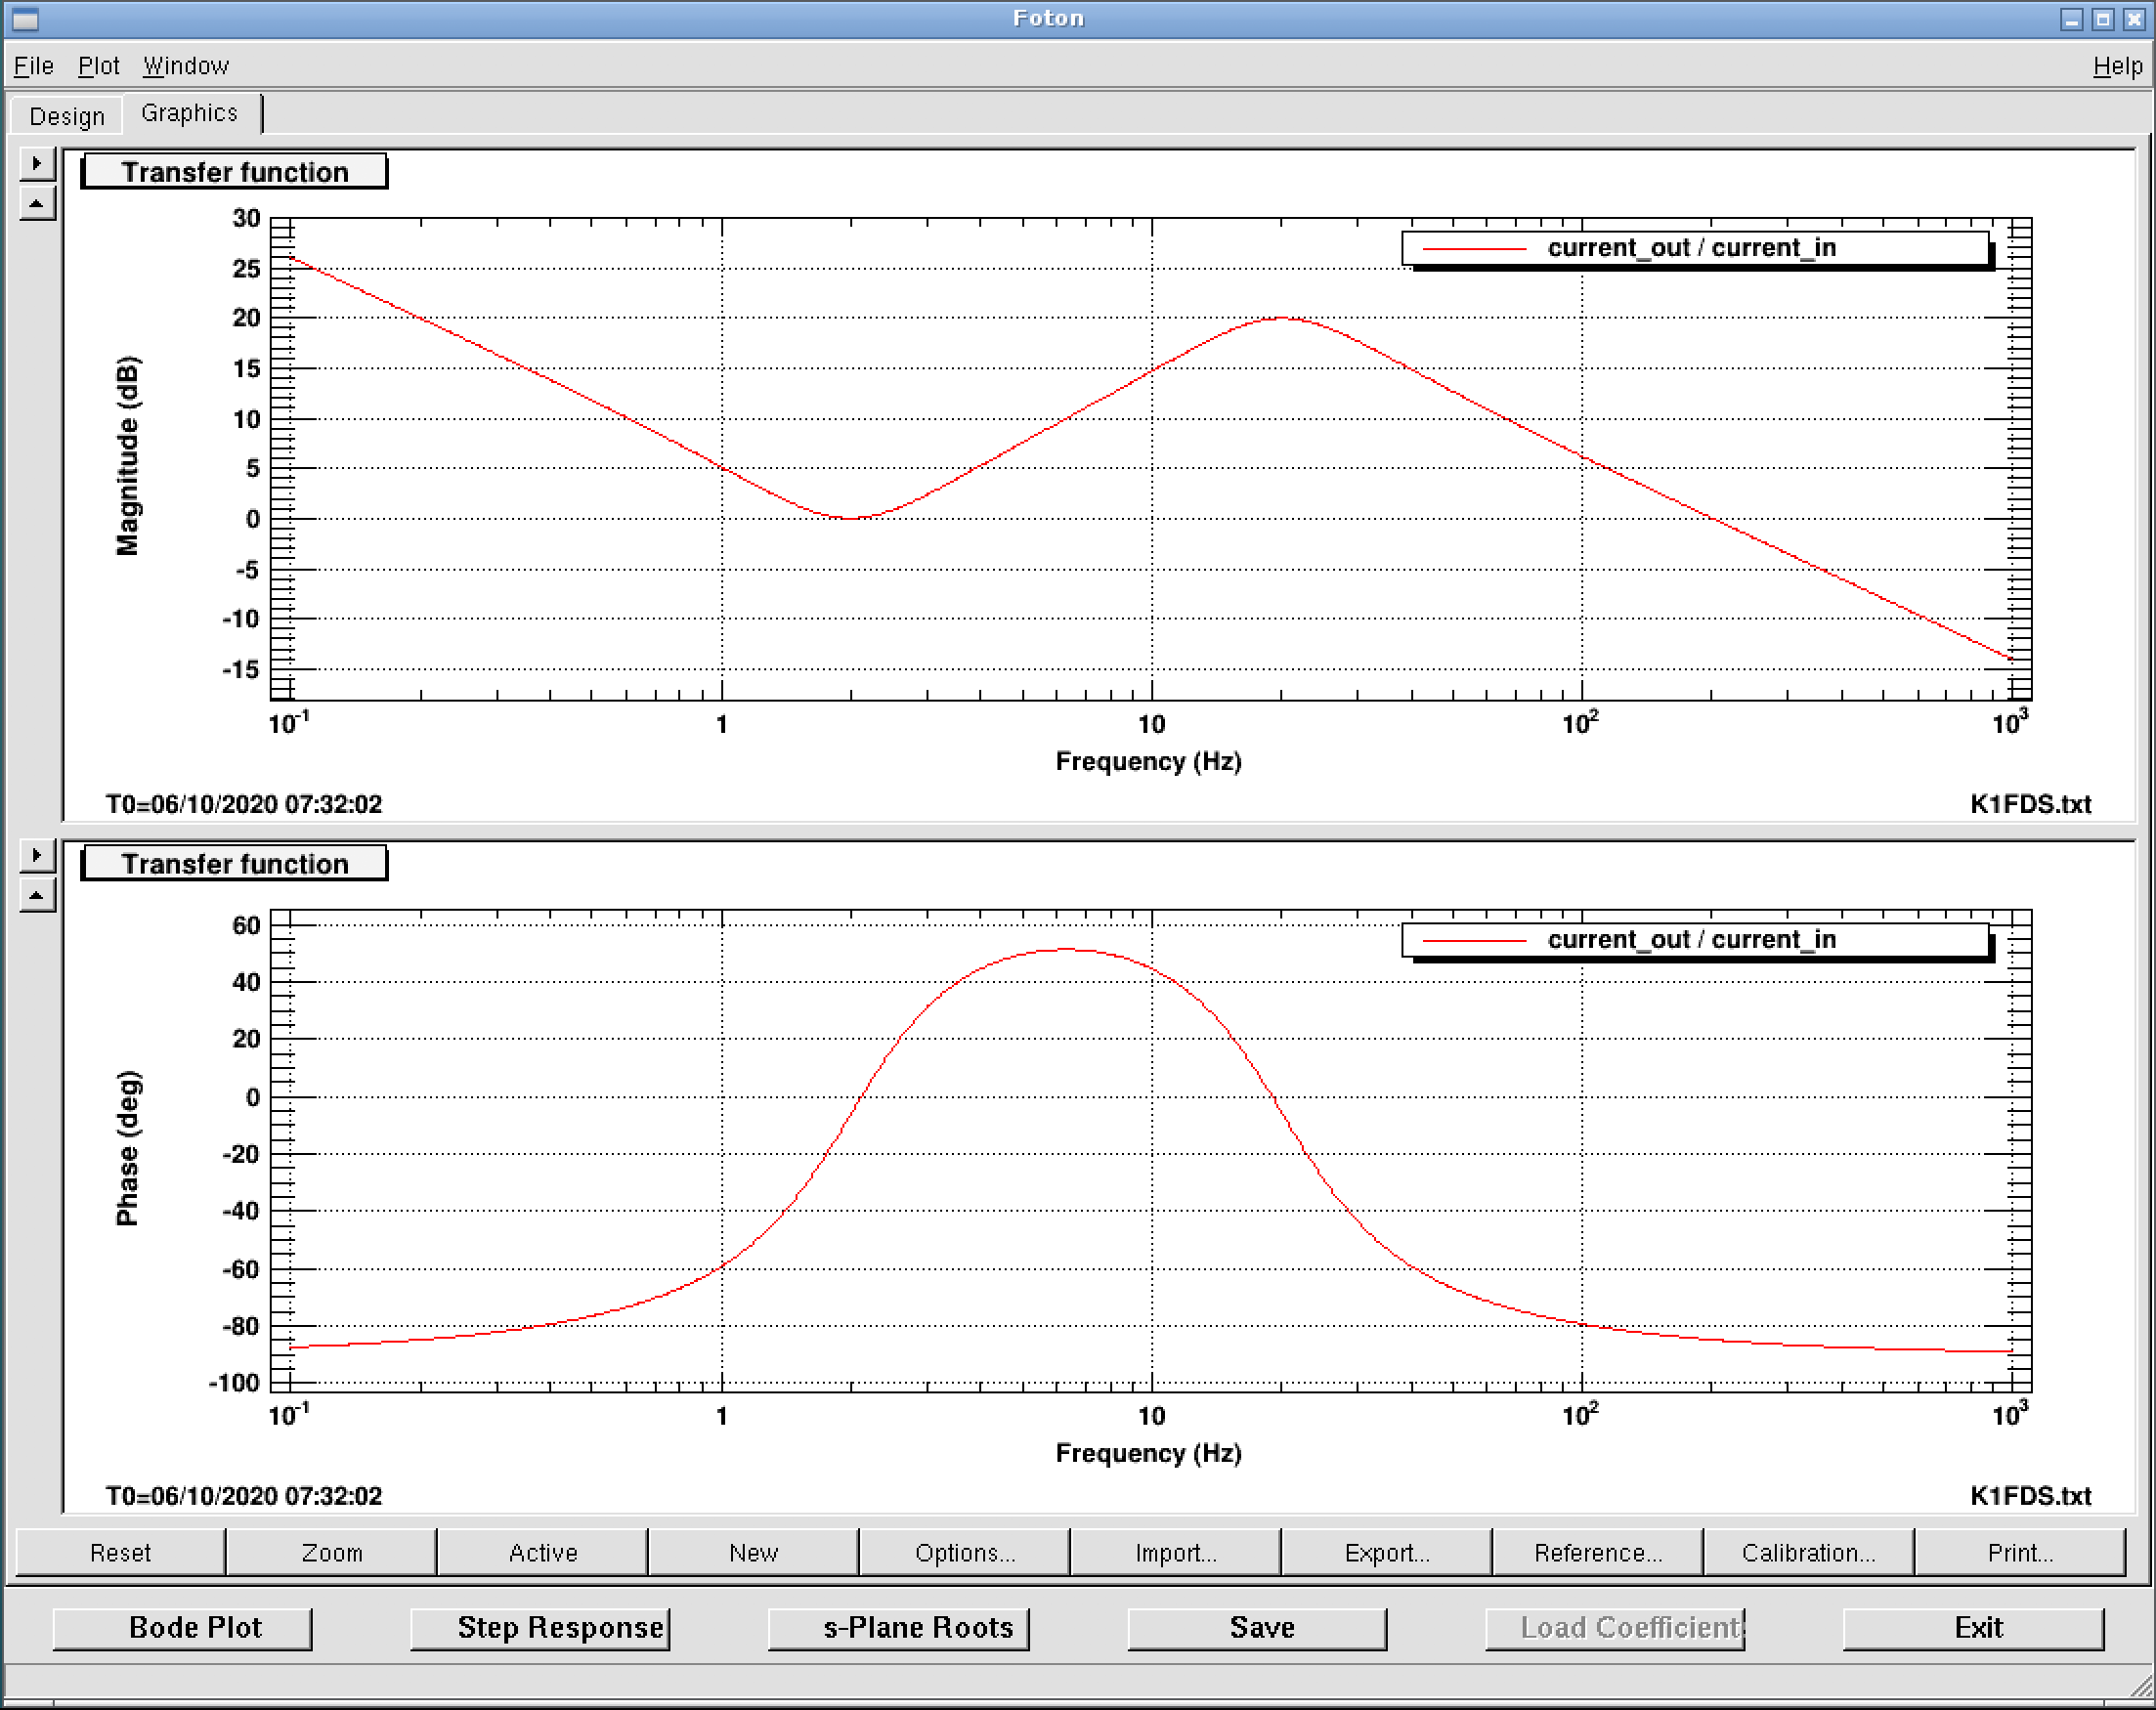
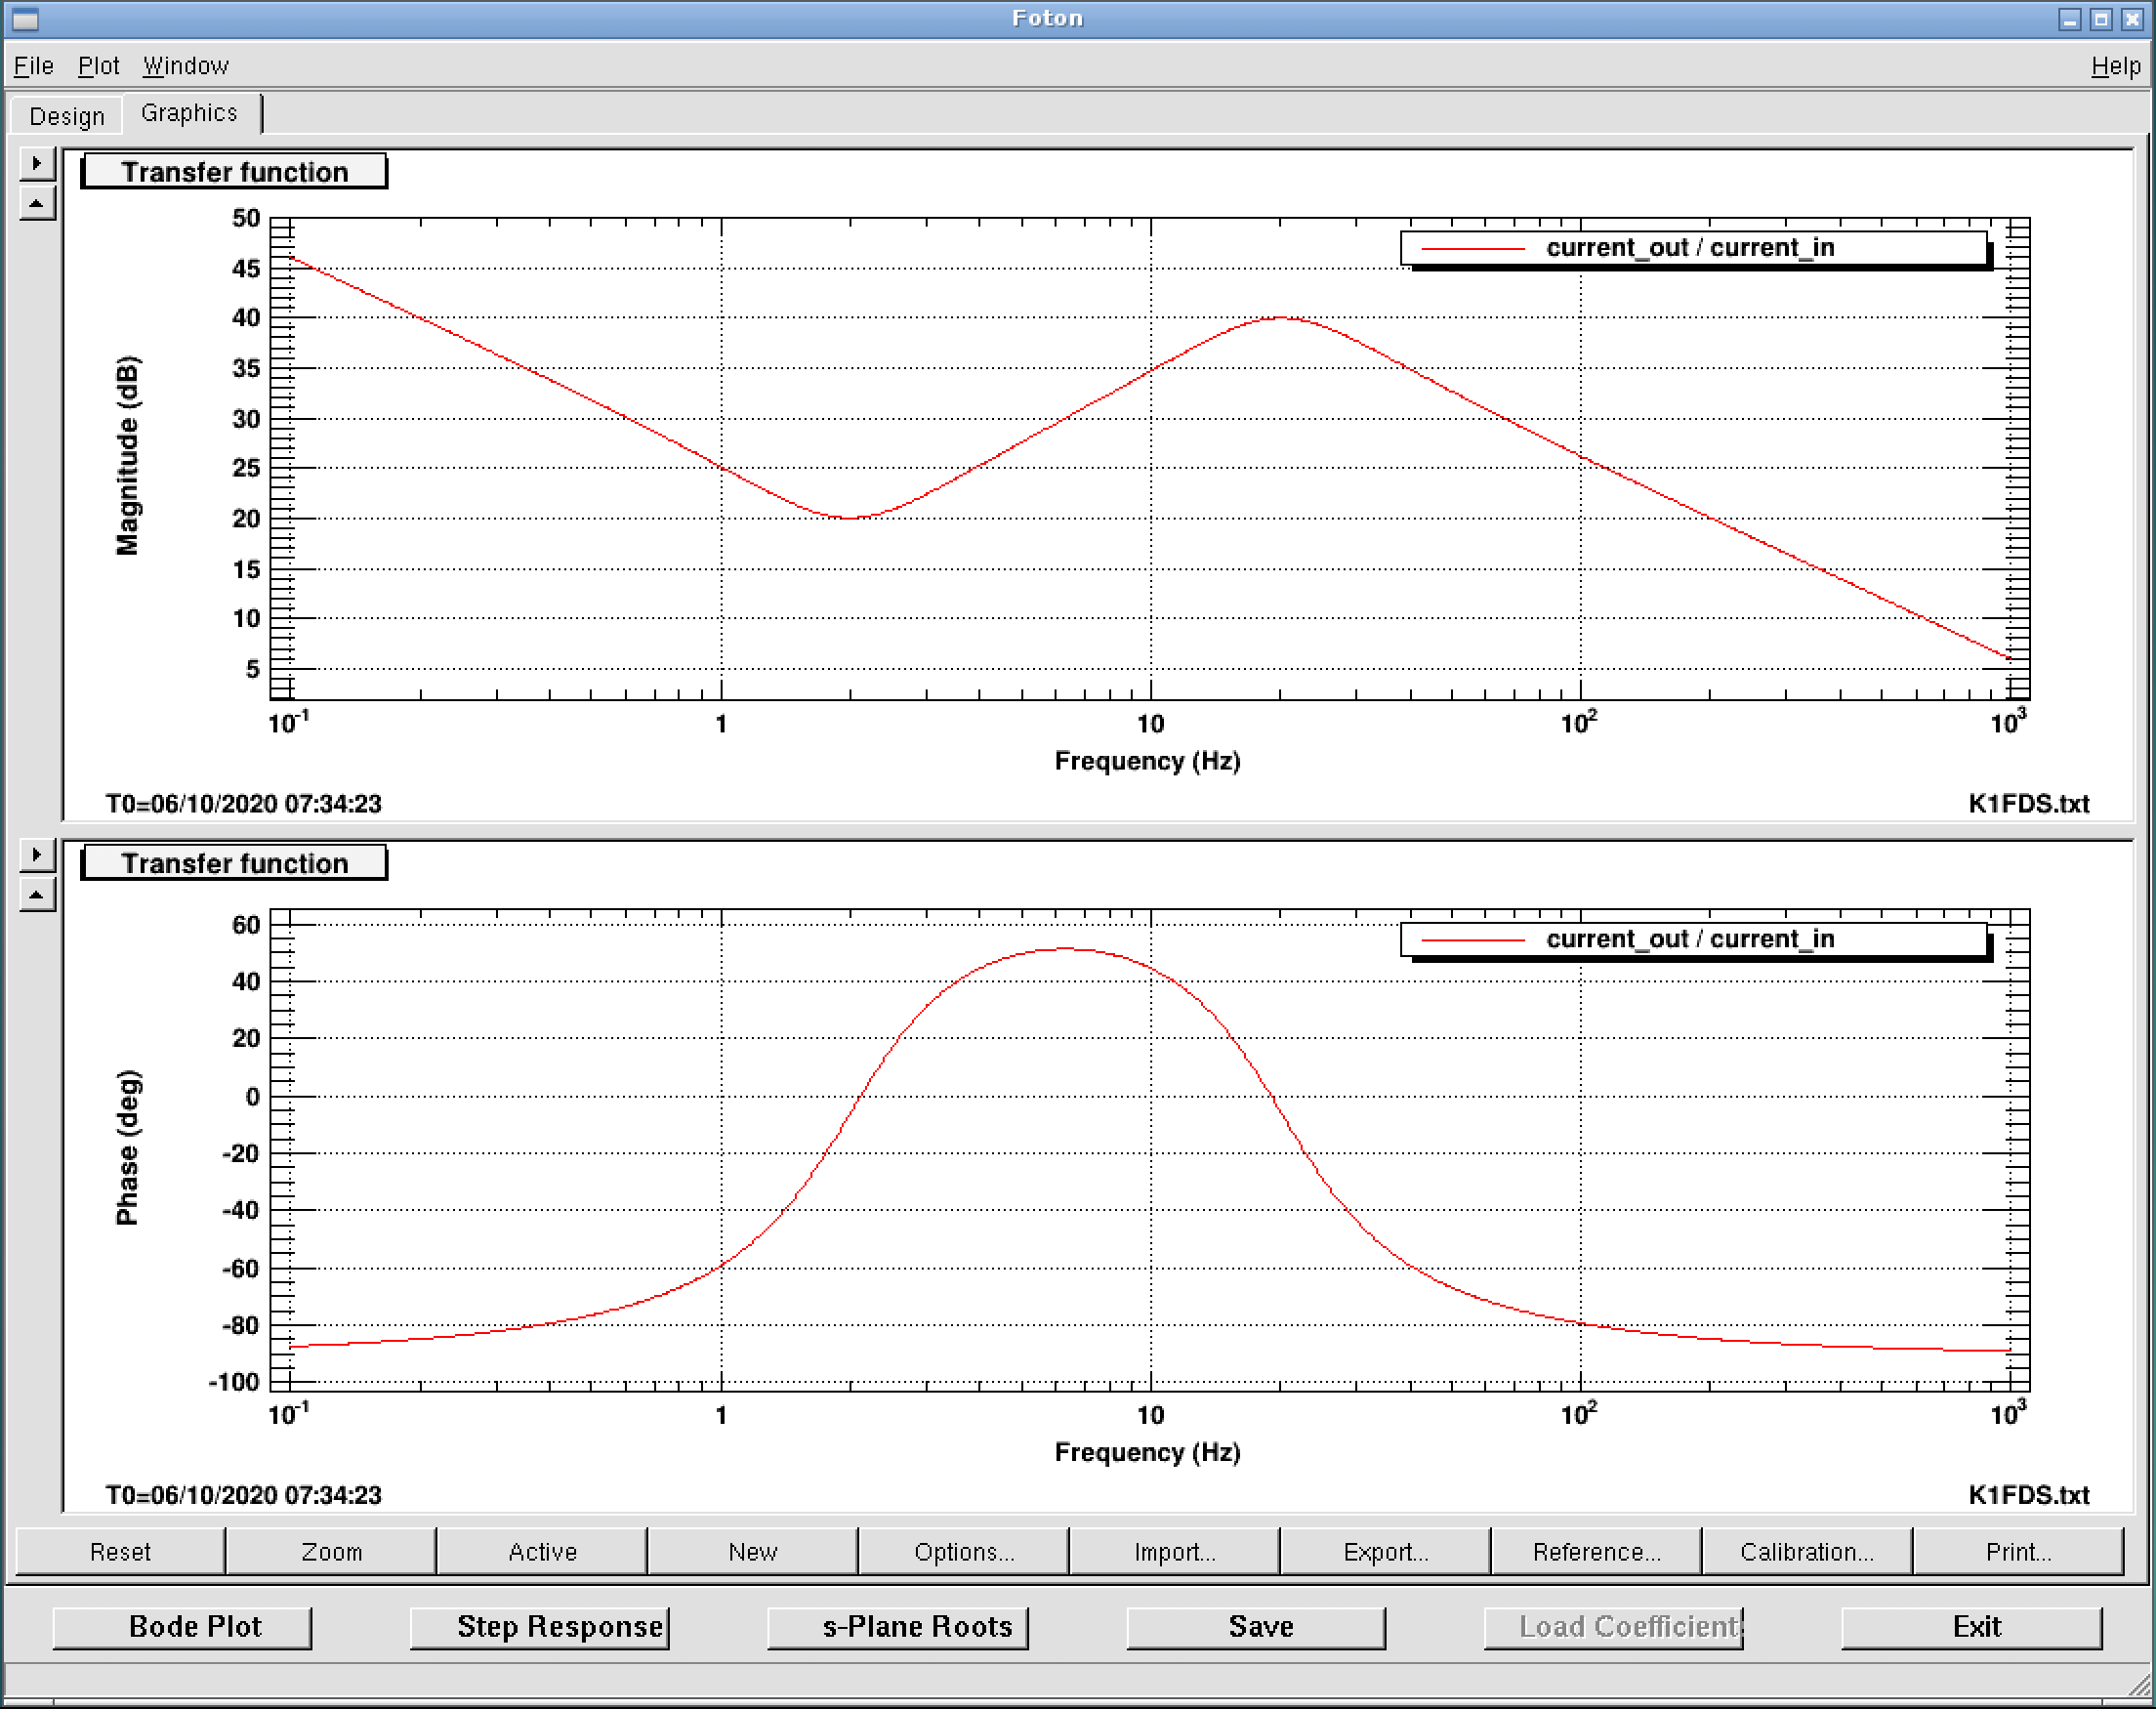
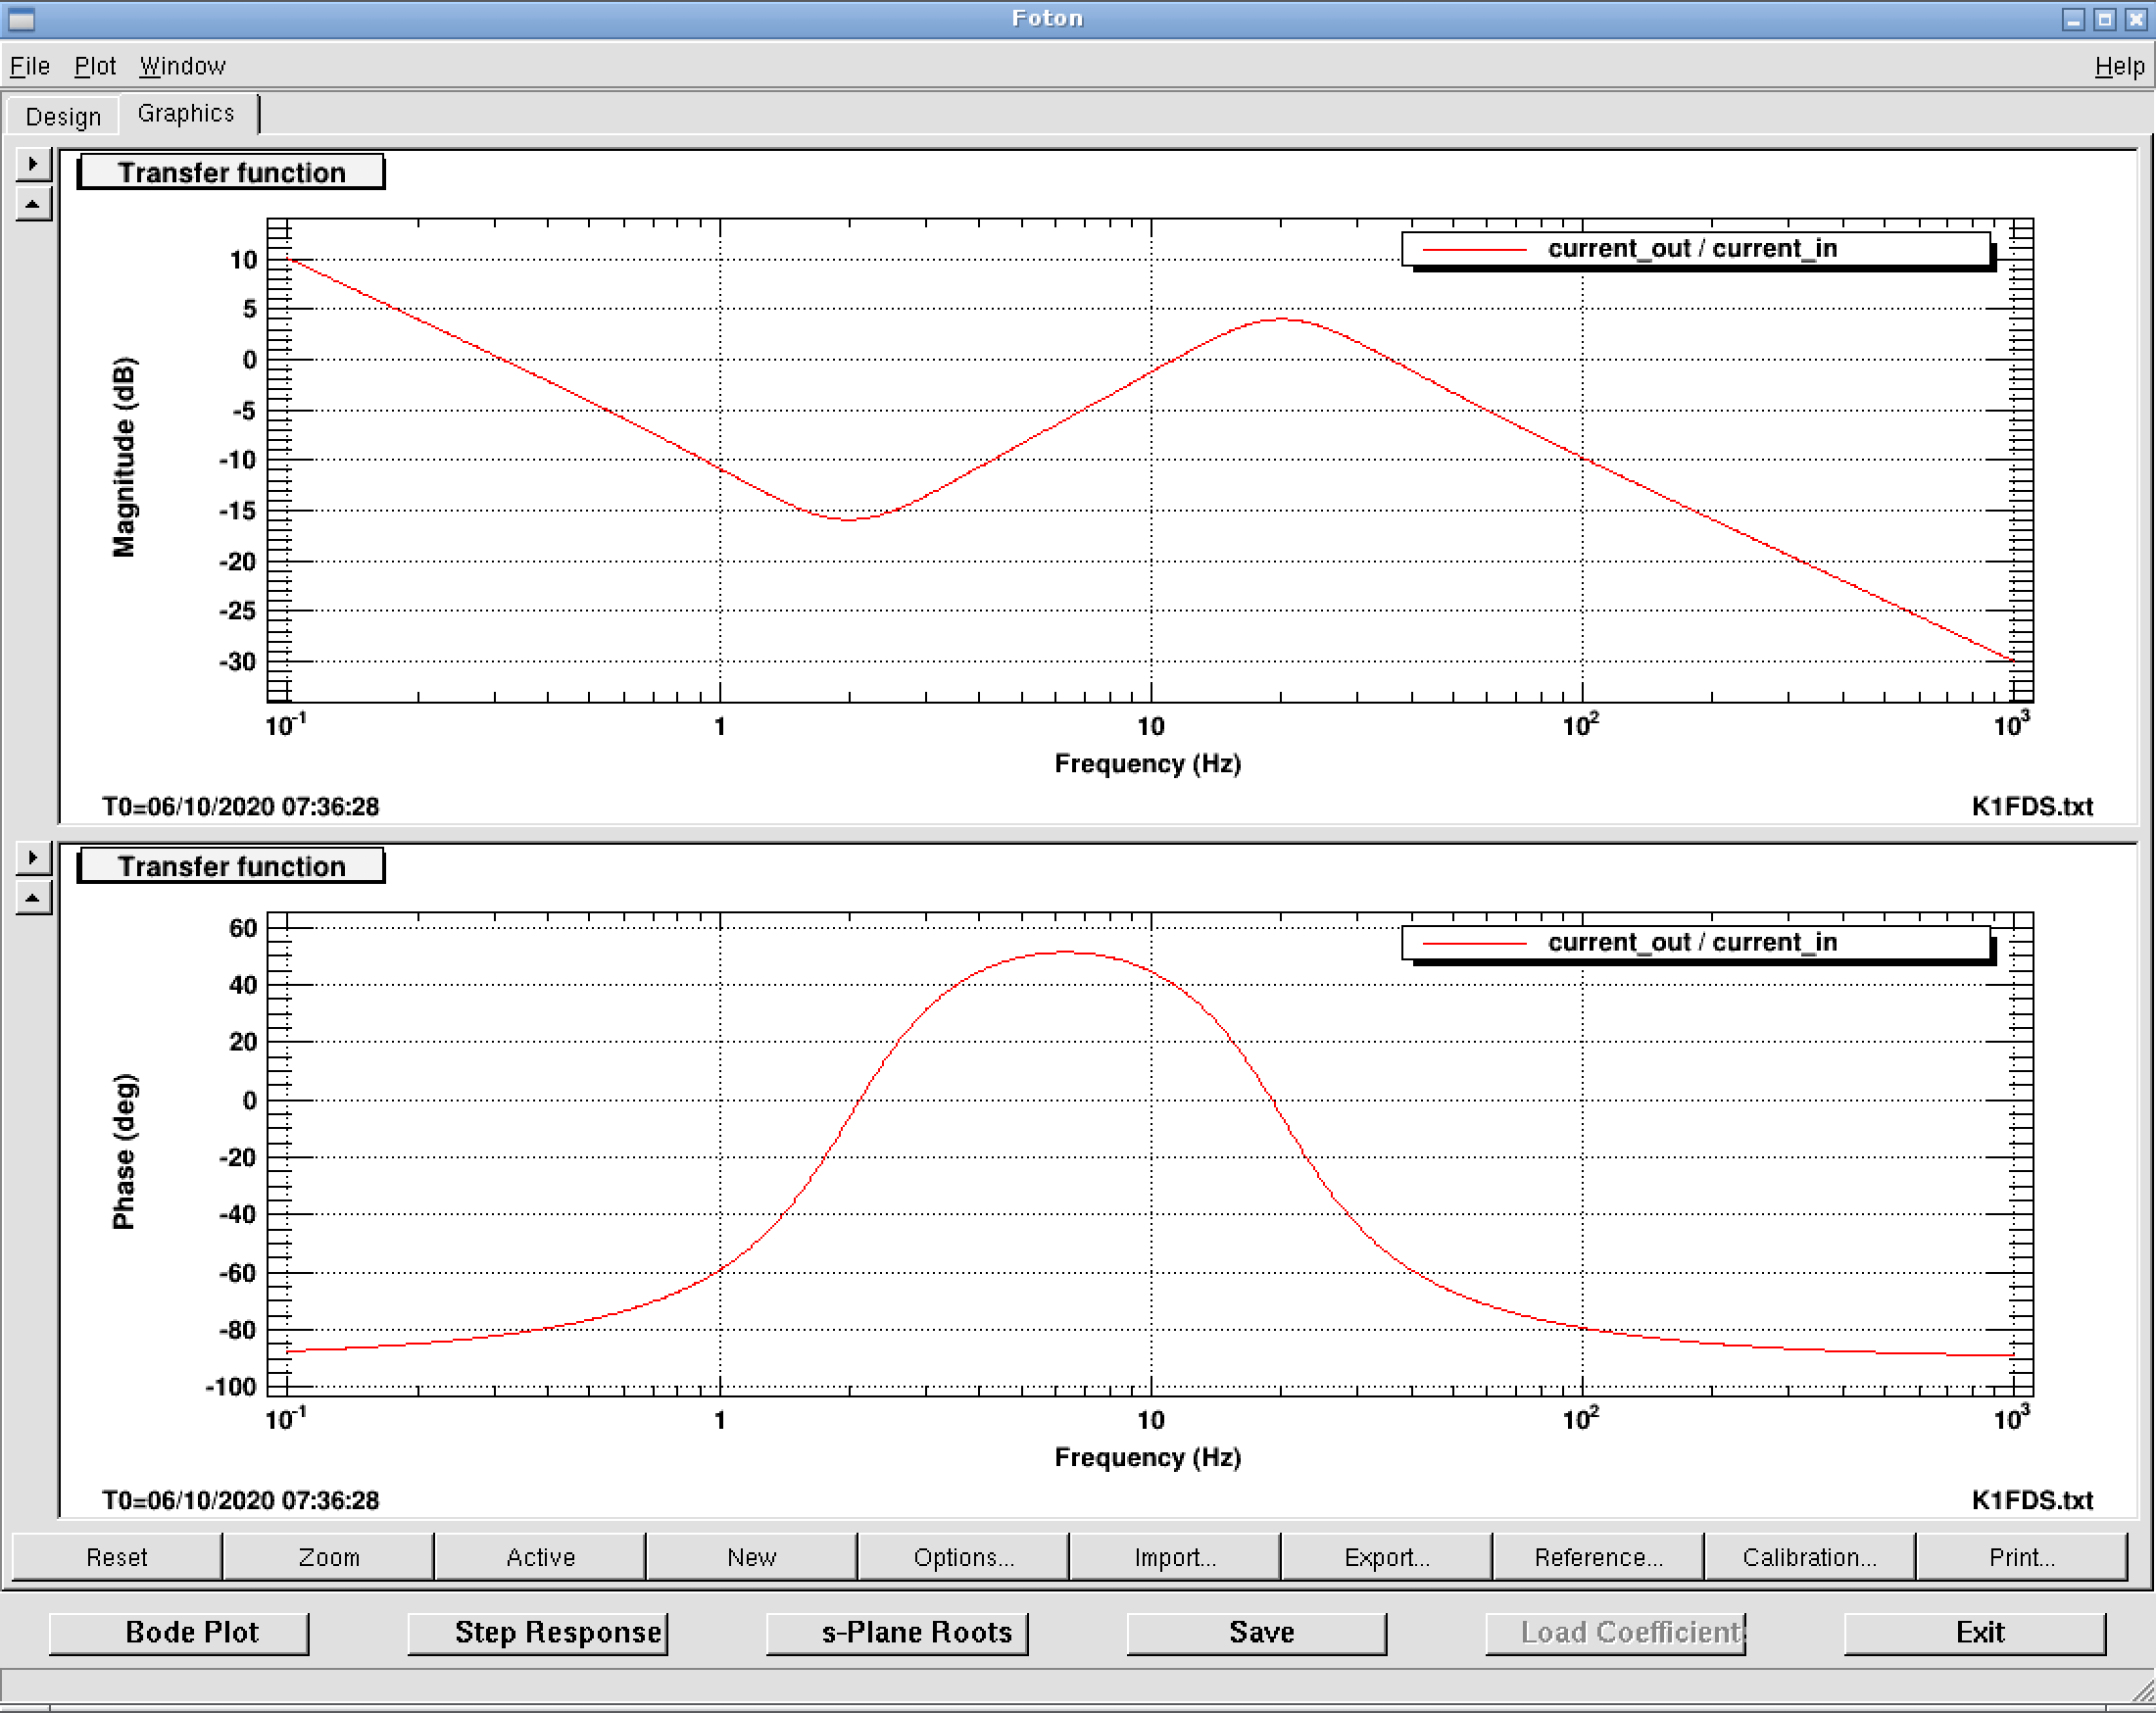
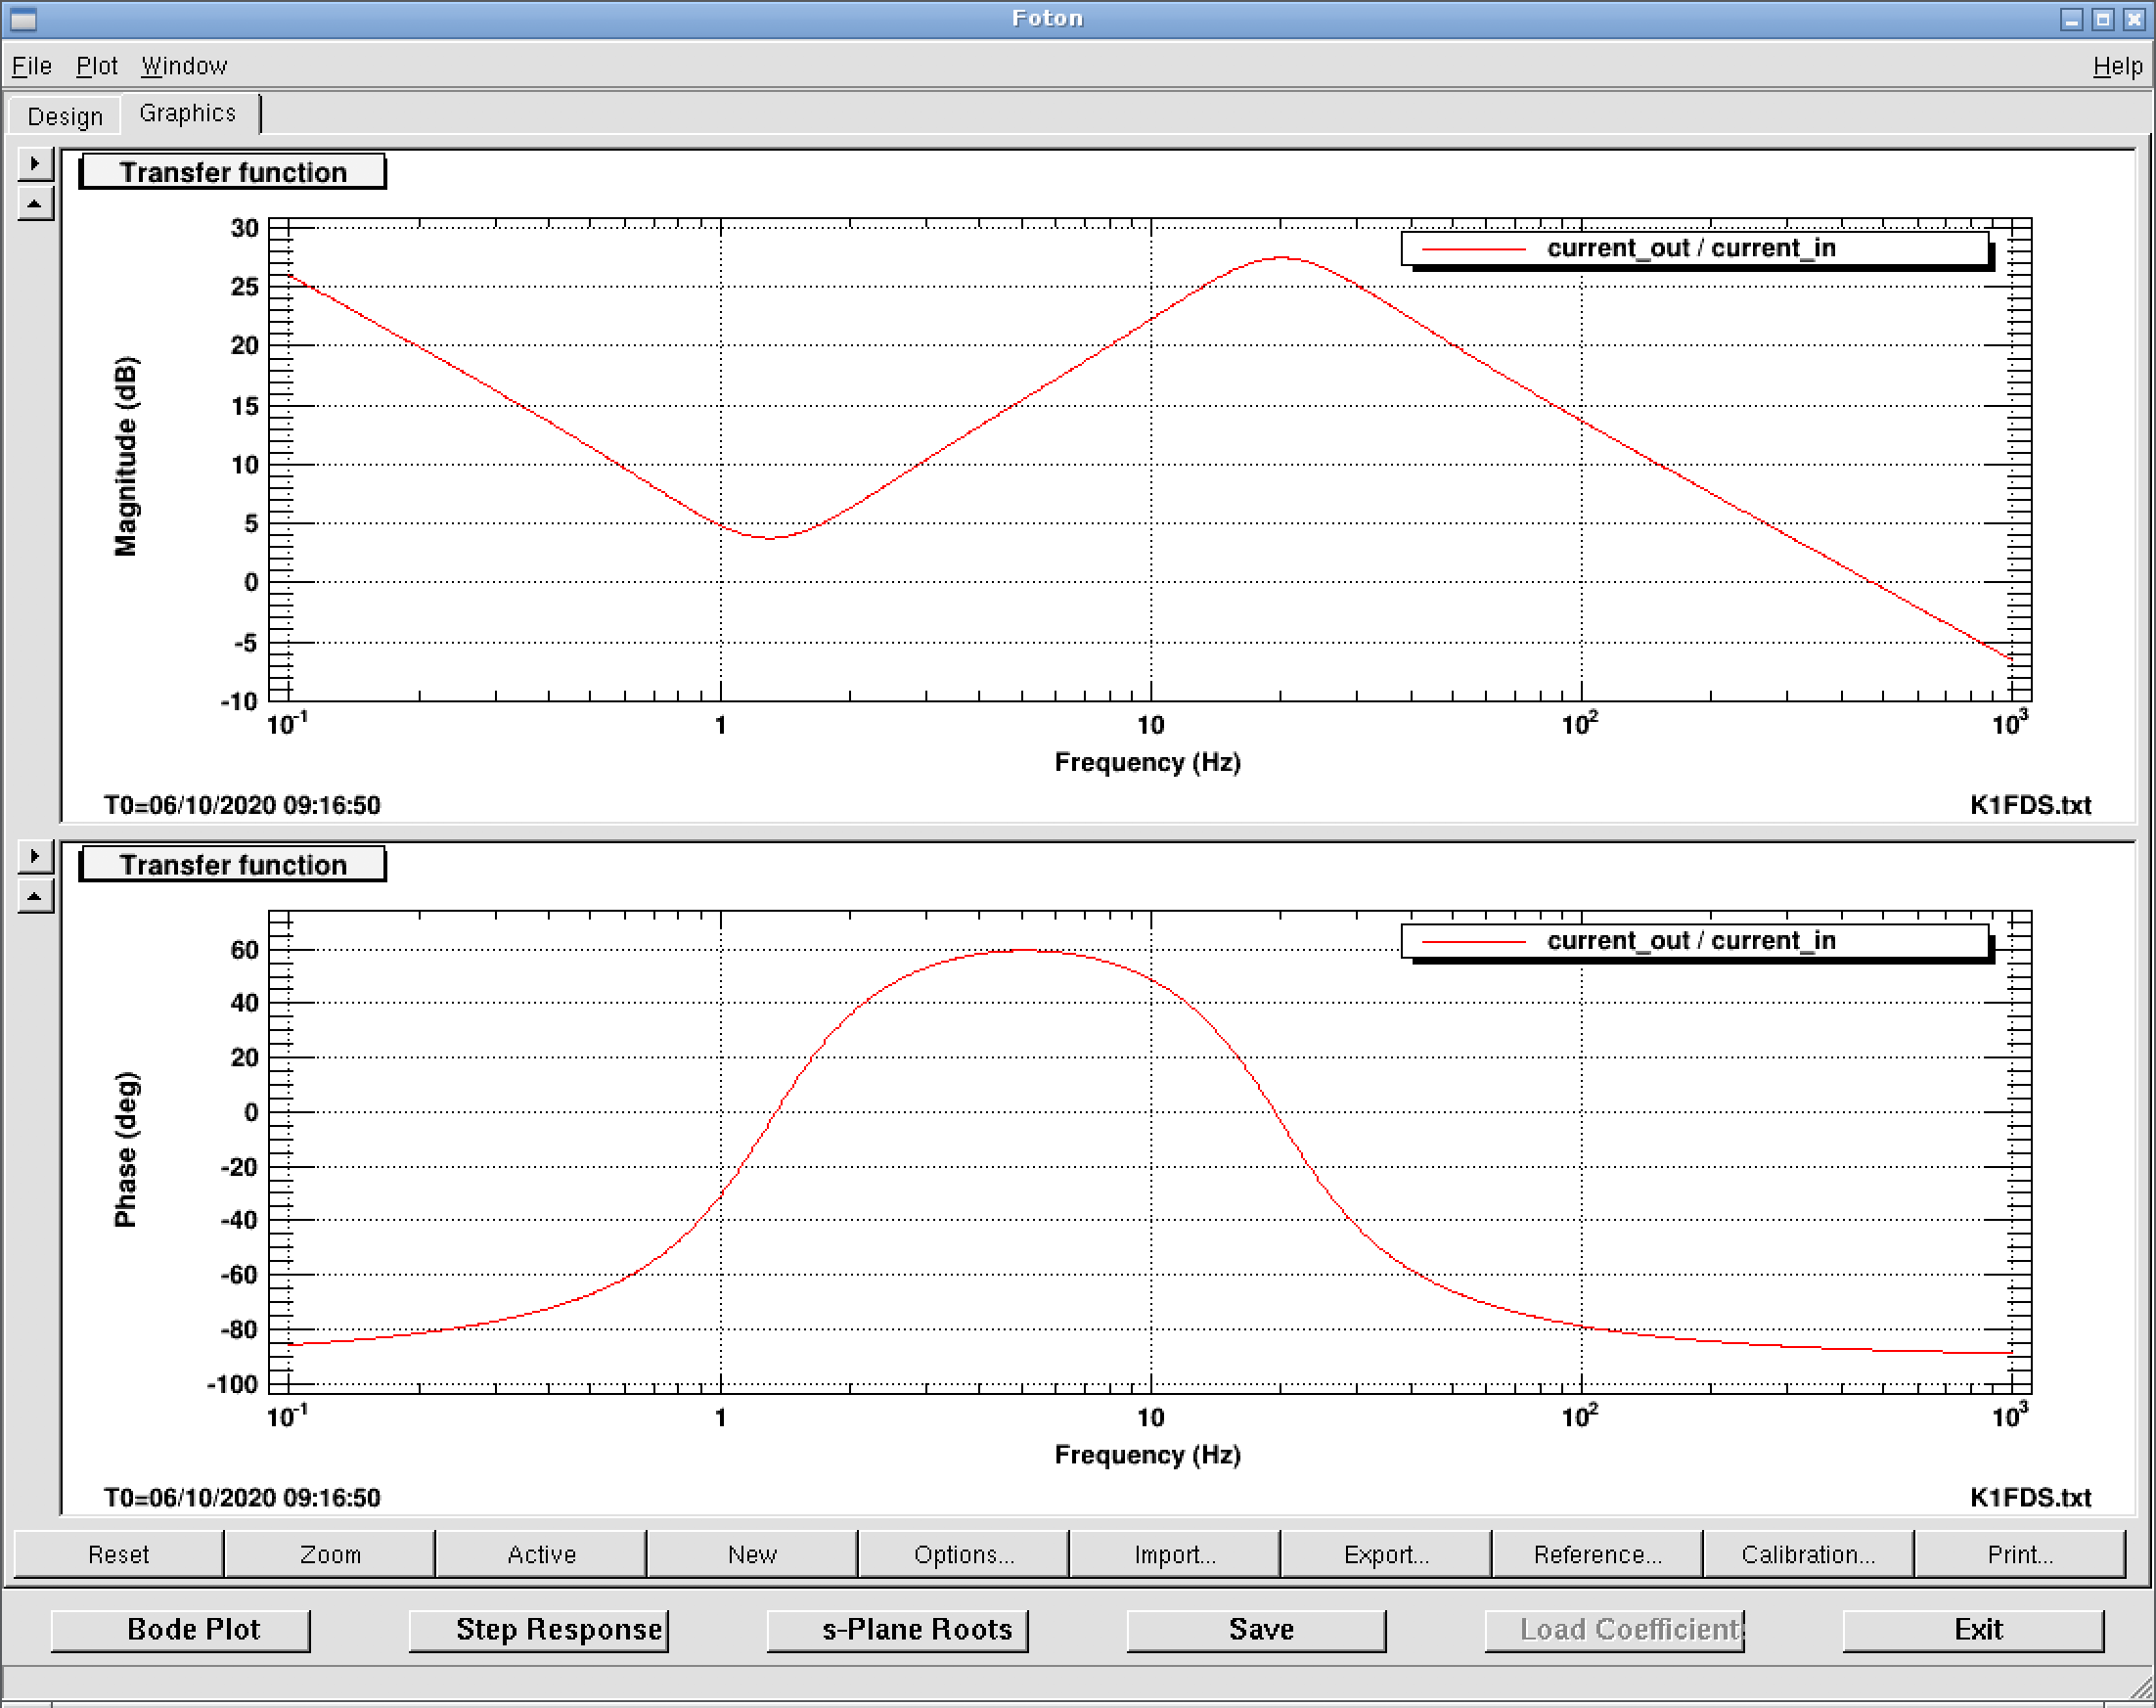
Corresponding filters are shown in attached figure 1 to 4. |
||
Corresponding filters transfer functions are shown in the attached figures 1-4 (order: end_pit, end_yaw, input_pit, input_yaw).
With this loop, I also measured open-loop transfer functions. They are shown in attached figure 5-8 (order: end_pit, end_yaw, input_pit, input_yaw). They have unity gain frequency shown in the following table.
|
END_pit |
0.64Hz |
|
END_yaw |
6.98Hz |
|
INPUT_pit |
0.17Hz |
|
INPUT_yaw |
0.43Hz |
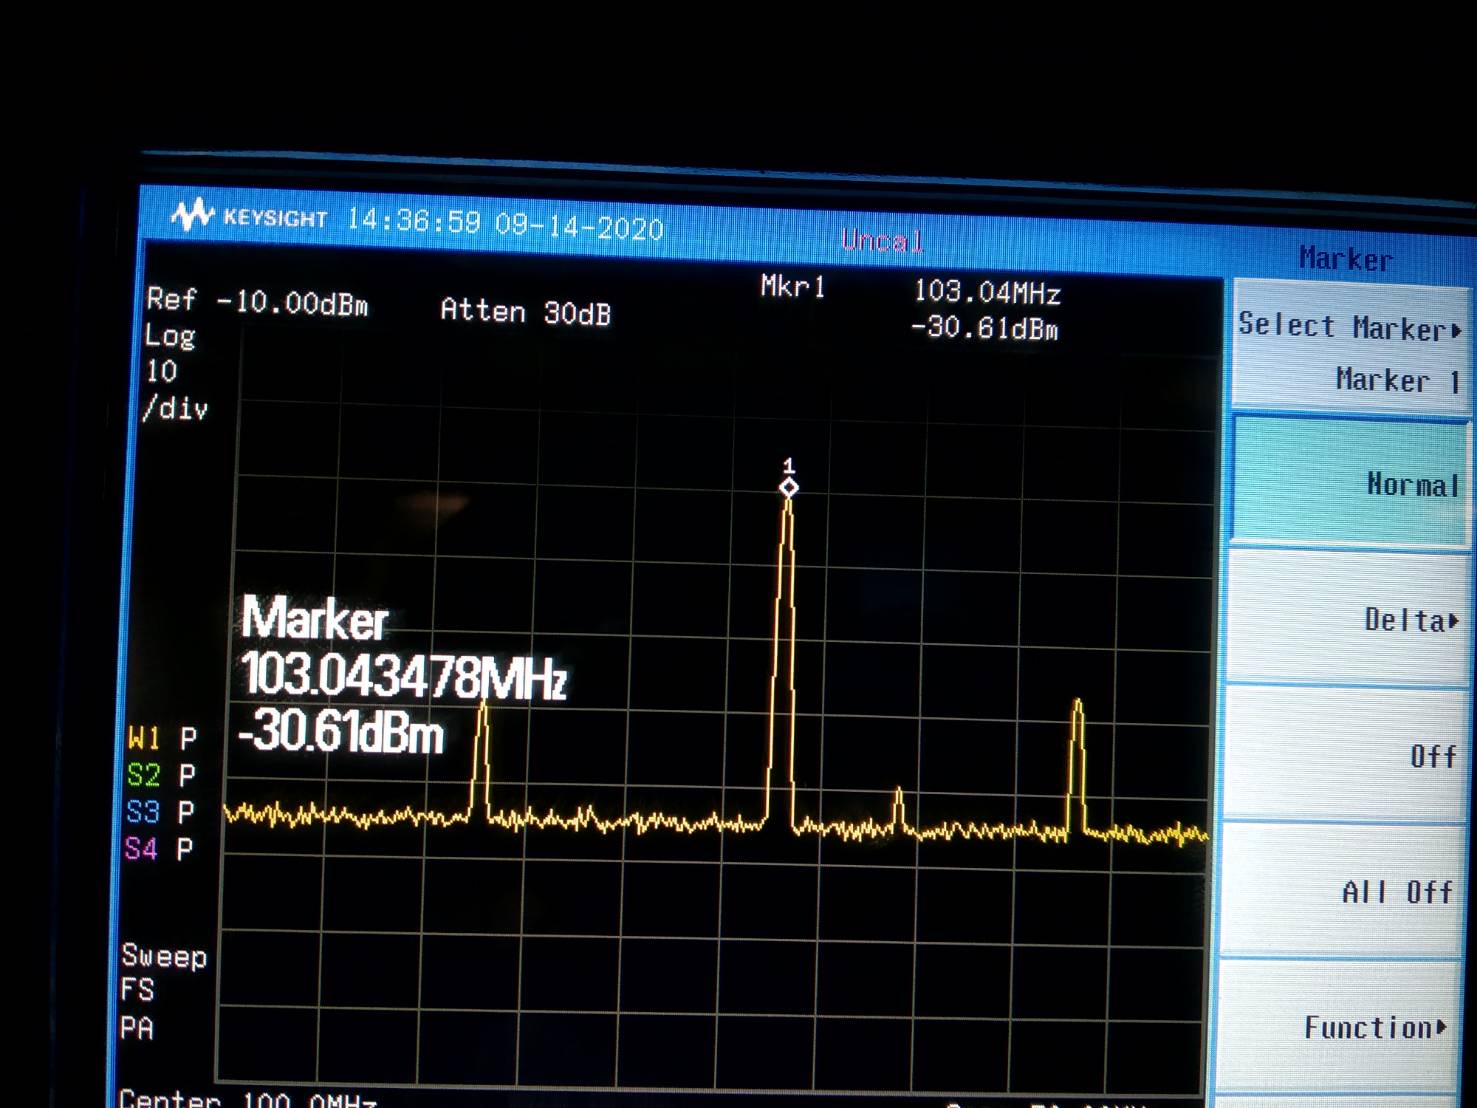
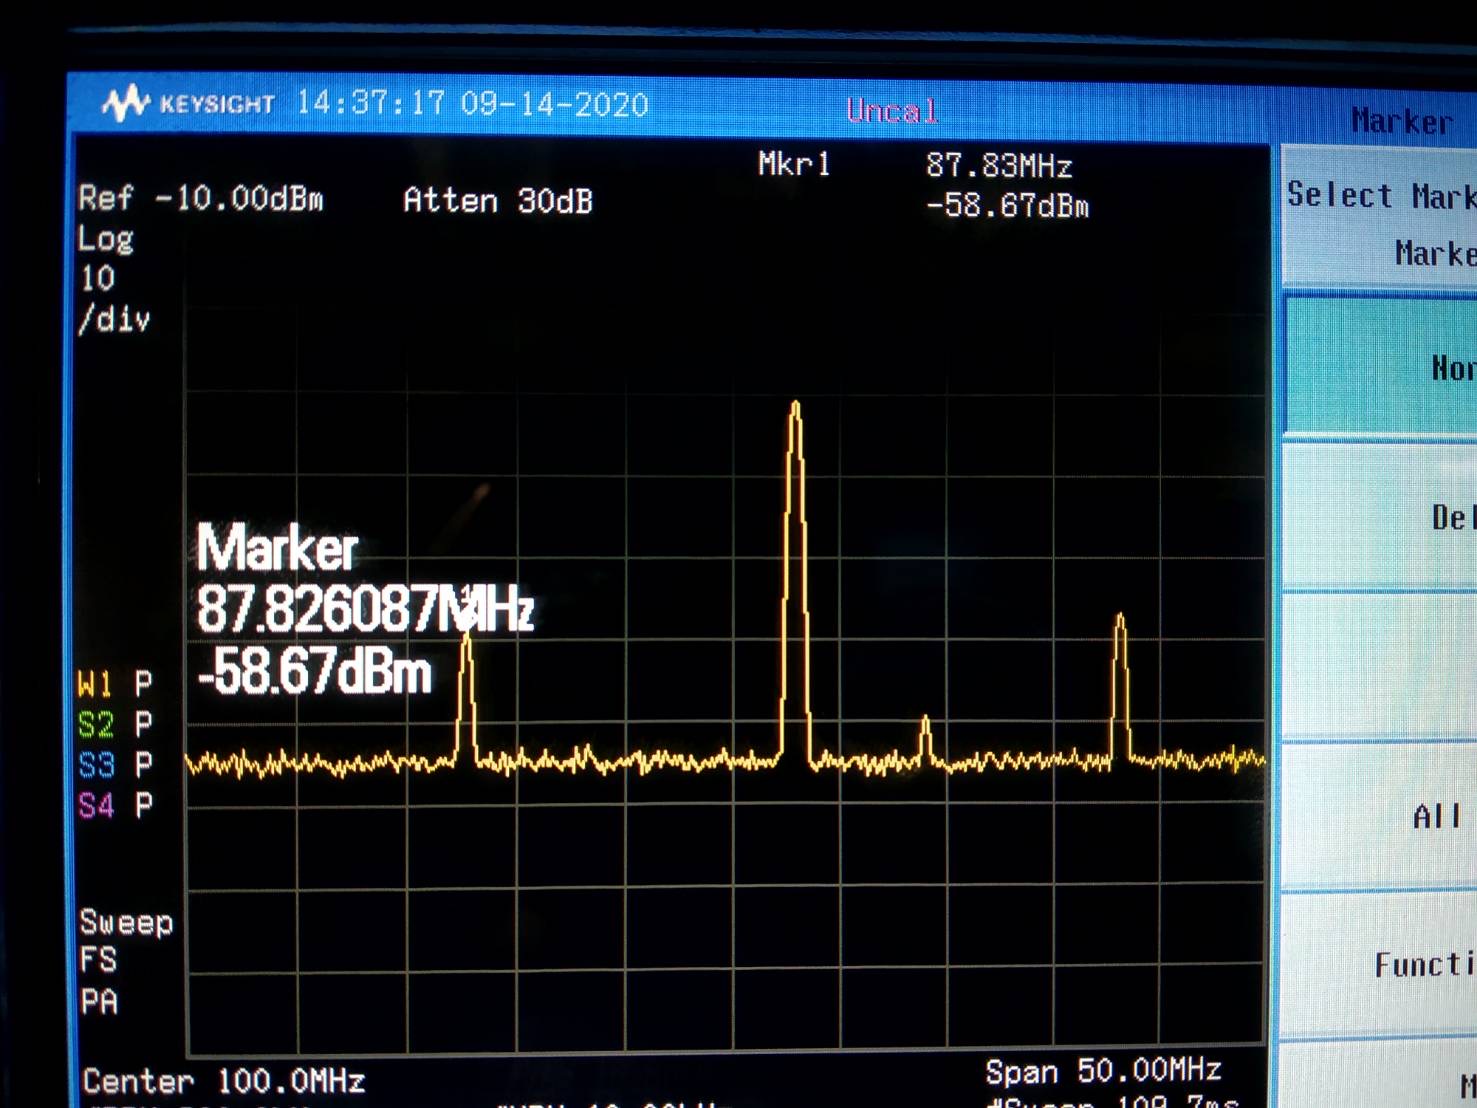
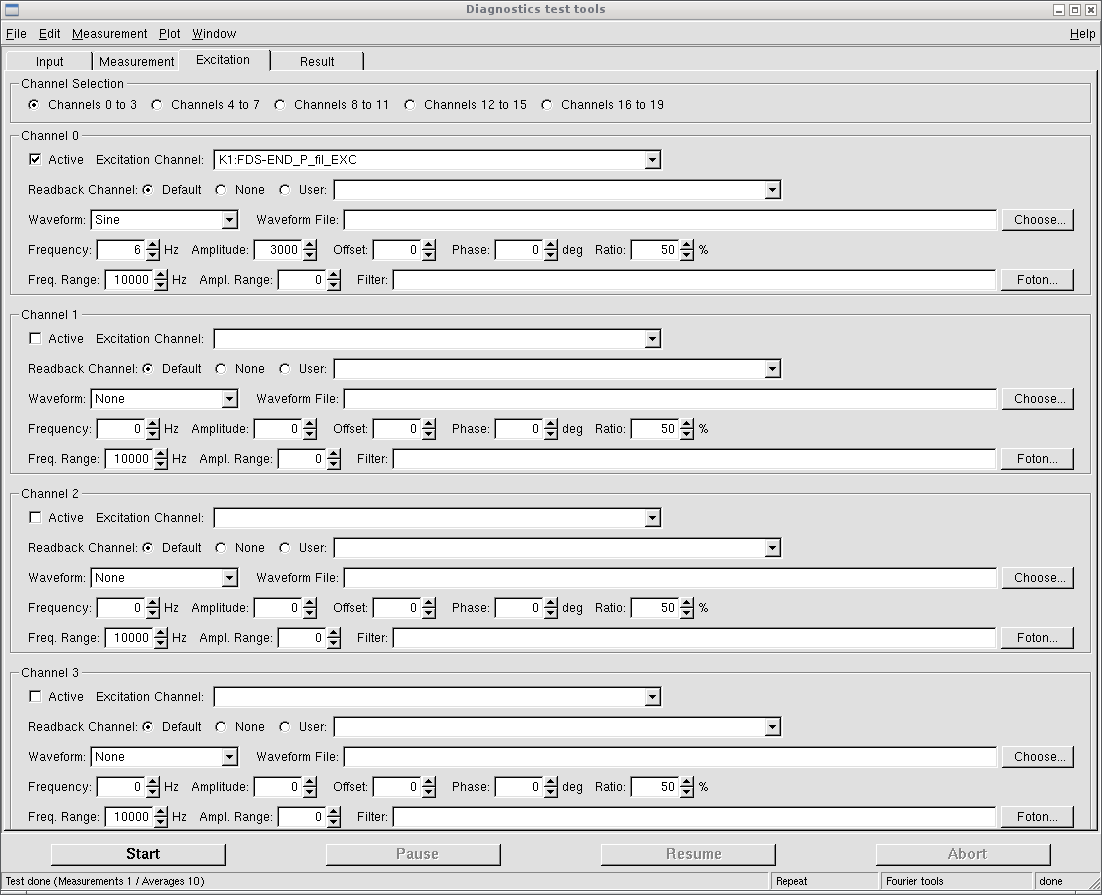
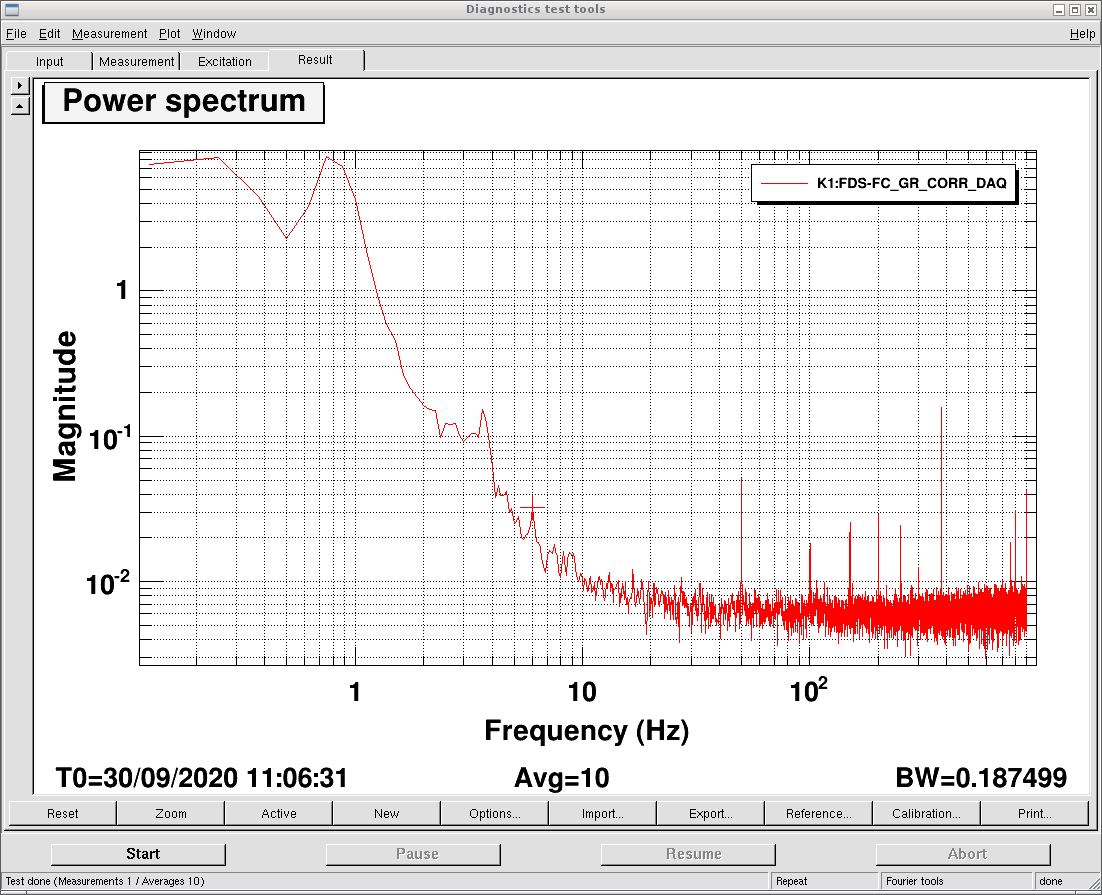
By looking at the spectrum of filter cavity lock correction signal, at the same time, driving pitch/yaw of INPUT/END mirror, the coupling to length could be seen as a peak. By adjusting driving matrix, this coupling could be minimized. This was done for INPUT y/p and END y/p. For each DOF of cavity, the excitation was examined with different driving matrix.
The excitation and spectrum of one test is shown in attached figure 1 and 2. By testing many different driving matrix, I did following modification to reduce coupling to length.
INPUT mirror H4: change from -1 to -0.5
END mirror H1: change from 1 to 0.7
This modification may help to solve the problem of worse locking accuracy caused by AA loop, as reported in elog2227.
Aritomi and Yuhang
The AA loop helps to stabilize both GR and IR beam alignment (elog 2226), but is currently introducing length fluctuation which results in a worse locking accuracy (elog 2227).
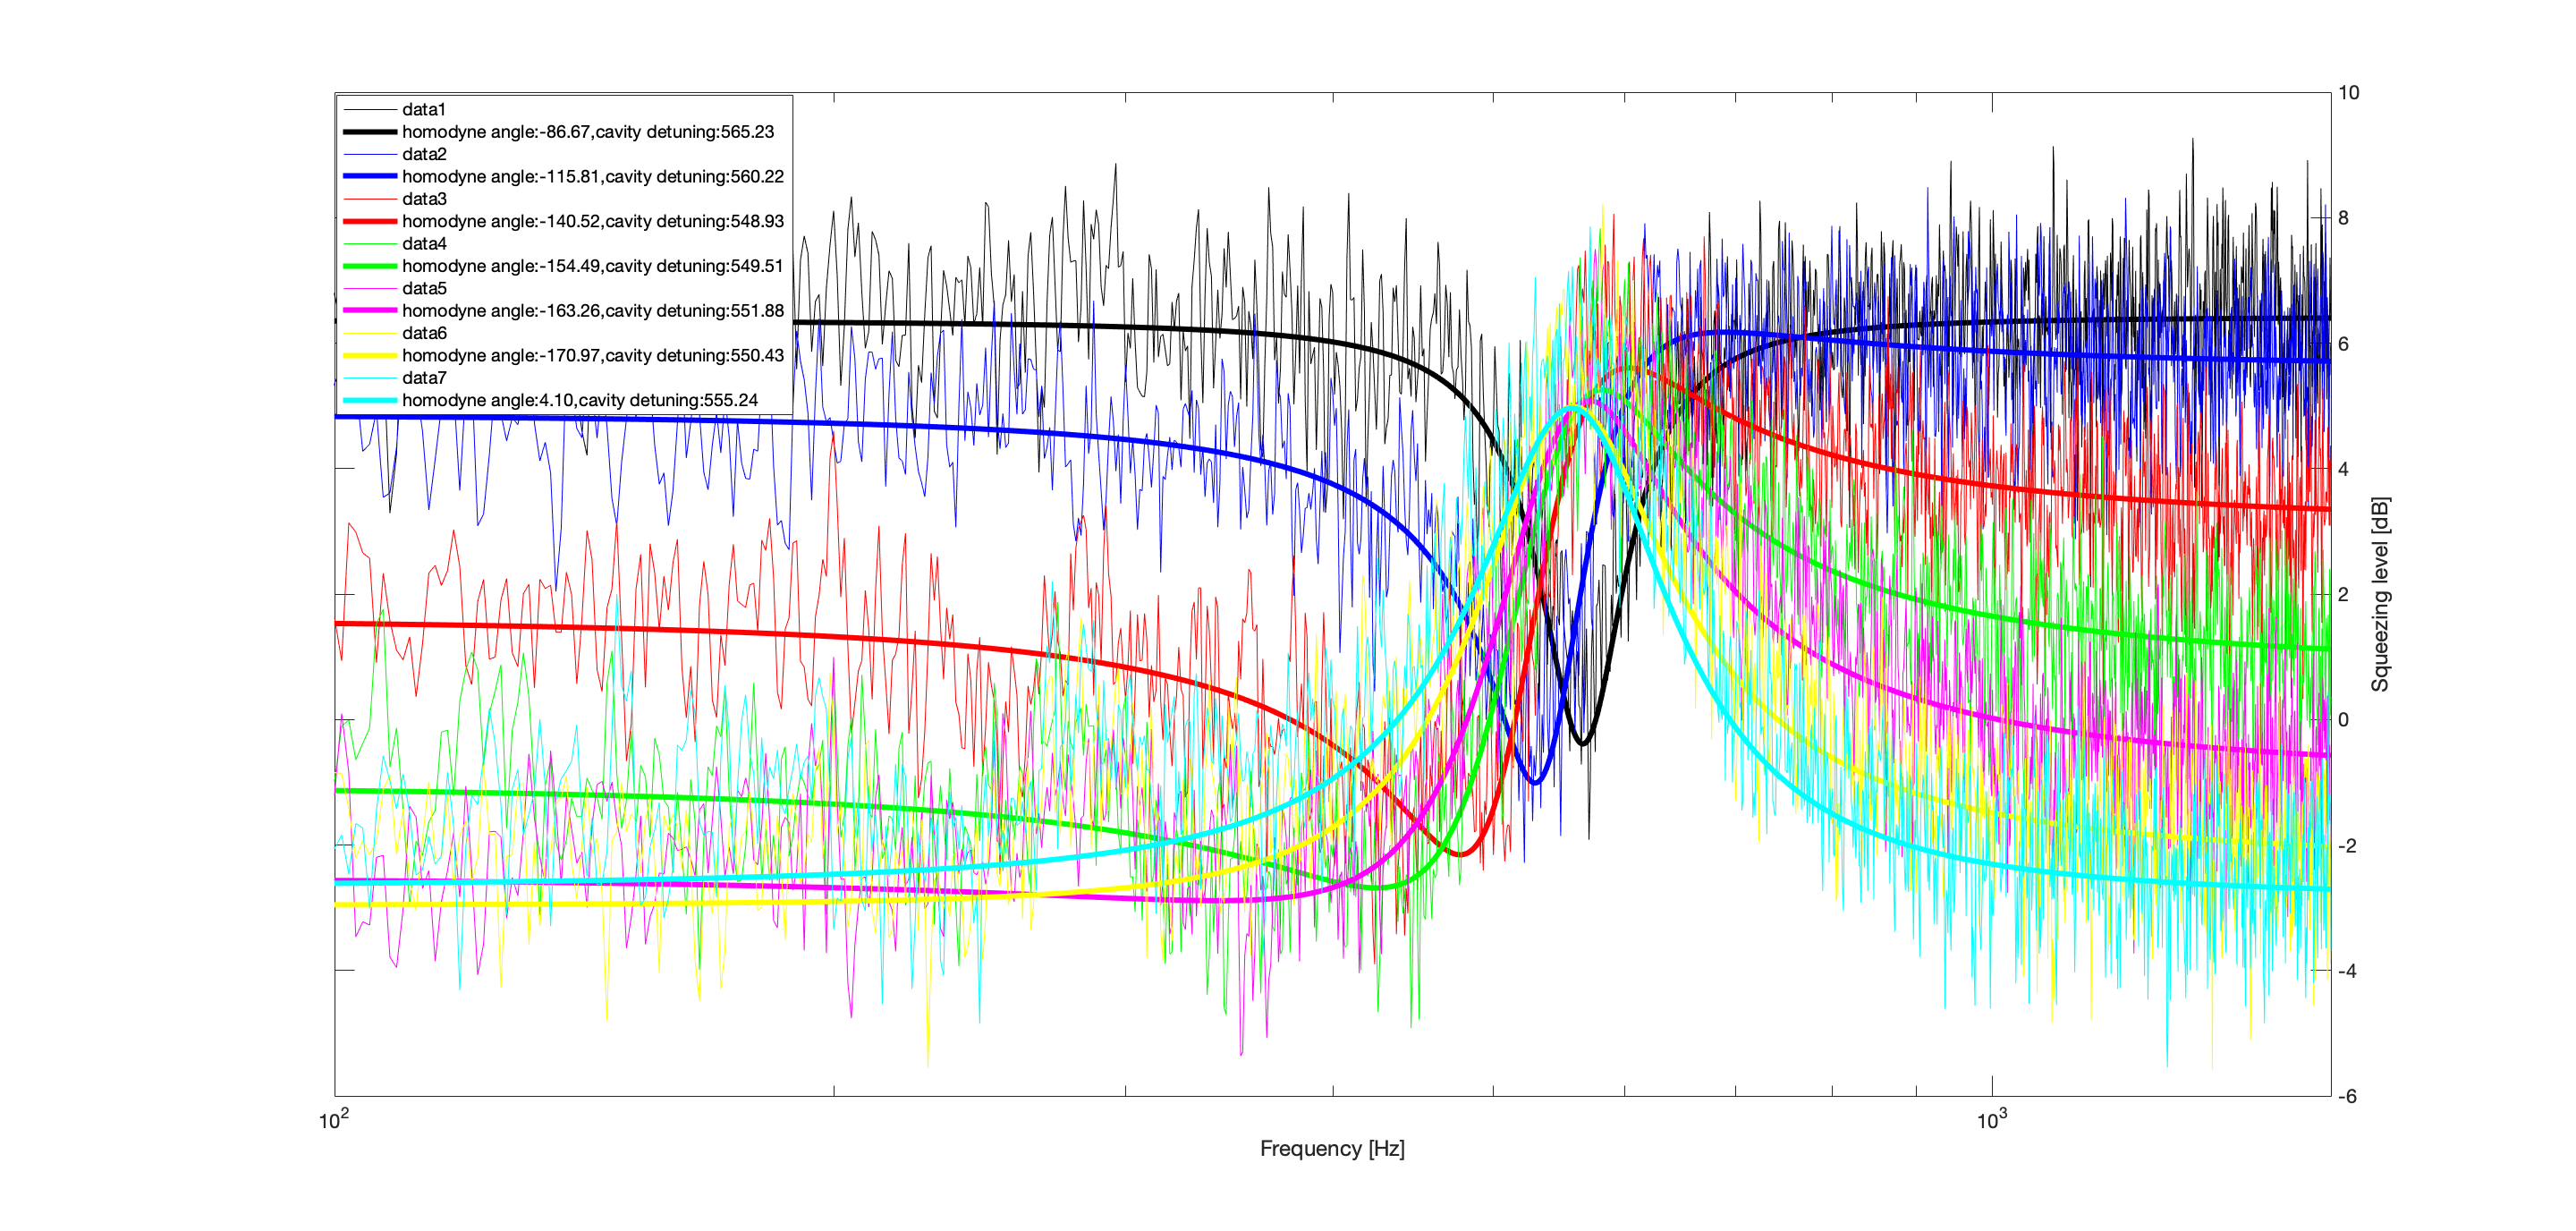
With AA loop closed, FDS is measured with detuning of ~550Hz to check if detuning is also stable for FDS measurement. (the whole set-up is the same with the one we used in this Feb)
All the measurement was done in a time scale of 20 minutes. The result is shown in the attached figure.
1. The fit result of detuning is changing within 12Hz.
2. The maximum measured squeezing is about 2.5dB.
3. FC could change anti-squeezing(~7dB) into squeezing(~1dB).
[Aritomi, Yuhang]
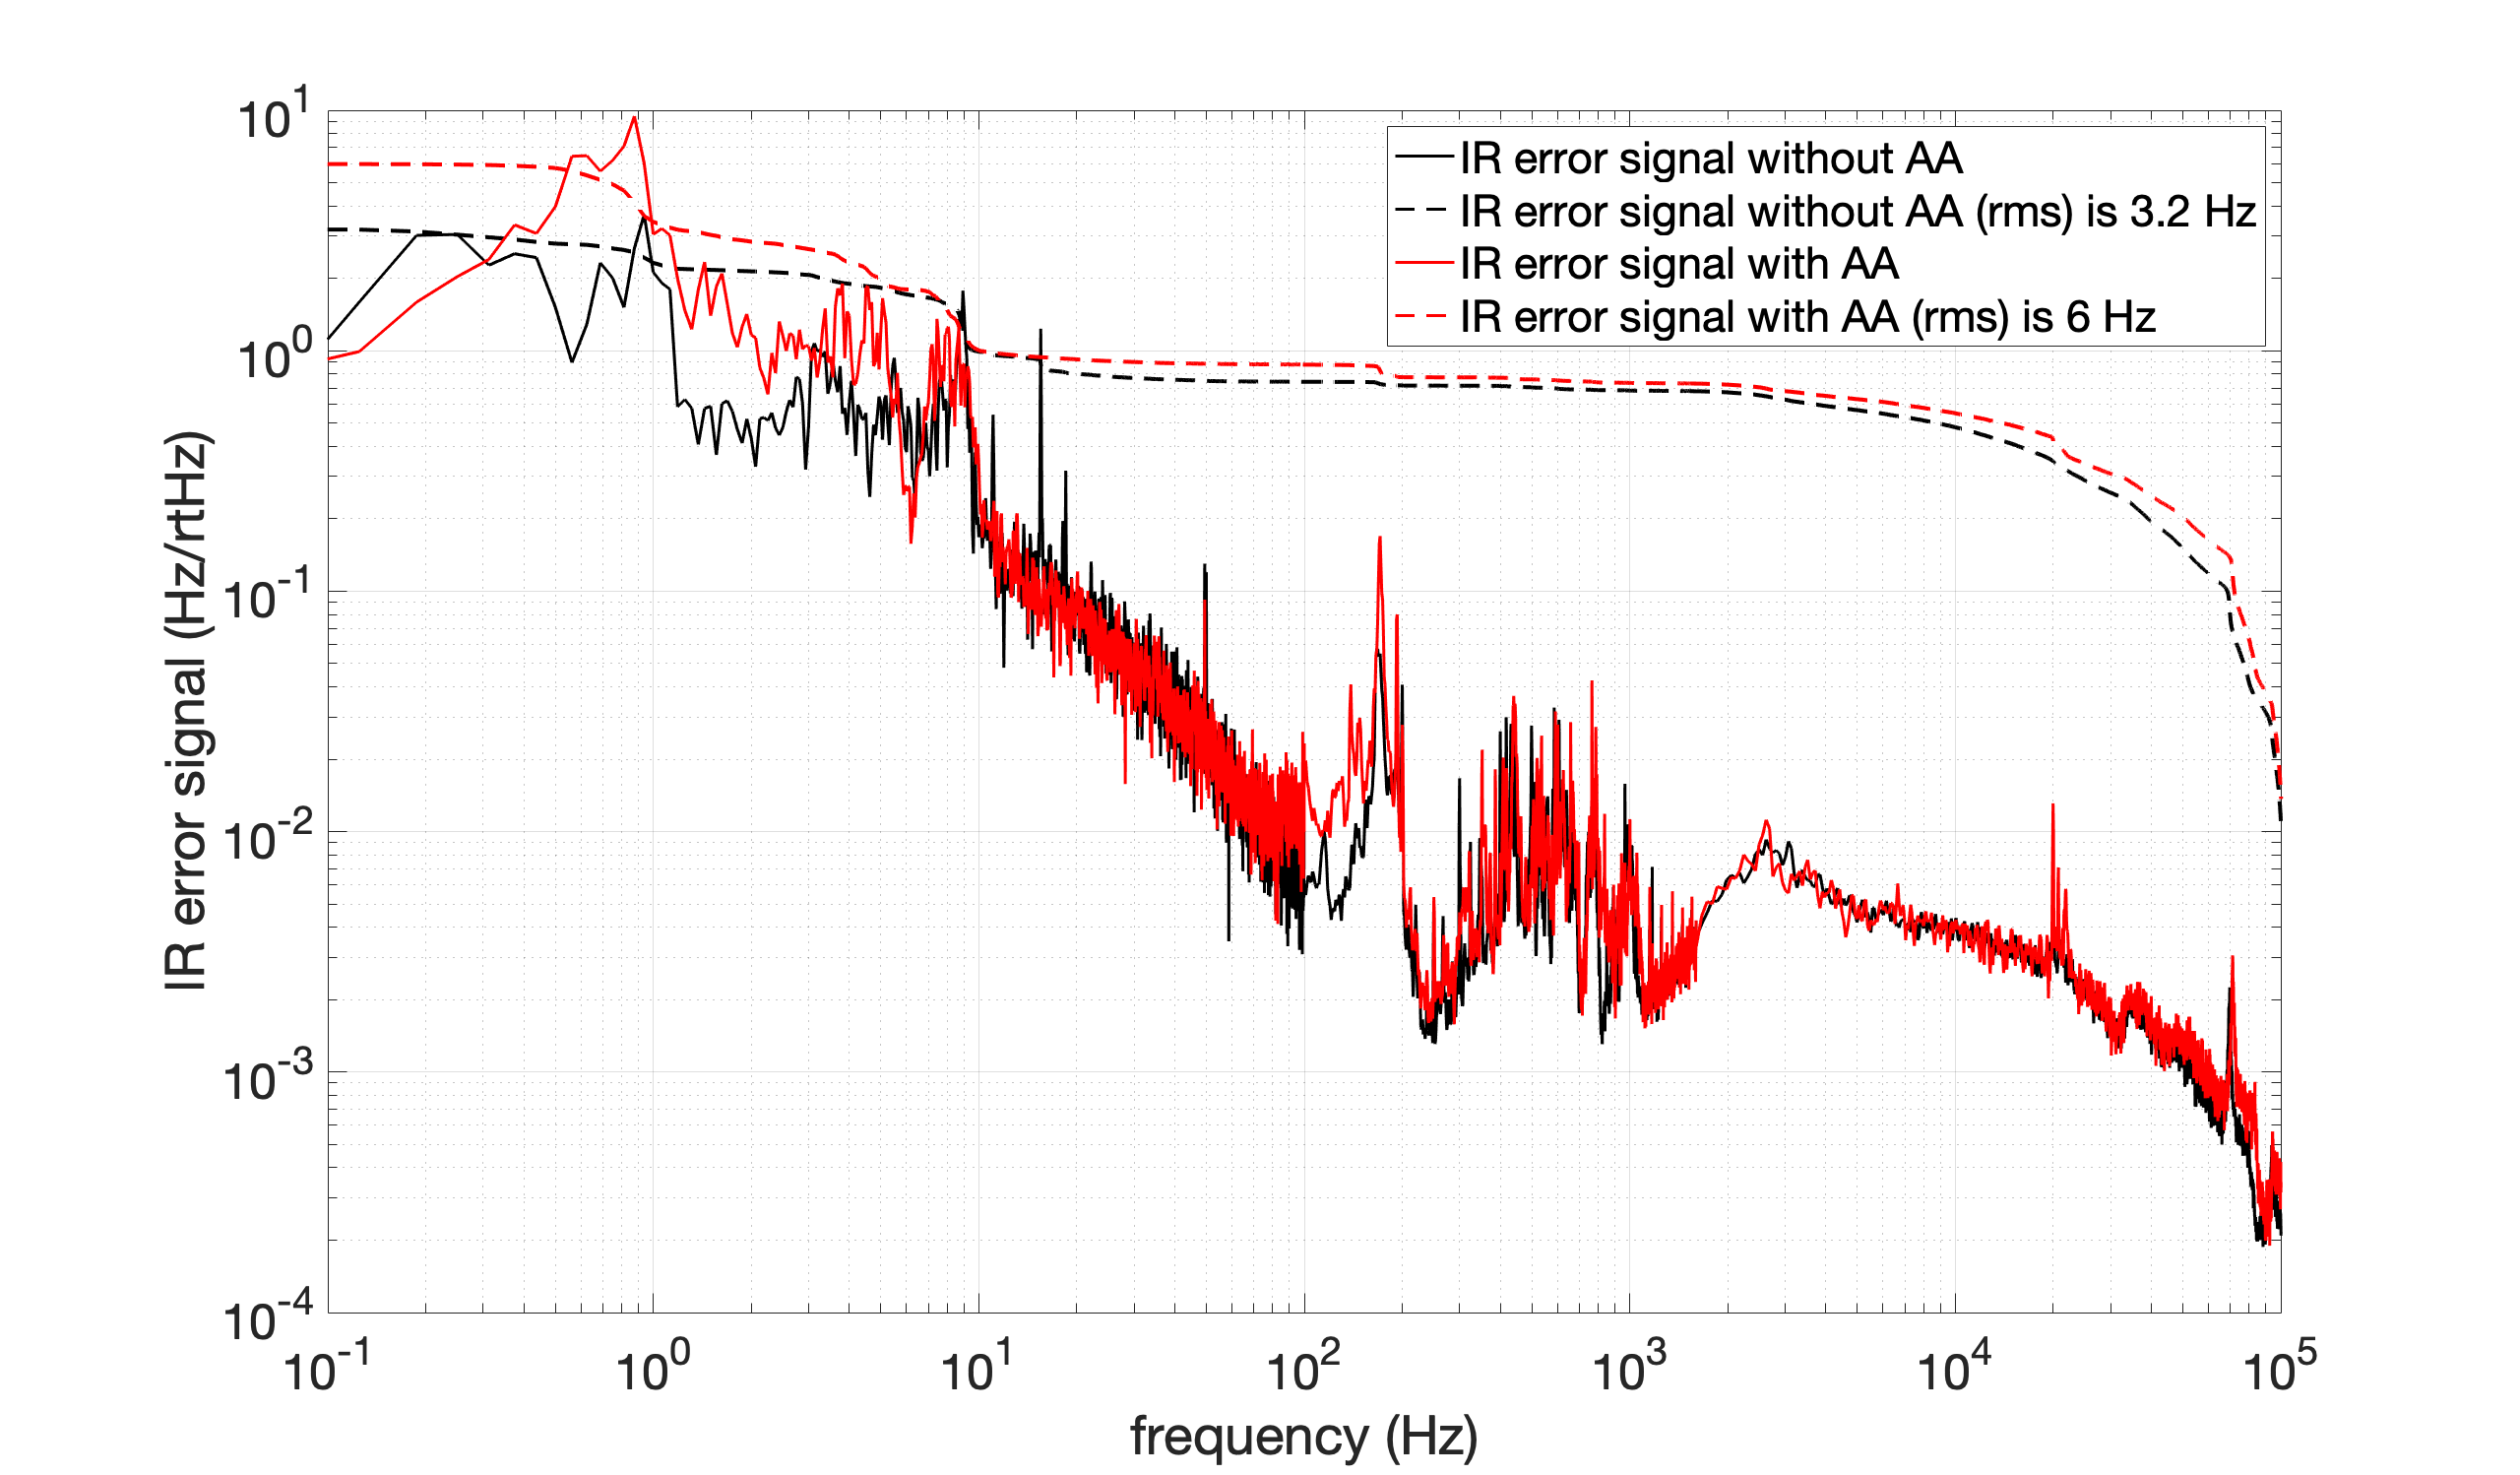
We measured IR locking accuracy with/without AA (attached picture). IR lock accuracy with AA is 6 Hz and it is larger below 10Hz compared with no AA. Since the control bandwidth of AA is below 1Hz, mirror resonance above 1Hz is not damped with AA.
Eleonora (remote) and Yuhang
We found GR_tra becomes very stable after engaging AA/pointing/z_corr loops. Before checking FDS, the BAB was tested today. This kind of test was done long time ago (elog2049), we bascially follow the same method.
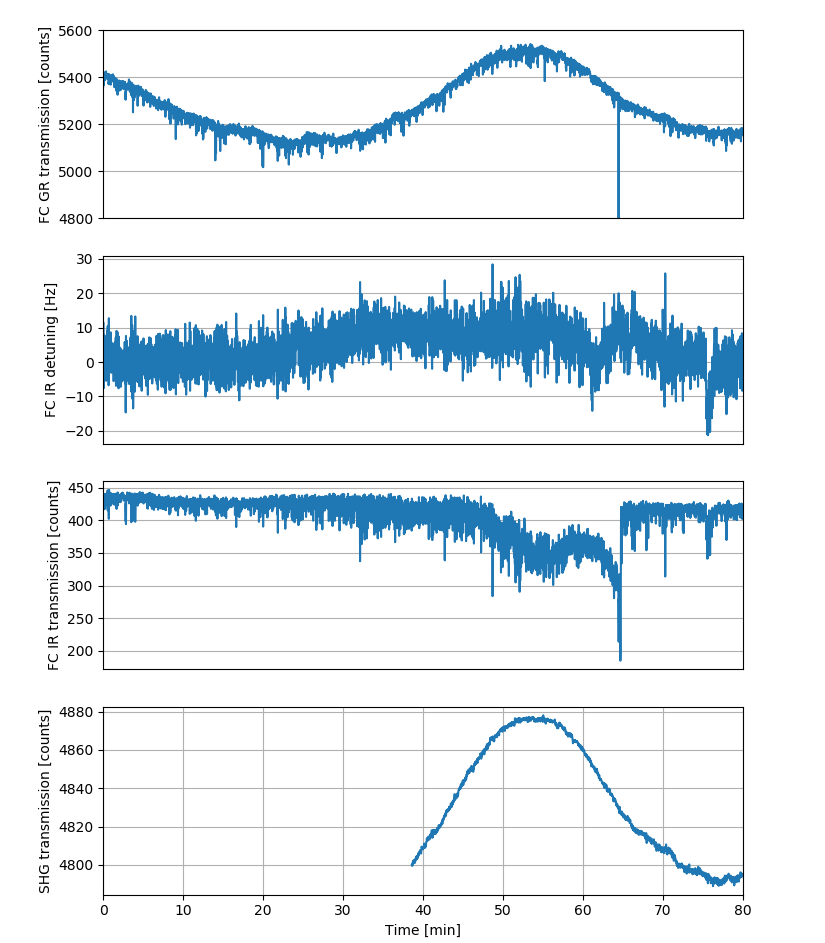
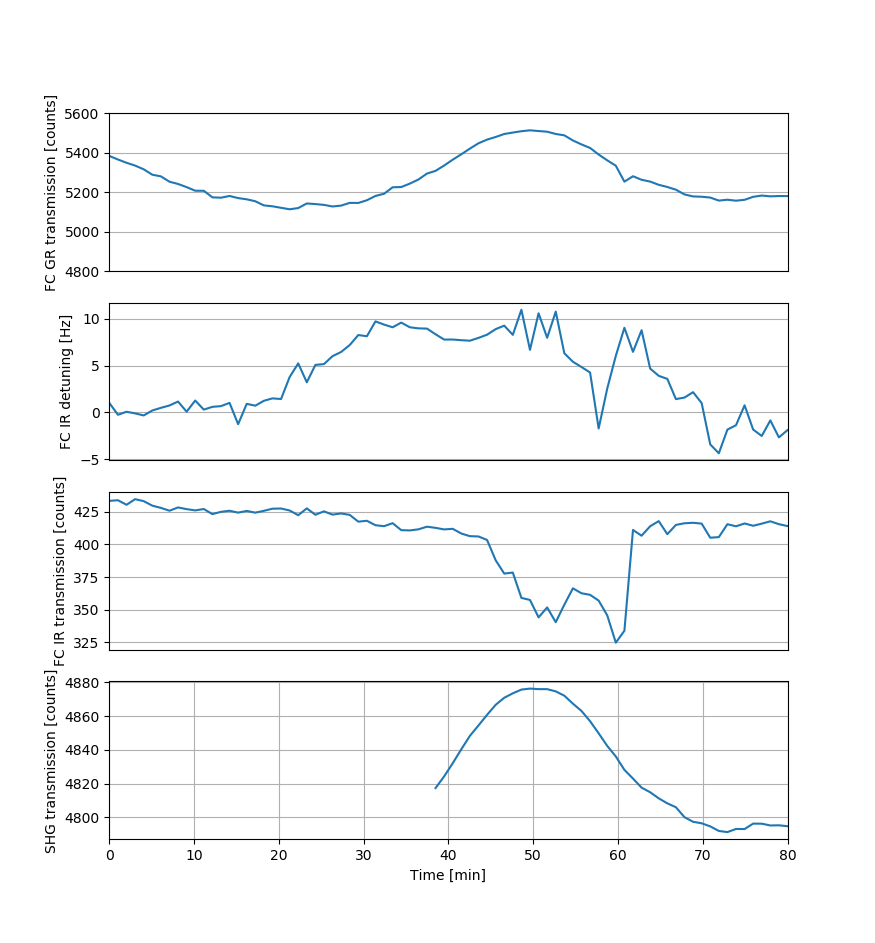
1. I put BAB on resonance. However, I notice later that PLL was unstable and unlocked at some point. Apart from that, the IR transmission and detuning was stable.
The second trend and minute trend data is shown in the attached figure 1 and 2.
We could see that GR_tra was not stable, which is due to SHG is not stable at the beginning.
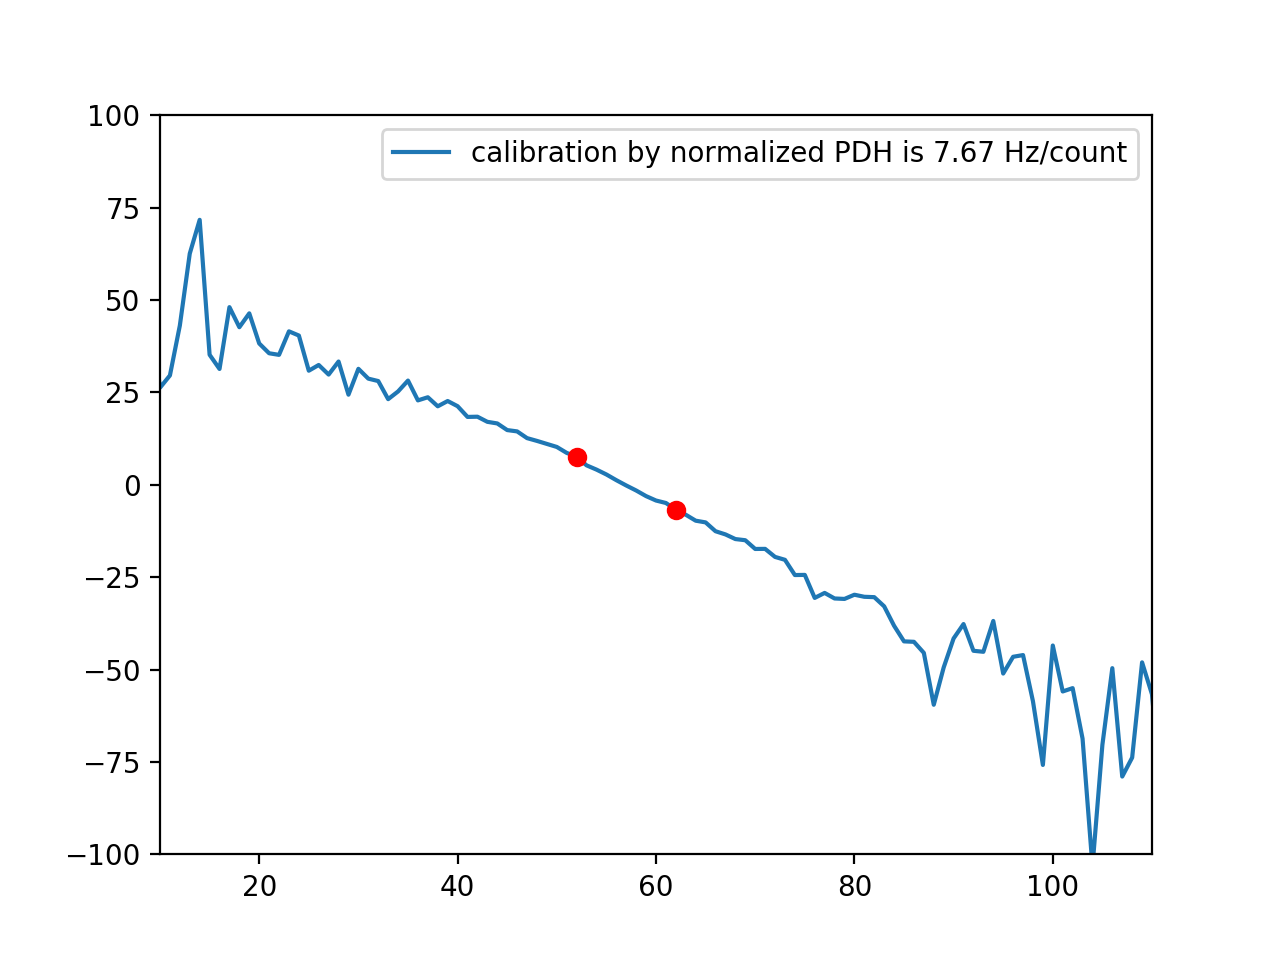
The calibration is done with the method in elog2035, the calibration is shown in attached figure 3.
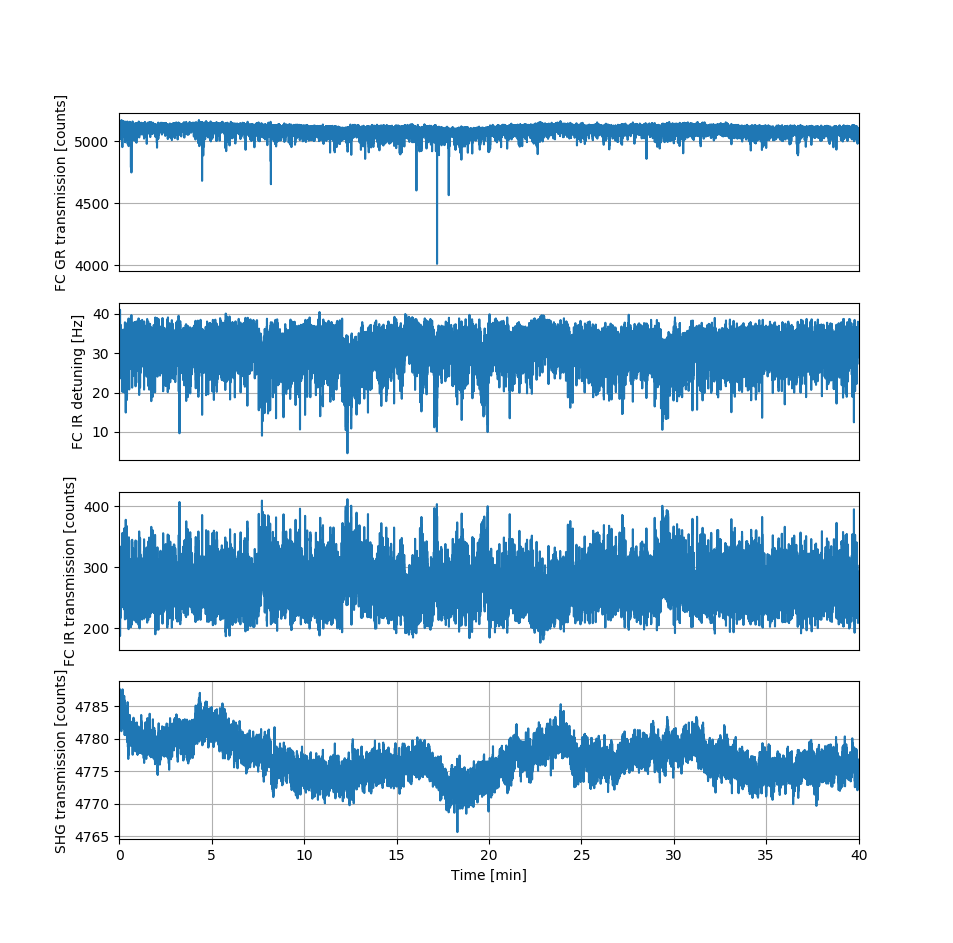
2. I put BAB in a detuned case. The second trend and minute trend data is shown in attached figure 4 and 5.
We could see that both IR_tra and IR_demo are stable in the detuned case.
Eleonora (remotely) and Yuhang
It was suspected that green transmission power changes due to different green beam hitting position on transmission camera (elog2220). Therefore, we decide to fix the green transmission direction. Eleonora has already designed the feedback loop to control the green transmission direction. So I just used that loop.
1. I tried to close the loop with gain of 1. Then I get result of attached figure 1.
From this test, we could see that the loop works. But it seems the gain is too small.
2. I increase the gain to 50 for pitch and 10 for yaw. Then I get result of attached figure 2 and 3.
We could see that green transmission is kept stably.
But from the last entry, it seems to be better to feedback to PR.
Eleonora (remotely) and Yuhang
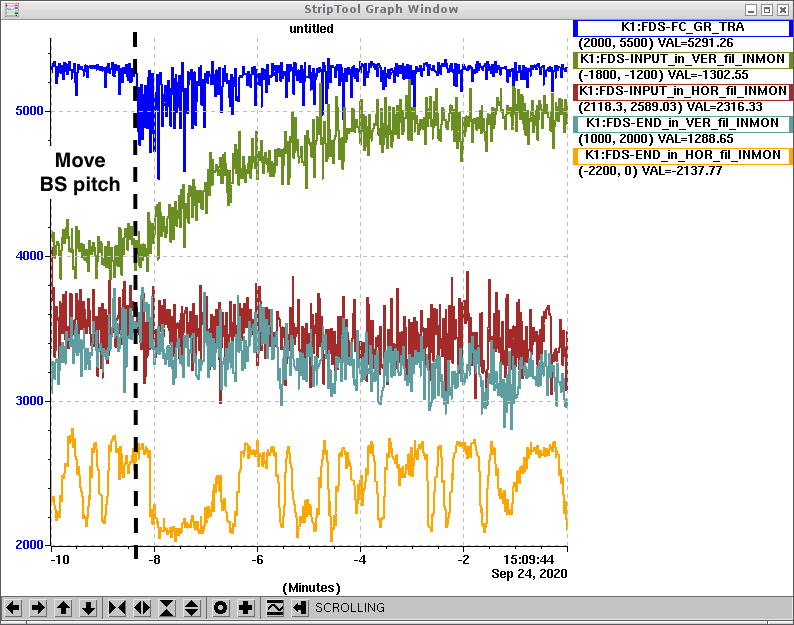
As suggested by Matteo, we should check oplev singal of INPUT/END mirrors. Besides, as suggested by Raffaele, the control bandwidth of AA can be evaluated by checking how long time loop takes to go back to be aligned from misalignment. Therefore, I did the following check:
1. I lock FC and close AA loop. The locking strategy for AA is: 1.lock with low pass filter 2.switch off low pass filter 3.switch on integrator.
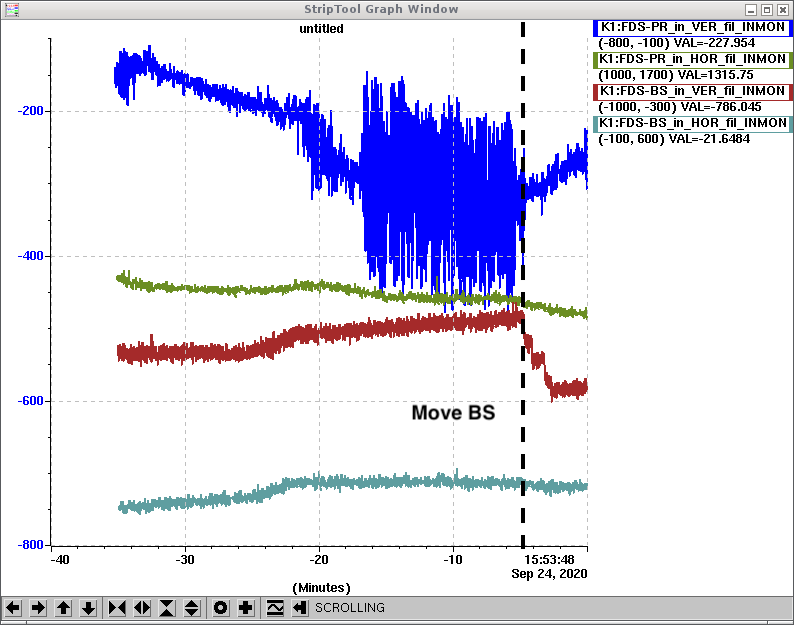
2. By adjusting BS, beam moves up on camera. Then I get oplev error signal as attached figure 1.
By looking at INPUT pitch oplev signal, we could see that AA loop takes almost 4 min to recover the pitch misalignment. Therefore, the control bandwidth should be very small for AA loop pitch. Therefore, it maybe better to increase the gain.
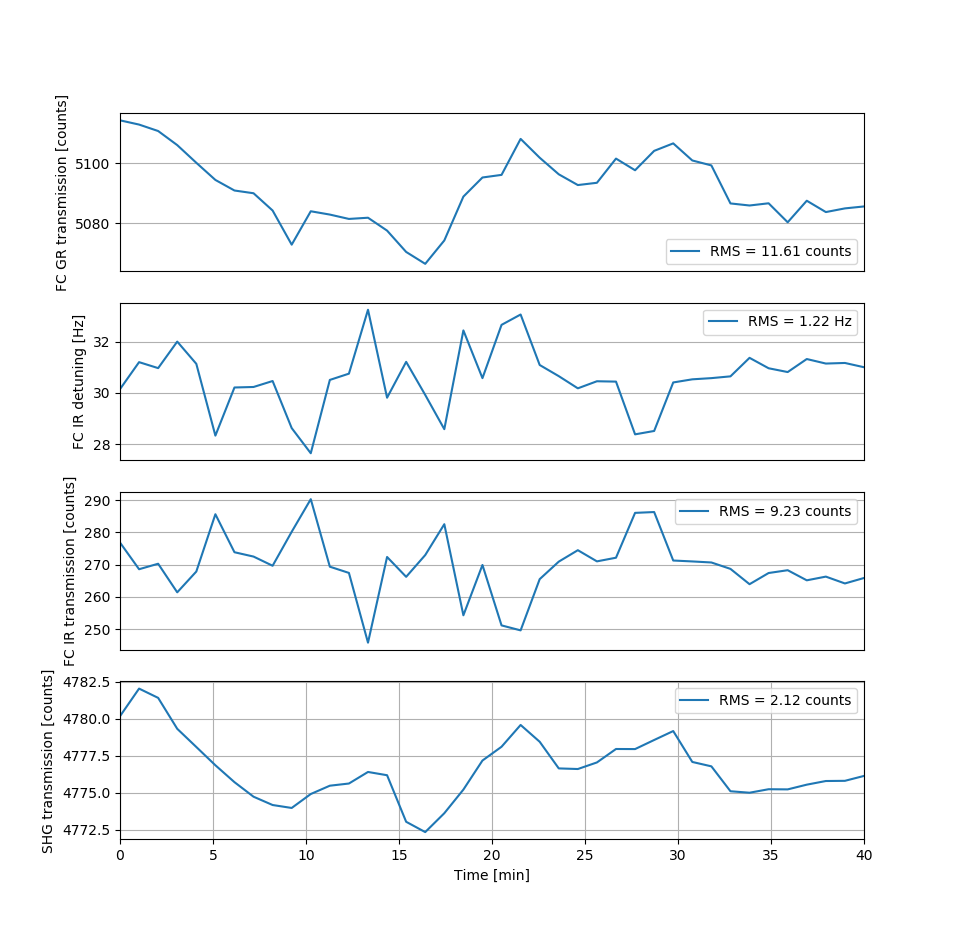
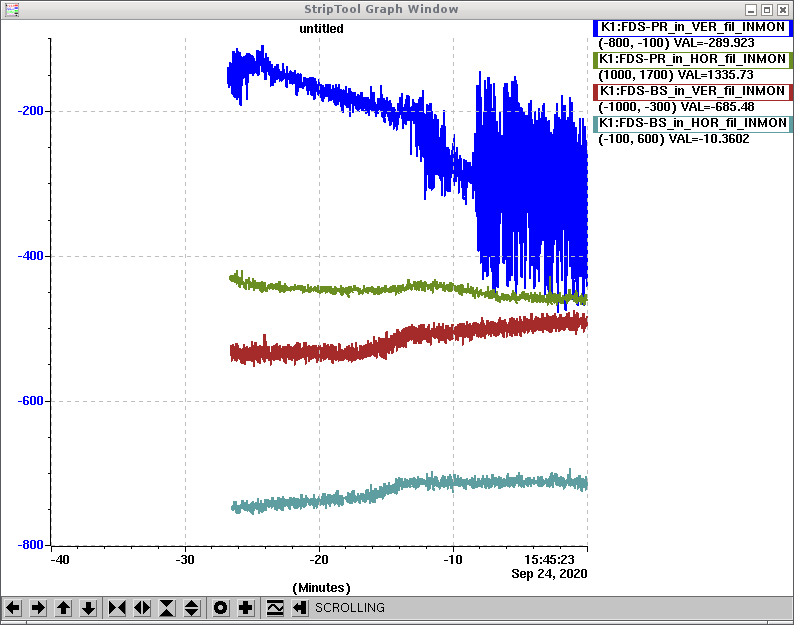
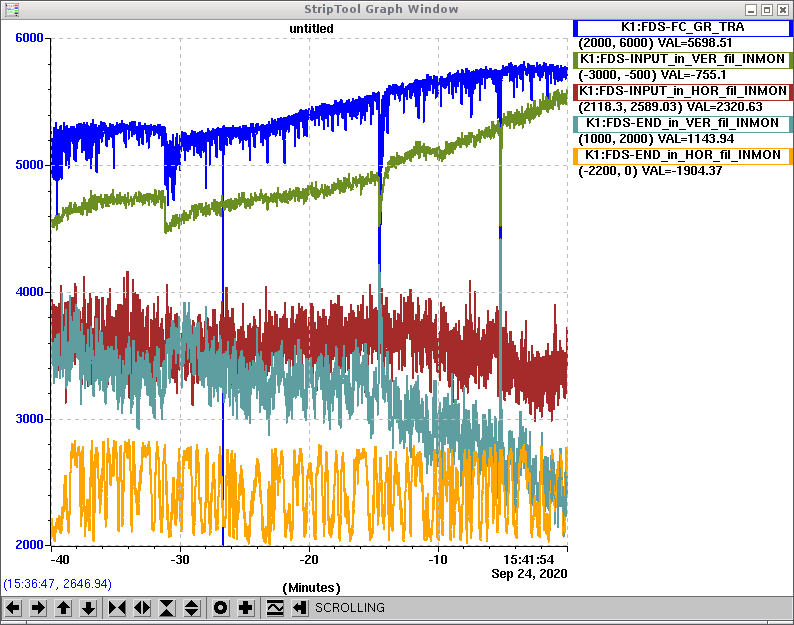
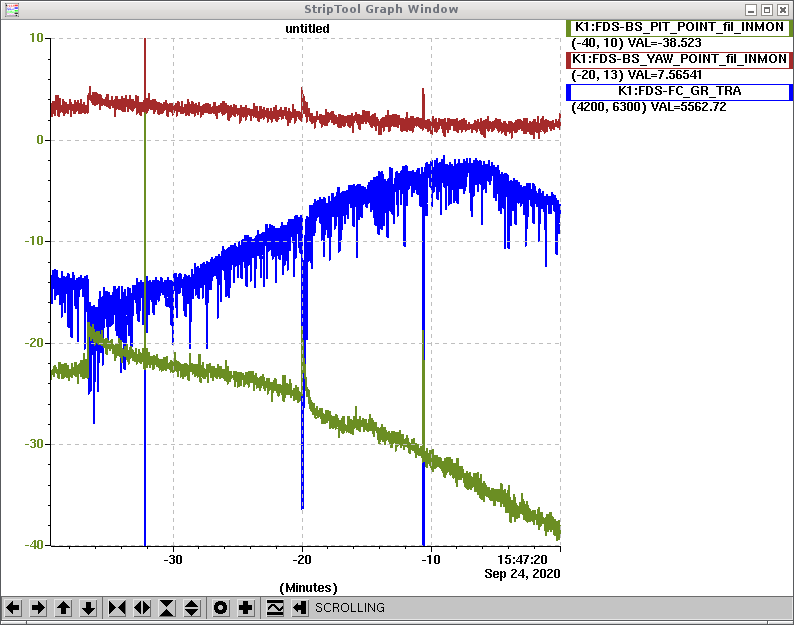
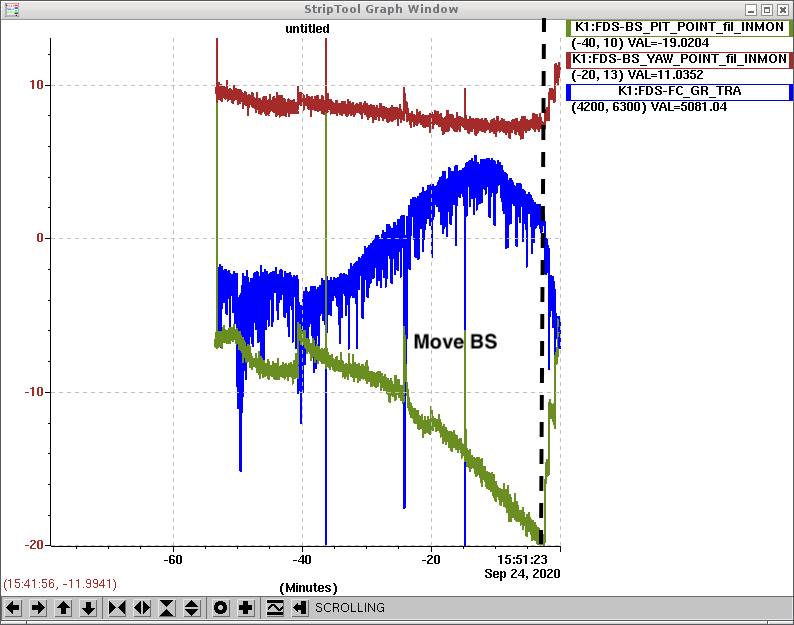
3. I monitor PR/BS/INPUT/END mirrors oplev signal and sum/diff signal of FC_tra_GR PSD for about 40 min. They are shown in attached figure 2, 3 and 4.
According to elog1874, PR/BS oplev signals have similiar calibration factors. Therefore, the attached figure 2 shows each oplev signal in a similar scale, and we could see that PR pitch moved more than others during half an hour. From attached figure 3, we could see that INPUT/END pitch moved accordingly. For yaw direction, there is also correspondence between PR/BS and INPUT/END. But END yaw is always osillating with a frequency around 0.05Hz (time scale around 20 sec). From the attached figure 4, we could see the effect of beam motion in pitch direction. The diff singal from PSD kept chaning in pitch direction (which is consistent with the motion seen from camera). Although the AA loop kept the alignment between beam axis and cavity axis, the green transmission power is not kept.
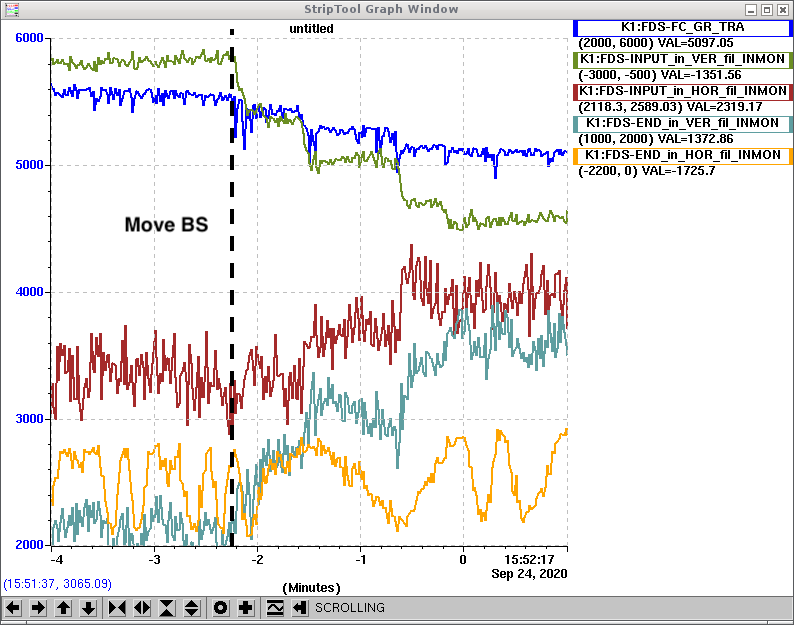
4. I increase gain of AA loop by 100 times for both INPUT and END mirror.
5. I move BS in pitch direction again. Then the 4 mirrors oplev signals and transmission PSD signals are shown in the attached figure 5, 6 and 7.
From attached figure 5, we could easily see the movement I did for BS pitch. From attached figure 6, we could see that INPU/END pitch follows the change of BS. Especially, after increasing the gain of AA loop in pitch, the recovery of alignment becomes quite rapid. This means the control bandwidth should be larger now. From attached figure 7, we see the beam motion on PSD. But it is a bit strange that there is also signal in yaw direction.
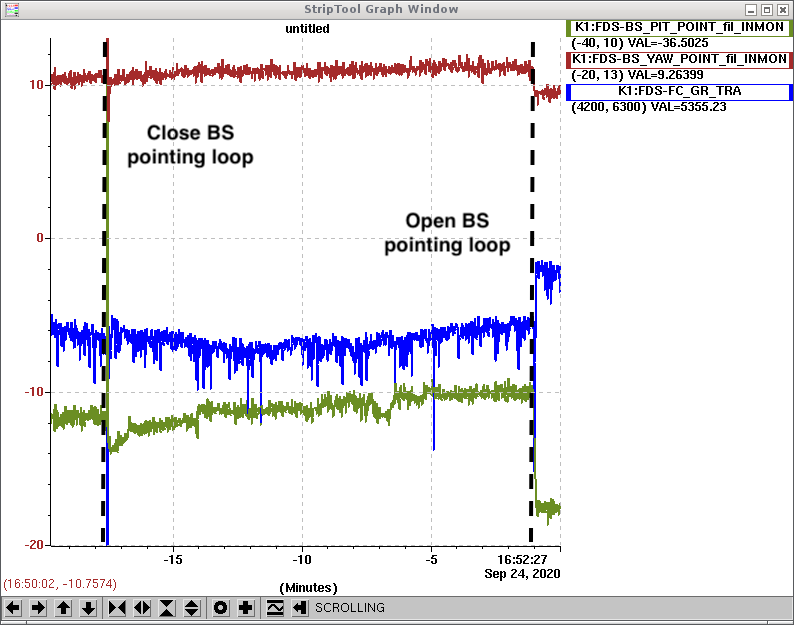
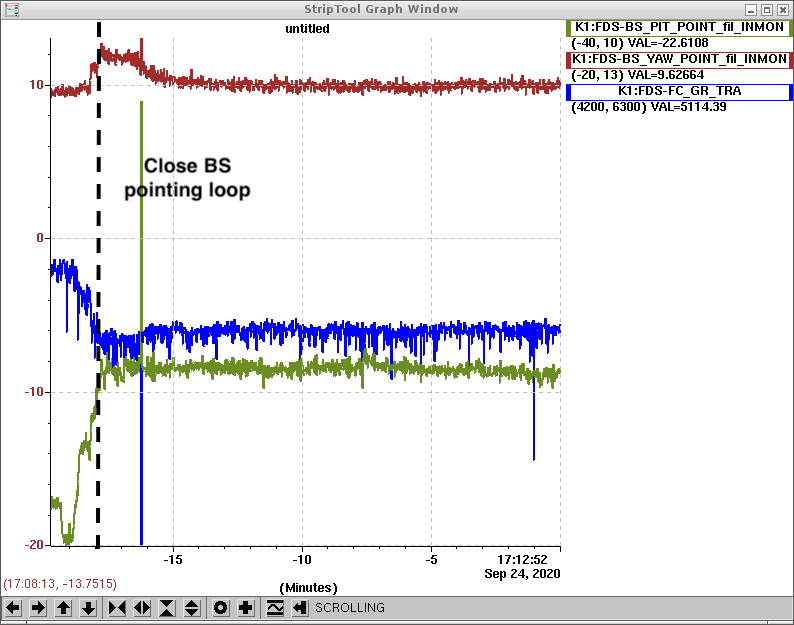
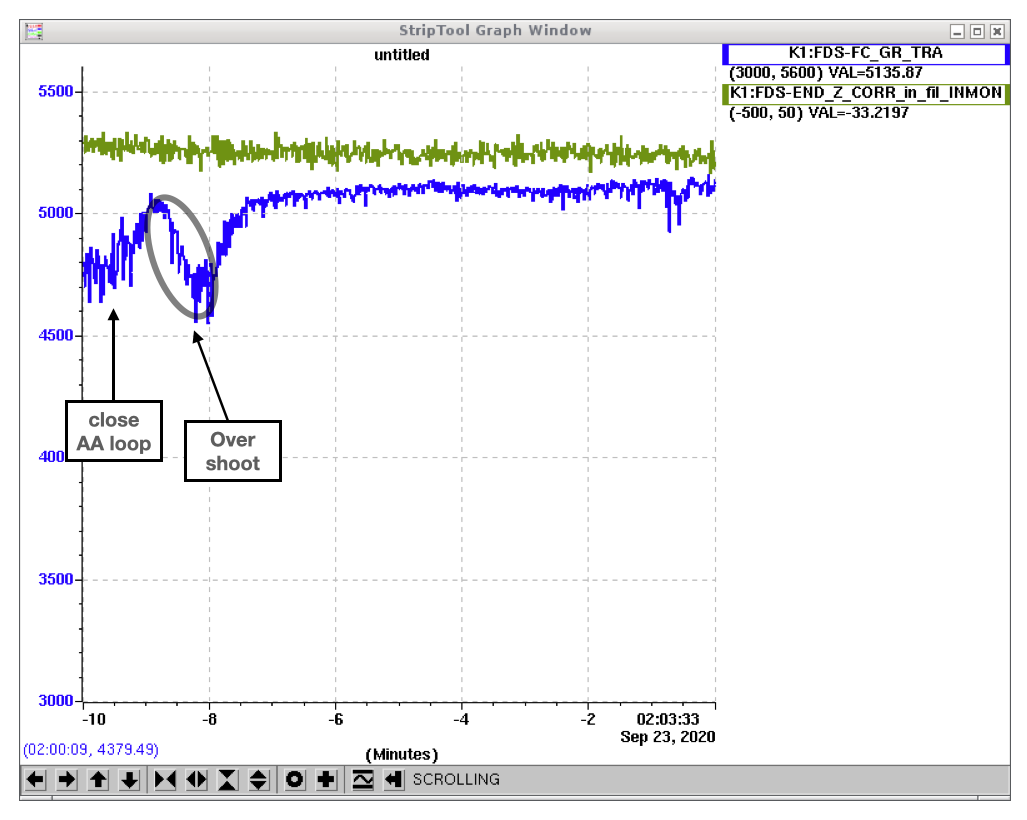
The large motion of mirror after closing AA loop is due to the large gain. This large gain was causing an over shoot. By adding a ramp time of 10min, the lock becomes better. As shown in the figure 2, there is still over shoot, but mirror comes back to the good position within two minutes due to the small increase of servo output.
You can see the ramp time is 600 seconds in the figure 1.
Aritomi and Yuhang
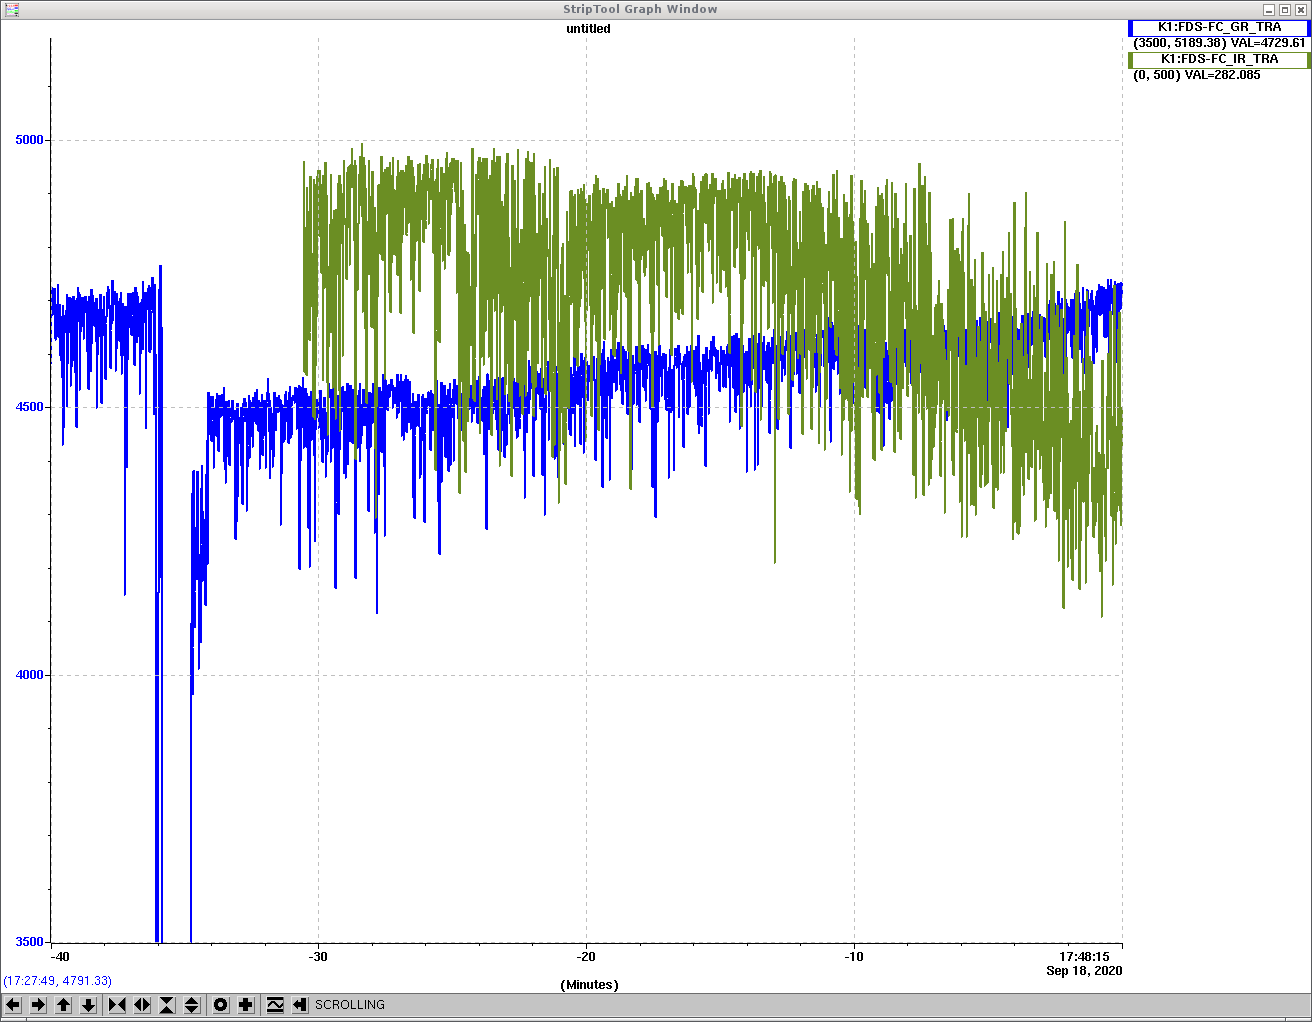
Last week, we closed Auto-alignment (AA) loop and monitor FC_tra for half an hour. As shown in the attached figure 1, both FC_tra_GR and FC_tra_IR drifts.
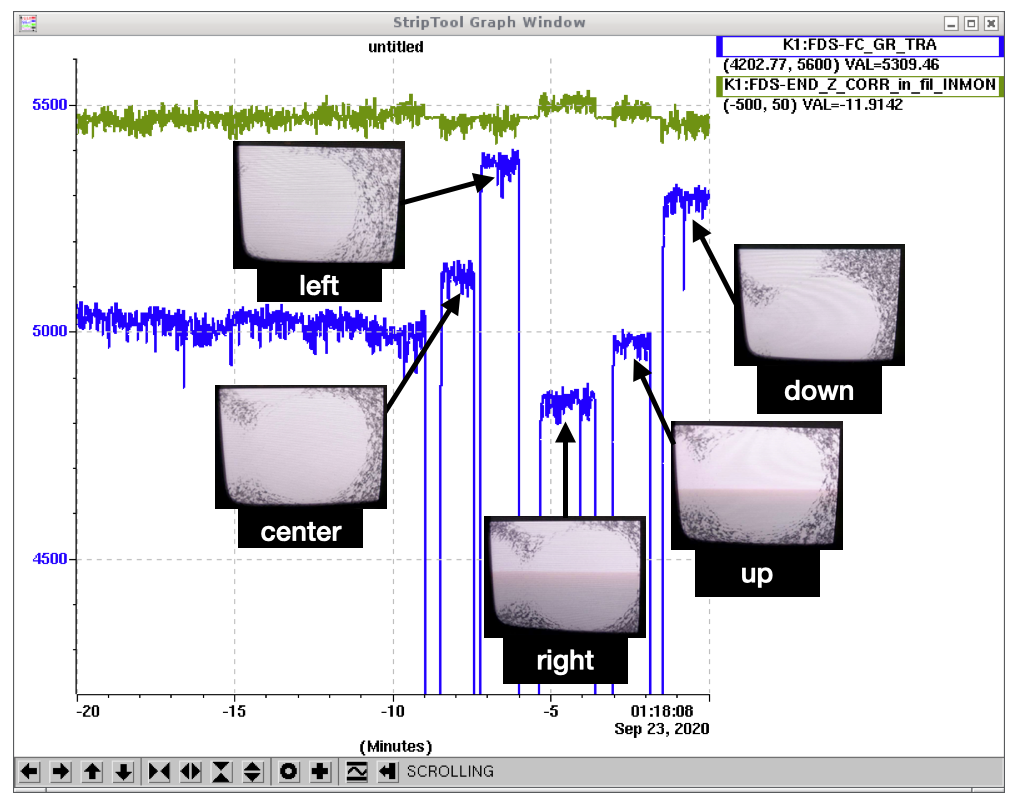
With the AA loop closed, I locked FC while transmitted GR hits on different positions of Camera_tra (different alignment). As shown in the attached figure2, FC_tra_GR changes according to different positions (alignment). Therefore, although the incident beam axis aligns with the cavity axis by the AA loop, there is different cavity behavior for GR_tra for different alignment which is causing the long time drift of FC_tra. Probably the situation will be even more different for IR, which should be checked soon. For example, it is similar to the FC optical losses for IR is different for different alignment conditions.
Can you plot the oplev signals for input and end mirror at the same time of the plot you attached in the entry?
Aritomi and Yuhang
All the loop used integrator with gain of 0.1. The pitch loop has both 10Hz low pass filter as well. These filters were chosen a bit randomly. They will be improved later.
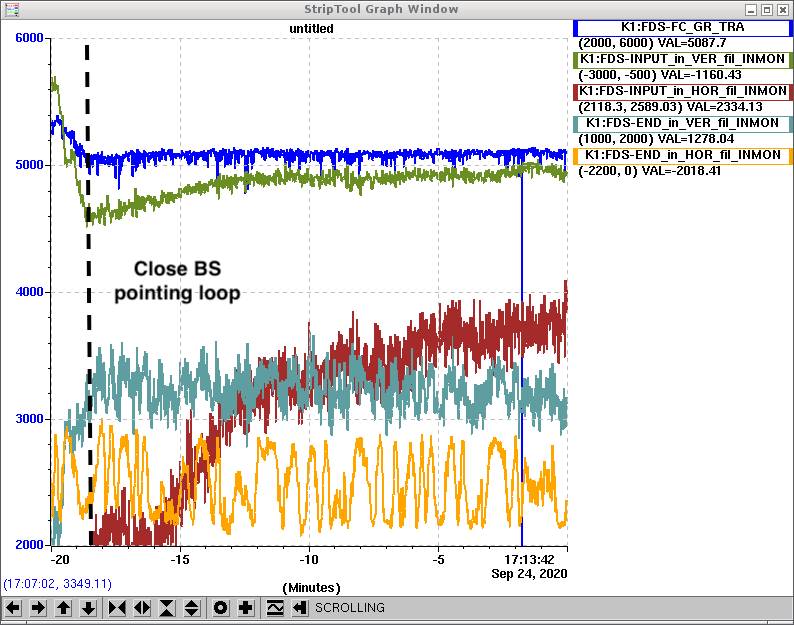
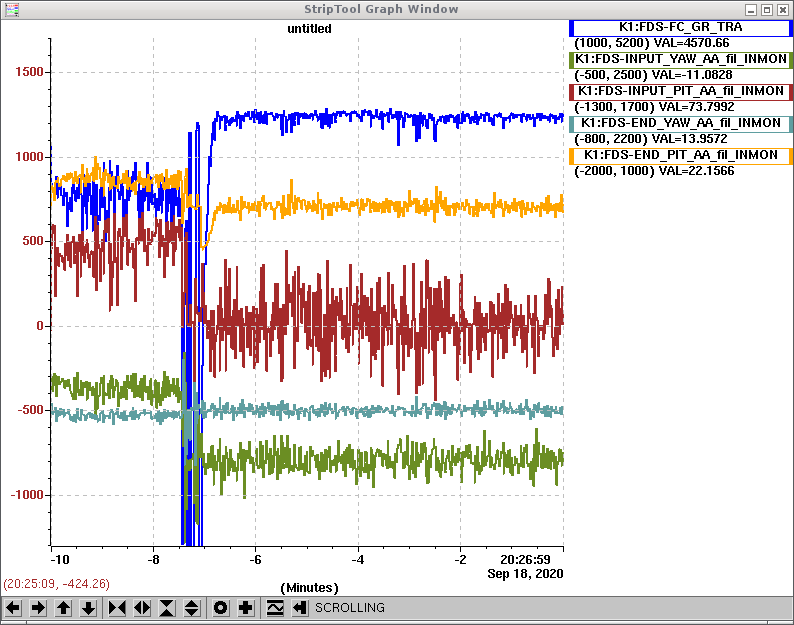
With these filters, the loop was closed. And the alignment of filter cavity was kept as shown in the attached figure. We could see that the green power goes to maximum after the loop is closed and stays stable. Besides, all the error singal goes to zero and oscillates around.
However, there is still problem. Everytime when the loop is closed, there is a very large motion of mirror. We need to solve this problem. Apart from this, the loop works well.
Can you plot the oplev signals for input and end mirror at the same time of the plot you attached in the entry?
The large motion of mirror after closing AA loop is due to the large gain. This large gain was causing an over shoot. By adding a ramp time of 10min, the lock becomes better. As shown in the figure 2, there is still over shoot, but mirror comes back to the good position within two minutes due to the small increase of servo output.
You can see the ramp time is 600 seconds in the figure 1.
Aritomi and Yuhang
The transfer function of each control loop was measured. The measurement was done with the excitation and the channel before and after that.
The control loop for yaw has unity gain frequency around 0.2Hz.
But the control loop for pitch has unity gain frequency less than 0.1Hz.
According to the actuation calibration in elog1877, the driving of 5urad can be represented in the unit of counts.
The excitation is therefore decided to be the following table (at 2Hz).
| Input Yaw excitation | Input Pitch excitation | End Yaw excitation | End Pitch Excitation |
| 227 | 793 | 186 | 961 |
According to this excitation, the response (sensing matrix) is as the following table
| WFS1_p | WFS1_y | WFS2_p | WFS2_y | |
| Input_y_exc | 48 | 470 | 36 | 248 |
| Input_p_exc | 275 | 70 | 180 | 33 |
| End _y_exc | 66 | 180 | 73 | 161 |
| End_p_exc | 269 | 143 | 292 | 74 |
The offset of these signals is listed as the following table
| WFS1_p | WFS1_y | WFS2_p | WFS2_y | |
| offset | 31 | 20 | 29 | 13 |
Then subtracting the offset from the sensing matrix. The sensing matrix (after substracting) is used to decide the driving matrix index magnitude. The principle is that if the response is larger, the driving needs to be also larger. Without considering the coupling between pitch and yaw, the driving matrix is decided to be
| WFS1 | WFS2 | |
| input_p | 1.6 | -1 |
| end_p | 0.9 | 1 |
| input_y | -1.9 | 1 |
| end_y | -1.1 | 1 |
The sign of the above driving matrix is decided by the time-series measurement yesterday.
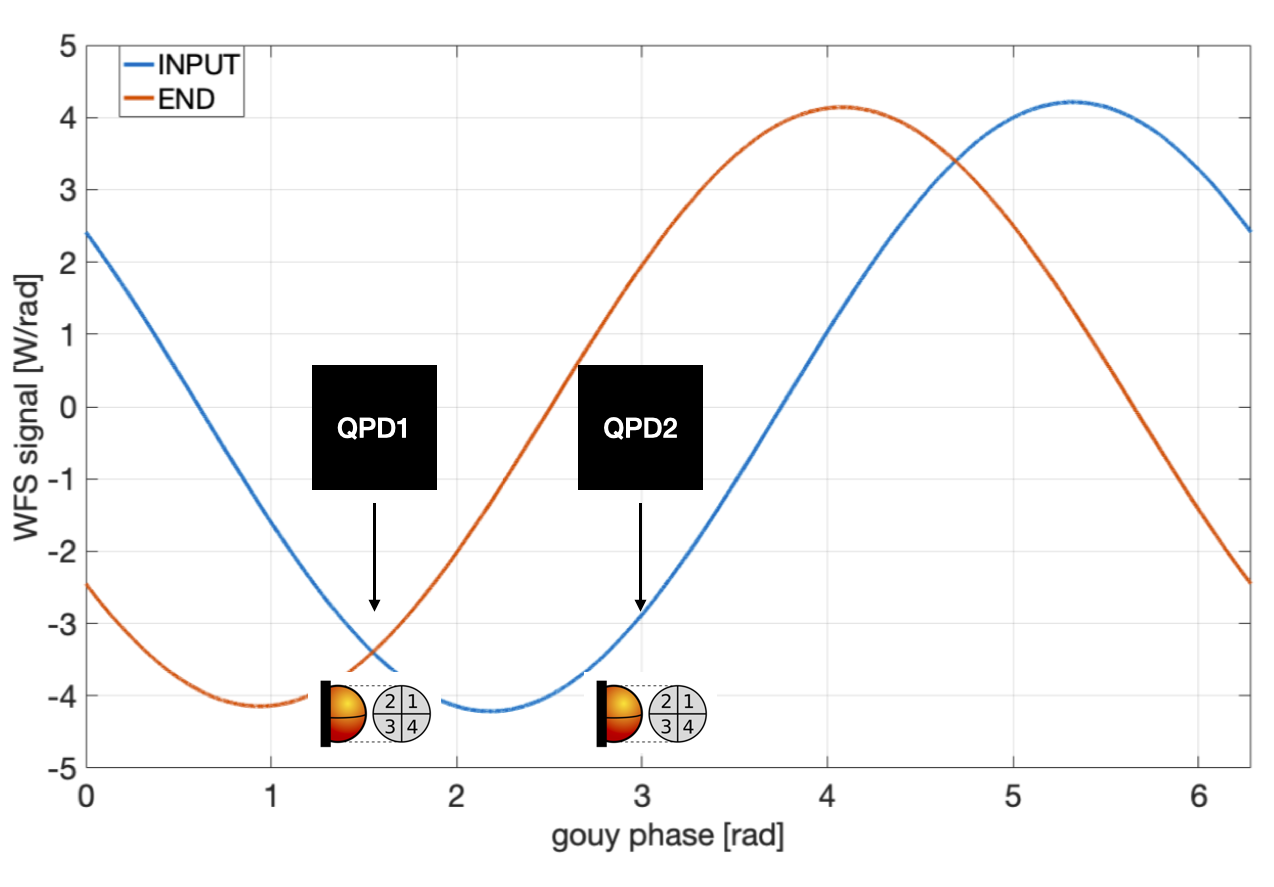
According to the WFS error signal in time, it can be inferred that situation of QPDs location is shown in the attached figure.
In this case, the error signal from input mirror is shown with opposite sign on QPD1/2. While the error signal from end mirror has the same sign.
[Aritomi, Yuhang]
We checked nonlinear gain with 56mW green and found that the nonlinear gain is below 20 while the theoretical nonlinear gain is 37.5. So we optimized the nonlinear gain. We measured OPO transmission of BAB with power meter (power meter range: 8.8 mW) while OPO and green phase is scanned.
| green power (mW) | OPO temperature (kOhm) | p pol PLL (MHz) | BAB transmission (V) | nonlinear gain |
| 0 | 7.18 | 270 | 0.0456 | 1 |
| 56 | 7.18 | 127.5 | 1.42 | 31.1 |
Then we measured FDS, but we couldn't find any squeezing with 56mW green. We decided to reduce the green power to 41.5mW (MZ offset 4.5). We optimized OPO temperature and p pol PLL for 41.5mW green. The nonlinear gain is 13.4 and consistent with theoretical value which is 12.8.
| green power (mW) | OPO temperature (kOhm) | p pol PLL (MHz) | BAB transmission (V) | nonlinear gain |
| 0 | 7.164 | 240 | 0.0456 | 1 |
| 41.5 | 7.164 | 135 | 0.612 | 13.4 |
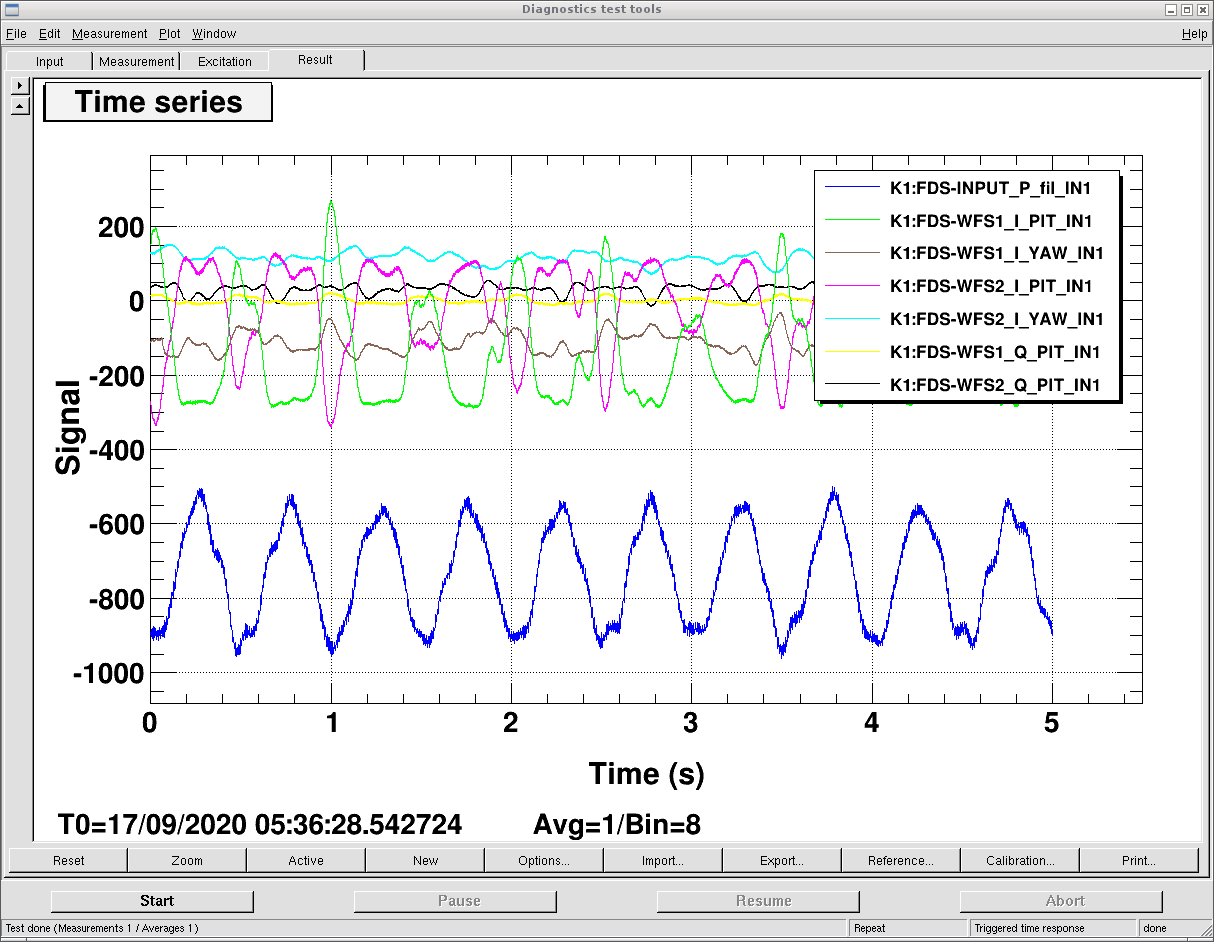
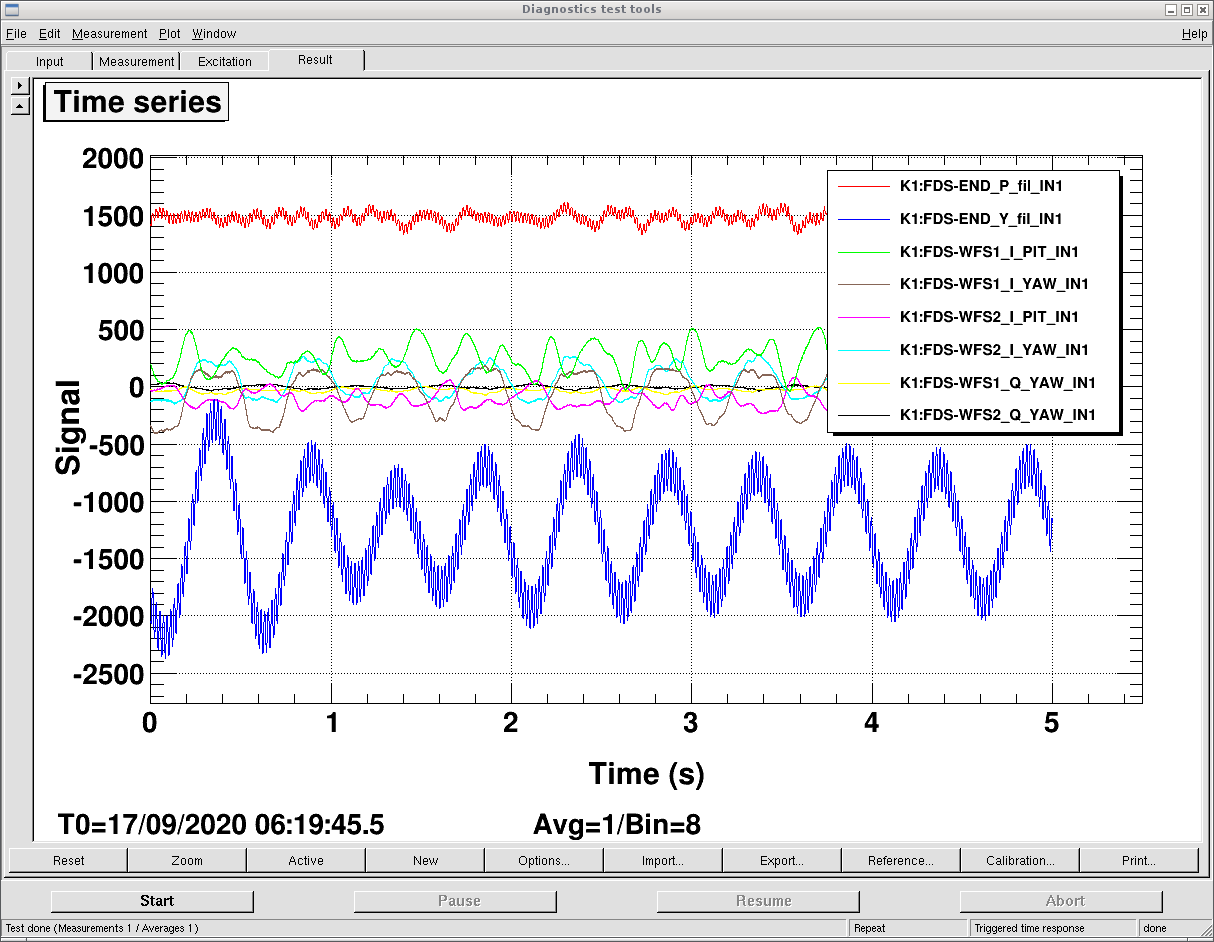
The error signal in time tells phase information(error signal in/out of phase with driving) and locking information(if error signal is around zero, the locking is good). Therefore, I checked WFS error signal in time on QPD1/2 while driving/nodriving INPUT/END mirror Pitch/Yaw separately. This time, the driving is at 2Hz.
Figure 1: no driving. Even when there is no driving, the pitch error signal oscillates around zero, which indicates mirrors have very large oscillation in pitch direction (known before in other ways).
Figure 2: Drive INPUT pitch. We could see WFS1 reconstructed pitch error signal is in phase with the local control pitch motion (driving). But WFS2 reconstructed pitch error signal is out-of phase with the local control pitch motion (driving). We could see that there is some signal in Yaw error signal, but if you compare it with the no driving case, this Yaw error signal fluctuation seems not to be from Pitch driving (or coupling is covered by yaw original fluctuation). (The coupling to Q_phase is also very small)
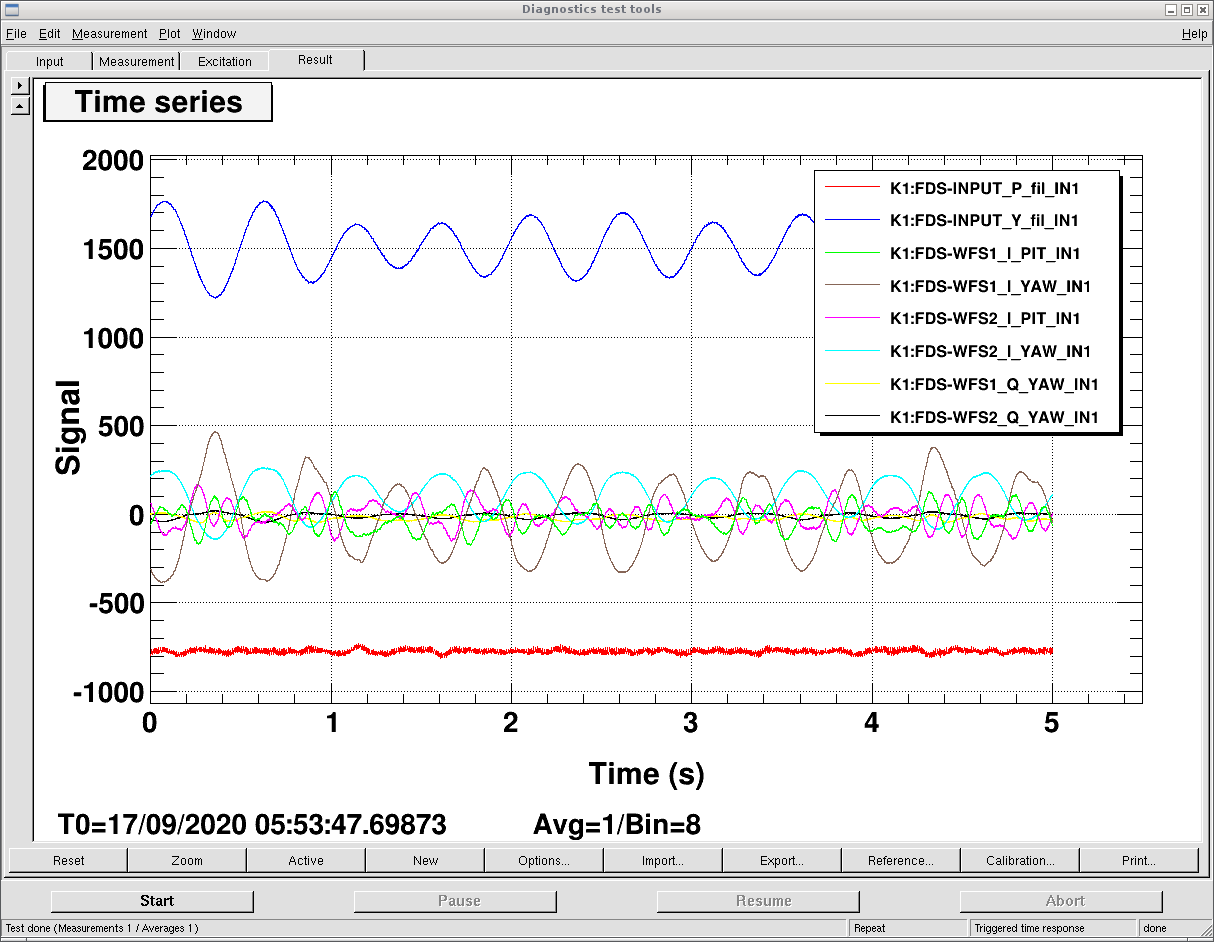
Figure 3: Drive INPUT yaw. We could see WFS1 reconstructed pitch error signal is out-of phase with the local control yaw motion (driving). But WFS2 reconstructed pitch error signal is in phase with the local control yaw motion (driving). The pitch/yaw is also not visible. The coupling to Q-phase is also quite small.
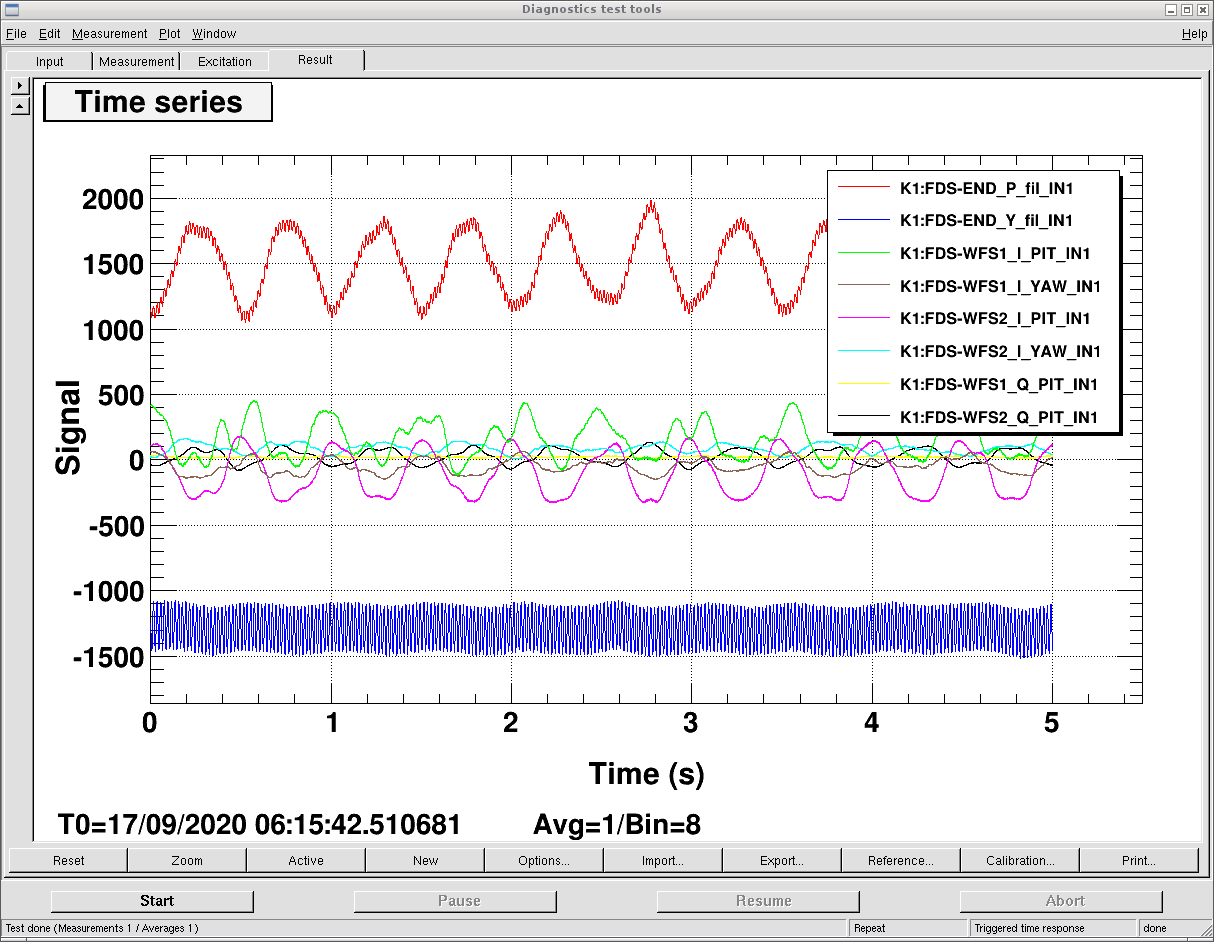
Figure 4: Drive END pitch. Both WFS1/2 are giving out-of phase error singal. The coupling to yaw could be seen in WFS1. There is also lots of coupling to WFS2 Q phase (will not be used to feedback, so it's fine).
Figure 5: Drive END yaw. Both WFS1/2 are giving in-phase error signal. The coupling to pitch is not obvious. The coupling to Q phase is also not obvious.
The phase information could be used to decide the sign for feeding back.

According to the WFS error signal in time, it can be inferred that situation of QPDs location is shown in the attached figure.
In this case, the error signal from input mirror is shown with opposite sign on QPD1/2. While the error signal from end mirror has the same sign.
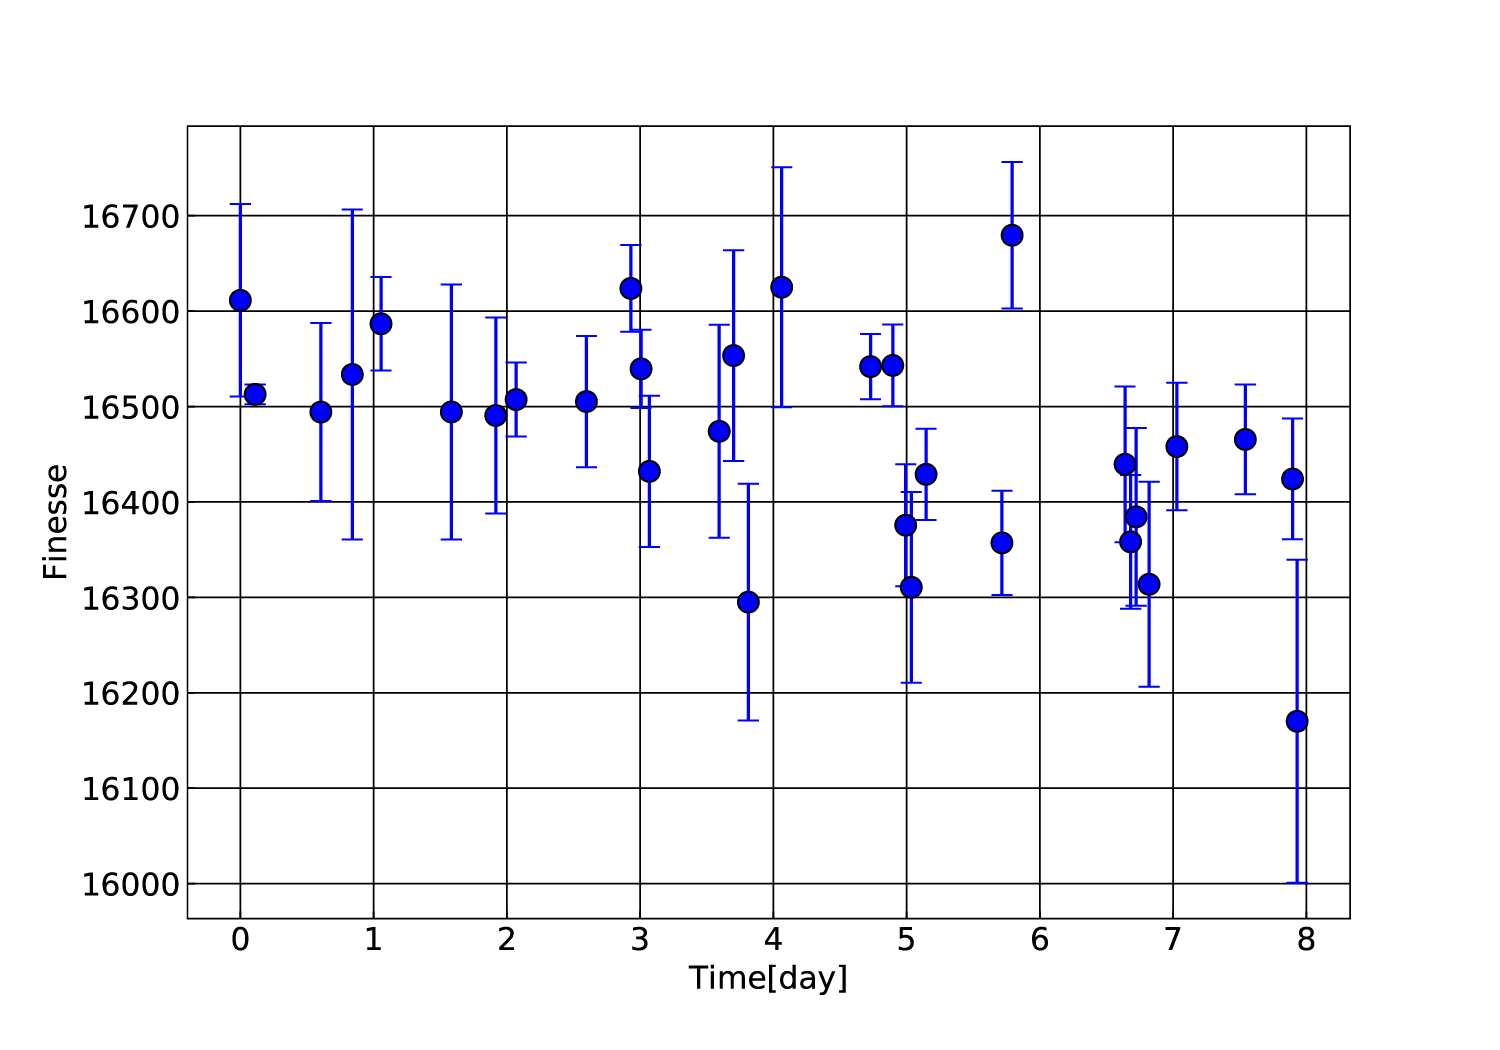
I'm monitoring the finesse of the cavity and it is slightly decreasing.
I'm planing to try to desorb the molecular layer by illuminating the main laser.
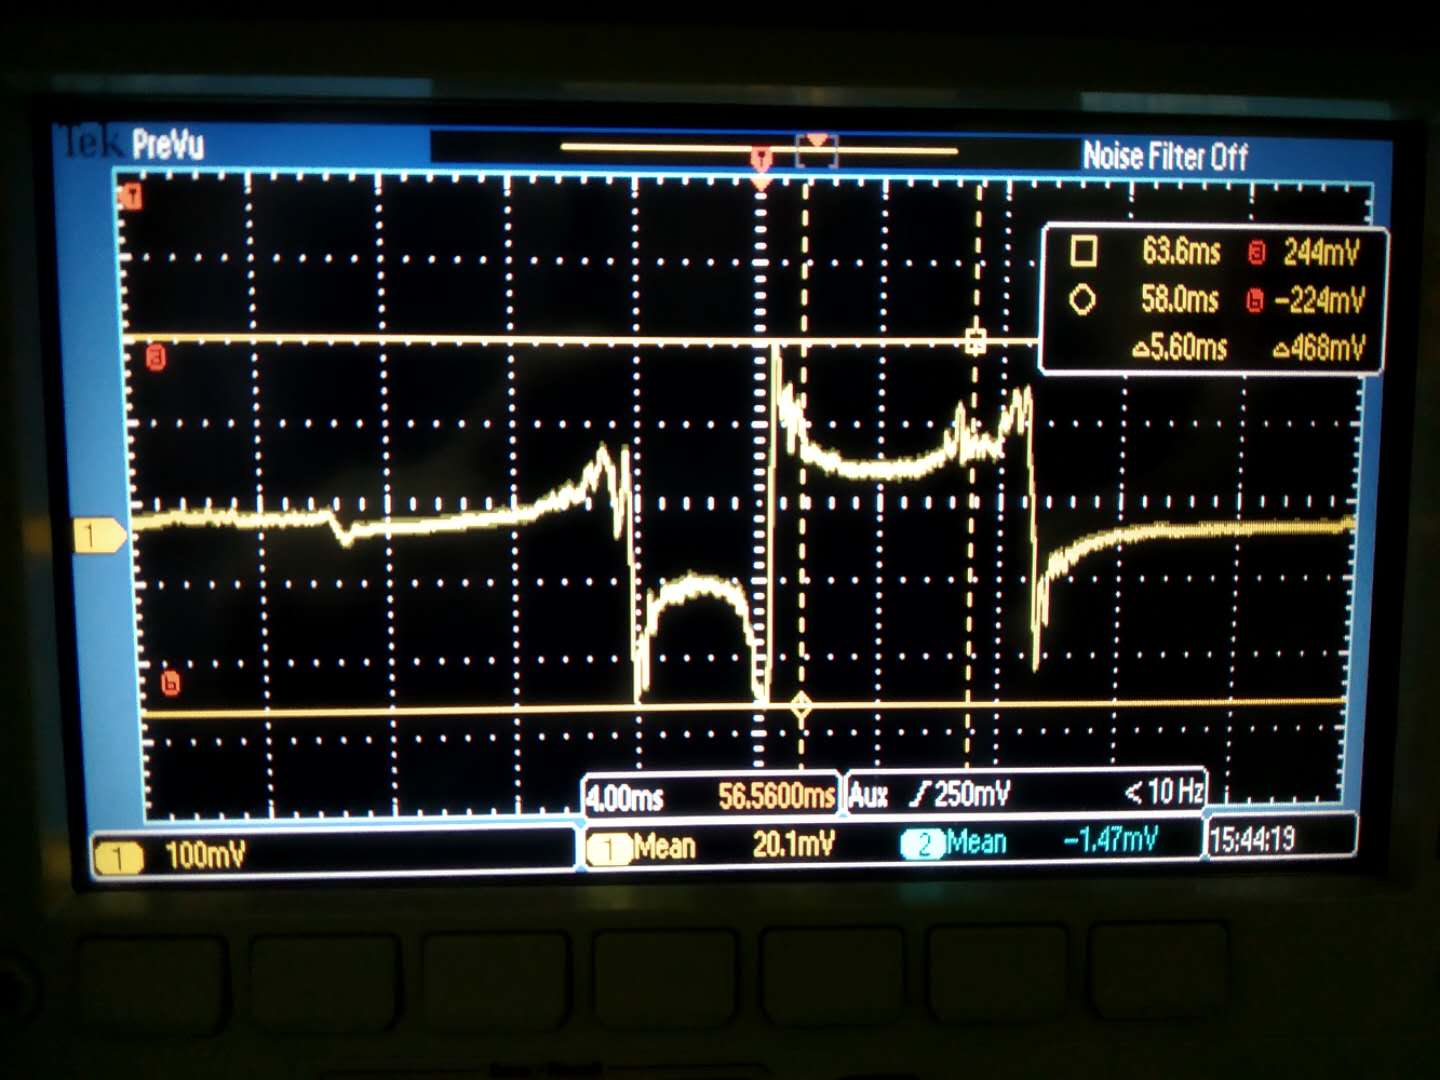
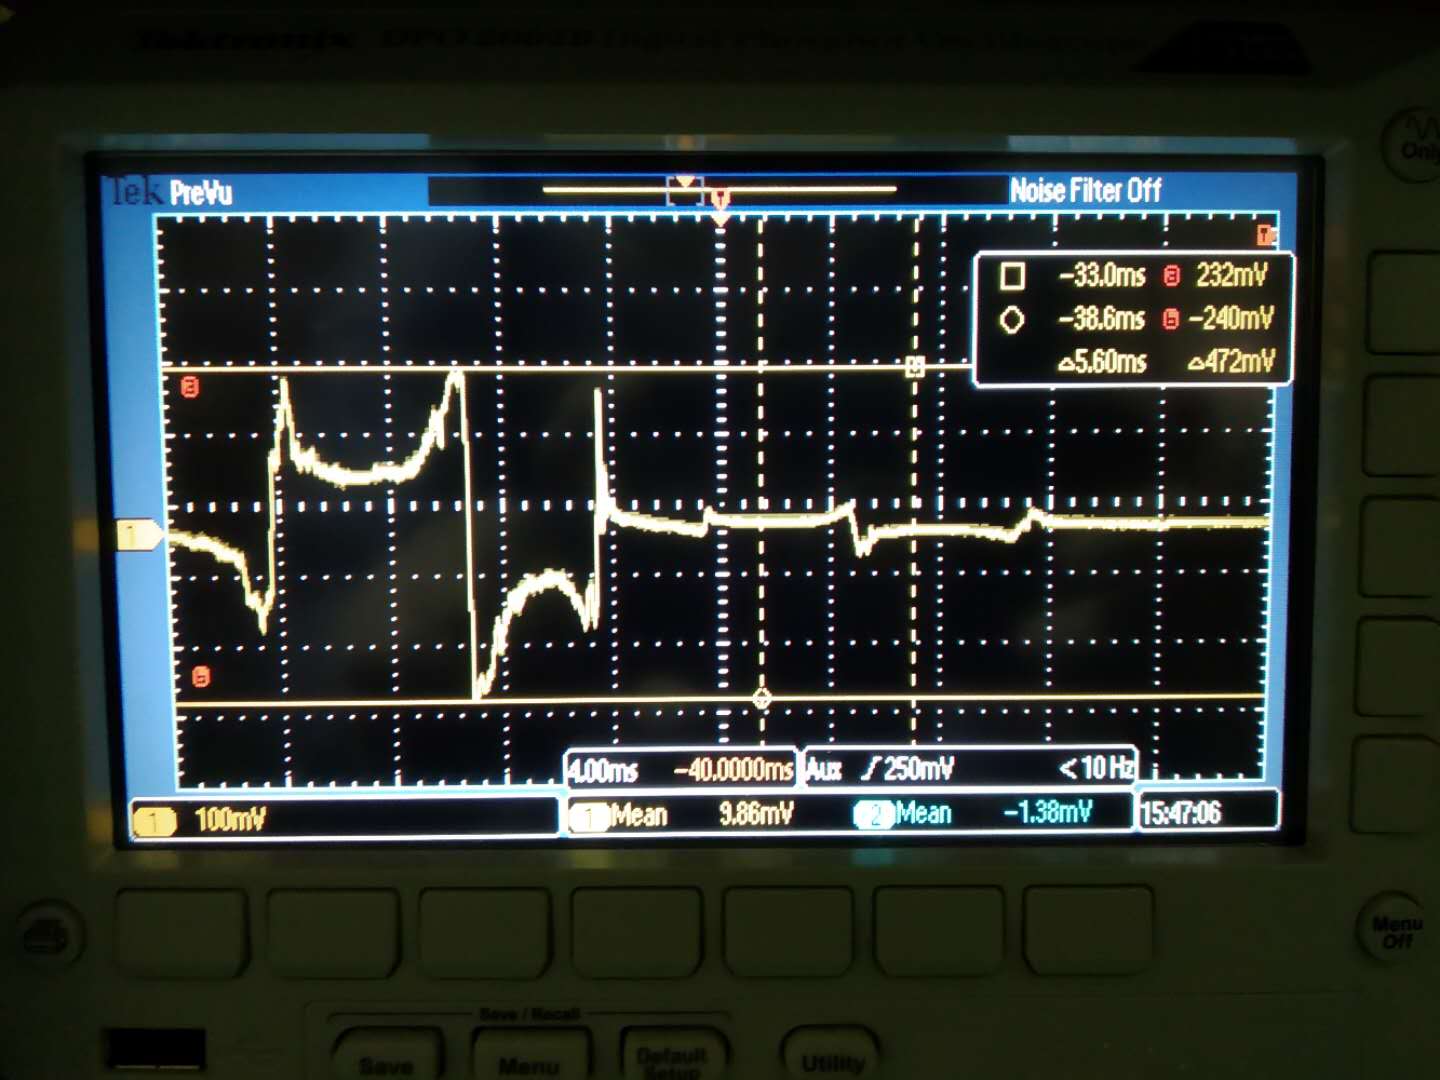
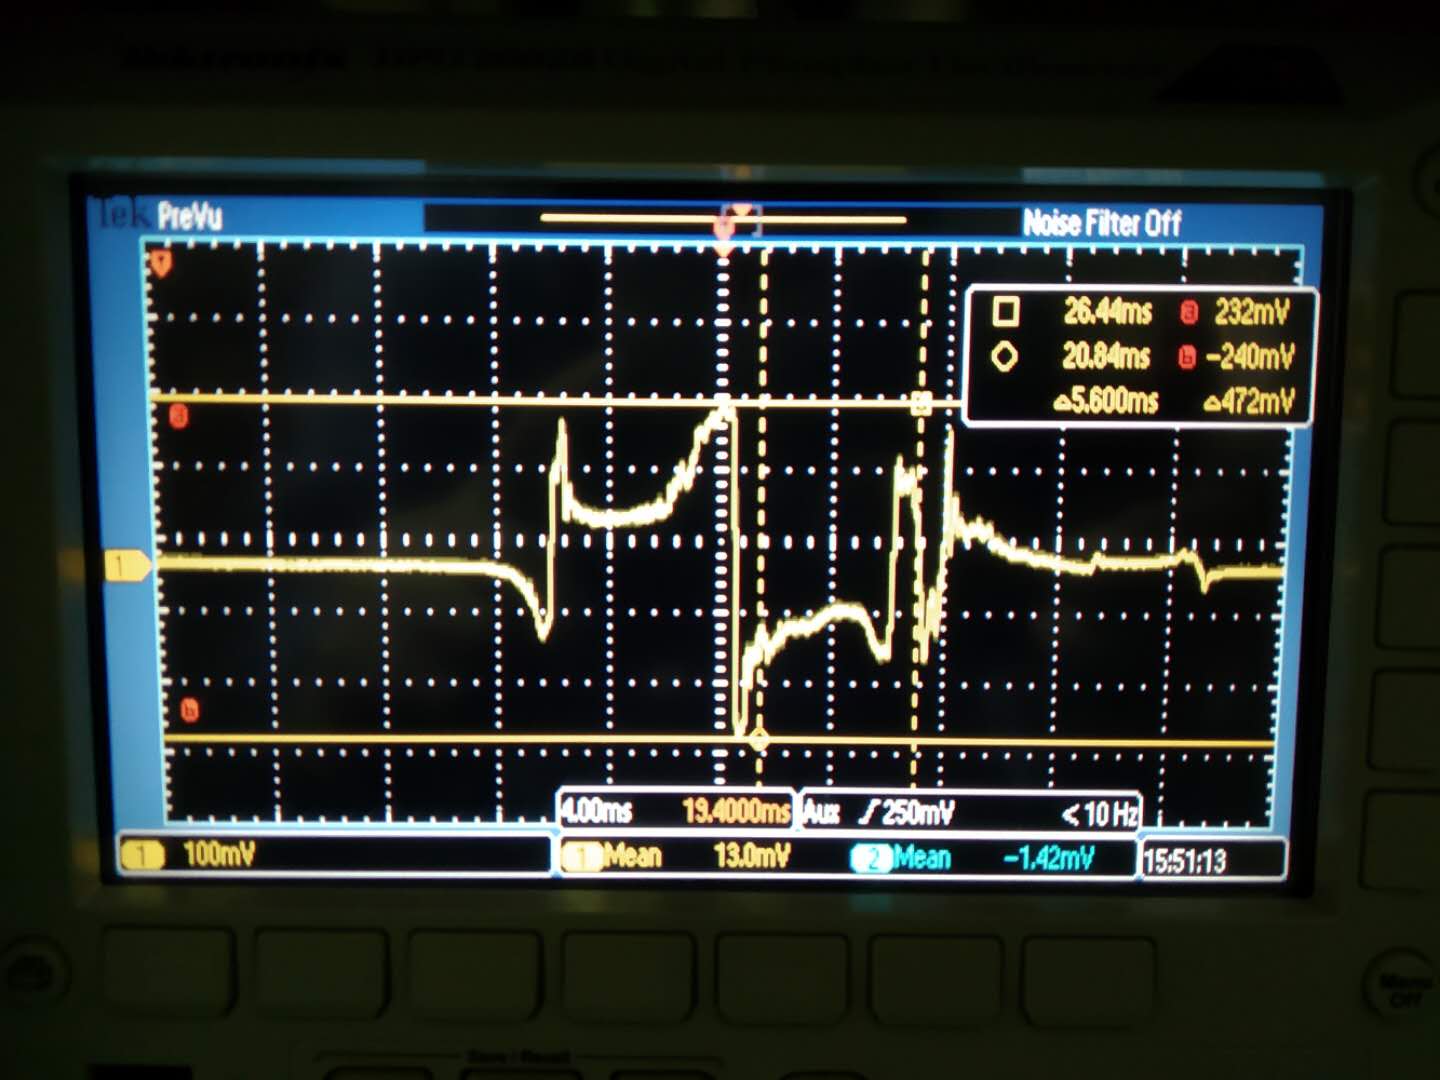
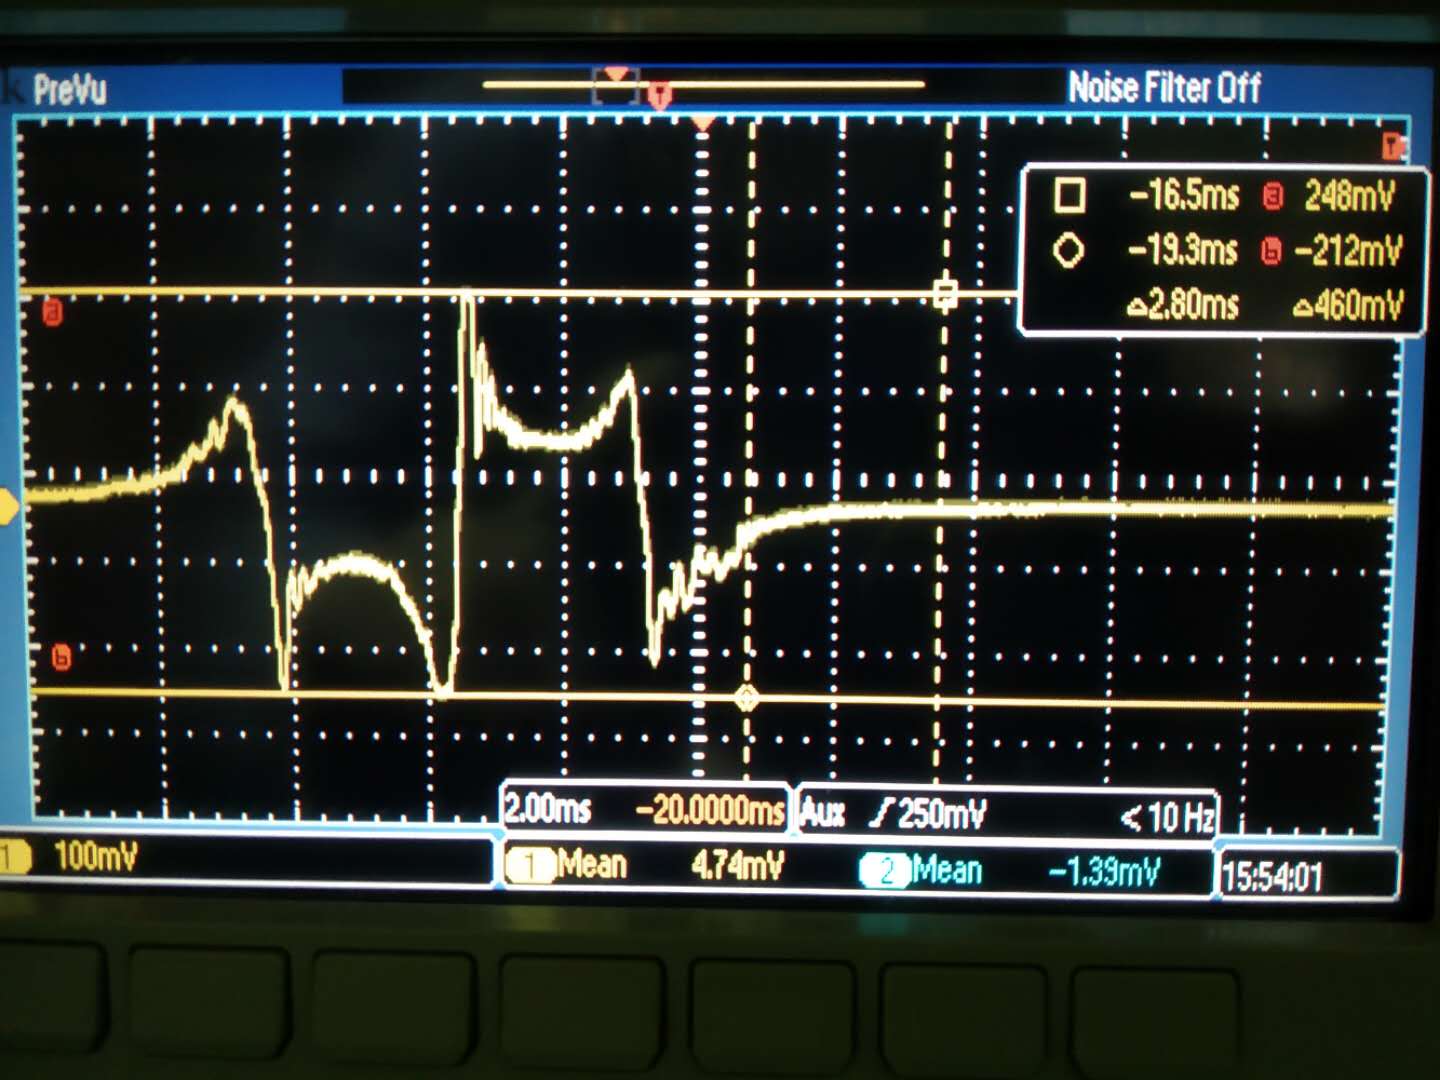
Firstly, I checked that PDH signal coming from Q-phase gives basically 0 when crossing carrier frequency (DDS2 channel3 phase 150deg). Then to check the RF gain/demodulation gain, a check of PDH singal in time was performed by looking at I-phase channel.
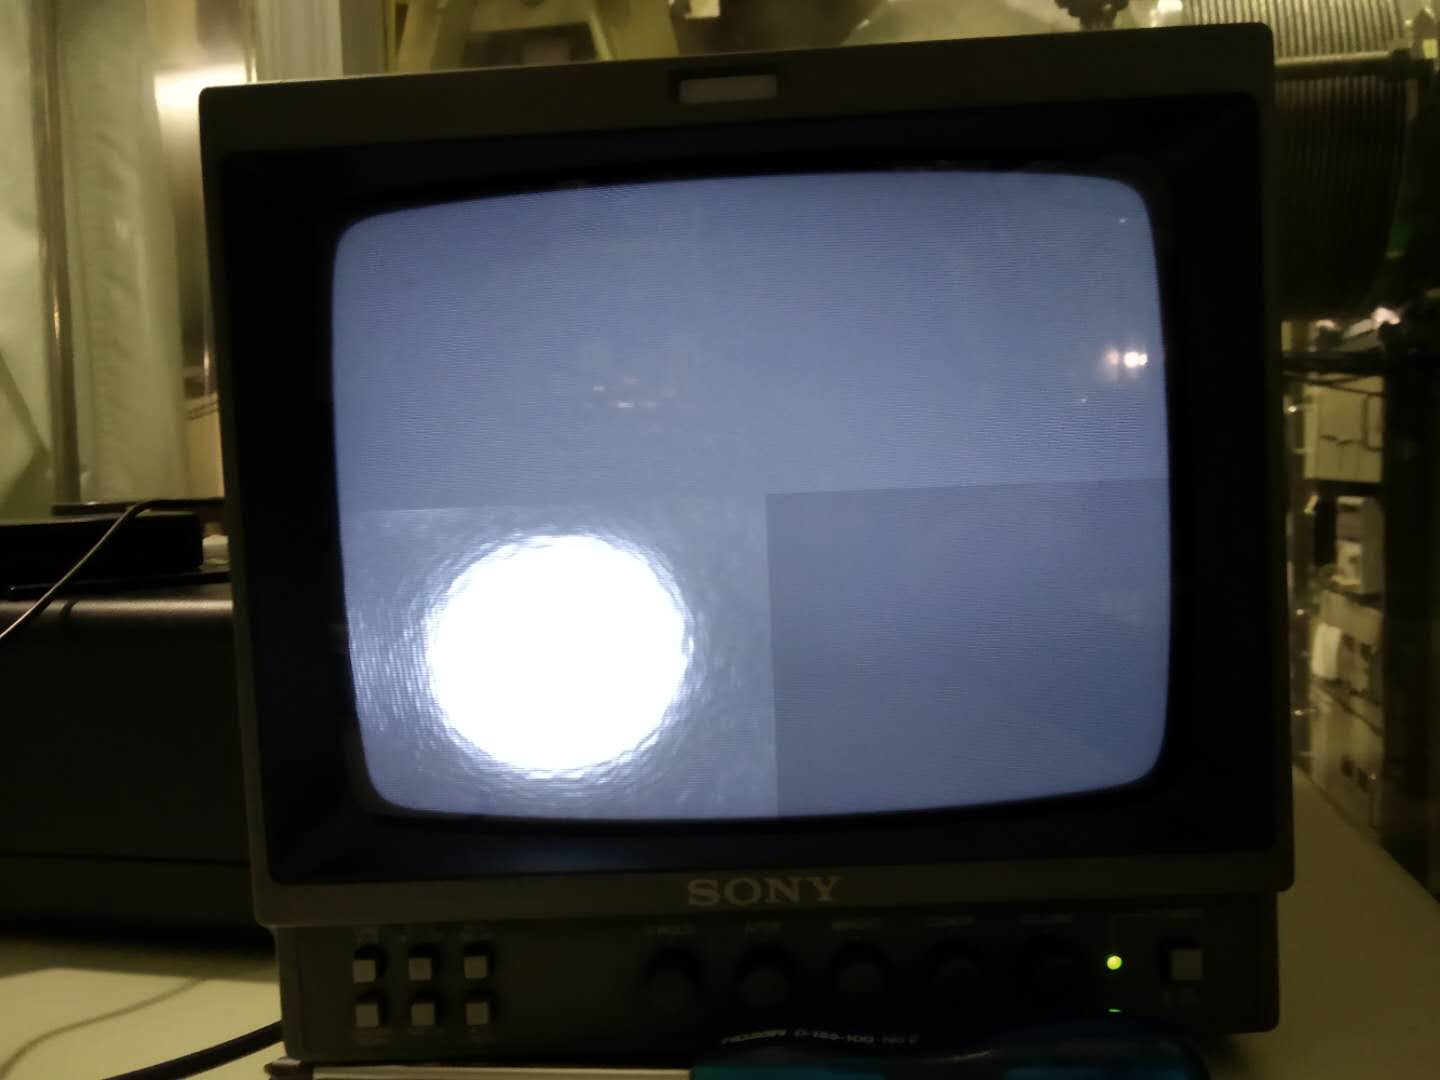
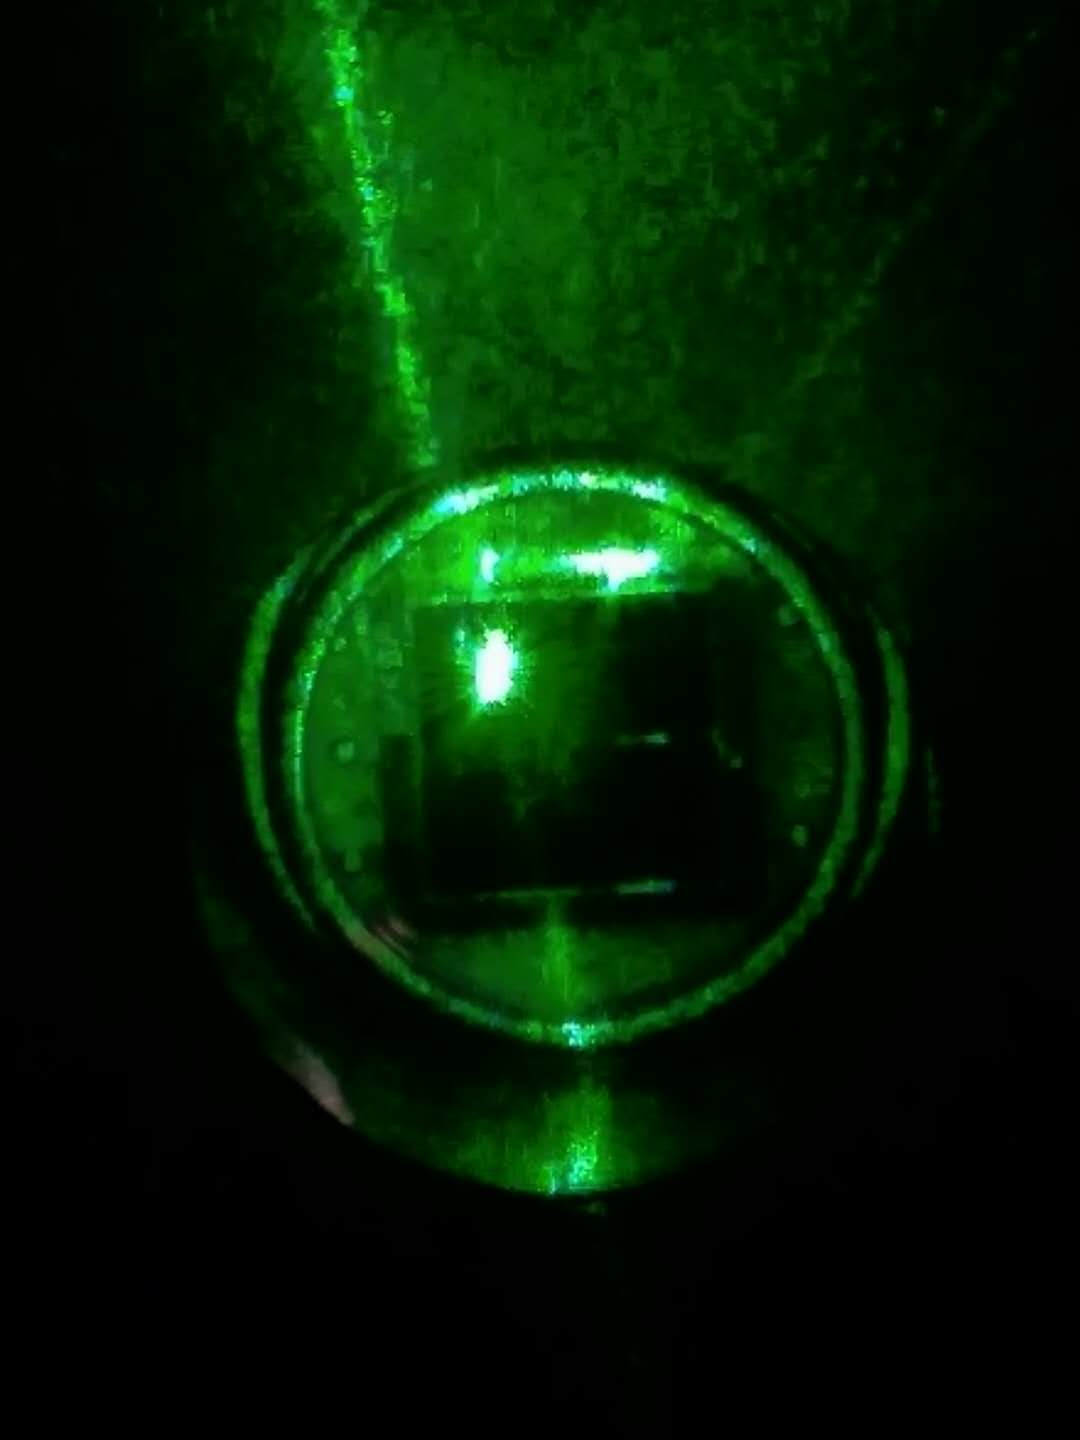
To have values for each segment, the alignment was checked to be as good as possible. (green tra dc is around 5200~5300) (a moment of flash is shown in attached figure 1) For each measurement, the light beam is centered on separate segment of QPDs by adjusting its closest steering mirror. (as shown in attached figure 2)
After checking demodulation phase, alignment and beam centering, the PDH singal was measured (several measurement is attached) and summarized as the following table.
|
|
QPD1 |
QPD2 |
|
seg1 |
440 |
472 |
|
seg2 |
412 |
460 |
|
seg3 |
440 |
468 |
|
seg4 |
424 |
472 |
Note that: the value showed in above table comes from a single measurement. The PDH signal actually have small variation around 10mV.
Although this measurement is not very much precise, it gives information about the signal coming from each QPD's segment.
[Yuhang, Aritomi]