NAOJ GW Elog Logbook 3.2

I mwasured the power loss due to detection point is not exactly the point of reflection and transmission.
For reflection, we lose 1%(0.12mW) of power. For transmission we lose 0.8%(0.097mW) of power.
So the loss of 2.56mW cannot be explained by this.
Manuel, Matteo B, Eleonora.
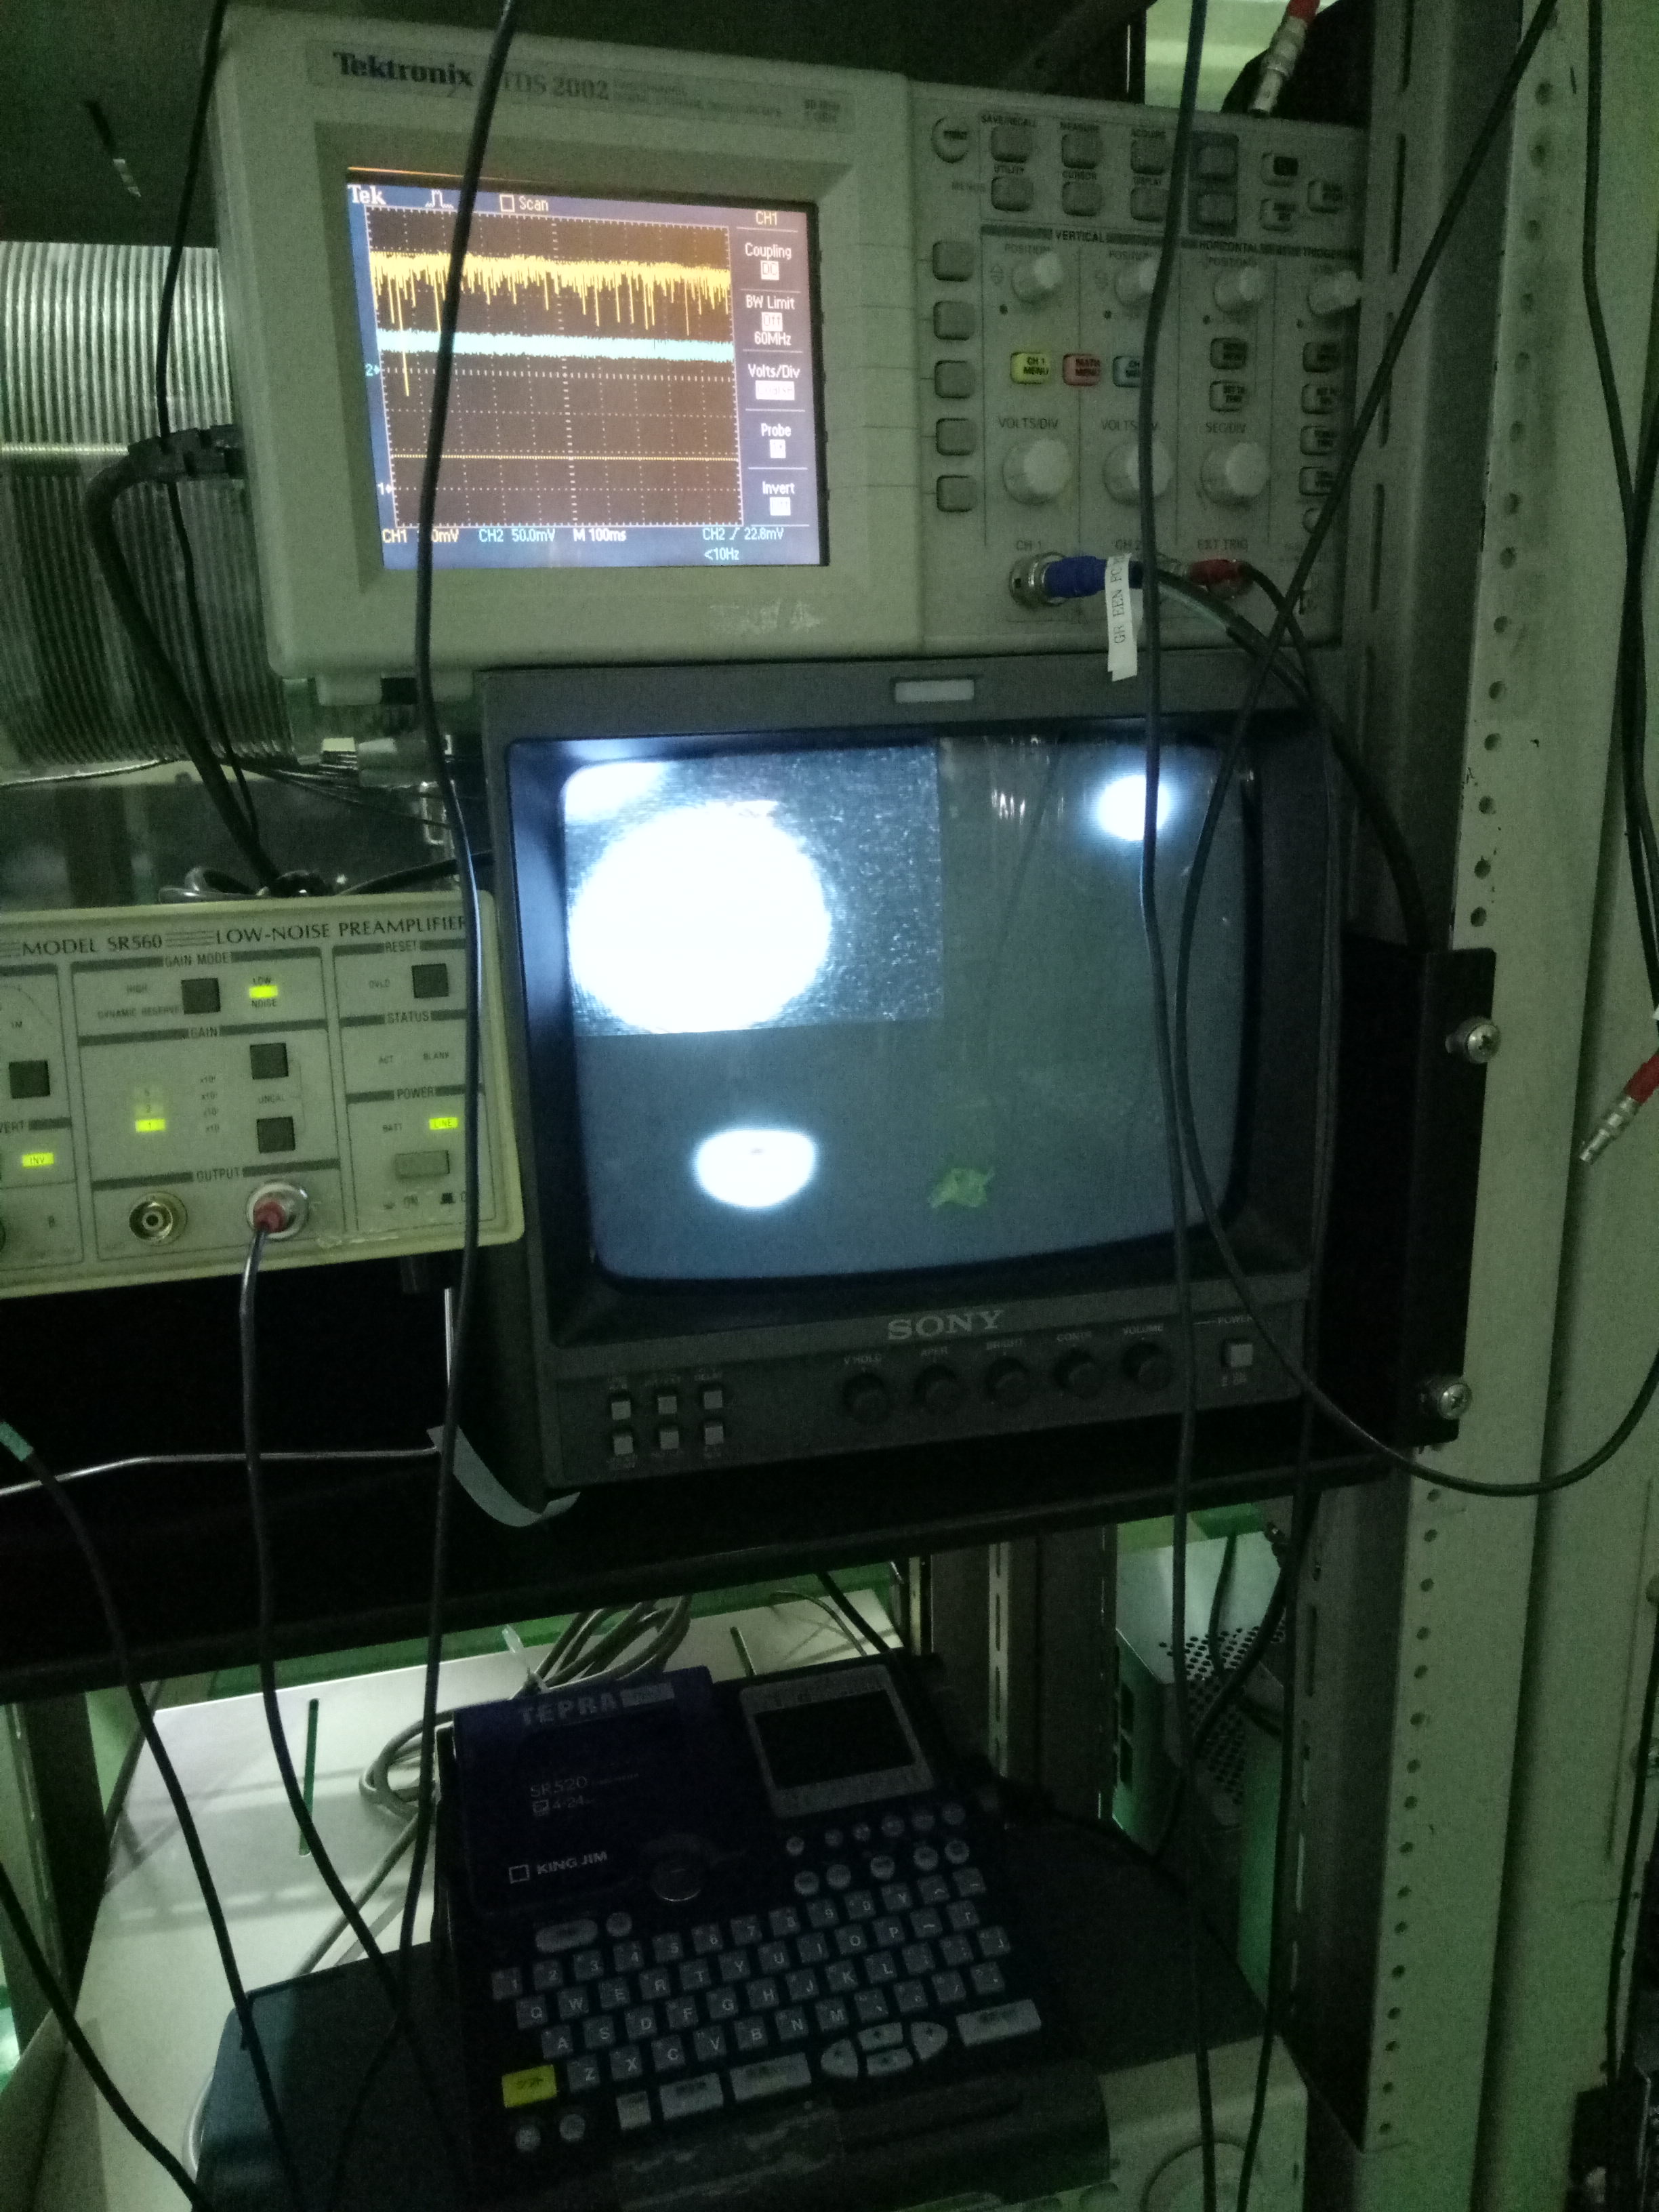
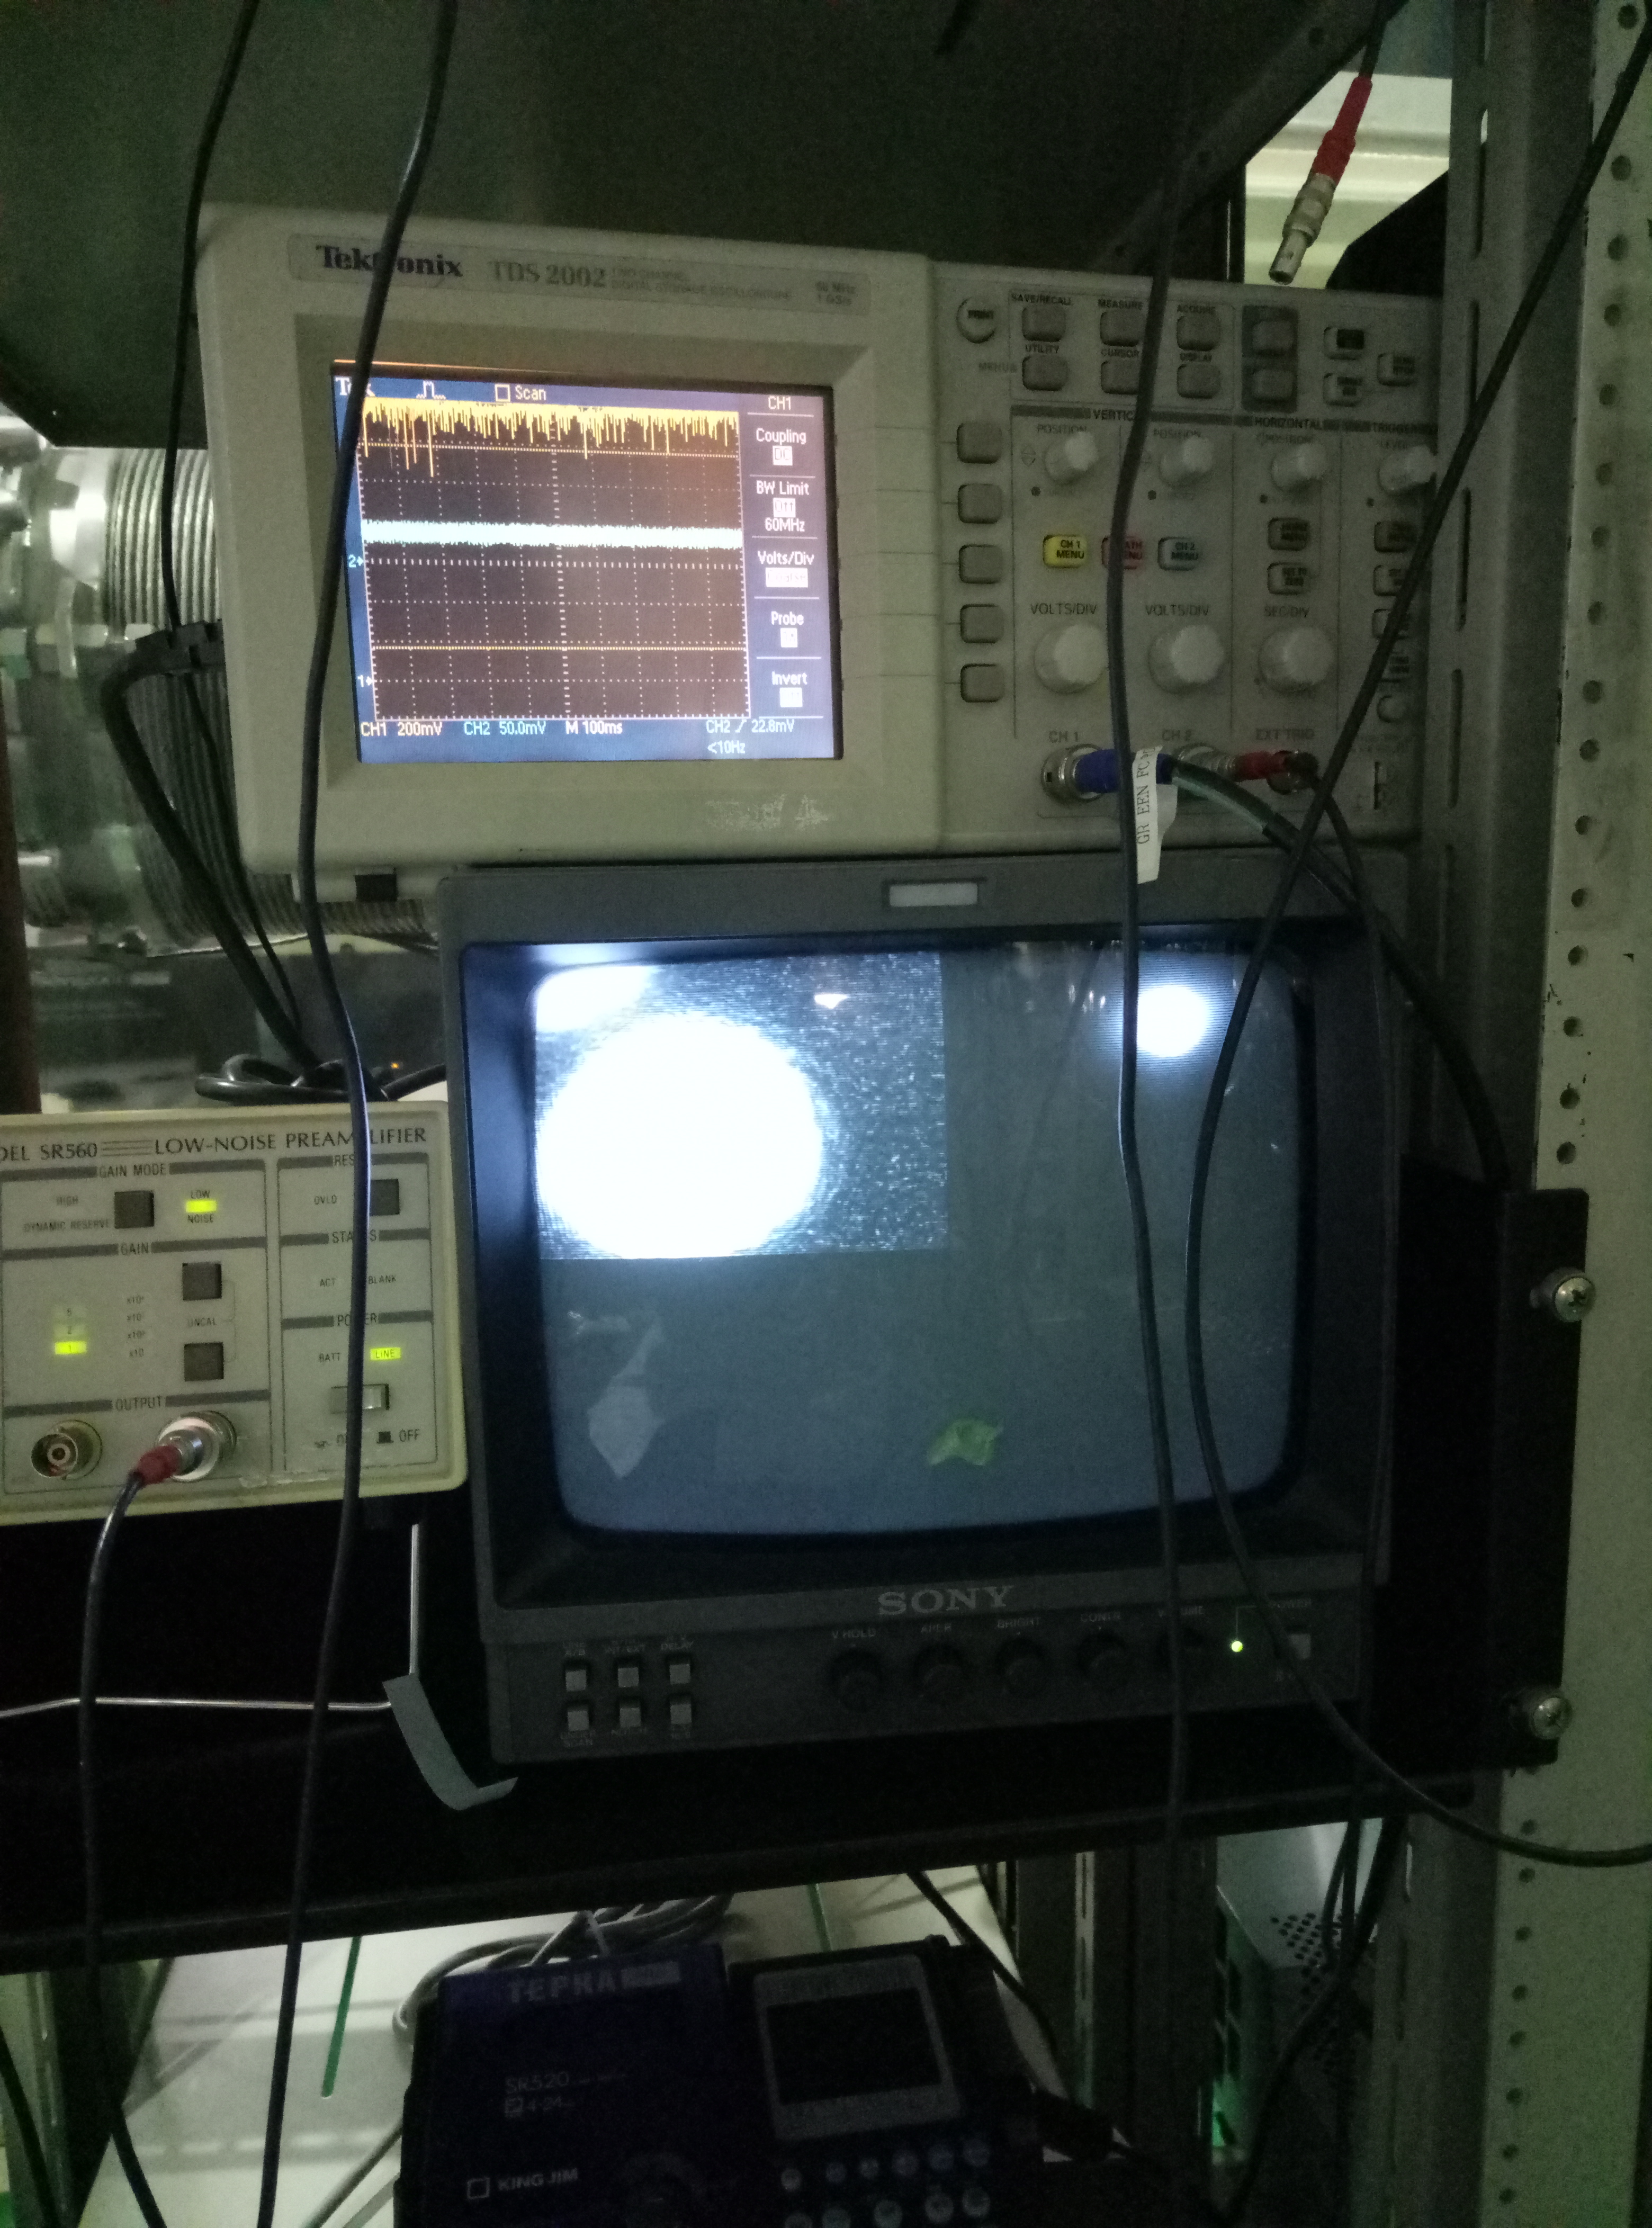
I recorded a first video of the signal of the photodiodes on the oscilloscope without control loop .
Channel1 (yellow) is the out-of-loop PD (DET10N) with a load of 6kOhm that gives 104mV of DC.
Channel2 (blue) is the in-loop PD (PM100D) analog output. DC = 470mV
The noise is mostly at high frequencies. The PM100D shows some spikes, while the DET10N doesn't.
The loop consists of a subtraction of an offset from a waveform generator, then a low pass (order one) at 100Hz and a Gain of 1000 (using the sr560)
I recorded a second video around the moment of closing the loop. On the oscilloscope there are the signal of the in-loop photodiode (blue channel), and the correction signal (yellow channel).
It shows that the in loop PD increases the noise when closing the loop. This is because the noise is mostly at high frequencies and the noise reduction at low frequencies doesn't show clearly in the time domain.
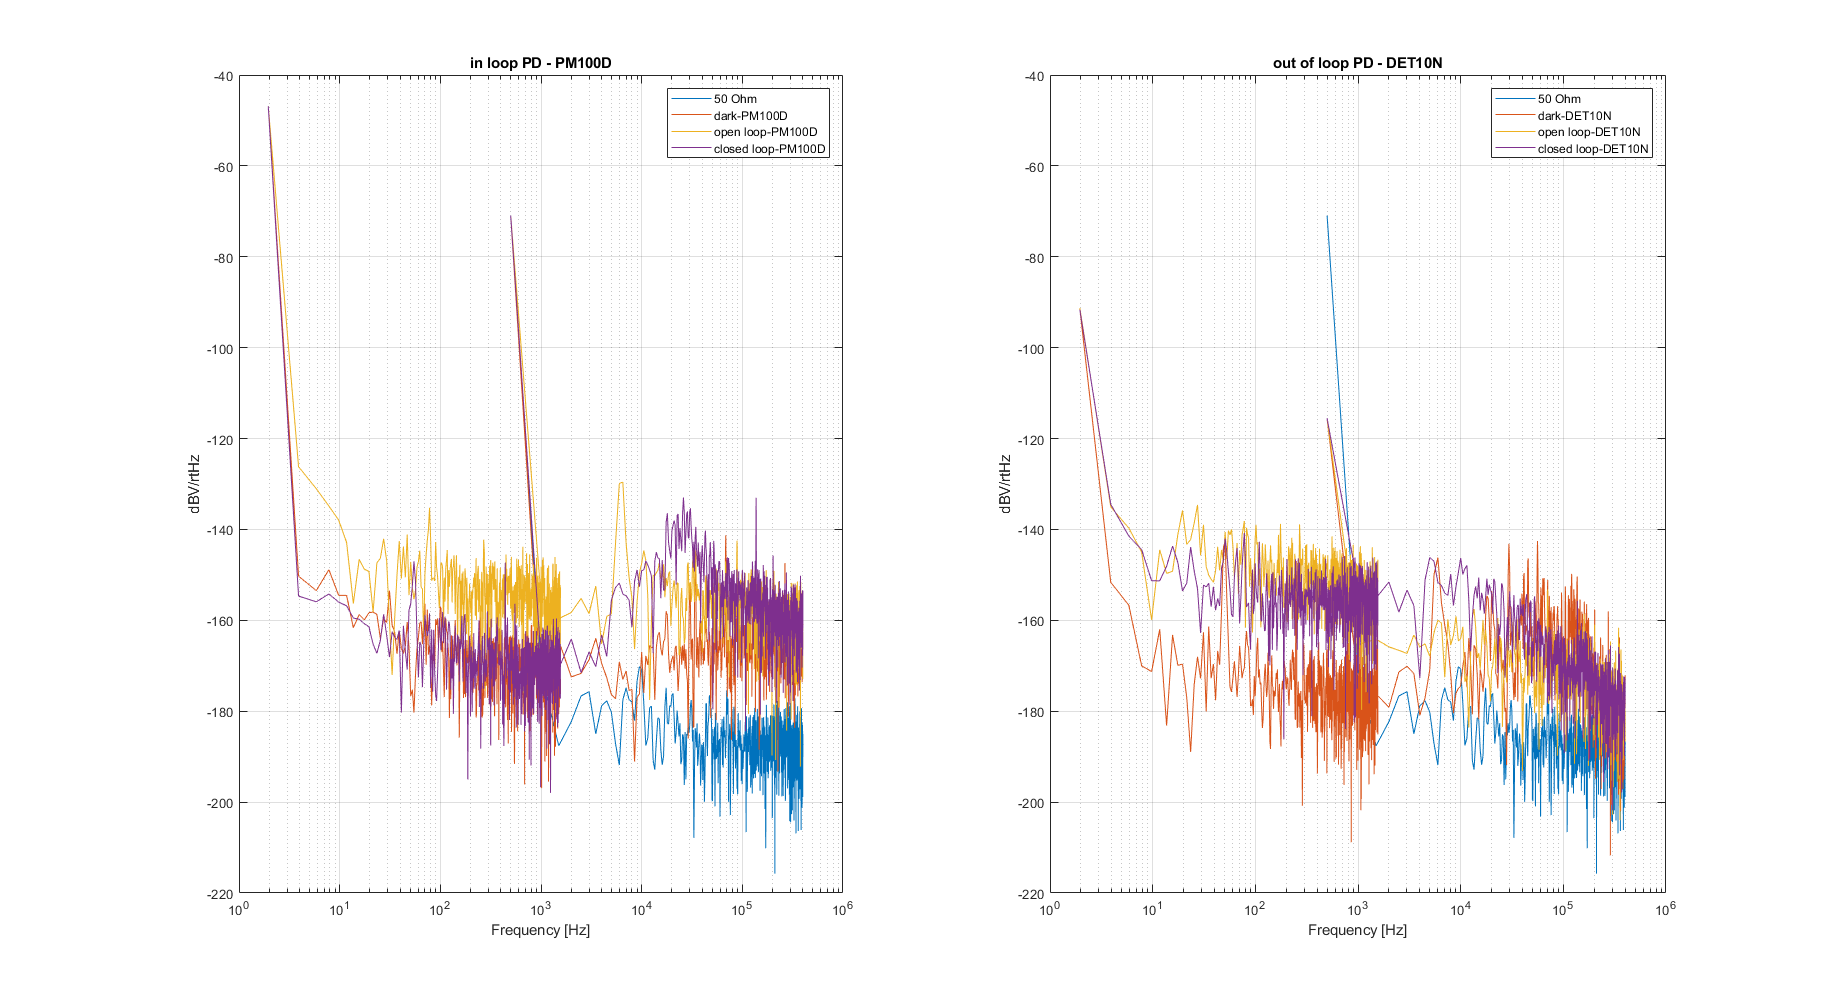
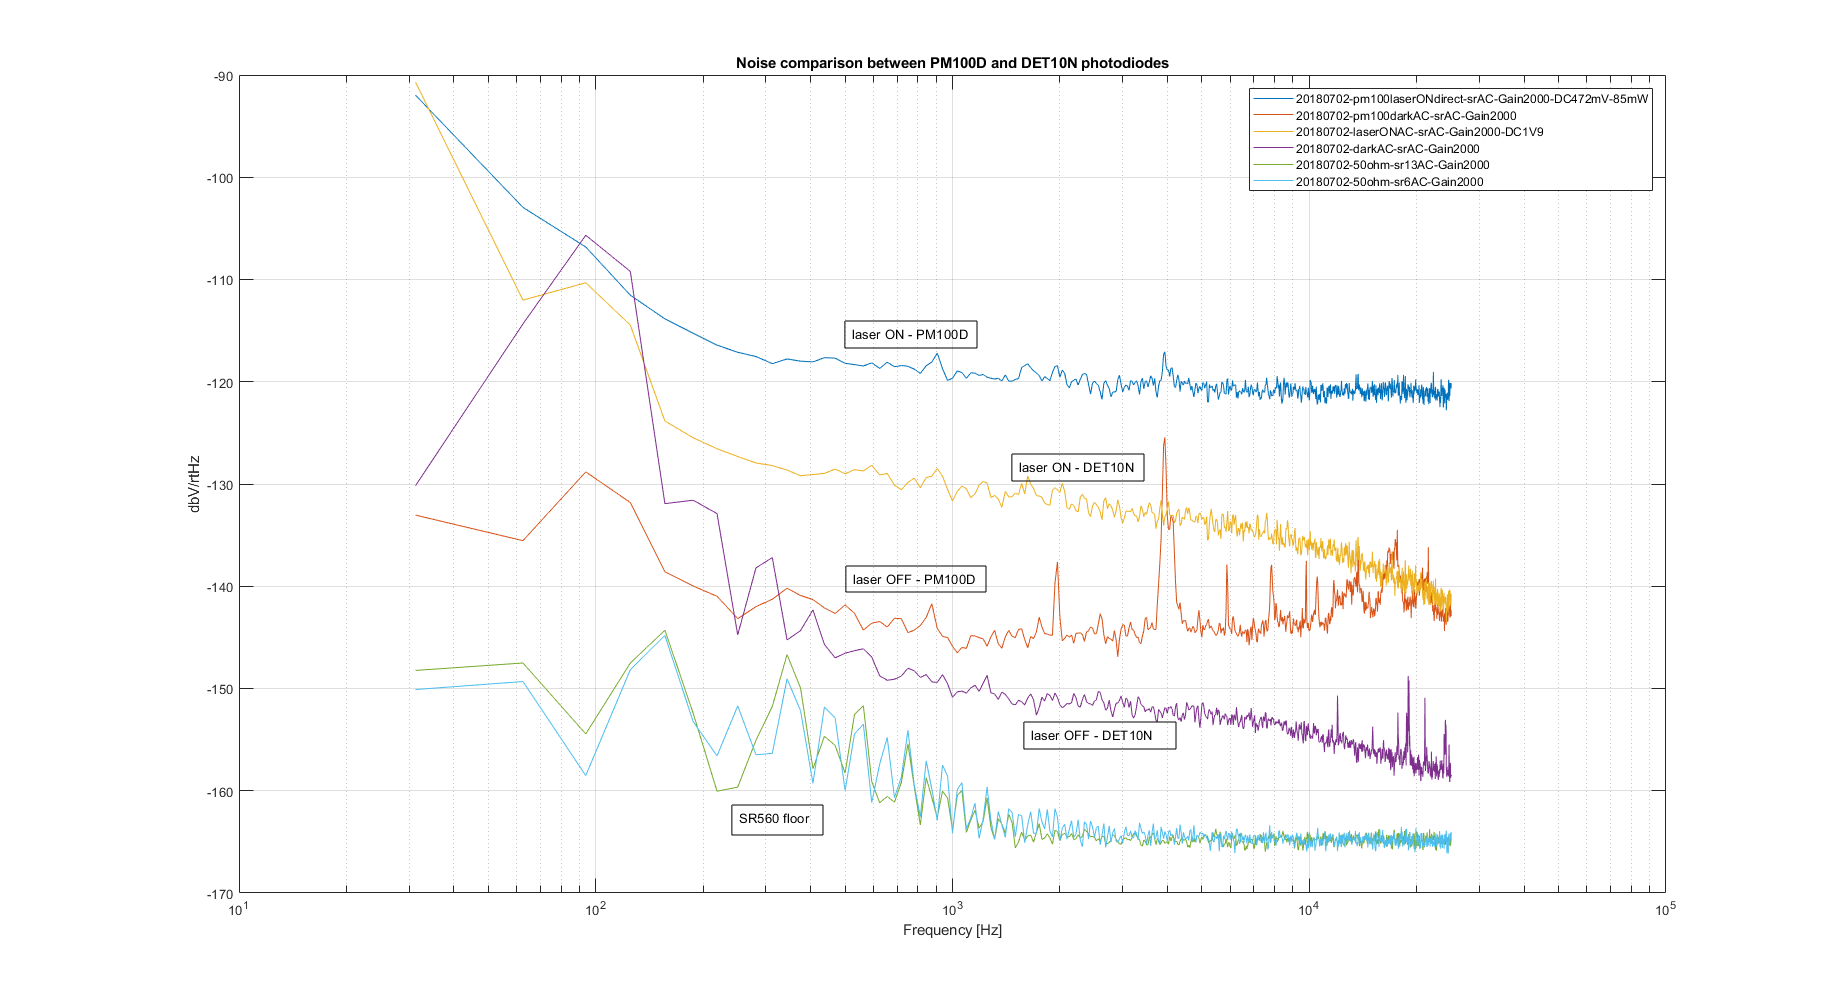
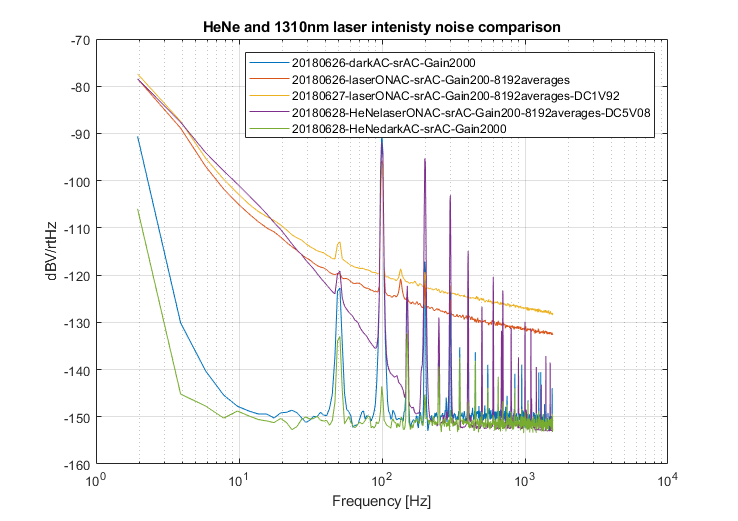
Plot1: I made the spectrum of the 2 PDs in 3 conditions: dark, loop open, loop closed
It shows that the loop works for the inloop PD, but it doesn't for the out of loop PD.
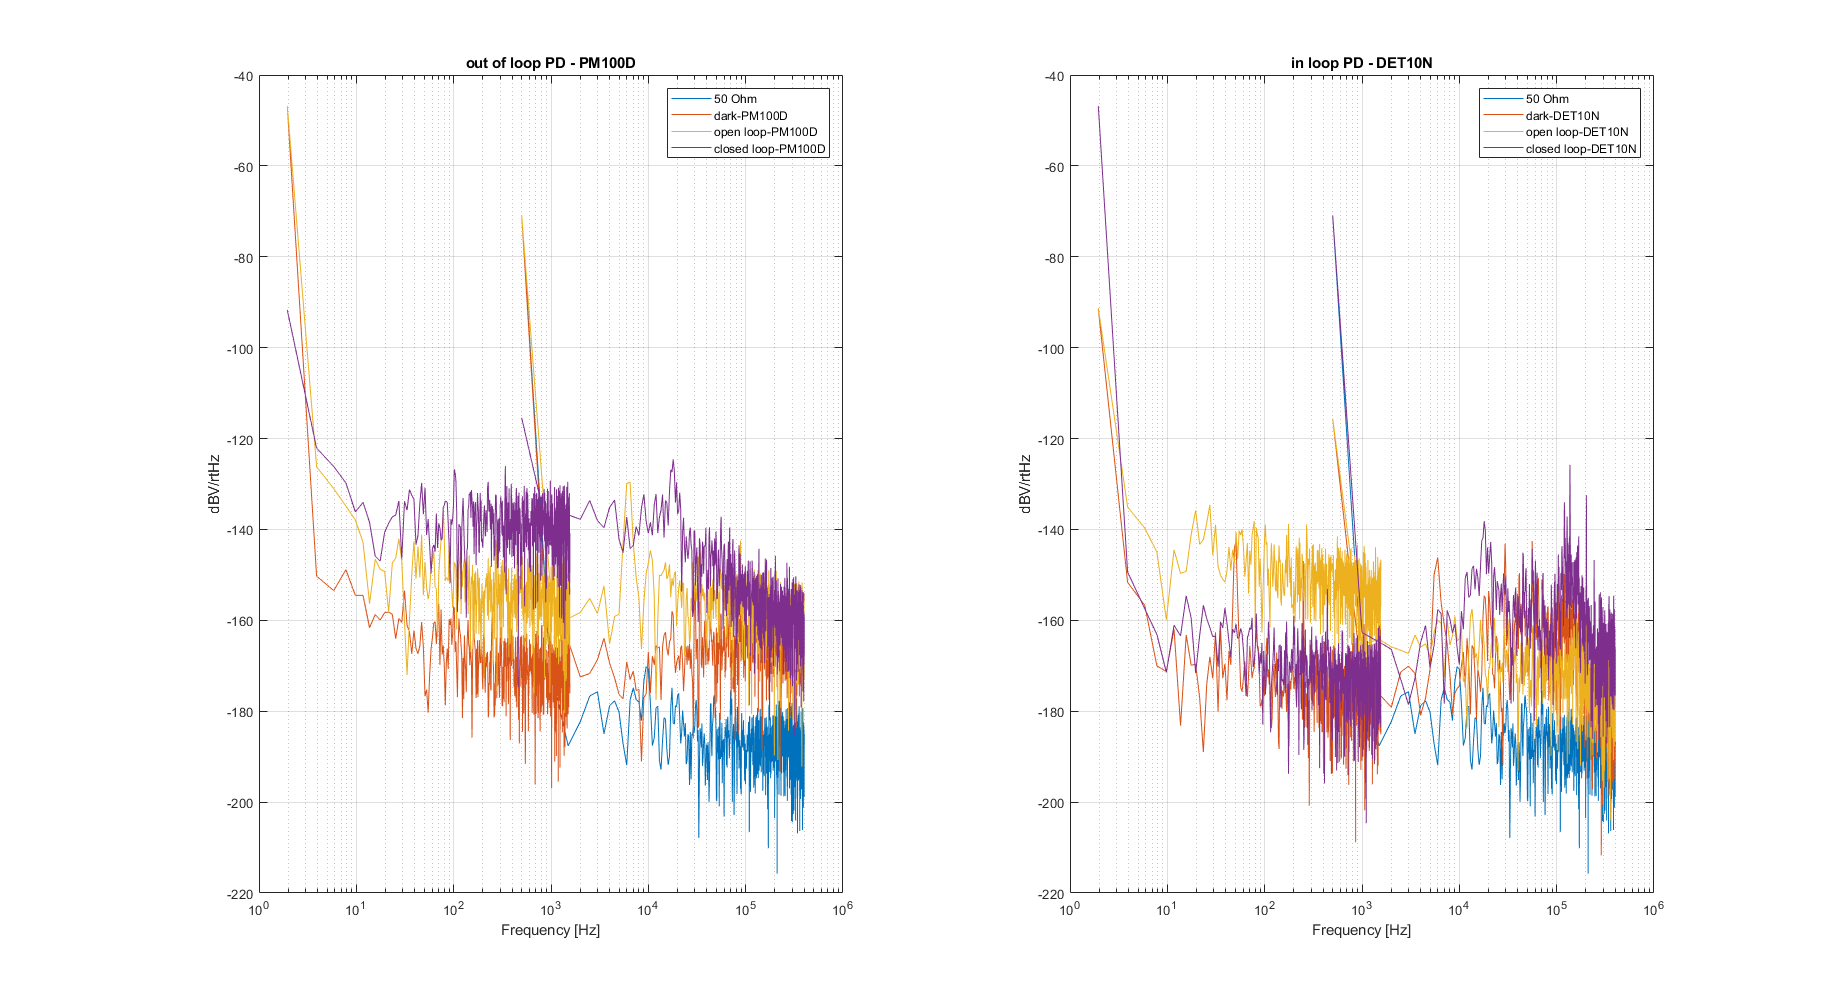
Plot2: I exchanged the two PDs, so in this case the out-of-loop PD is the PM100D and the in-loop PD is the DET10N.
I copied the dark and openloop curves from the plot1 and I updated the closed loop curves. In this case I could increase the gain to 5000.

I repeated the same measurements with another spectrum analyzer, the Agilent35670a
This instrument spectra are much cleaner, I did only 32 averages instead of 256 with the Yokogawa sa2400
First plot: gain 1000 in-loop pd: PM100D
Second plot: gain 1000 in-loop pd: DET10N
Third plot: gain 5000 in-loop pd: DET10N
Participiant: Yuefan and Yuhang
Today we locked the MC and Mach-Zehnder(MZ). We found some problems while locking.
1. The lock of MC sometimes has drifting. It brings the locking point to a lower point.
2. The error signal for MZ locking has a fixed frequency oscillation.
3. Sometimes we can see the MC transmission goes away very large.
We tried to make sure the MC transmission has the same level and then make the measurement.
| input(unlock) | 27.51mW | 0.002 |
| reflec(lock) | 11.96mW | 0.002 |
| trans(lock) | 12.17mW | 0.007 |
| end mirror loss | 0.814mW | Nan |
The second cloumn is the averange power. The third cloumn is the standard deviation normalized by the averange power.
Note: the end mirror loss is diffcult to measure, so I take only one measurement.
So reflection is 43.48%, transmission is 44.24%, end mirror tans is 2.96%. We loss 2.56mW (9.32%).
I mwasured the power loss due to detection point is not exactly the point of reflection and transmission.
For reflection, we lose 1%(0.12mW) of power. For transmission we lose 0.8%(0.097mW) of power.
So the loss of 2.56mW cannot be explained by this.
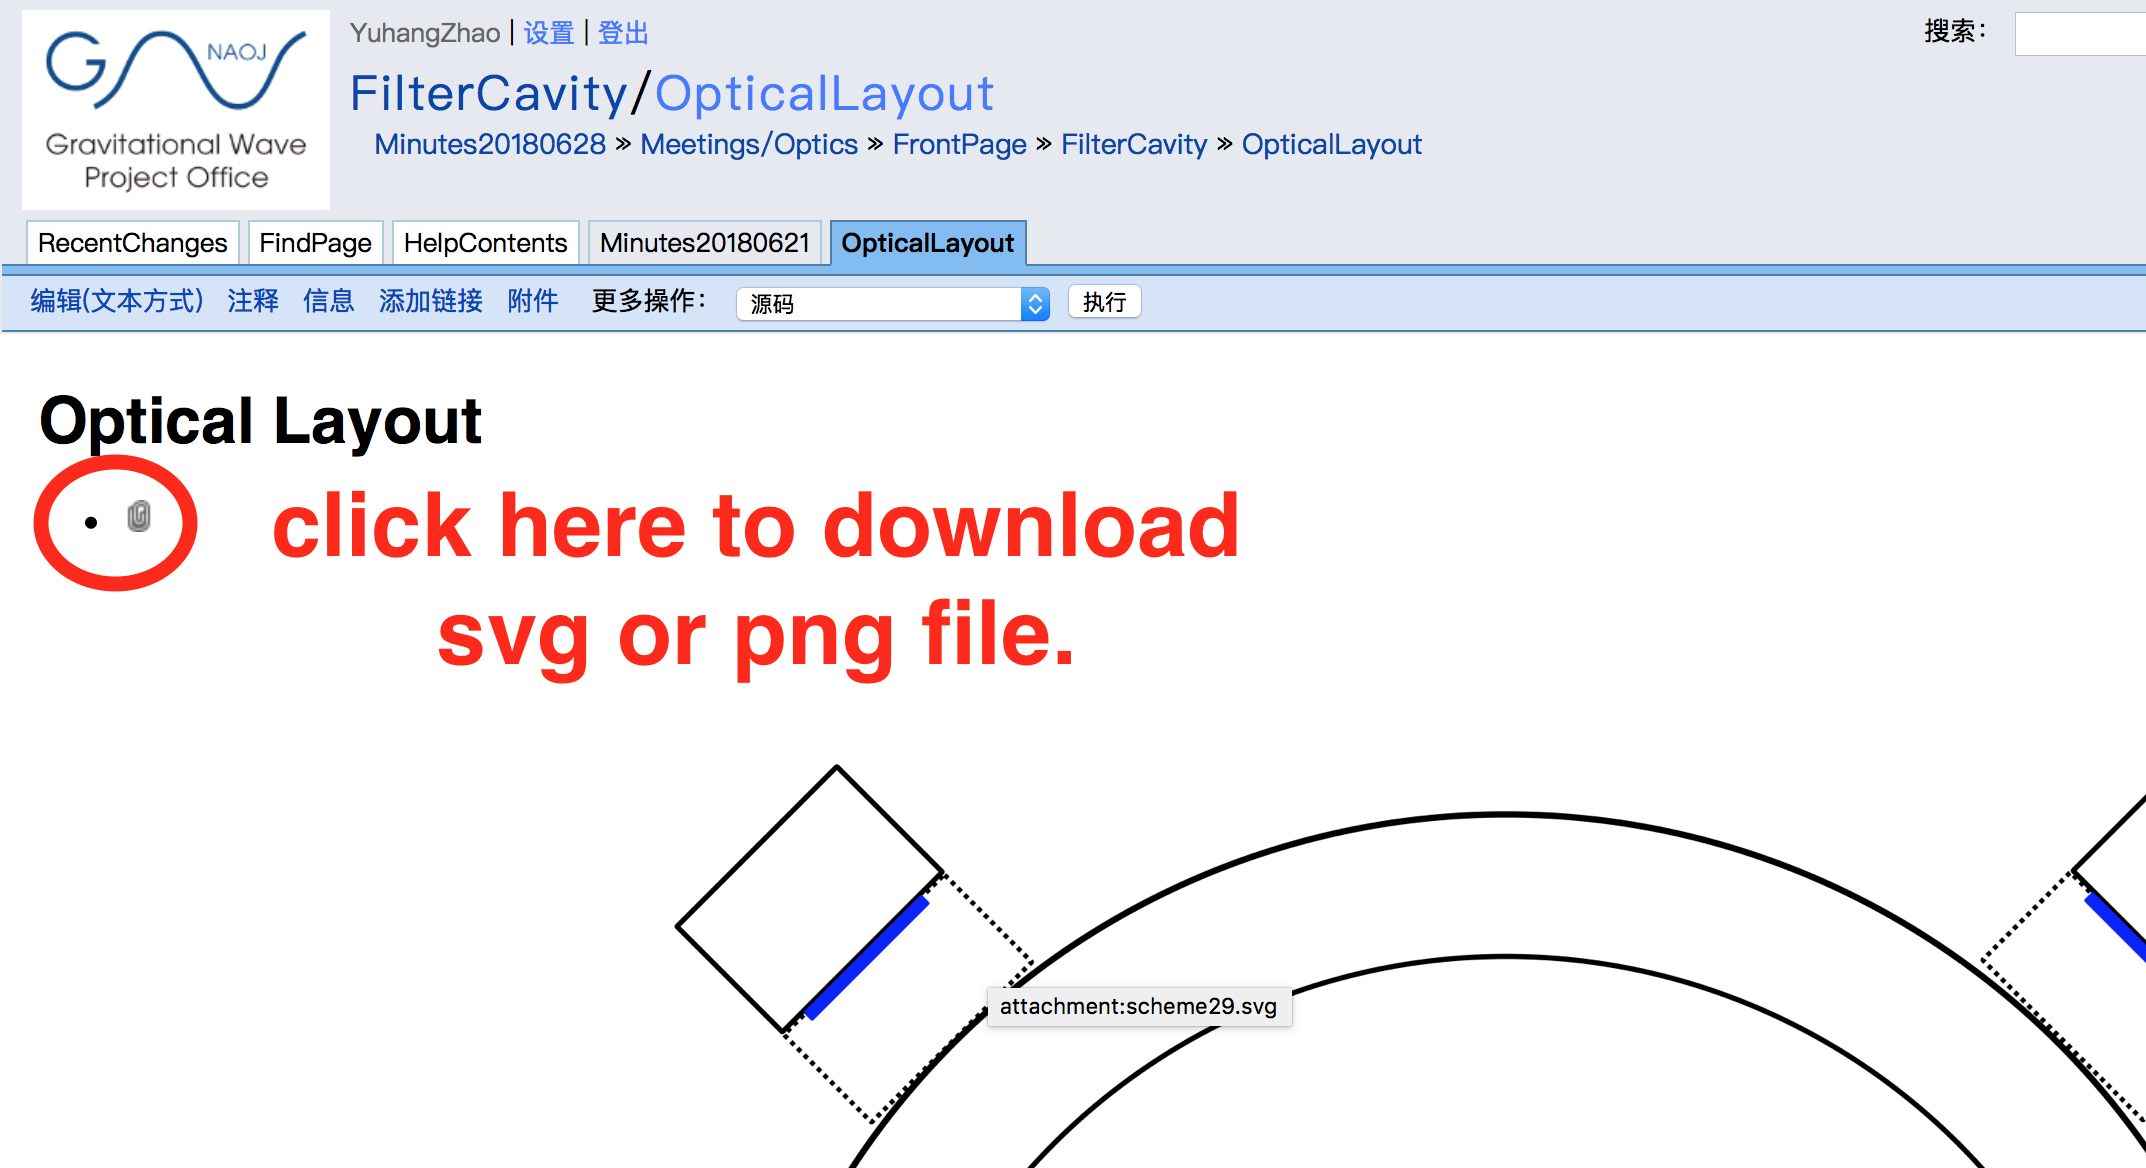
Please refer to wiki page.
https://gwpo.nao.ac.jp/wiki/FilterCavity/OpticalLayout
You can download if you want. Refer the instruction from the attached figure.
Are the values given above now confirmed?
P_in = 22 mW
P_tra = 8.5 mW
P_ref = 10.5 mW
P_tra from end mirror = 0.5 mW
Missing = 2.5 mW
Are the 2.5 mW still missing?
[Eleonora, Matteo B.]
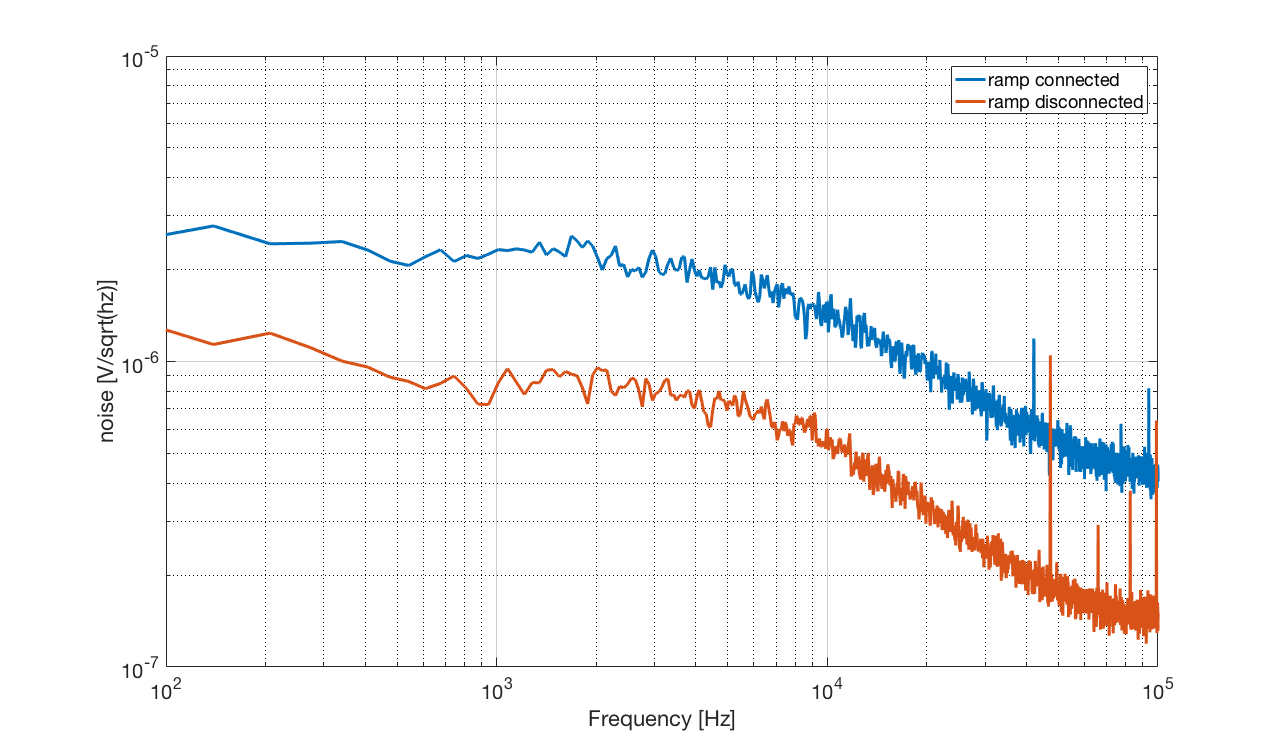
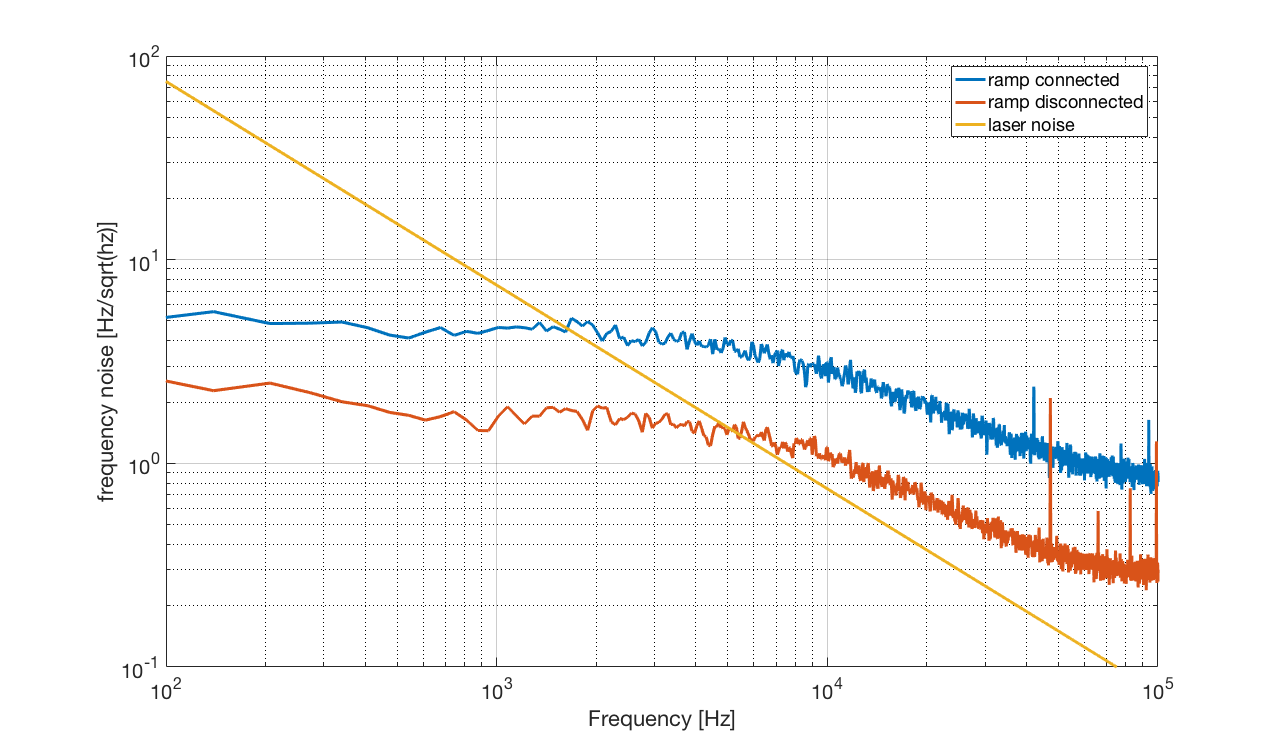
We have measured the rampeuto PZT output noise by connecting the PZT output to the spectrum analyzer. It is about 2 uV/sqrt(Hz) at low frequency and it starts to decrease above 5 kHz, as can be seen from pic 1 (blue curve)
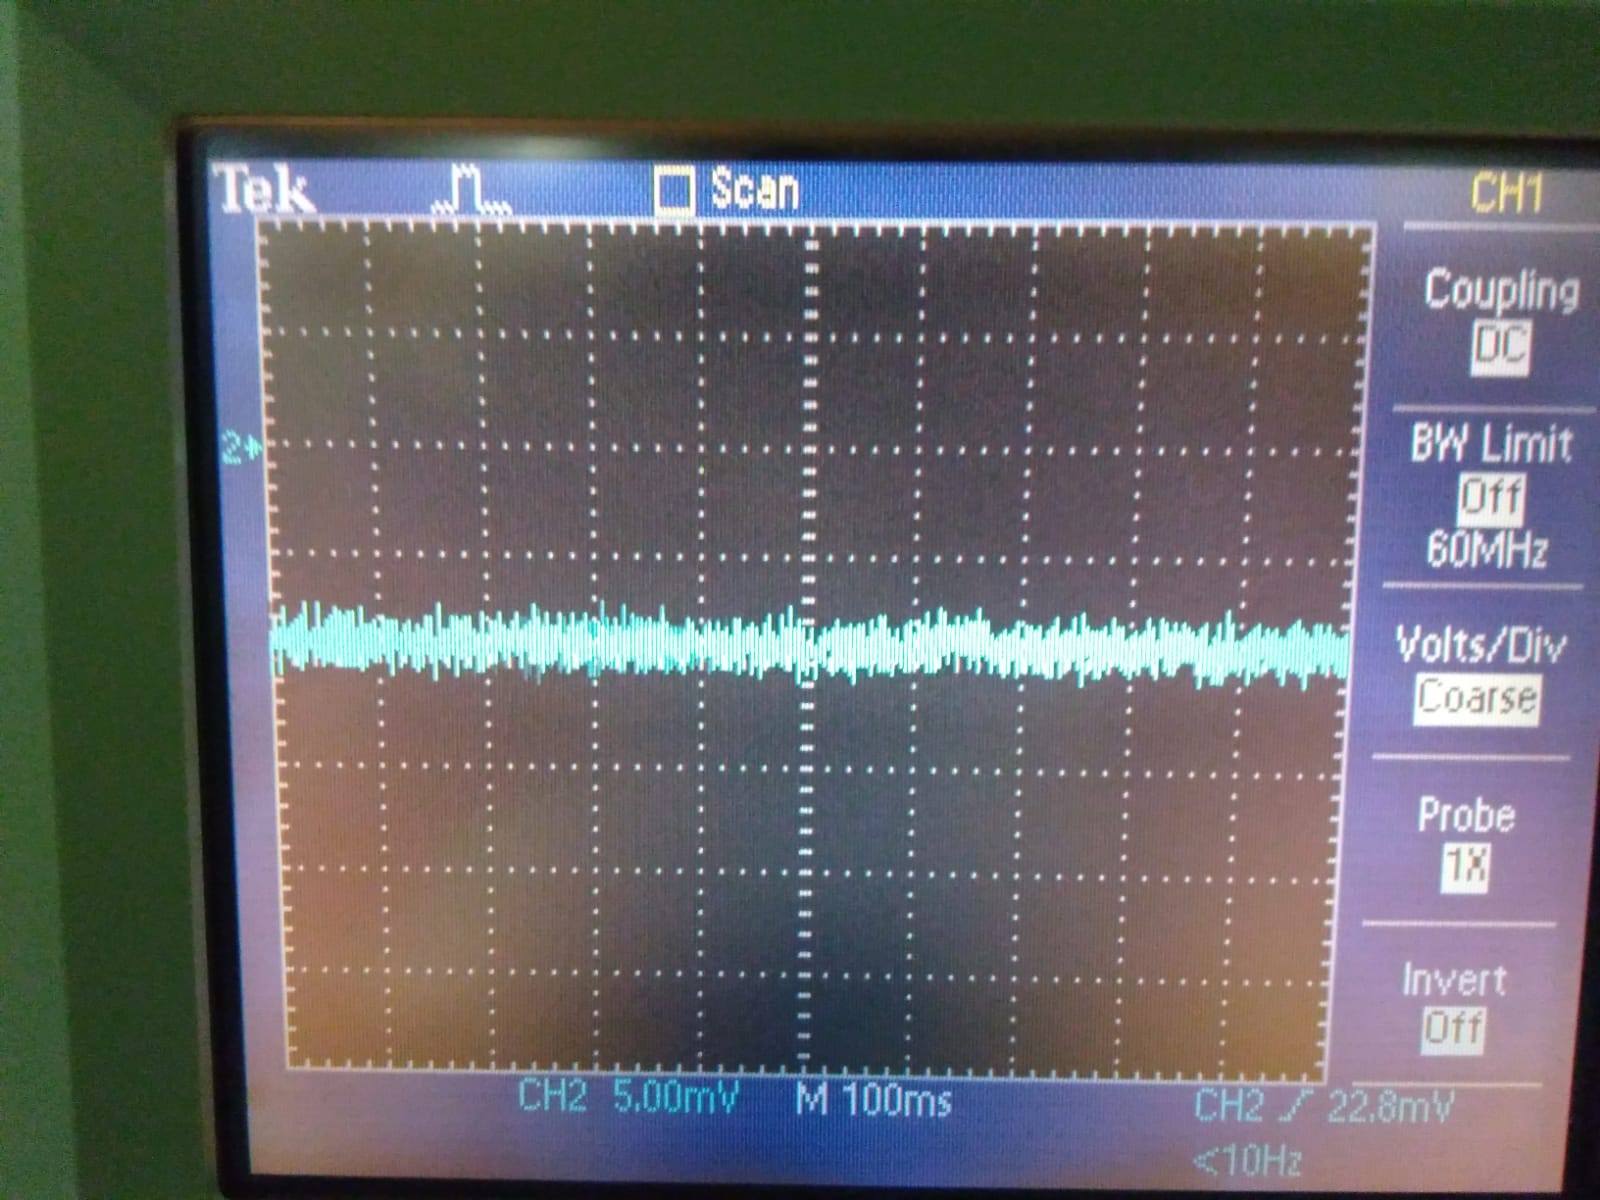
We also observed with the oscilloscope that there is an offset of -10mV. (pic 2).
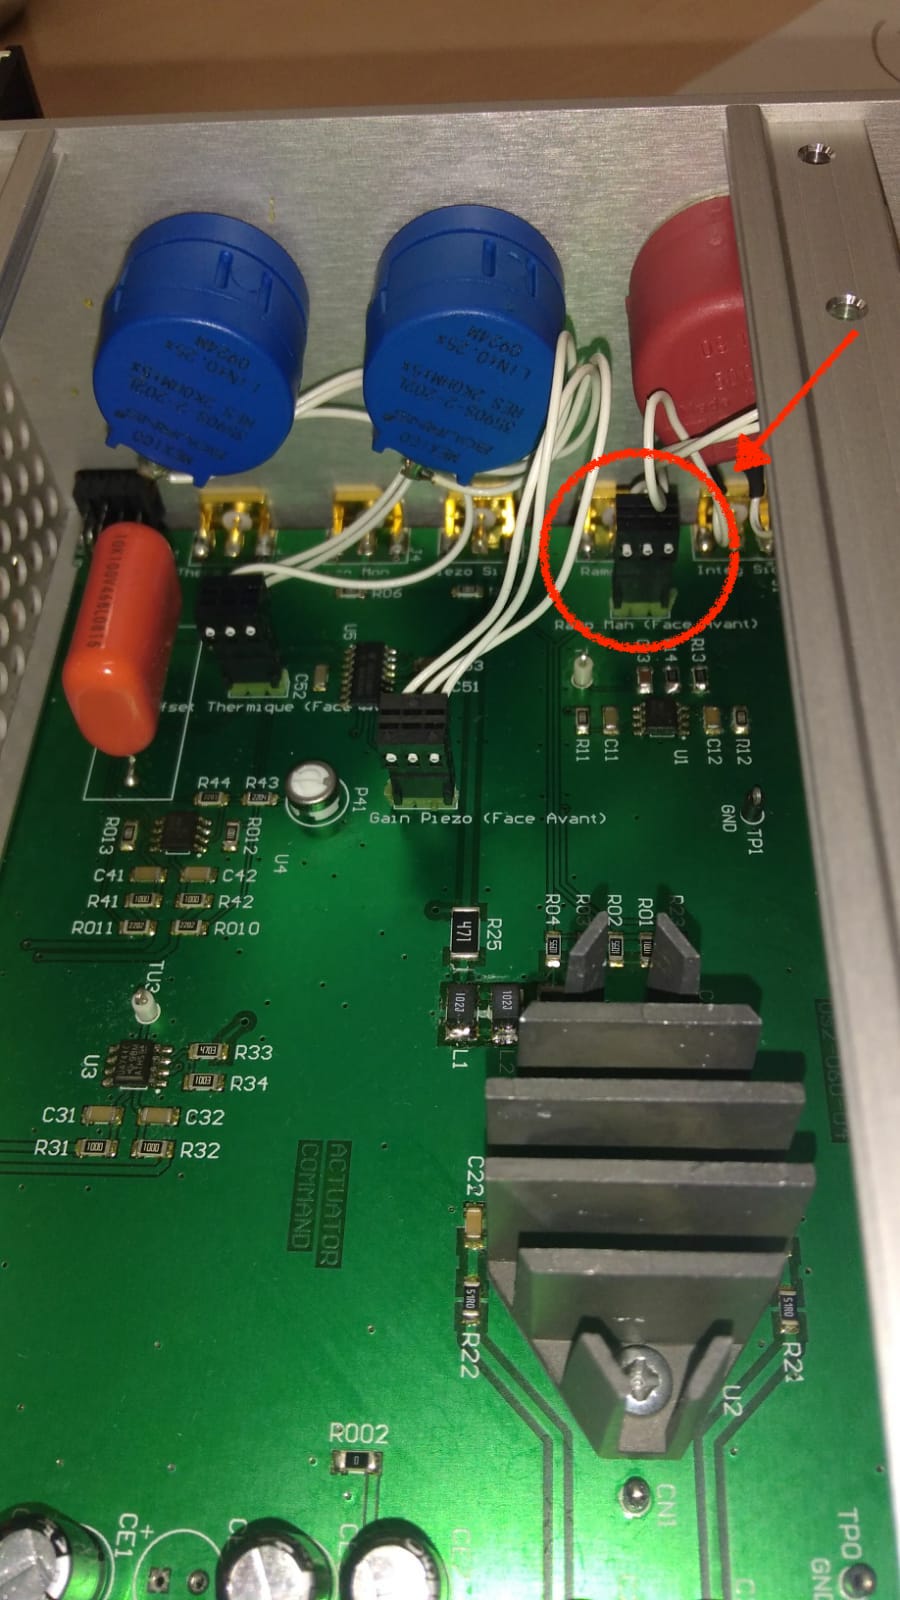
In order to reduce the rampeauto output noise, following the advice of Pierre, we have disconnected the ramp input (which normaly is not used for suspended cavities). (pic 3)
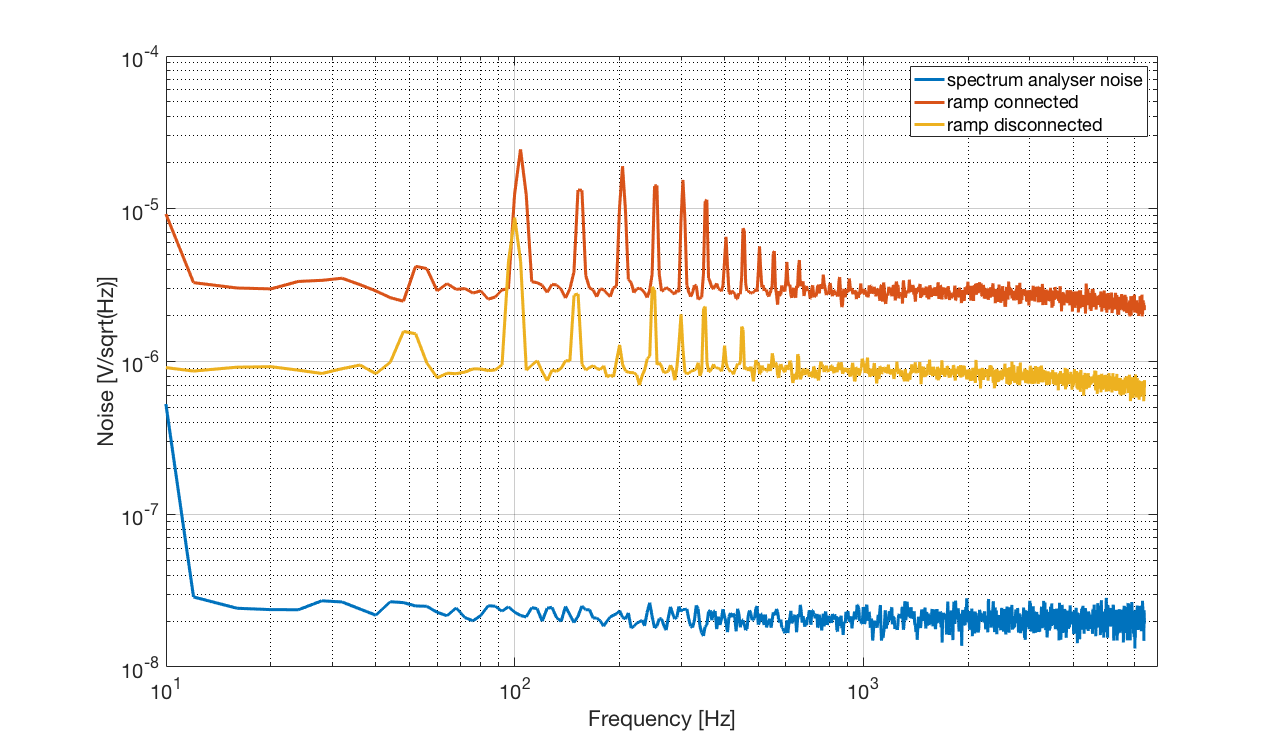
The output noise has been reduced by a factor 3 and now it is about 800 nV/sqrt(Hz), below 5 kHz. (see pic. 1 and 4)
In pic 5, we have compared the rampeauto noise (actuation noise) with the free running laser noise and found that it becomes dominant above 2 kHz.
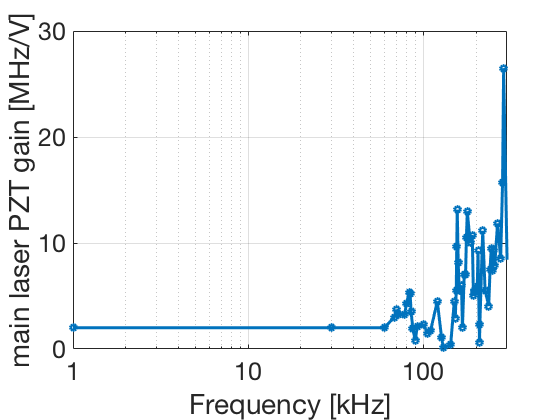
For the conversion to Hz we used a piezo gain of 2 MHz/V, as measeured in entry #859.
The next step is to re-measure the phase noise, as done in entry #863, with this new configuration.
We compare the green error signal spectrum before and after the disconnection of Ramp injection point in the circuit. We can see the noise level is reduced by a factor up to 3 from 2kHz.
Participaint: Eleonora, Matteo Barsuglia and Yuhang.
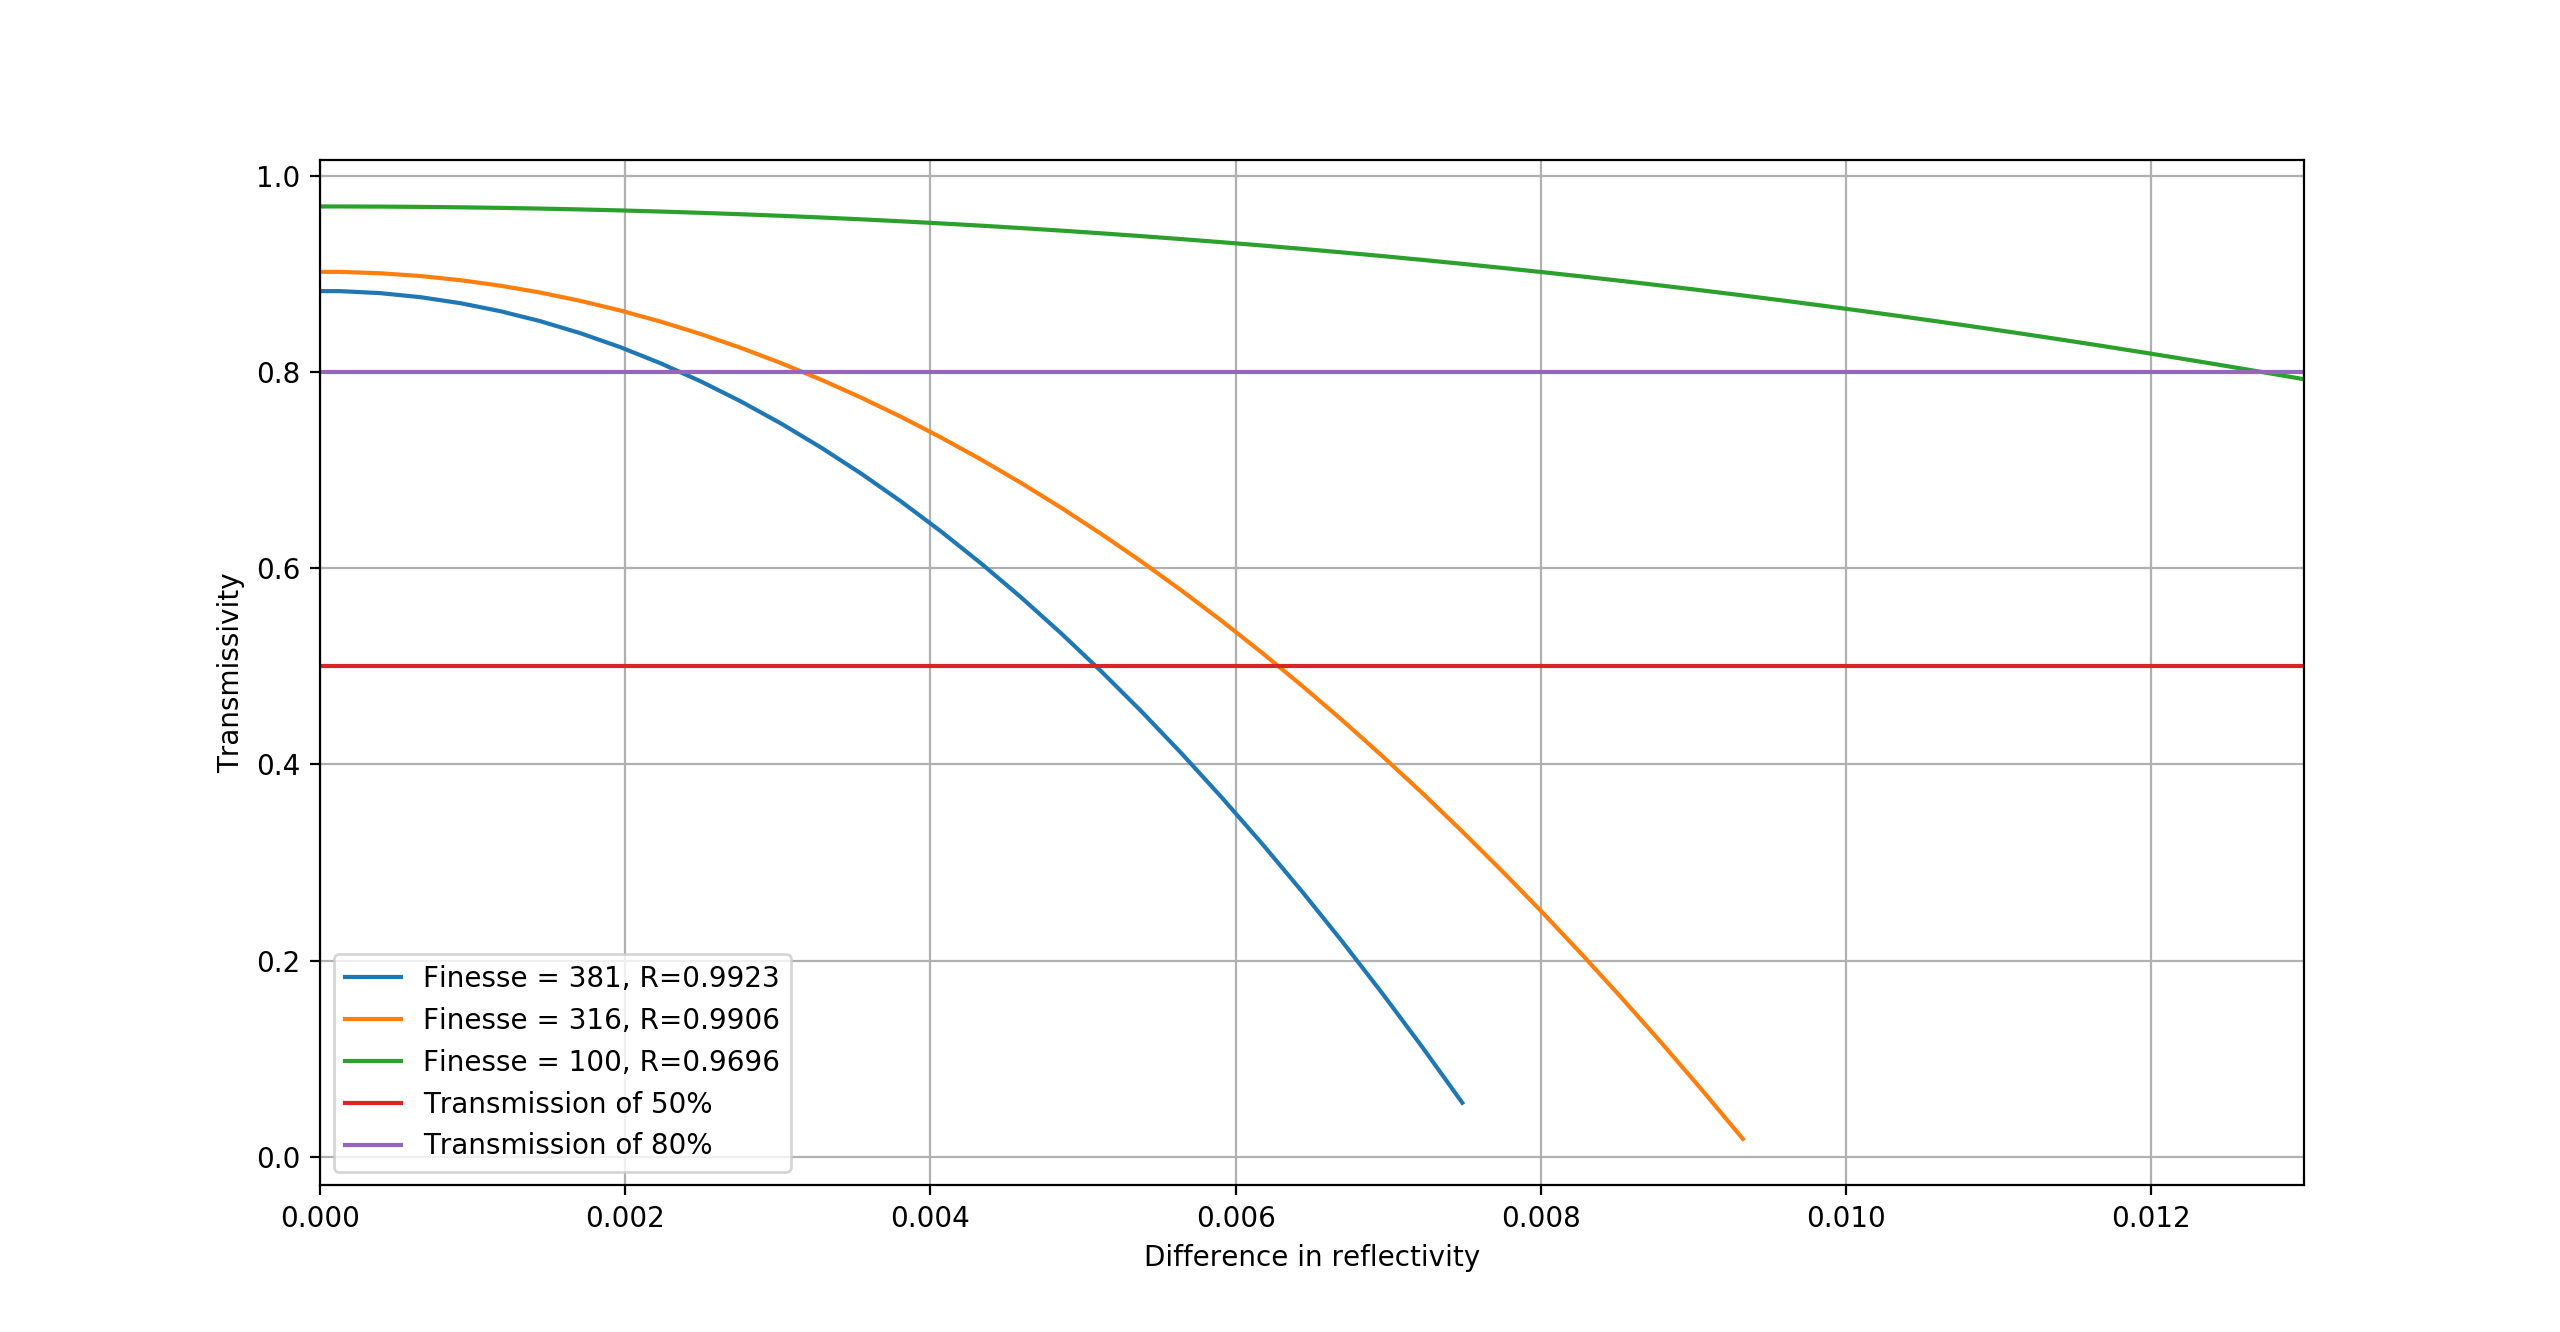
As we found before, the transmissivity of mode cleaner is not as expected. We also found for different Finesse requirement, we can have different tolerance of reflectivity error.
According to the measurement result of entry871 and entry548, we firstly get the reflectivity of mirror (r) and then we use this result and scan the reflectivity amplitude from 0 to 0.13.
We put this difference to each mirror as delta/2, for example we use r_1=r+delta/2, r_2=r-delta/2. However, when we convert this amplitude difference to power difference, we bring back a factor of 2. So they balance.
We also plot the case for Finesse as 100. As the experience of Matteo Barsuglia, this Finesse can give us 99% of clean to have TEM00. And we can increase reflectivity difference tolerance dramatically. For details, refer to attahced figure.
We also investigate the reason of higher transmission with lower Finesse. The reason is we loss some of the power through the end mirror of mode cleaner. The higher the Finesse is, the more losses we have.
Participaint: Yuhang and Eleonora
It is necessary to fit the opto-mechanical transfer function and filter design, otherwise we cannot use zpk function in matlab. We did this by using proper poles and zeros in proper frequencies.
The zeros I used (corresponding q factor): 7250,13800,500,14600,25500,42000,31000,18100,21500(25,14,0.01,4,15,40,35,12,5)
The poles I used(corresponding q factor): 7000,12000,5000,8000,14800,16500,18900,26500,30000,34000,35900,46000,44900(12,15,0.03,0.6,6,18,10,2,10,10,2,0.8,30)
The gain is 28 at 100Hz.
I tried to put a low pass filter at 200Hz(q=0) with a gain of 20. And an intergrator at 0Hz(q=0). Finally a notch filter between 6950Hz(q=6) and 7550Hz(q=10).
Then I got unity gain frequency of 376Hz with 34 degrees of phase margin. The plot is in attahced Fig. 2 and blue line is data, red line is OLTF, green line is filter.
Manuel, Eleonora
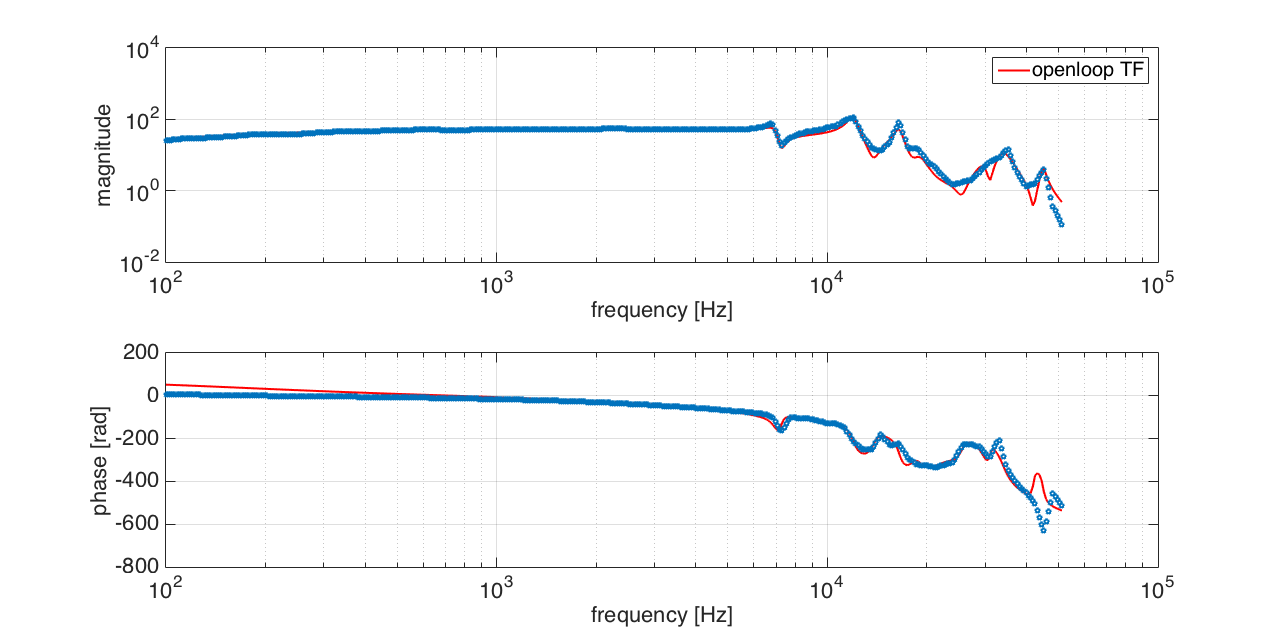
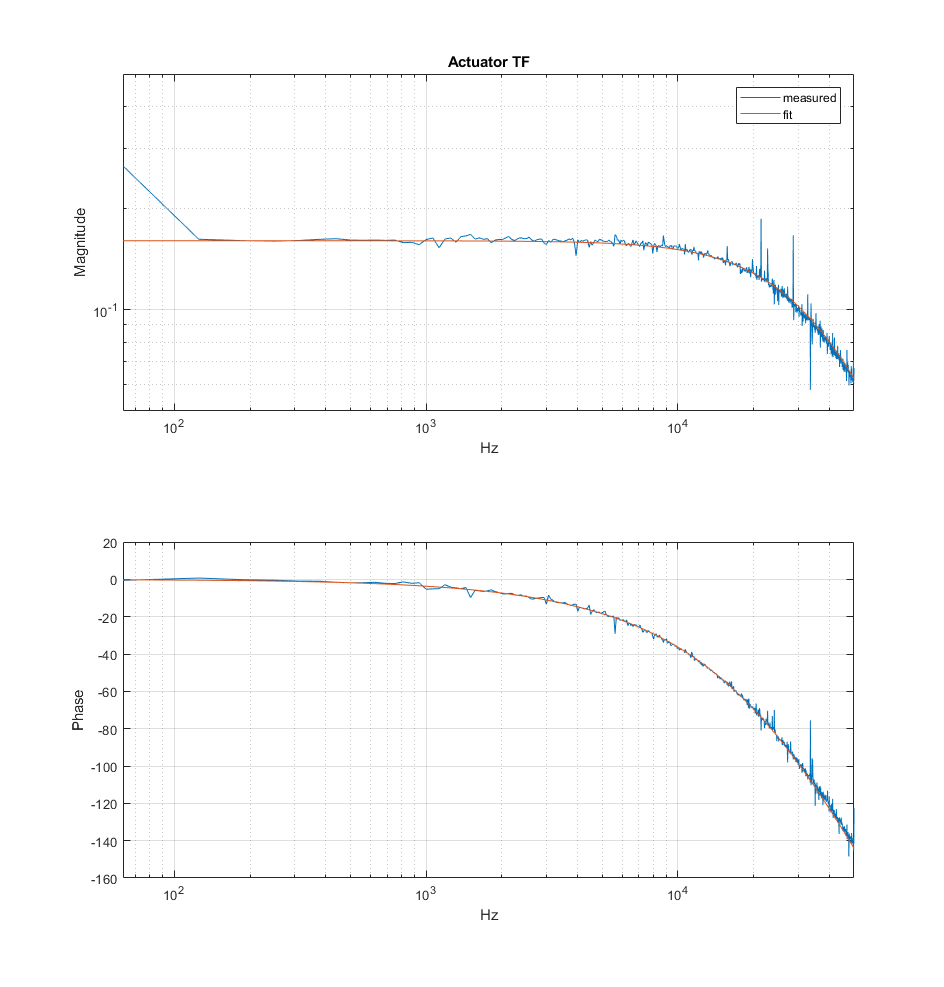
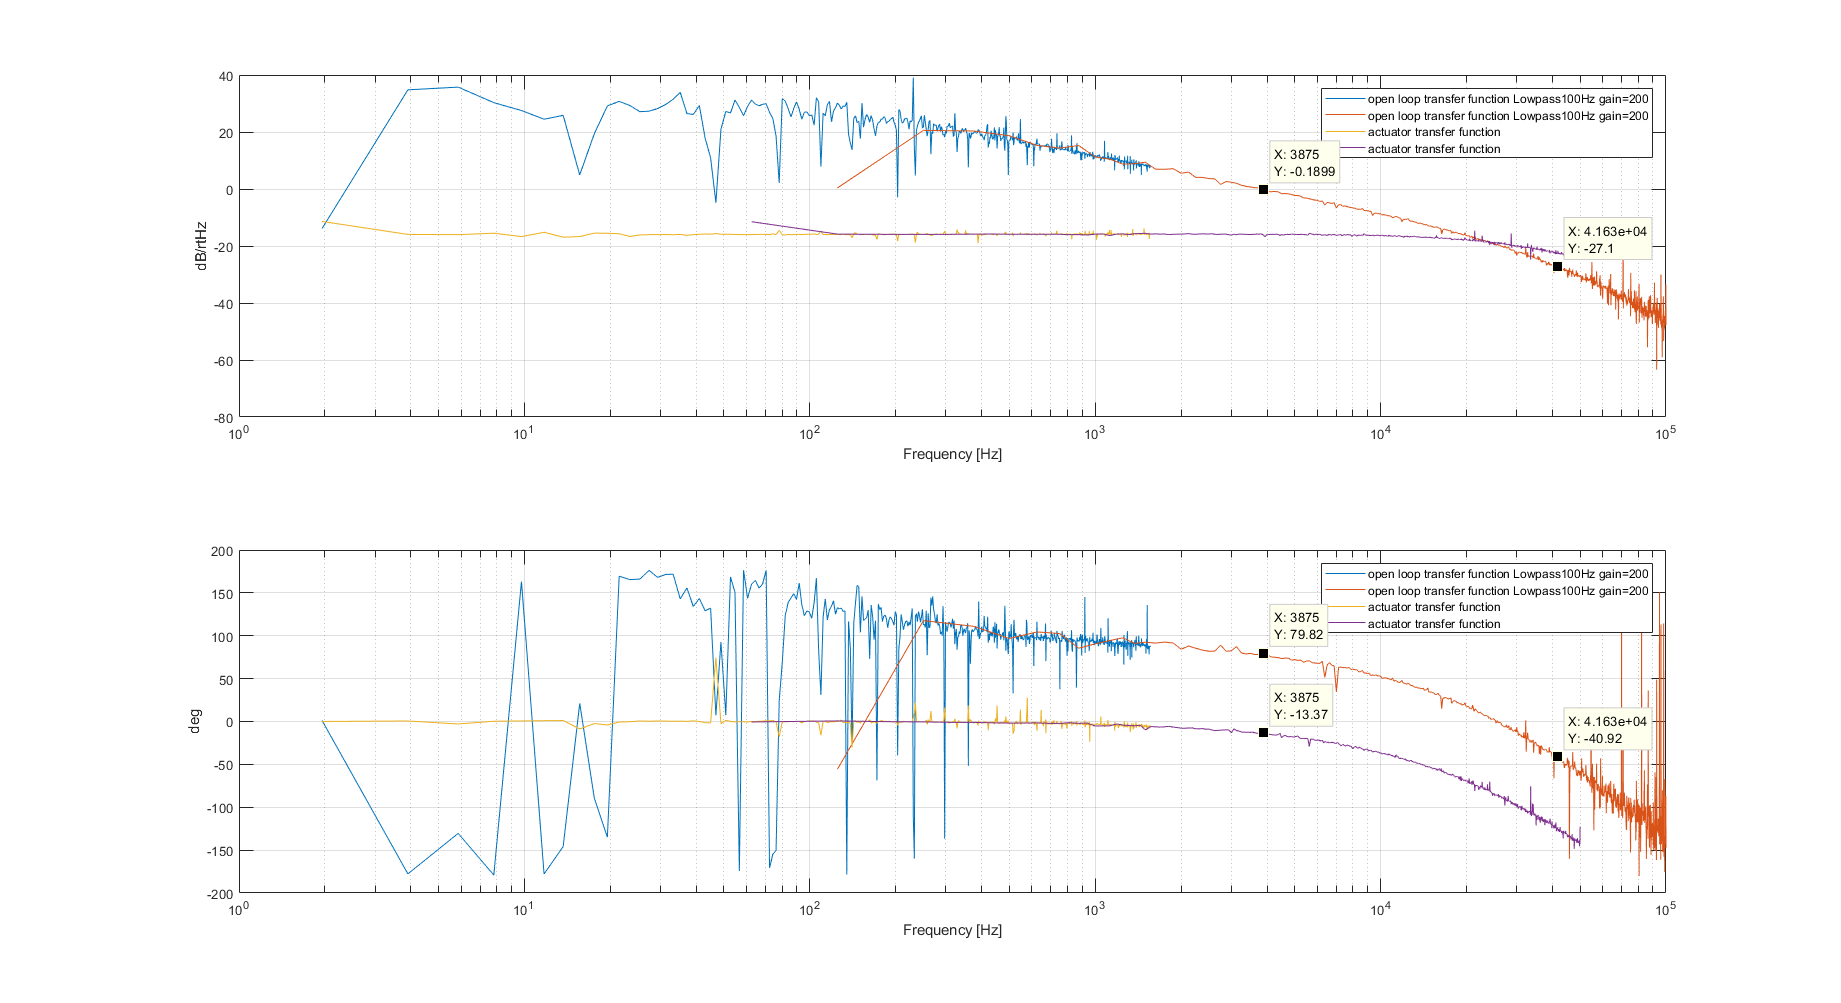
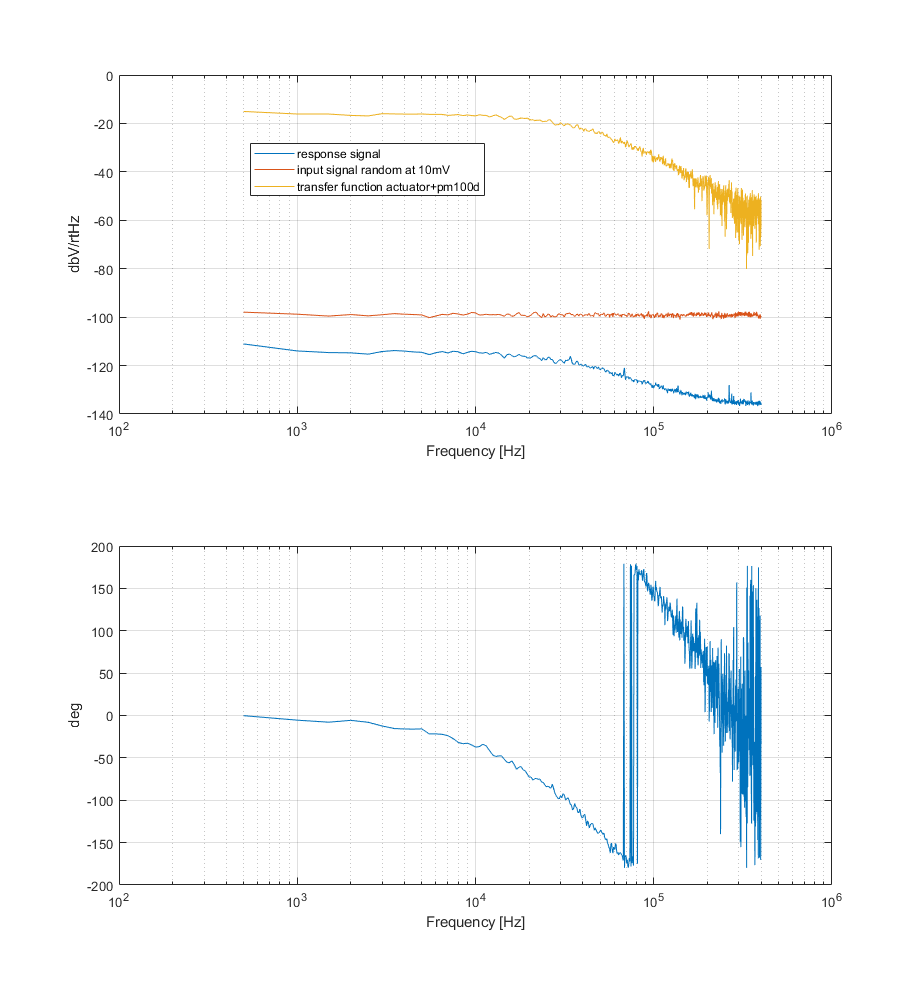
We plotted the transfer function of the measured actuator (plant) and fitted it with a Matlab script based on the zpk function.
We used two simple poles at 40kHz, a gain of 0.16 in DC, and a delay of 2.3e-6. see the first plot
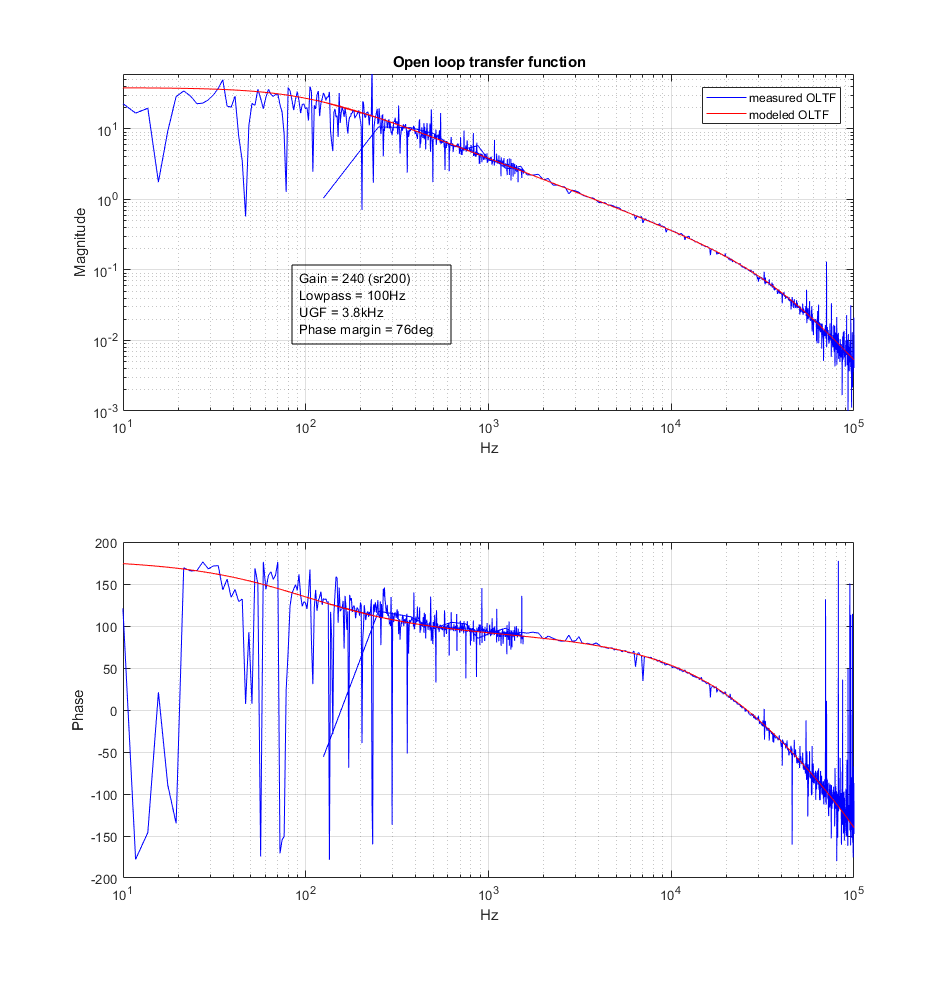
We plot the measured open loop TF obtained using a sr560 set with a first order low pass filter at 100Hz, a gain of 200.
We fitted it as the product of the modeled plant TF and a filter TF.
The filter that best fits the data is a first order low pass at 100Hz with a gain of 240. see the second plot
The UGF is at 3.8kHz with a phase margin of 76deg.
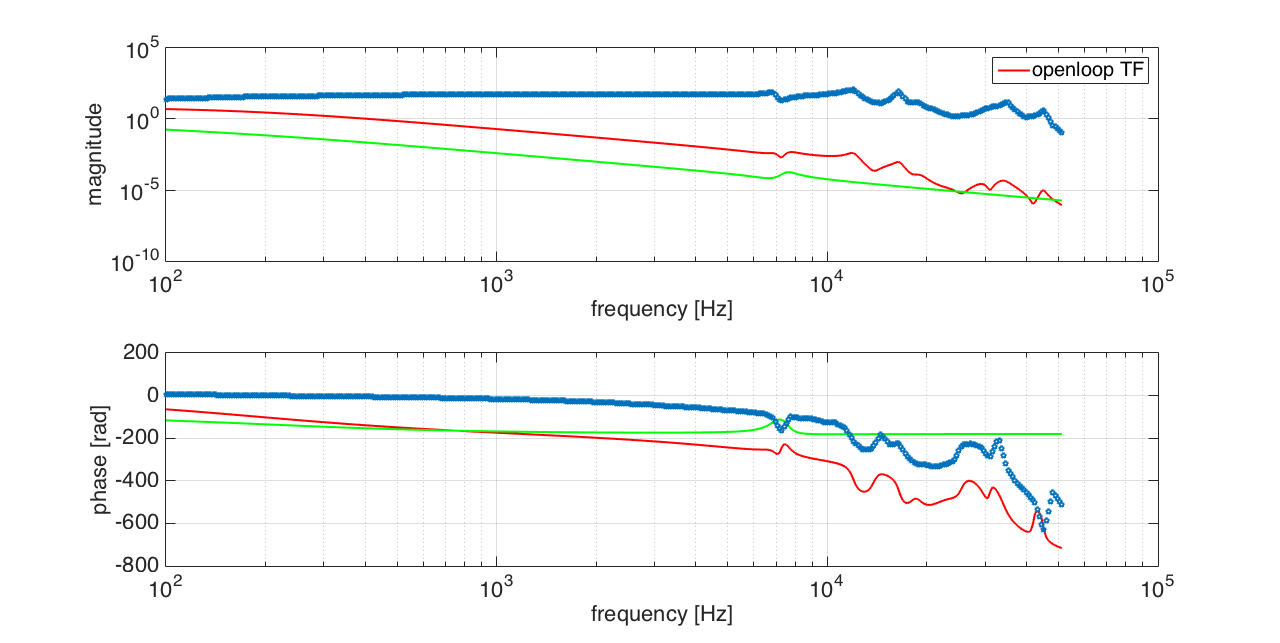
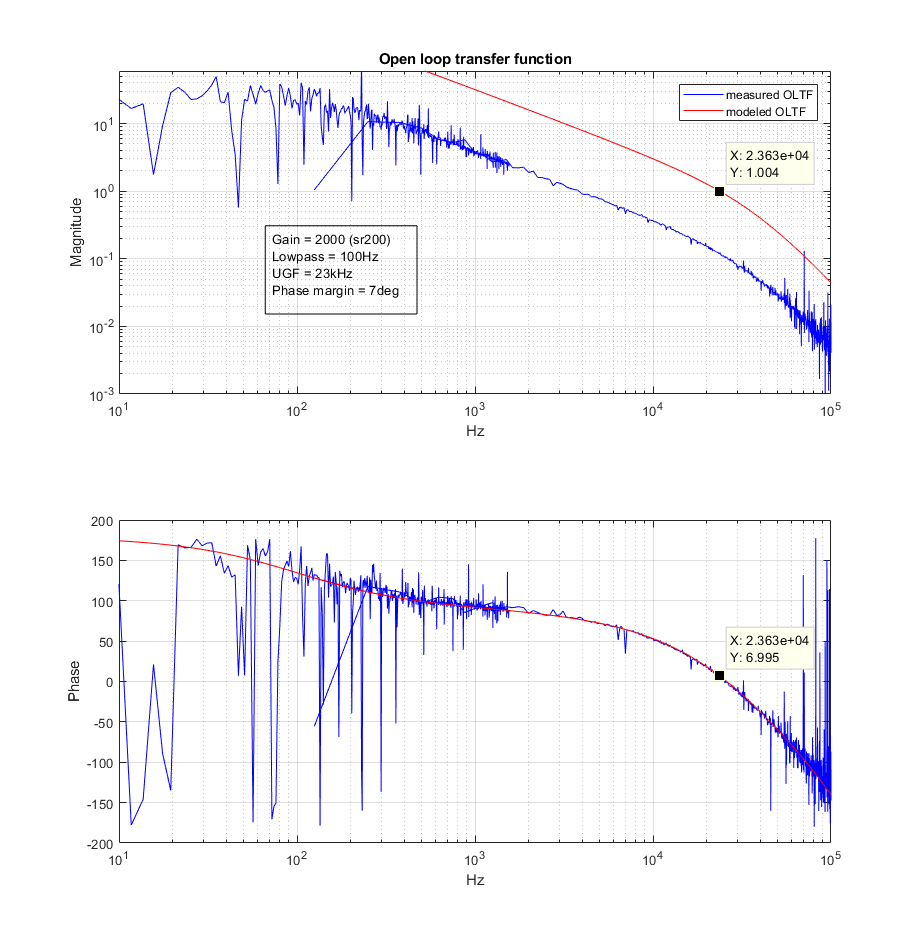
We verify that the loop becomes unstable for a gain of 2000 (as observed experimentally).
Indeed, the UGF becomes 23kHz and the phase margin 7deg. See the third plot.
We will use this model to design a better filter in order to have more gain at low frequencies, compatibly with the possible configurations of the sr560.
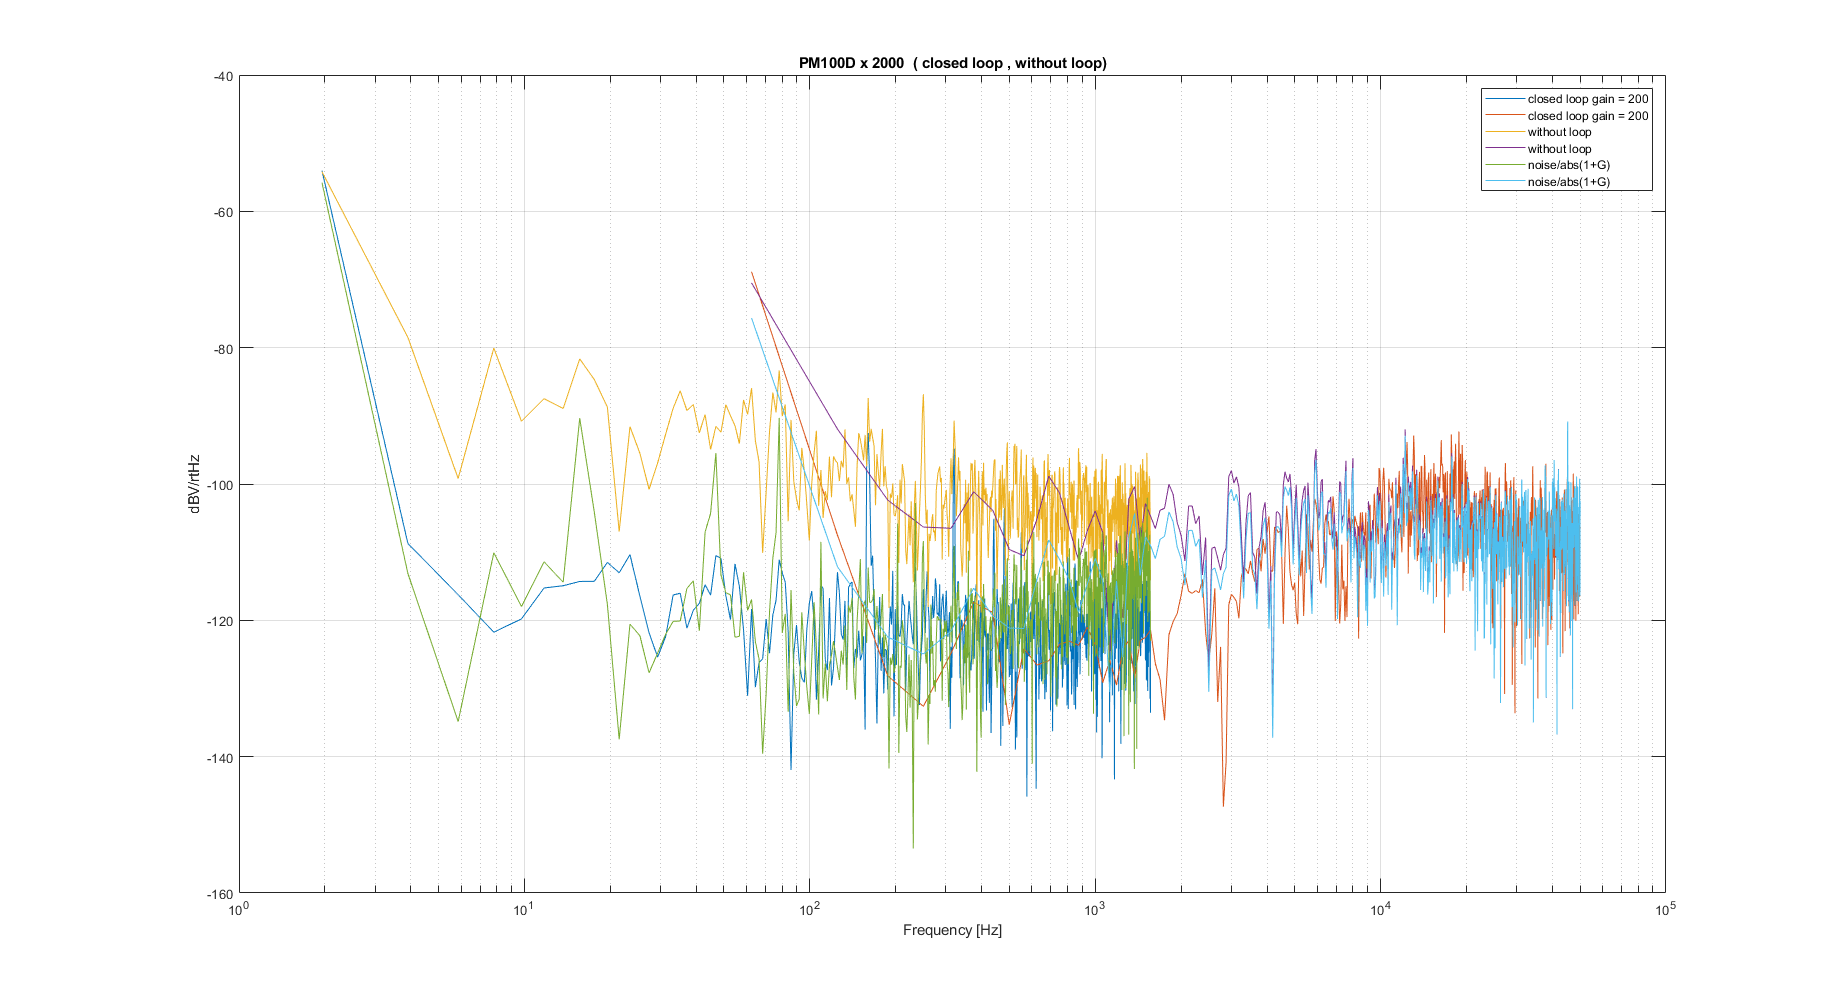
I set the loop to control the intensity of the 1310nm laser.
first I measured the actuator transfer function with a random noise from the spectrum analizer of amplitude 200mV
Then I set a low pass filter at 100Hz, a DC offset from the waveform generator to keep the correction signal around 0, and a gain of 200.
I closed the loop and measured the open loop transfer function.
I measured the noise in the photodiode with the loop closed and without loop.
then I divided the noise without loop by (1 + the open loop transfer function) and compared with the closed loop pd noise.
If I increase the gain above 1000 the laser stops for exceeding the current limit.
Participant: Marc and Yuhang
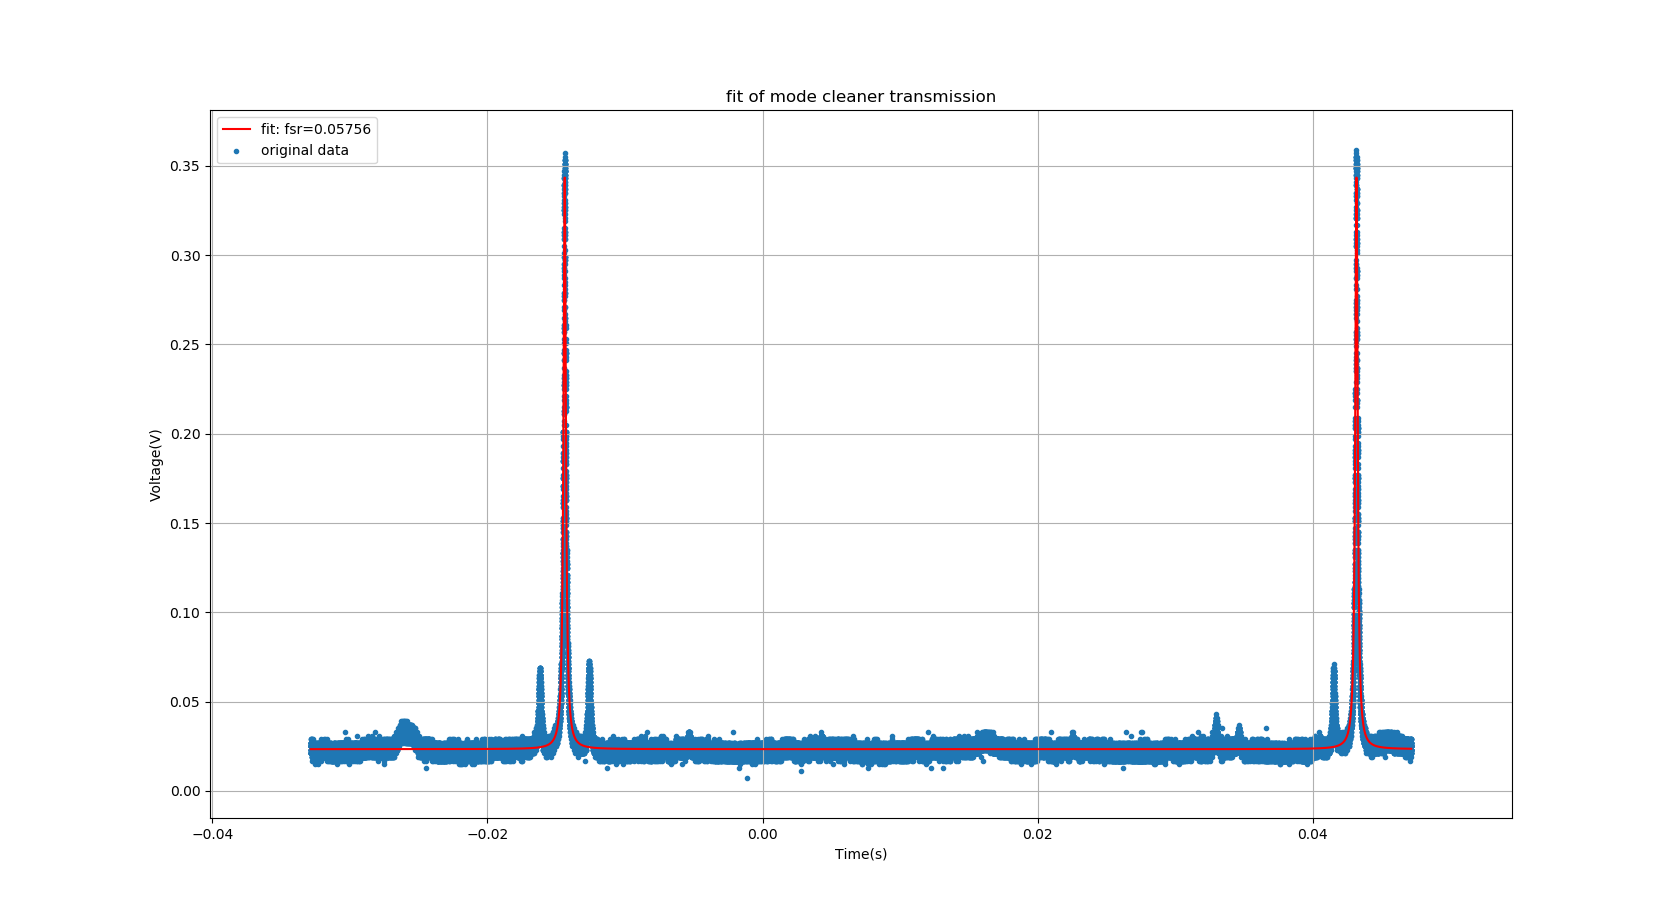
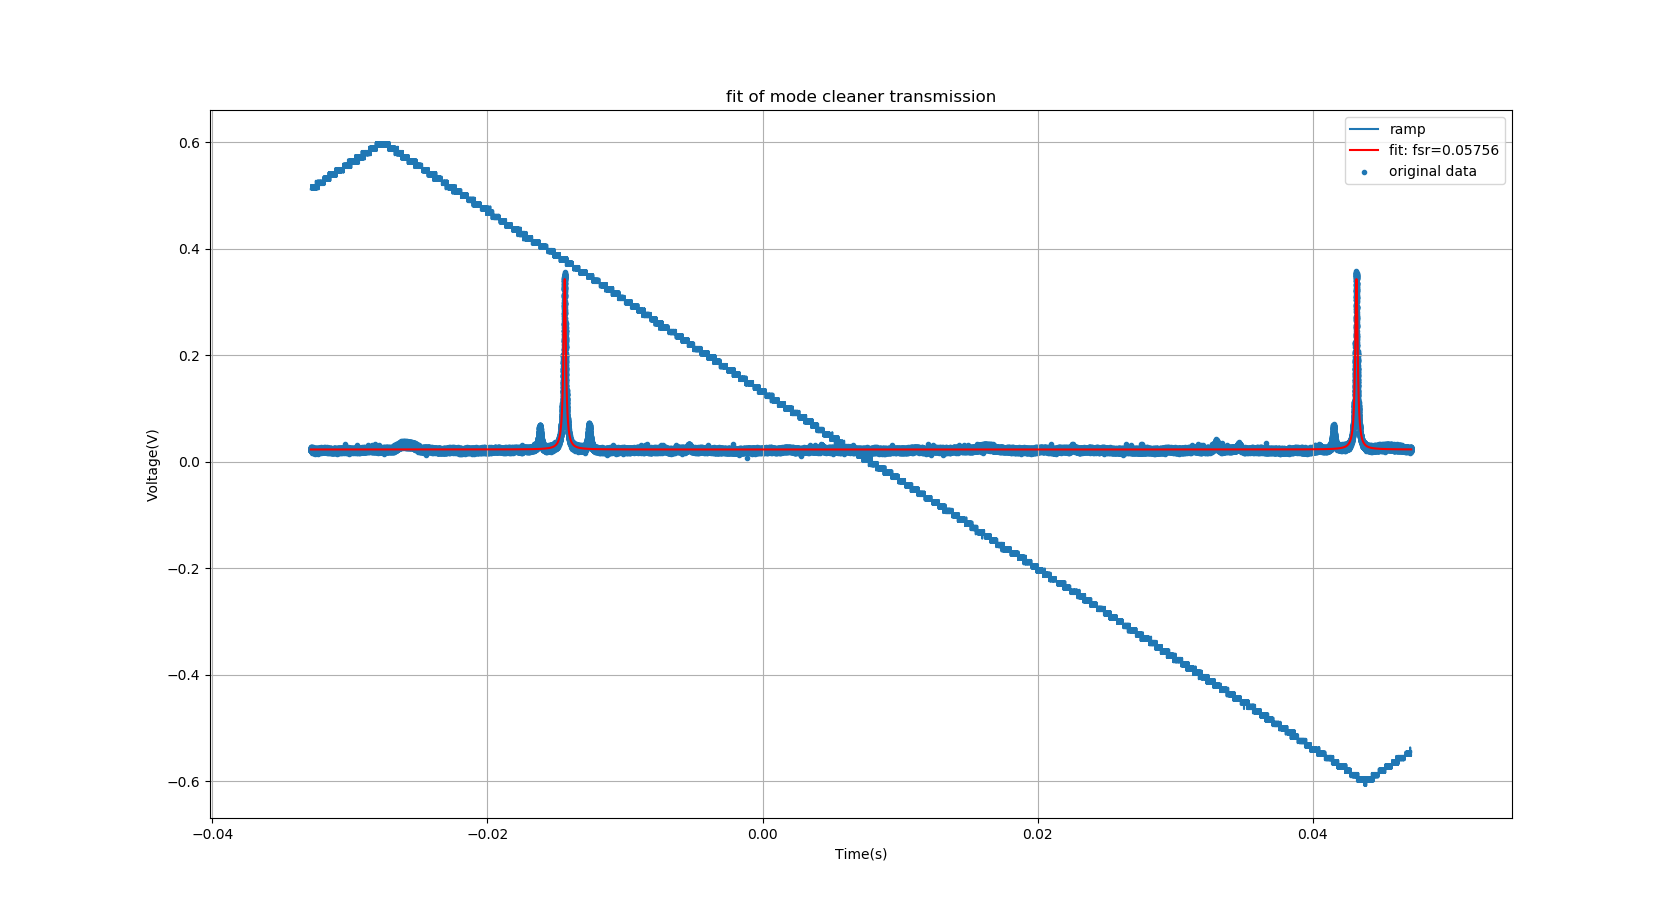
Today I reveived the comment from Marc and I measured the Finesse again. This time I put the ramp signal to make sure I am looking at the correct part of signal. This is of great important to find the correct FSR(Actually here the fsr corresponding to time, so maybe not good to call it fsr)
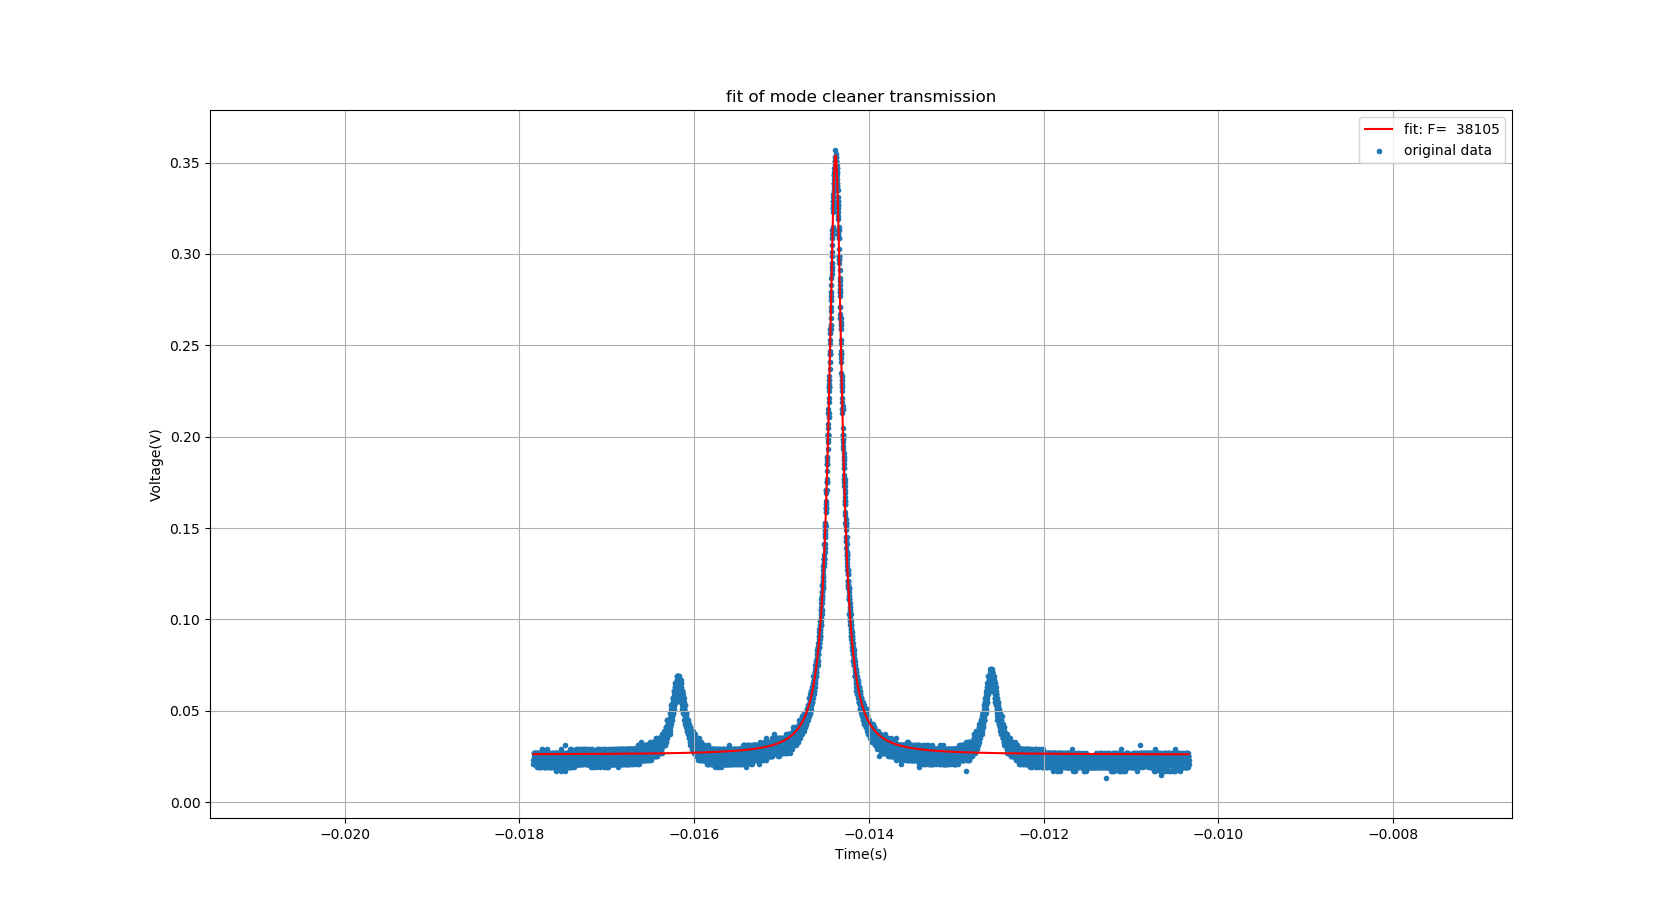
Then I use this fsr to fit only one peak so that I can see more clearly the fit.
In the end, I got a more pleasuible result. Finesse is 381. But this result is much higher than the calculation result, which is 248.
Participant: Eleonora and Yuhang
Beccause we changed many cables and arranged the control devices space, we think the green should be misaligned. Yesterday, I checked that it is totally misaligned!
I did the procedure of standard alignment of green: check target on PR chamber, check the first iris, check the second iris and match incidence with reflection, finally end mirror. After these procedures, I got the new offset of each mirror's local control offset. Then I can lock green and infrared together. See attached Fig.1
| YAW | PITCH | |
| PR | 0.3 | -0.07 |
| BS | -0.11 | -0.9 |
| IM | 0 | 1.1 |
| EM | 2.4 | -2 |
I also found some problems and did some change during this process.
1. I connect the image of second iris to the third part of monitor. I also checked the light you can see in this second iris camera is corridor light. Because if I go to turn off the corridor light, it disappeared. See attached Fig.2
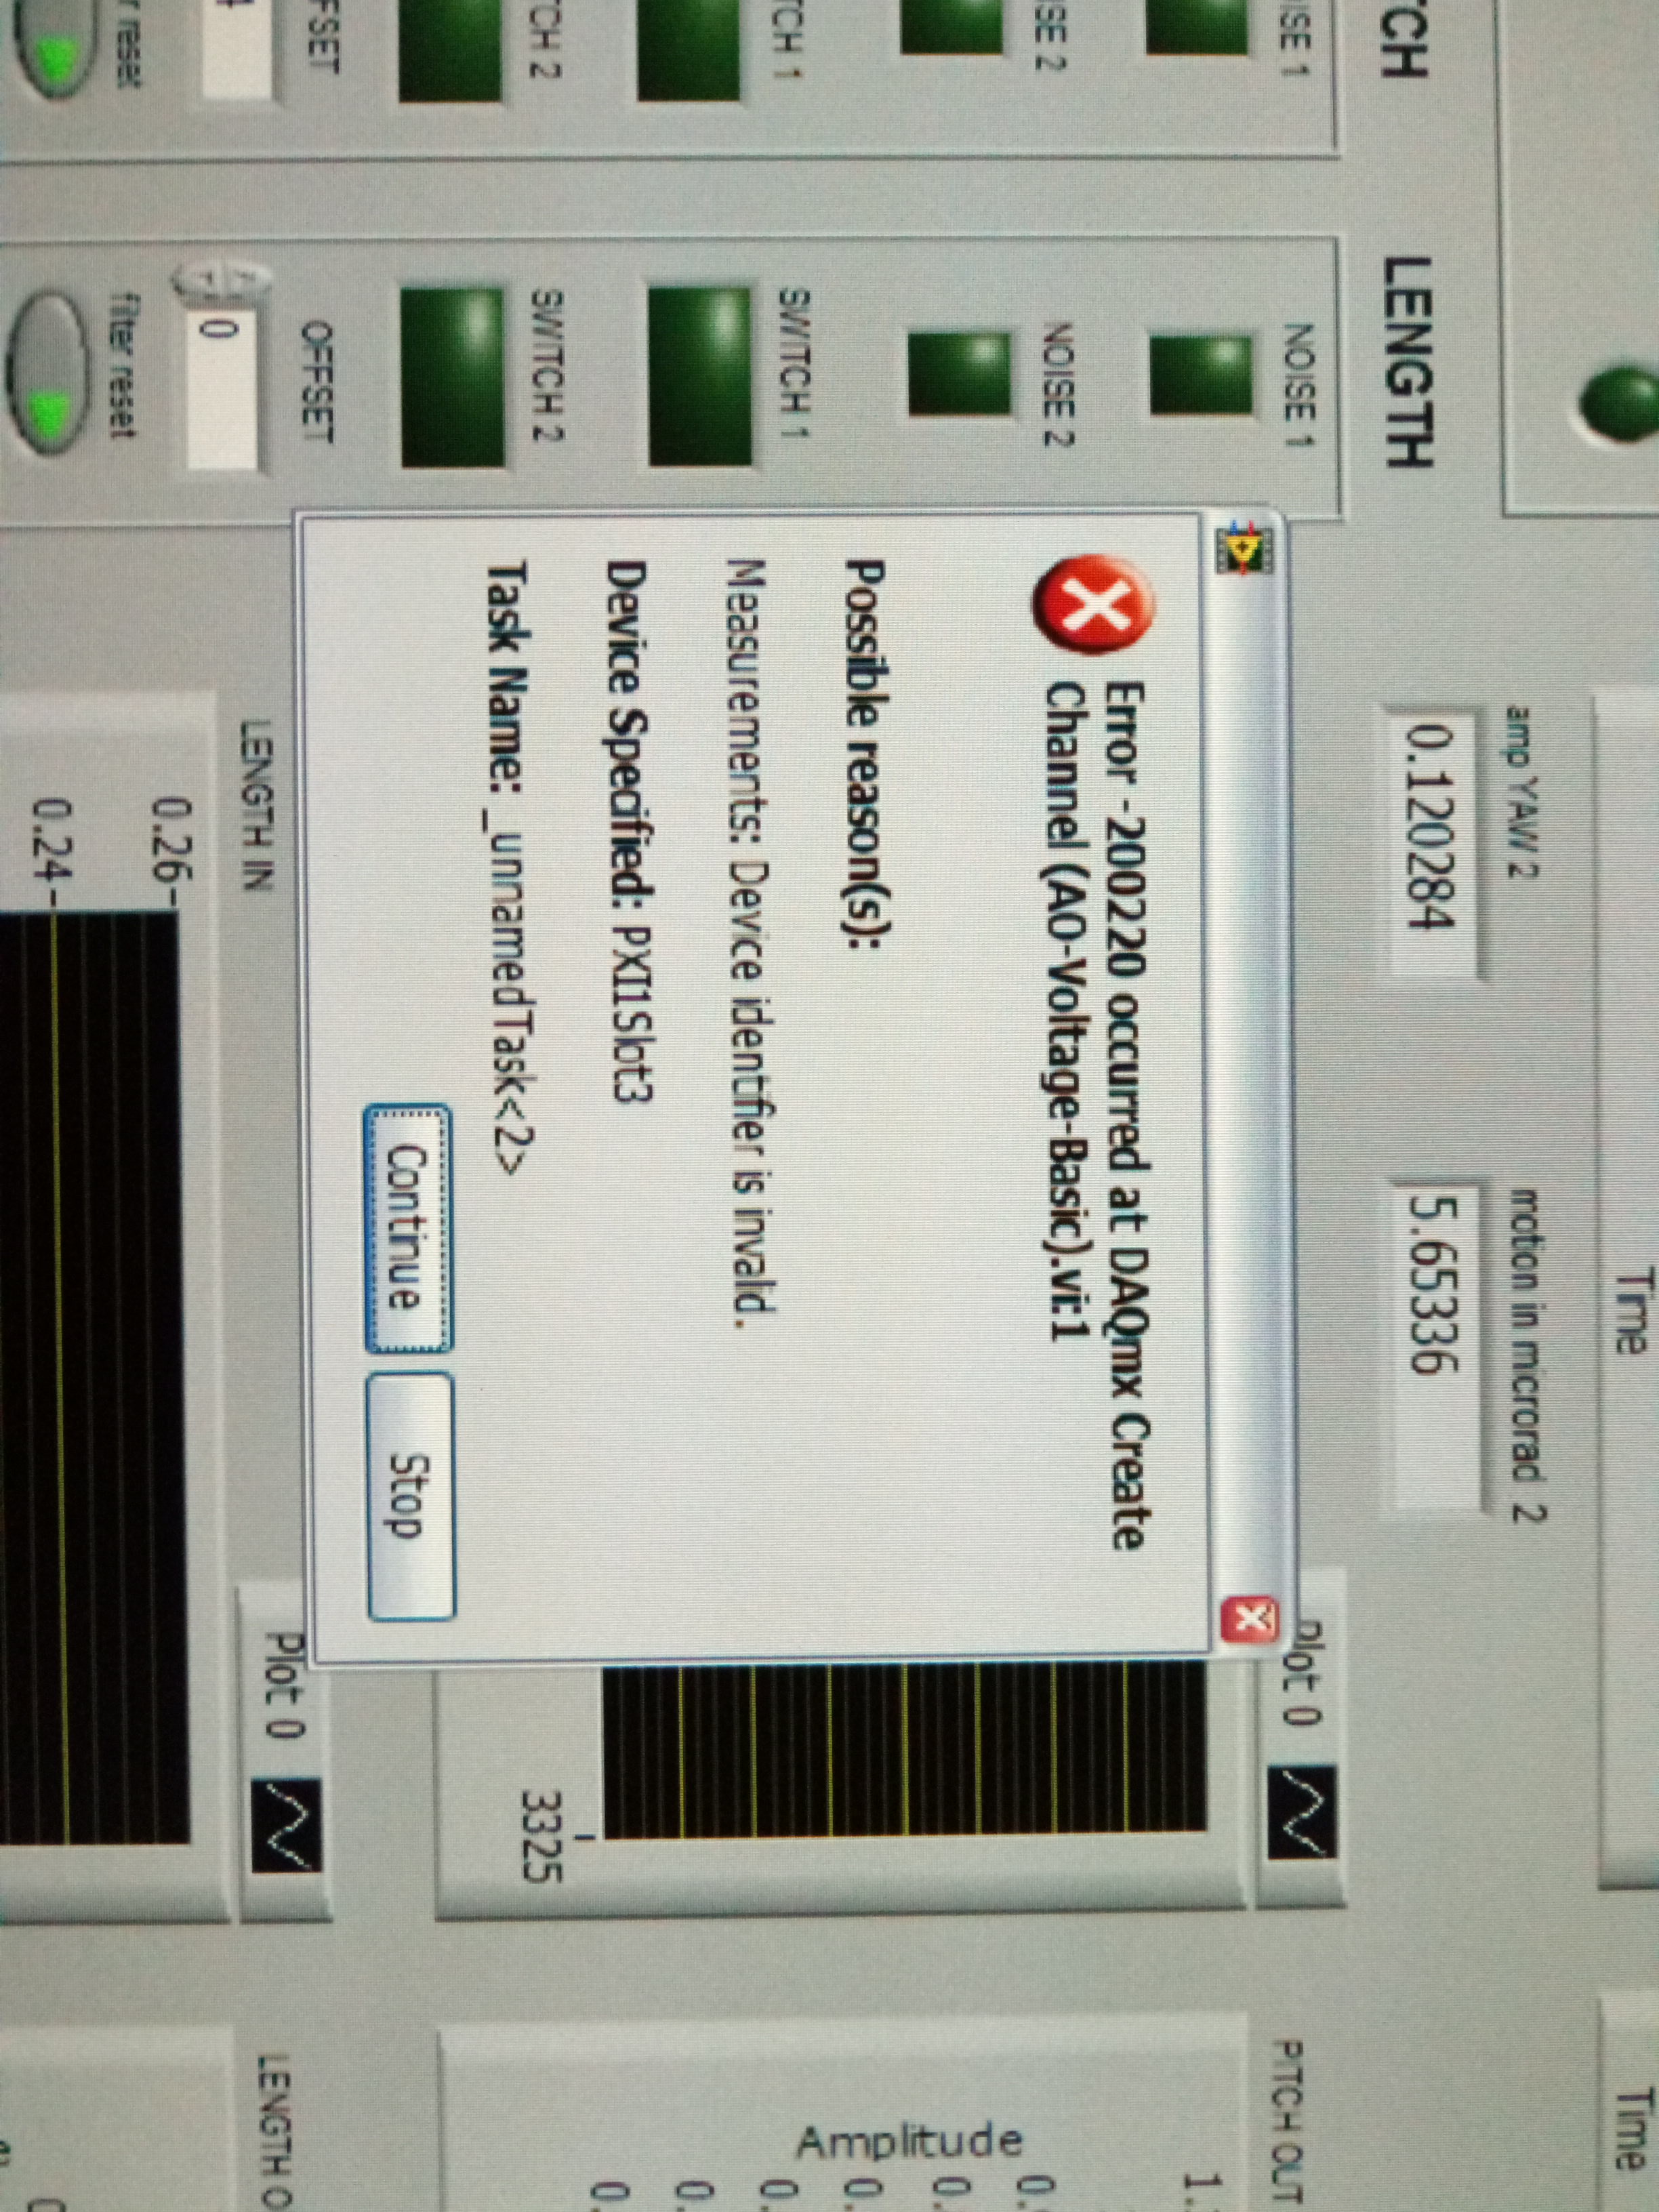
2. If you find problem in attached Fig.3, you need to reopen the program.
3. I tried to remote control of the second iris, but the network cable seems not working.
Because we found the unexpected peak while we are scanning mode cleaner, I tried to realign it.
The mothod is to block the beam going to mirror without PZT in Mach-Zehnder. Then use the steering mirror to align and make the peak of mode-cleaner as high as possible. Then remove the block, and adjust the mirror without PZT in Mach-Zehnder.
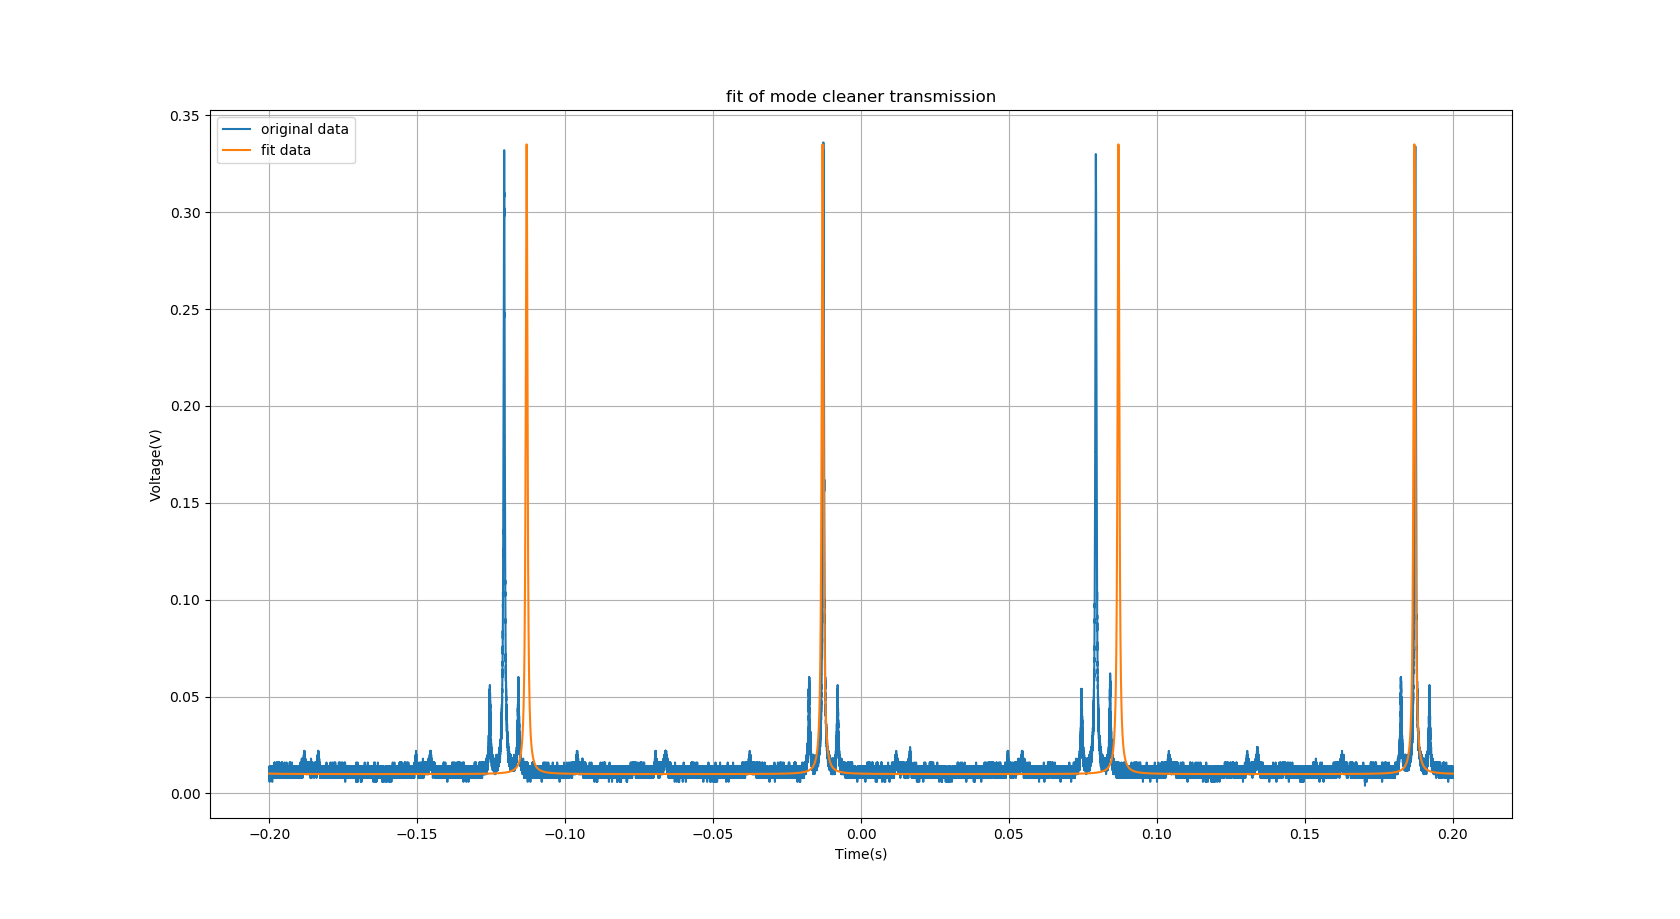
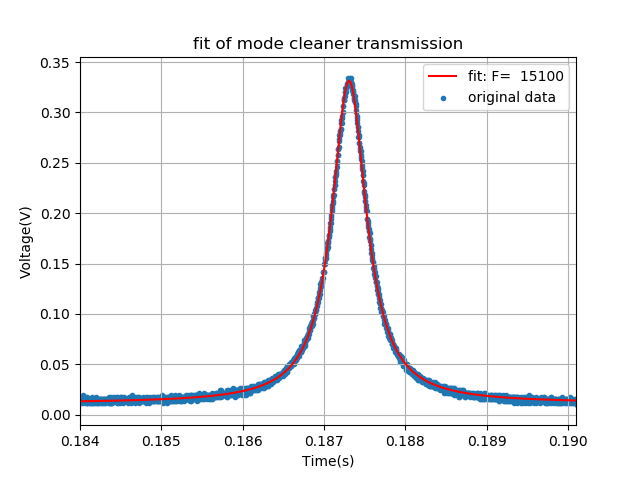
After alignment, the unexpected peak becoms very small. So I tried to take the data and calculate Finesse. Firstly, I tried to fit with airy function. But I found the FSR here is very strange, see attached Fig.1. It's obvious that the software cannot tell us this is a good fit. So this fit is done by my hand. I don't know why this FSR can be this unstable. But maybe this can be interesting.
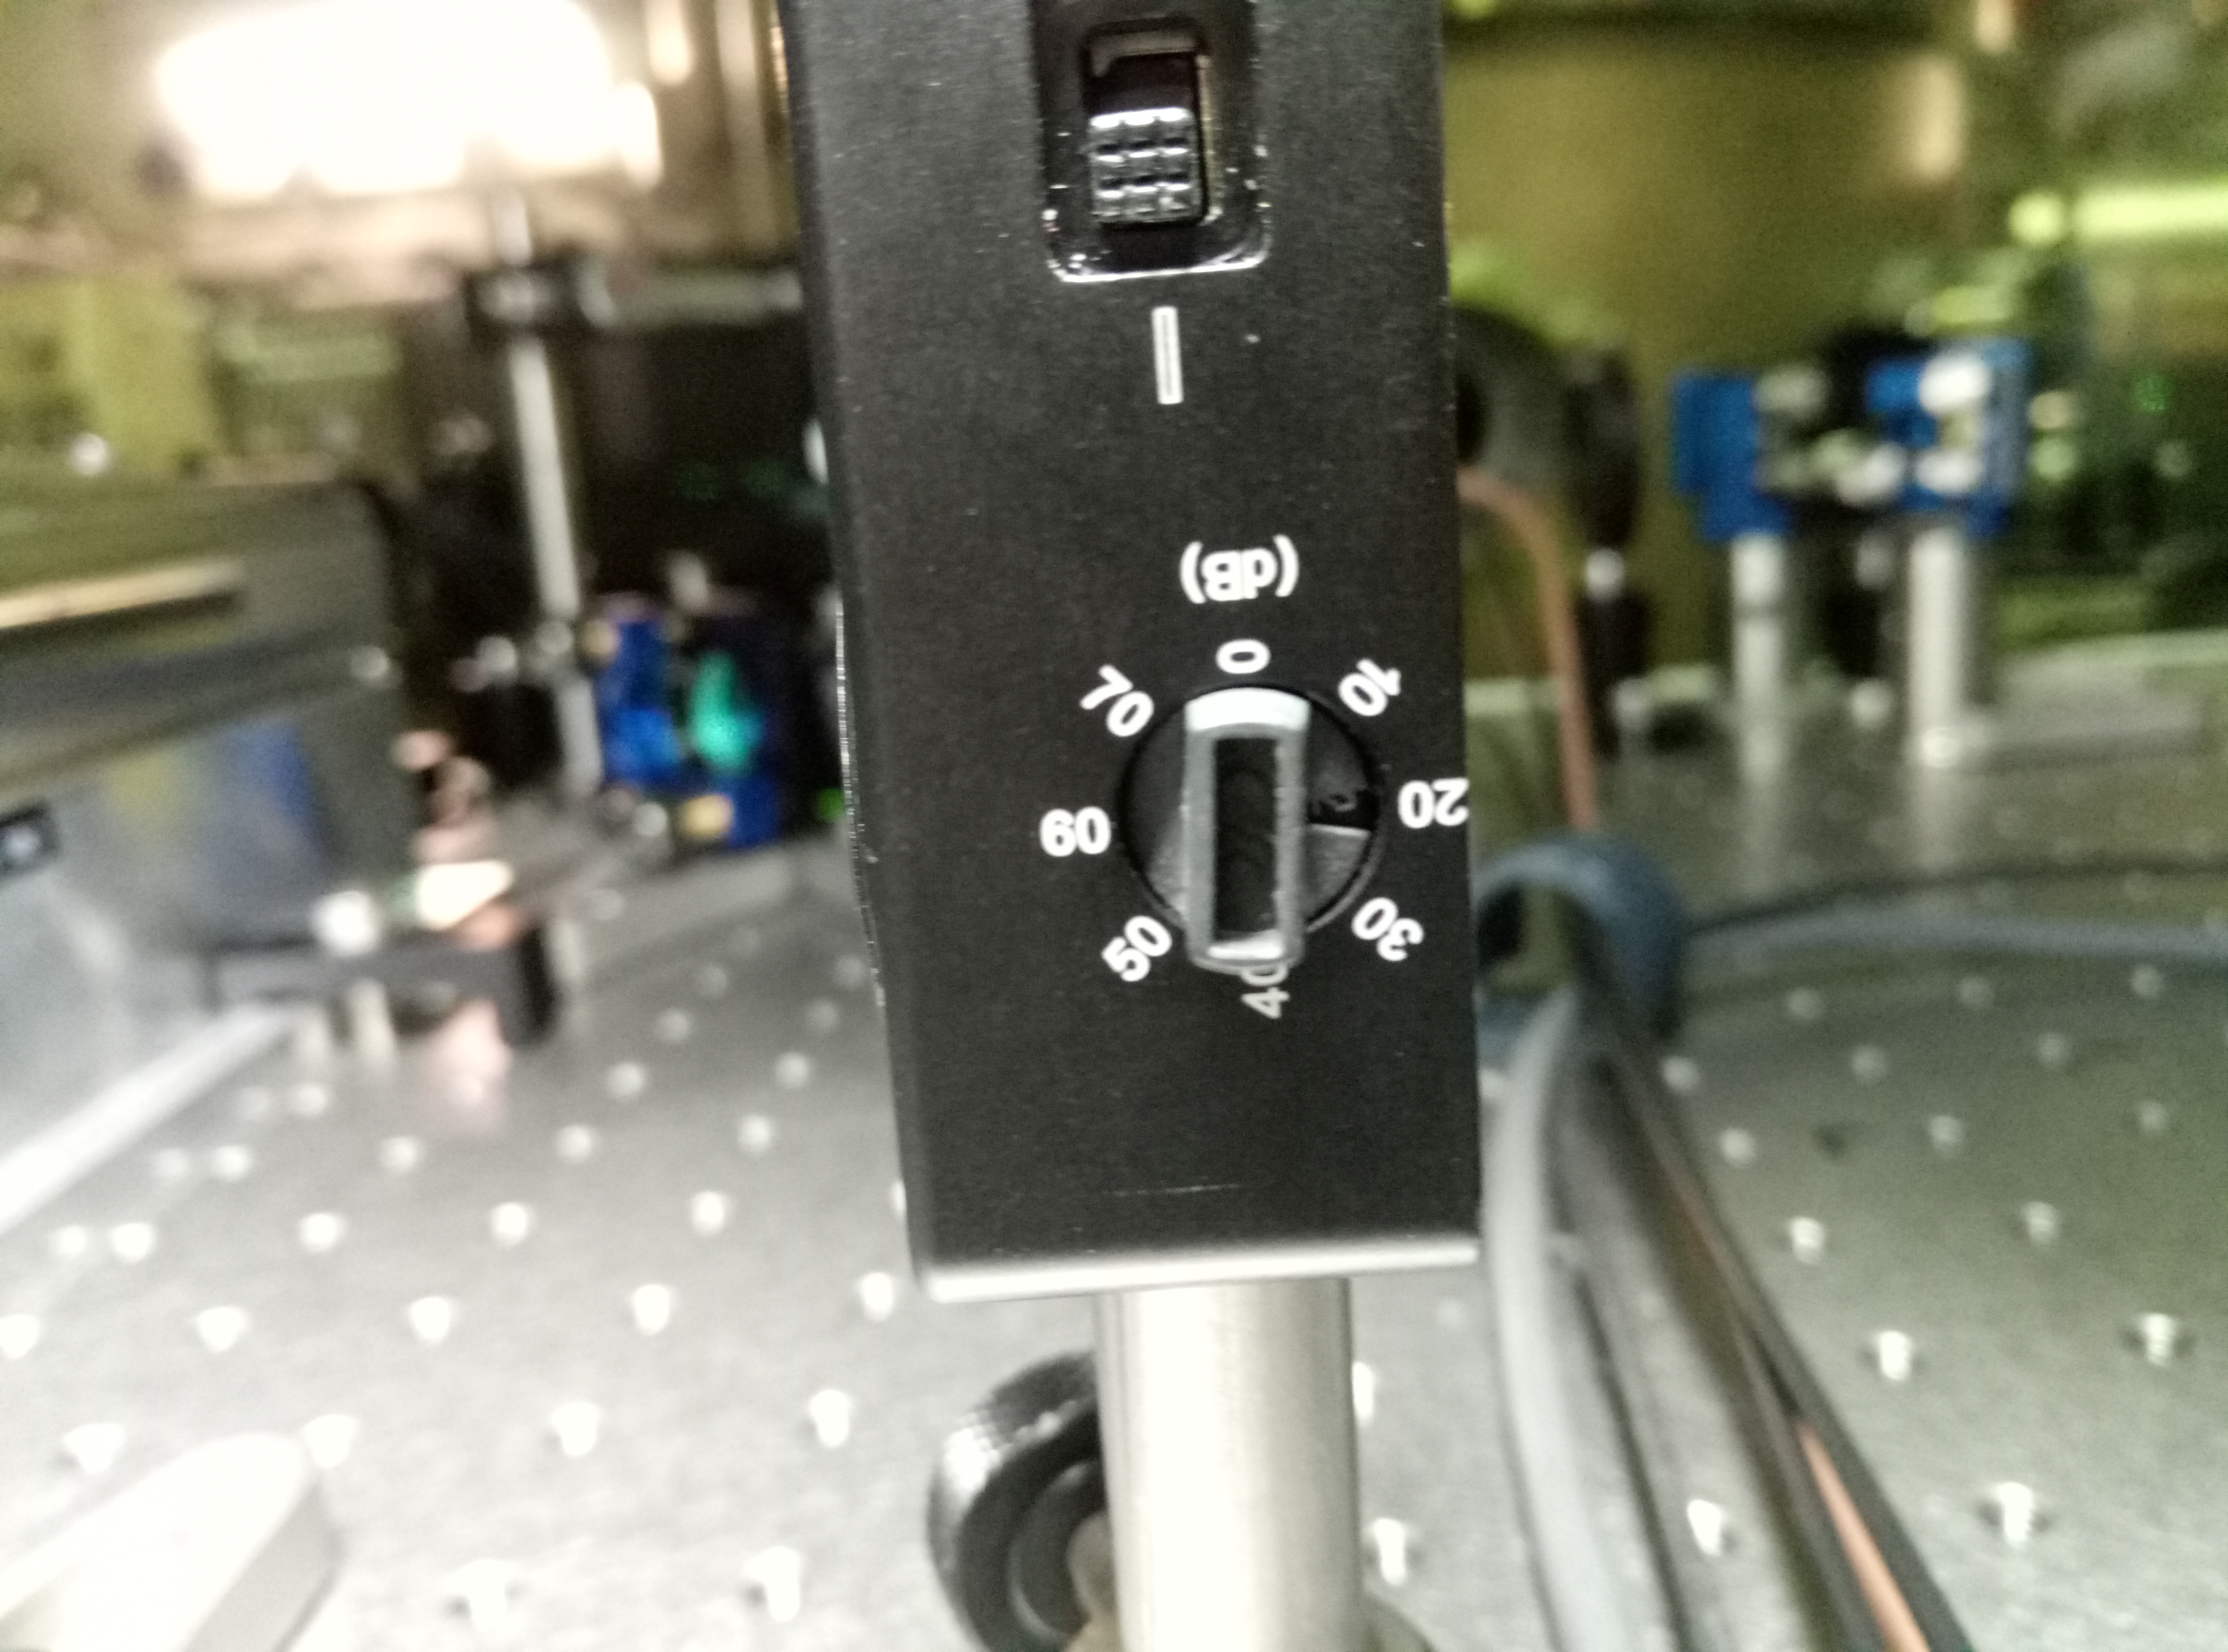
But I tried to fit only one peak, then I get the fit result of F=15100. See attached Fig.2. But note here, we use PD with amplification, it is 40dB means 100 times amplification. So the measurement of Finesse is only 152. If we consider R=0.992, the Finesse should be 248. So there is this discrepancy.
Beside, I checked the polarization again. This time I put a half-wave plate infront of mode cleaner, and change s to p polarization. I saw a increase of larger than 10 times of transmission on oscillscope. I talked with Matteo. From Fresnel law, p-pol has more transmissvity for the mirror now we use to dump beam. This is the main reason for this increase.
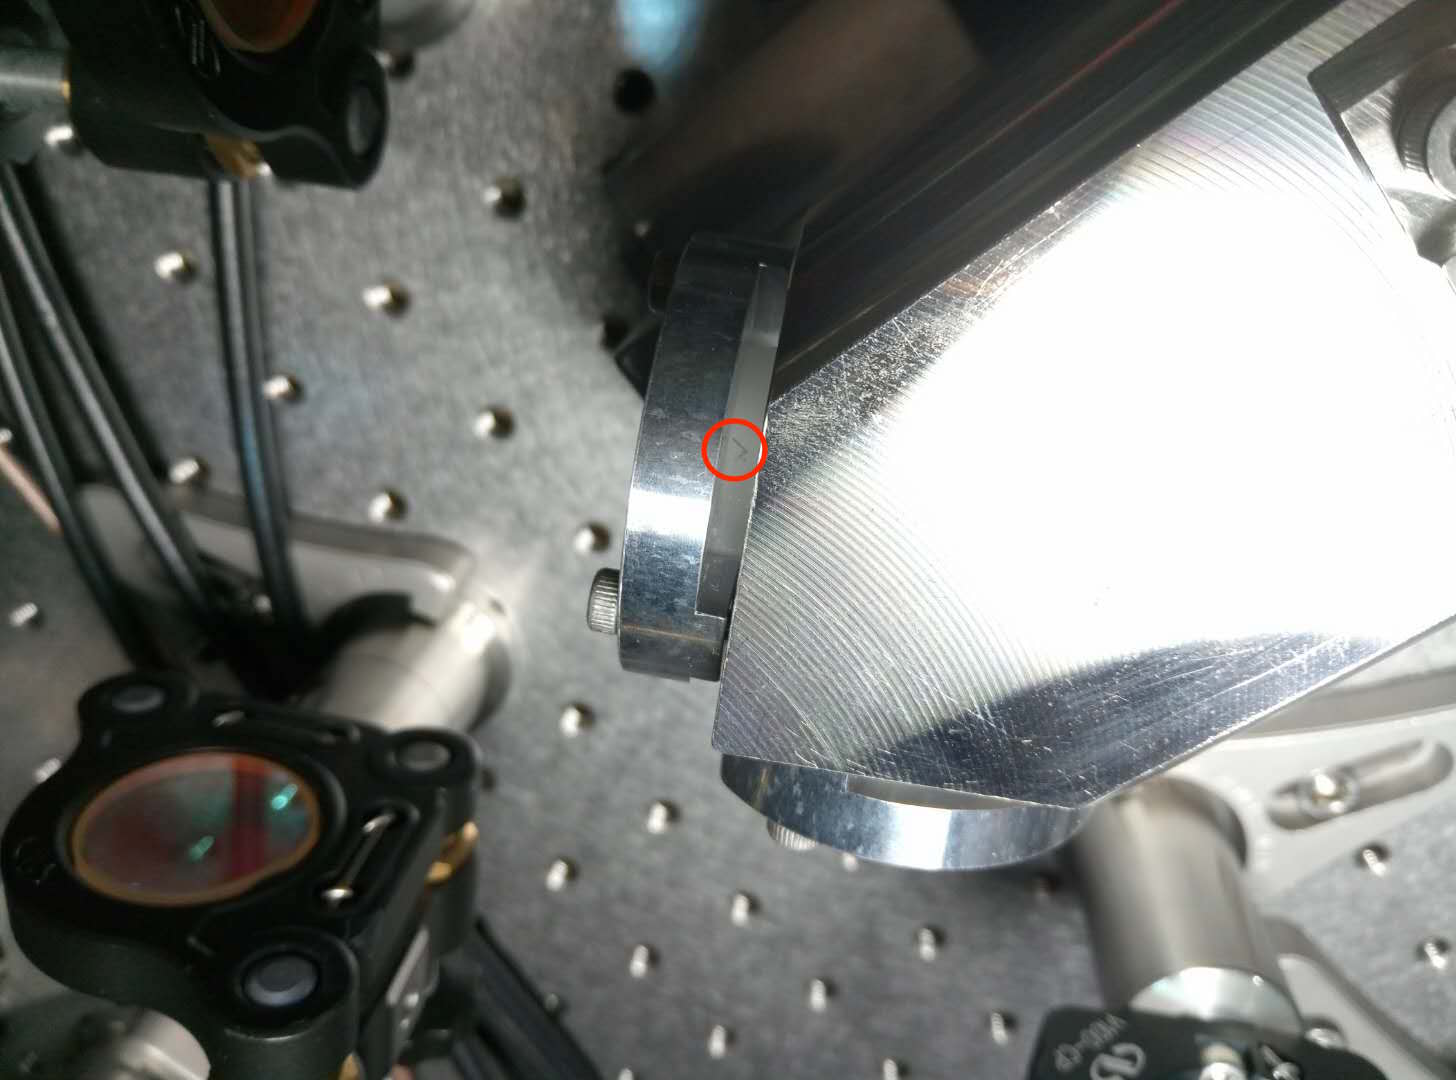
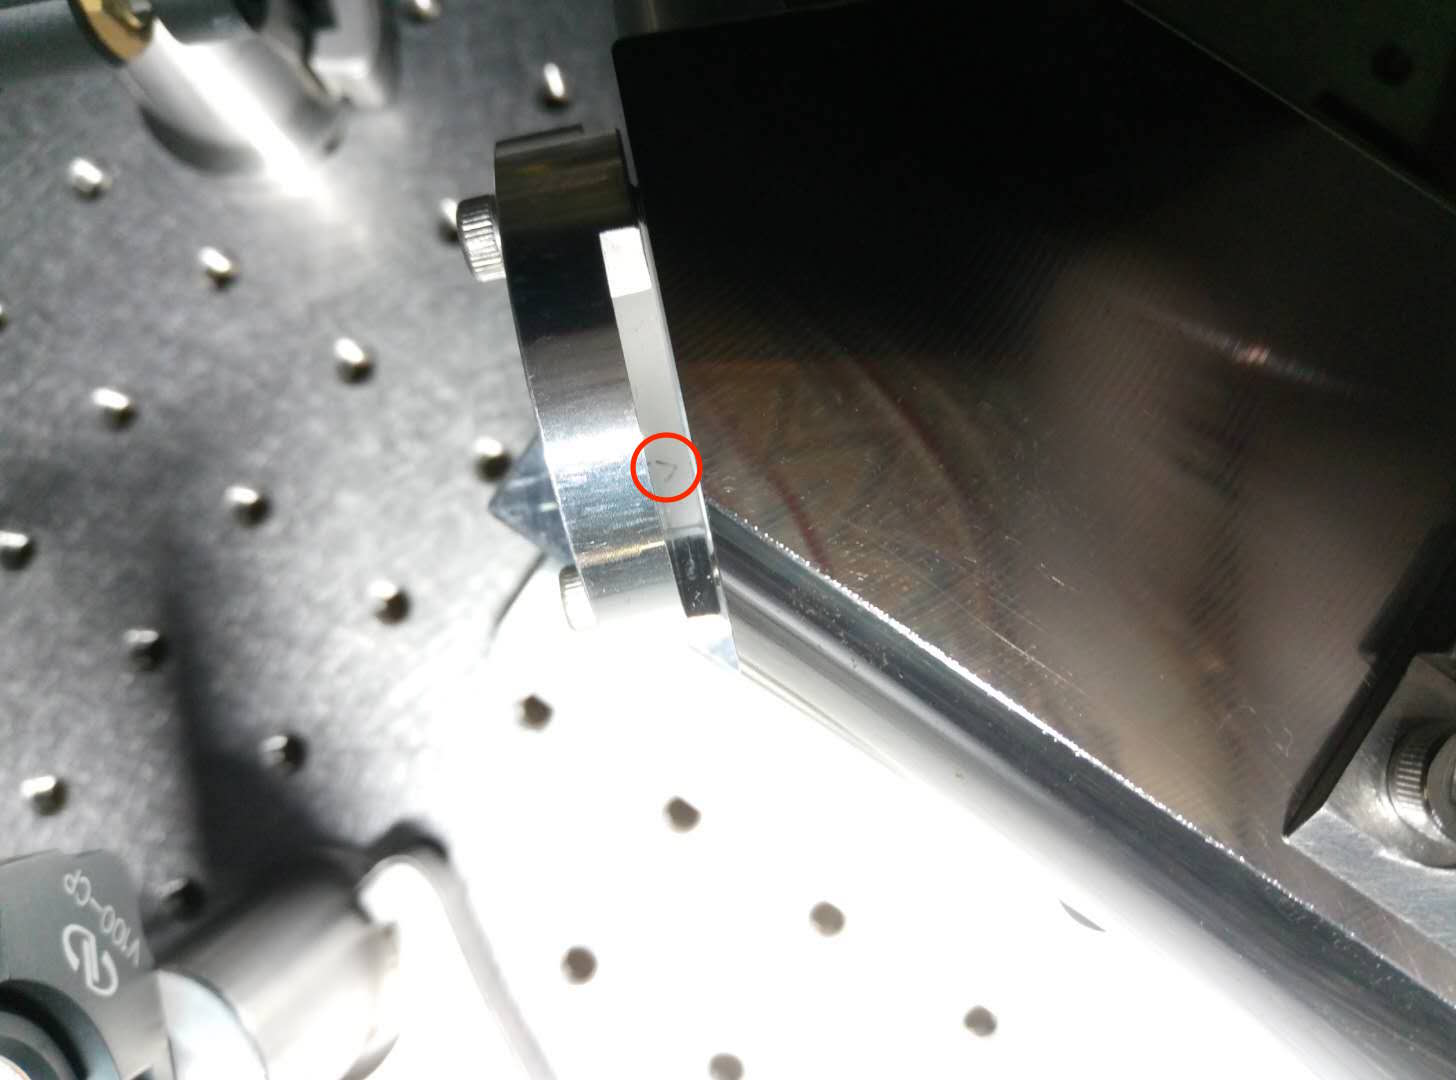
I checked the input and output mirror. From the point view of marker on the side of mirror, I am sure the mirror is installed in a correct way.
I checked also the mirror from the same box, this arrow points to the HF side of this mirror.
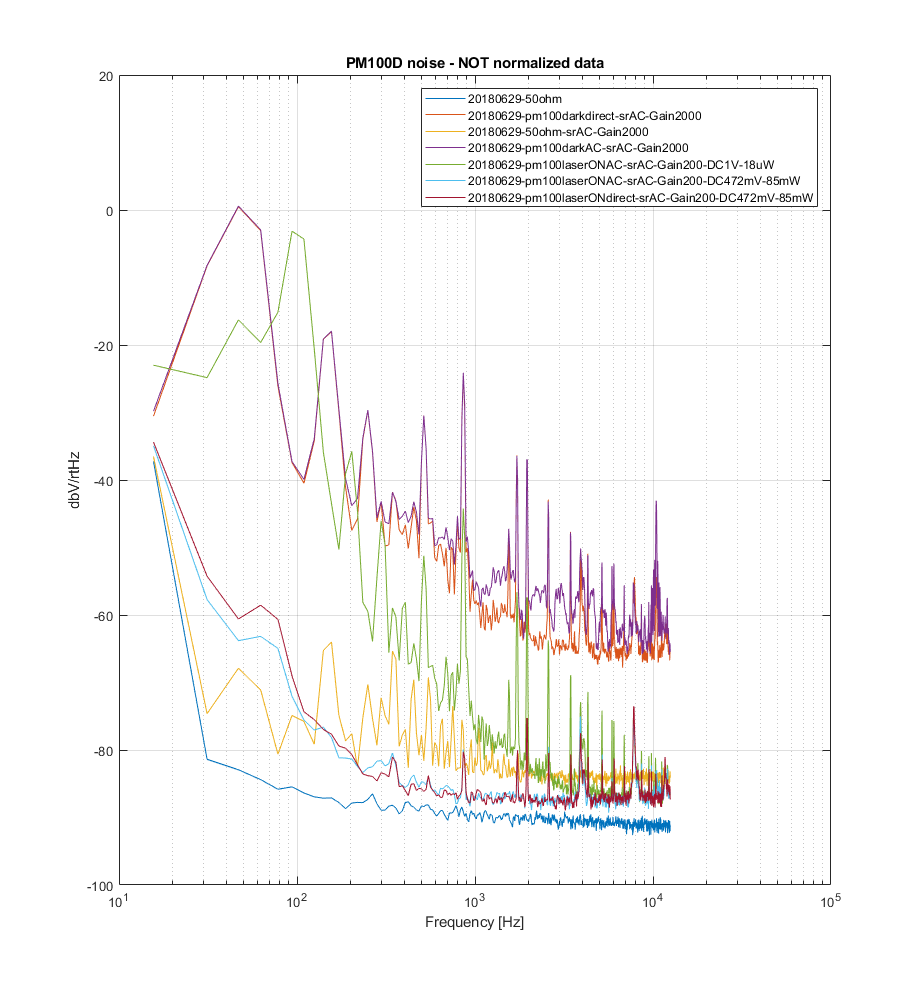
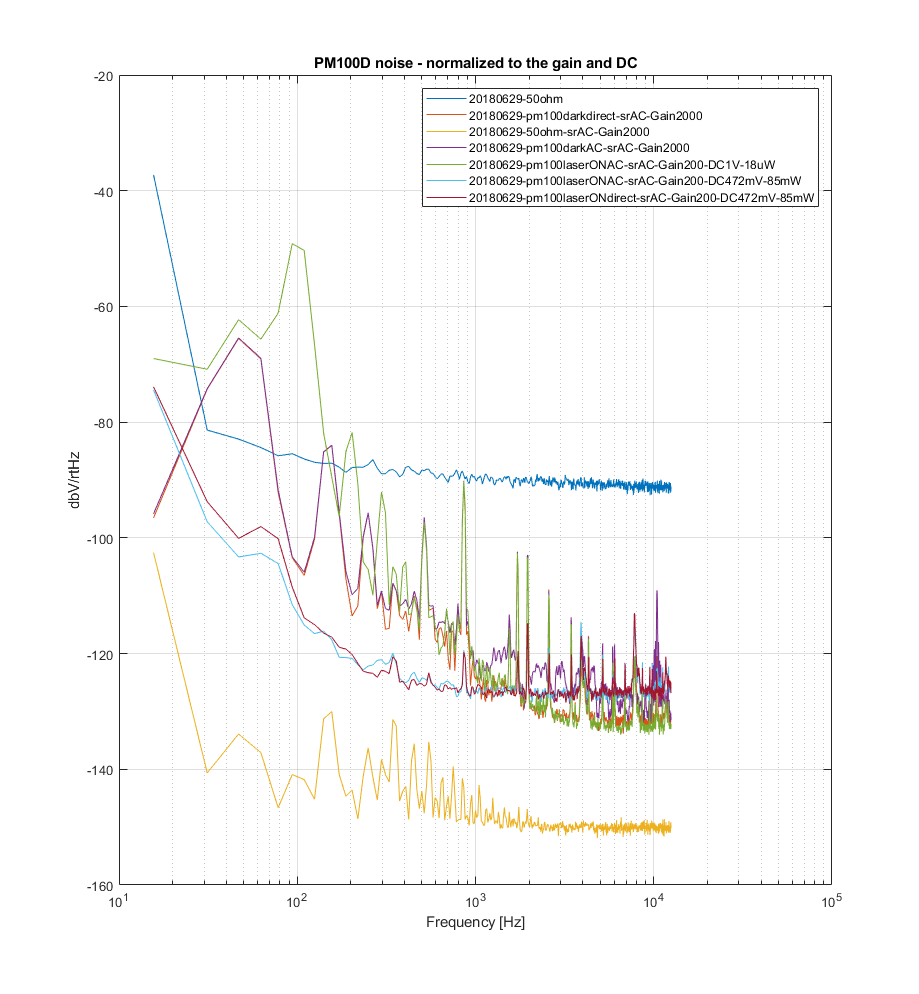
after setting the PM100D badwidth to 150kHz, I repeatd the measurements reported in entry 861
The plot is normalized on the gain and on the DC value.
Then I measured the transfer function of the laser modulation actuator + the integrating sphere photodiode PM100D
Partecipants: Marco, Eleonora, Yuhang, Matteo
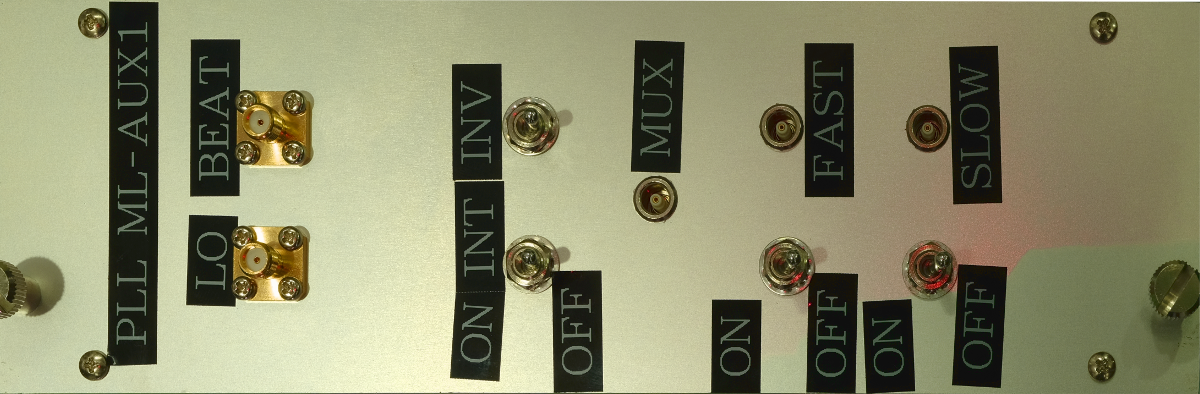
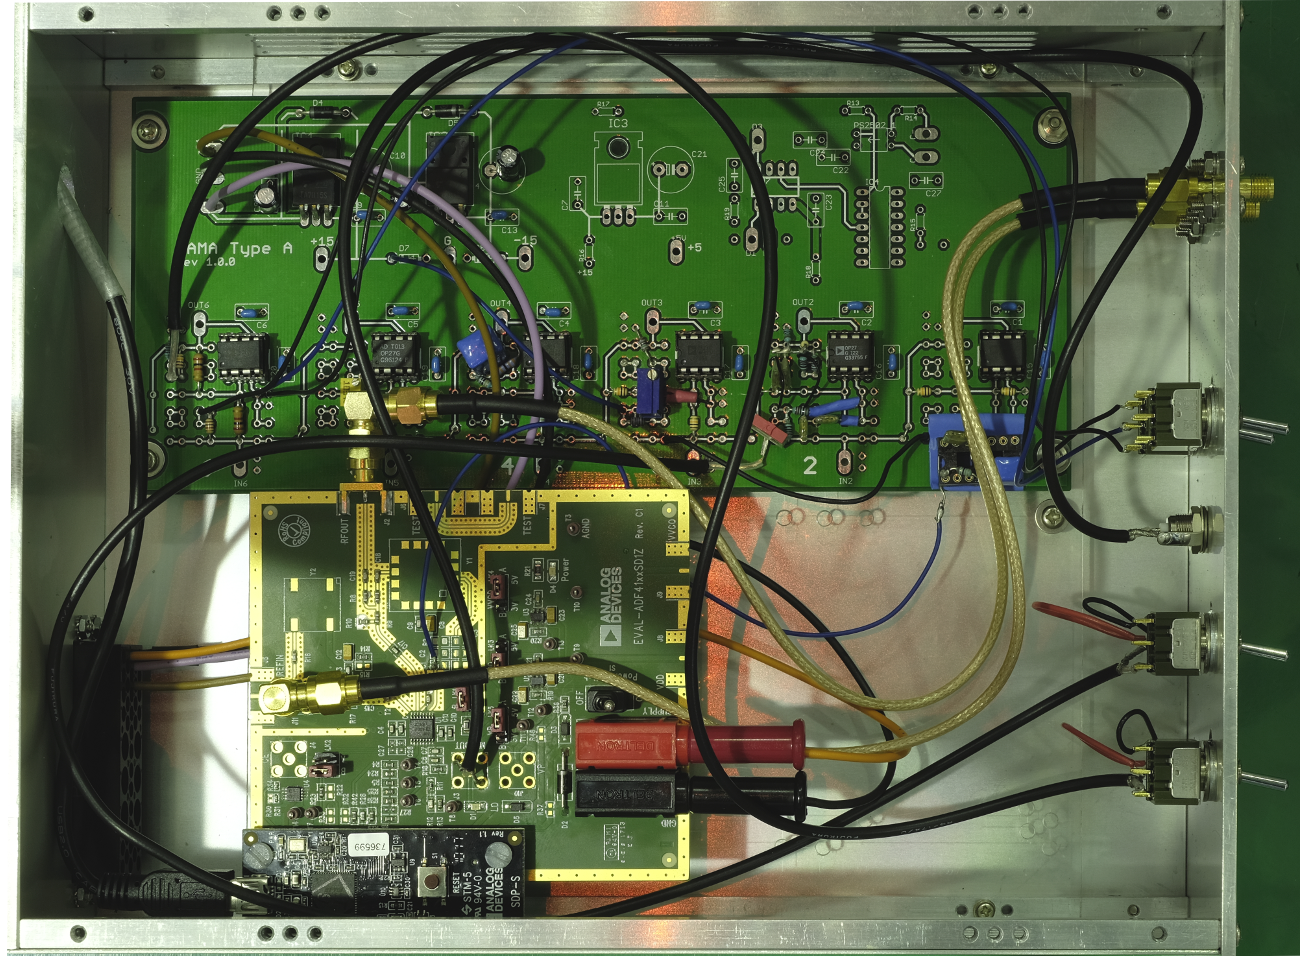
We mount in a NIM box the PLL board described in the logbook entry 847. The photo of the box are 'pllboxfrontend.png' and 'pllboxtop.png'.
Description of the front-end:
- 2 SMA connector for the two input beat note and RF channel from DDS board not amplified
- Lemo connector (output) label MUX is a chnnel digitally configurable from the software use for diagnostic purposes (RF monitor, Beat monitor, Lock detect, etc)
- Lemo connector (output) label Fast is the correction singnal sent to lazer PZT, it can be activated or not using a switch mounted on the front panel
- Lemo connector (output) label Slow is the correction signal sent to laser PLT, it can be activated or not using a switch mounted on the front panel
Test of the board using AUX2 as slave laser (fig 'aux2lasrslave.pdf')
We tested the long term stability during the night ant the day later we found the PLL still locked
We measure the PLL phase noise in three different condition (charge pump current: 4.375mA):
- MLfree running (rampe auto swithced off) rms phase noise: 4.9mrad
- ML free running (rampe auto switched on) rms phase noise: 10.6mrad
- ML non free running (filter cavity locked) rms phase noise: 16.7mrad
Test of the board using AUX1 as slave laser (fig 'aux1lasrslave.pdf')
We measure the PLL phase noise in three different condition (charge pump current: 3.75mA):
- MLfree running (rampe auto swithced off) rms phase noise: 5.5mrad
- ML free running (rampe auto switched on) rms phase noise: 14.9mrad
- ML non free running (filter cavity locked) rms phase noise: 15mrad
For both the servo loop we noticed that the output voltage of the rampe auto is high enough to increase the ML frequency noise.
Moreover the noise reduction due to the filter cavity locking between 100 Hz and 12-15 kHz is visible in both the servo loop.
The rampe auto noise is predominant at frequencies above the unitary gain bandwidth of the filter cavity servo loop

I did on the PM100D integrating sphere PD the same noise checks as I did on the InGaAs PD and reported in http://www2.nao.ac.jp/~gw-elog/osl/?r=846 elog entry
the measurements though are not reliable because after making them I found that the output bandwidth was set on 15Hz.
Participant: Eleonora, Marco and Yuhang.
1. Open the loop if you want to change the object you want to lock. Because we have only one board for locking up to now.
2. Reconnect the photodiode, PZT(in the back of red laser head) and pietie(int the back of white laser box and the middle one) from the previous one to the one you will control.
3. Check the photodiode output, and try to adjust steering mirrors to see if you can improve the fiber coupling or not. Sometimes if someone touch the collimator or mirror, the coupling will be changed.
4. Then connect this beatnote between these two lasers to spectrum analyzer. Remember to choose range from 0Hz to 1.3GHz. And change the temperature from the laser box. You will see from the spectrum analyzer the beatnote moves with your changing. Move it close to 20MHz, the frequency we want to use for demodulation. Note here that sometimes if the spectrum analyzer doesn't work, press the preset button.
5. Then look at it more closely and check the level of the peak you want to lock, it should be larger than -16dB. If not, you can check again the fiber coupling. Usually try to change the polarization.
6. Move the peak as close as 20MHz. Here is a splitter(10:90), 10 percent is used to monitor while 90 percent is used to lock the PLL. Then firstly put on the fast control and then slow.
7. If you want to measure the phase noise, check firstly the level of this signal. Change the demodulation phase to make it close to zero, means fluctuating around several hundred microV to 1mV.
8. Change the demodualtion frequency and use oscilloscope to see this frequency component to get the calibration factor.
9. Use DC couple and put the close to zero signal to the network analyzer. Then you will get noise spectrum.
For the 7 of step, first thing is to demodulate this signal with the frequency of beat note. Then by chaning the phase of this demodulation signal, we can make the demodulation output close to zero. This is crucial for the measurement of phase noise with DC coupling.
We used the similar manner to entry 830 characterize the main laser PZT.
Note here the resonance begin before 70kHz.