NAOJ GW Elog Logbook 3.2

Aritomi, Eleonora, and Yuhang
Last Friday, we had an issue with homodyne alignment. We found the frequency of peaks in shot noise is exactly the frequency of bench EW direction motion. At some point, we were thinking this is because of a bad way of aligning homodyne, but this seems not to be the case in the end. We figured out it should come from leaked LO backscattering.
The leaked LO mainly comes from the AR coating of cubic BS, then it goes to a sensor card in the squeezing path and the sensor card causes backscattering. About the leaked LO from homodyne, we measured power as following
|
from cube BS |
2.5uW |
|
from flipping mirror |
0.85uW |
|
from lens/PD |
almost no |
|
total |
3.35uW |
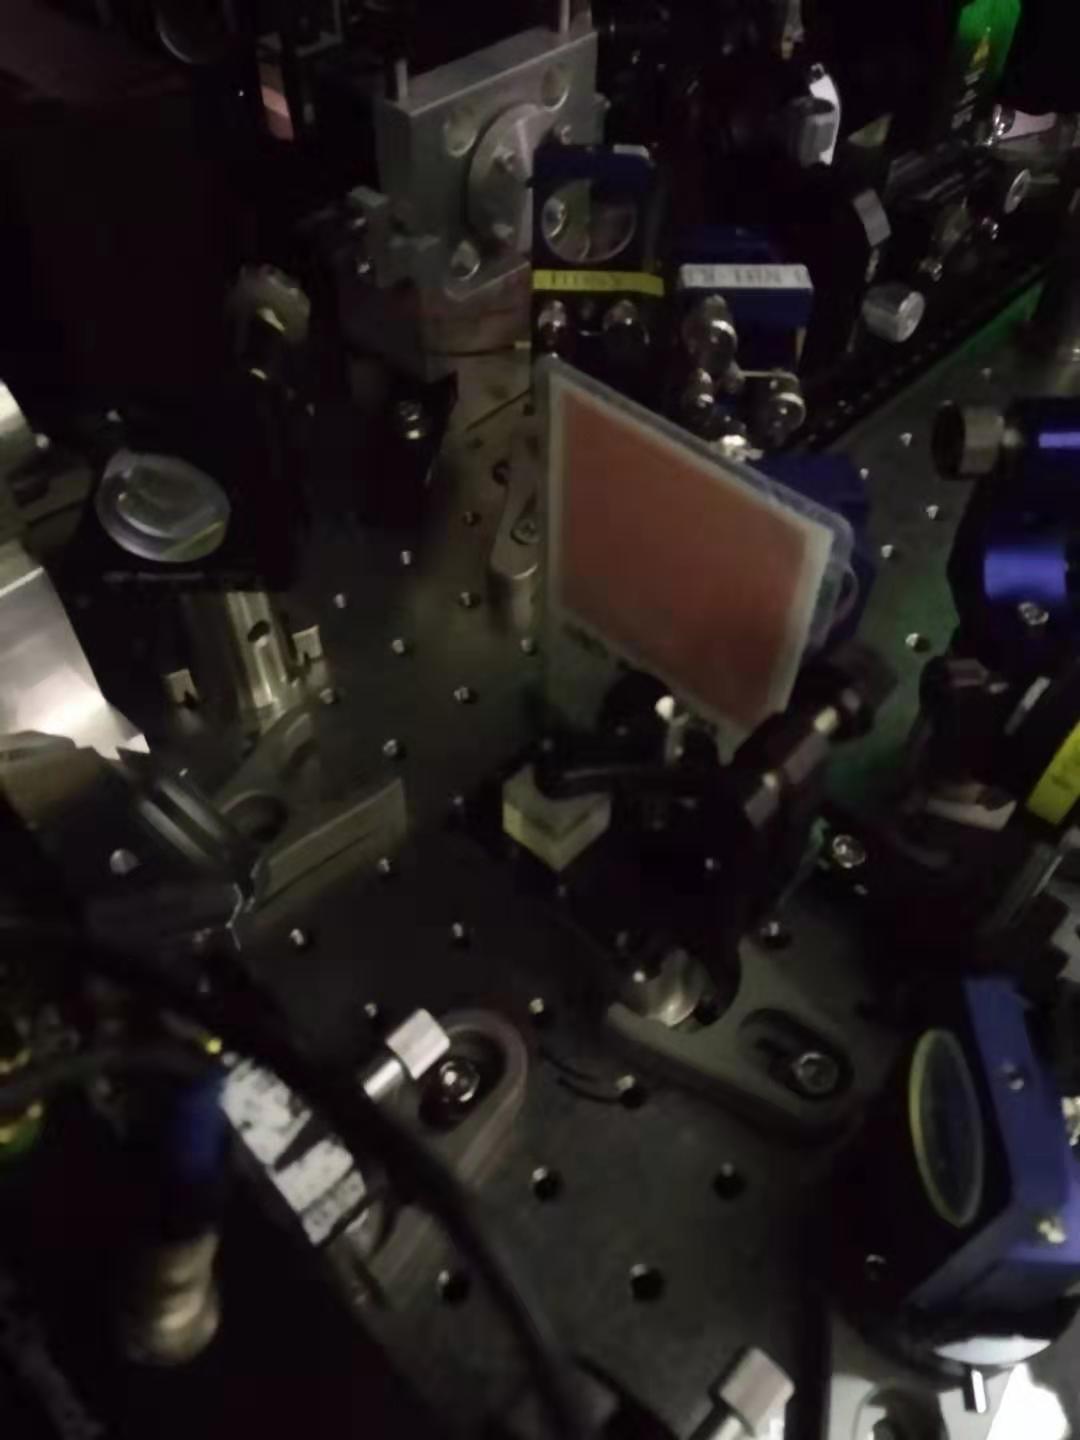
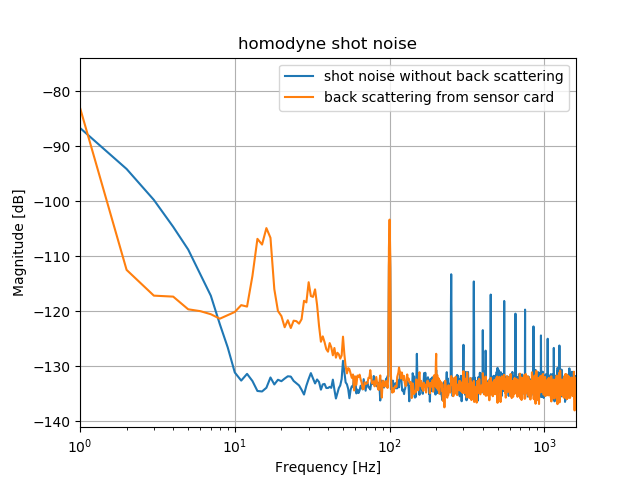
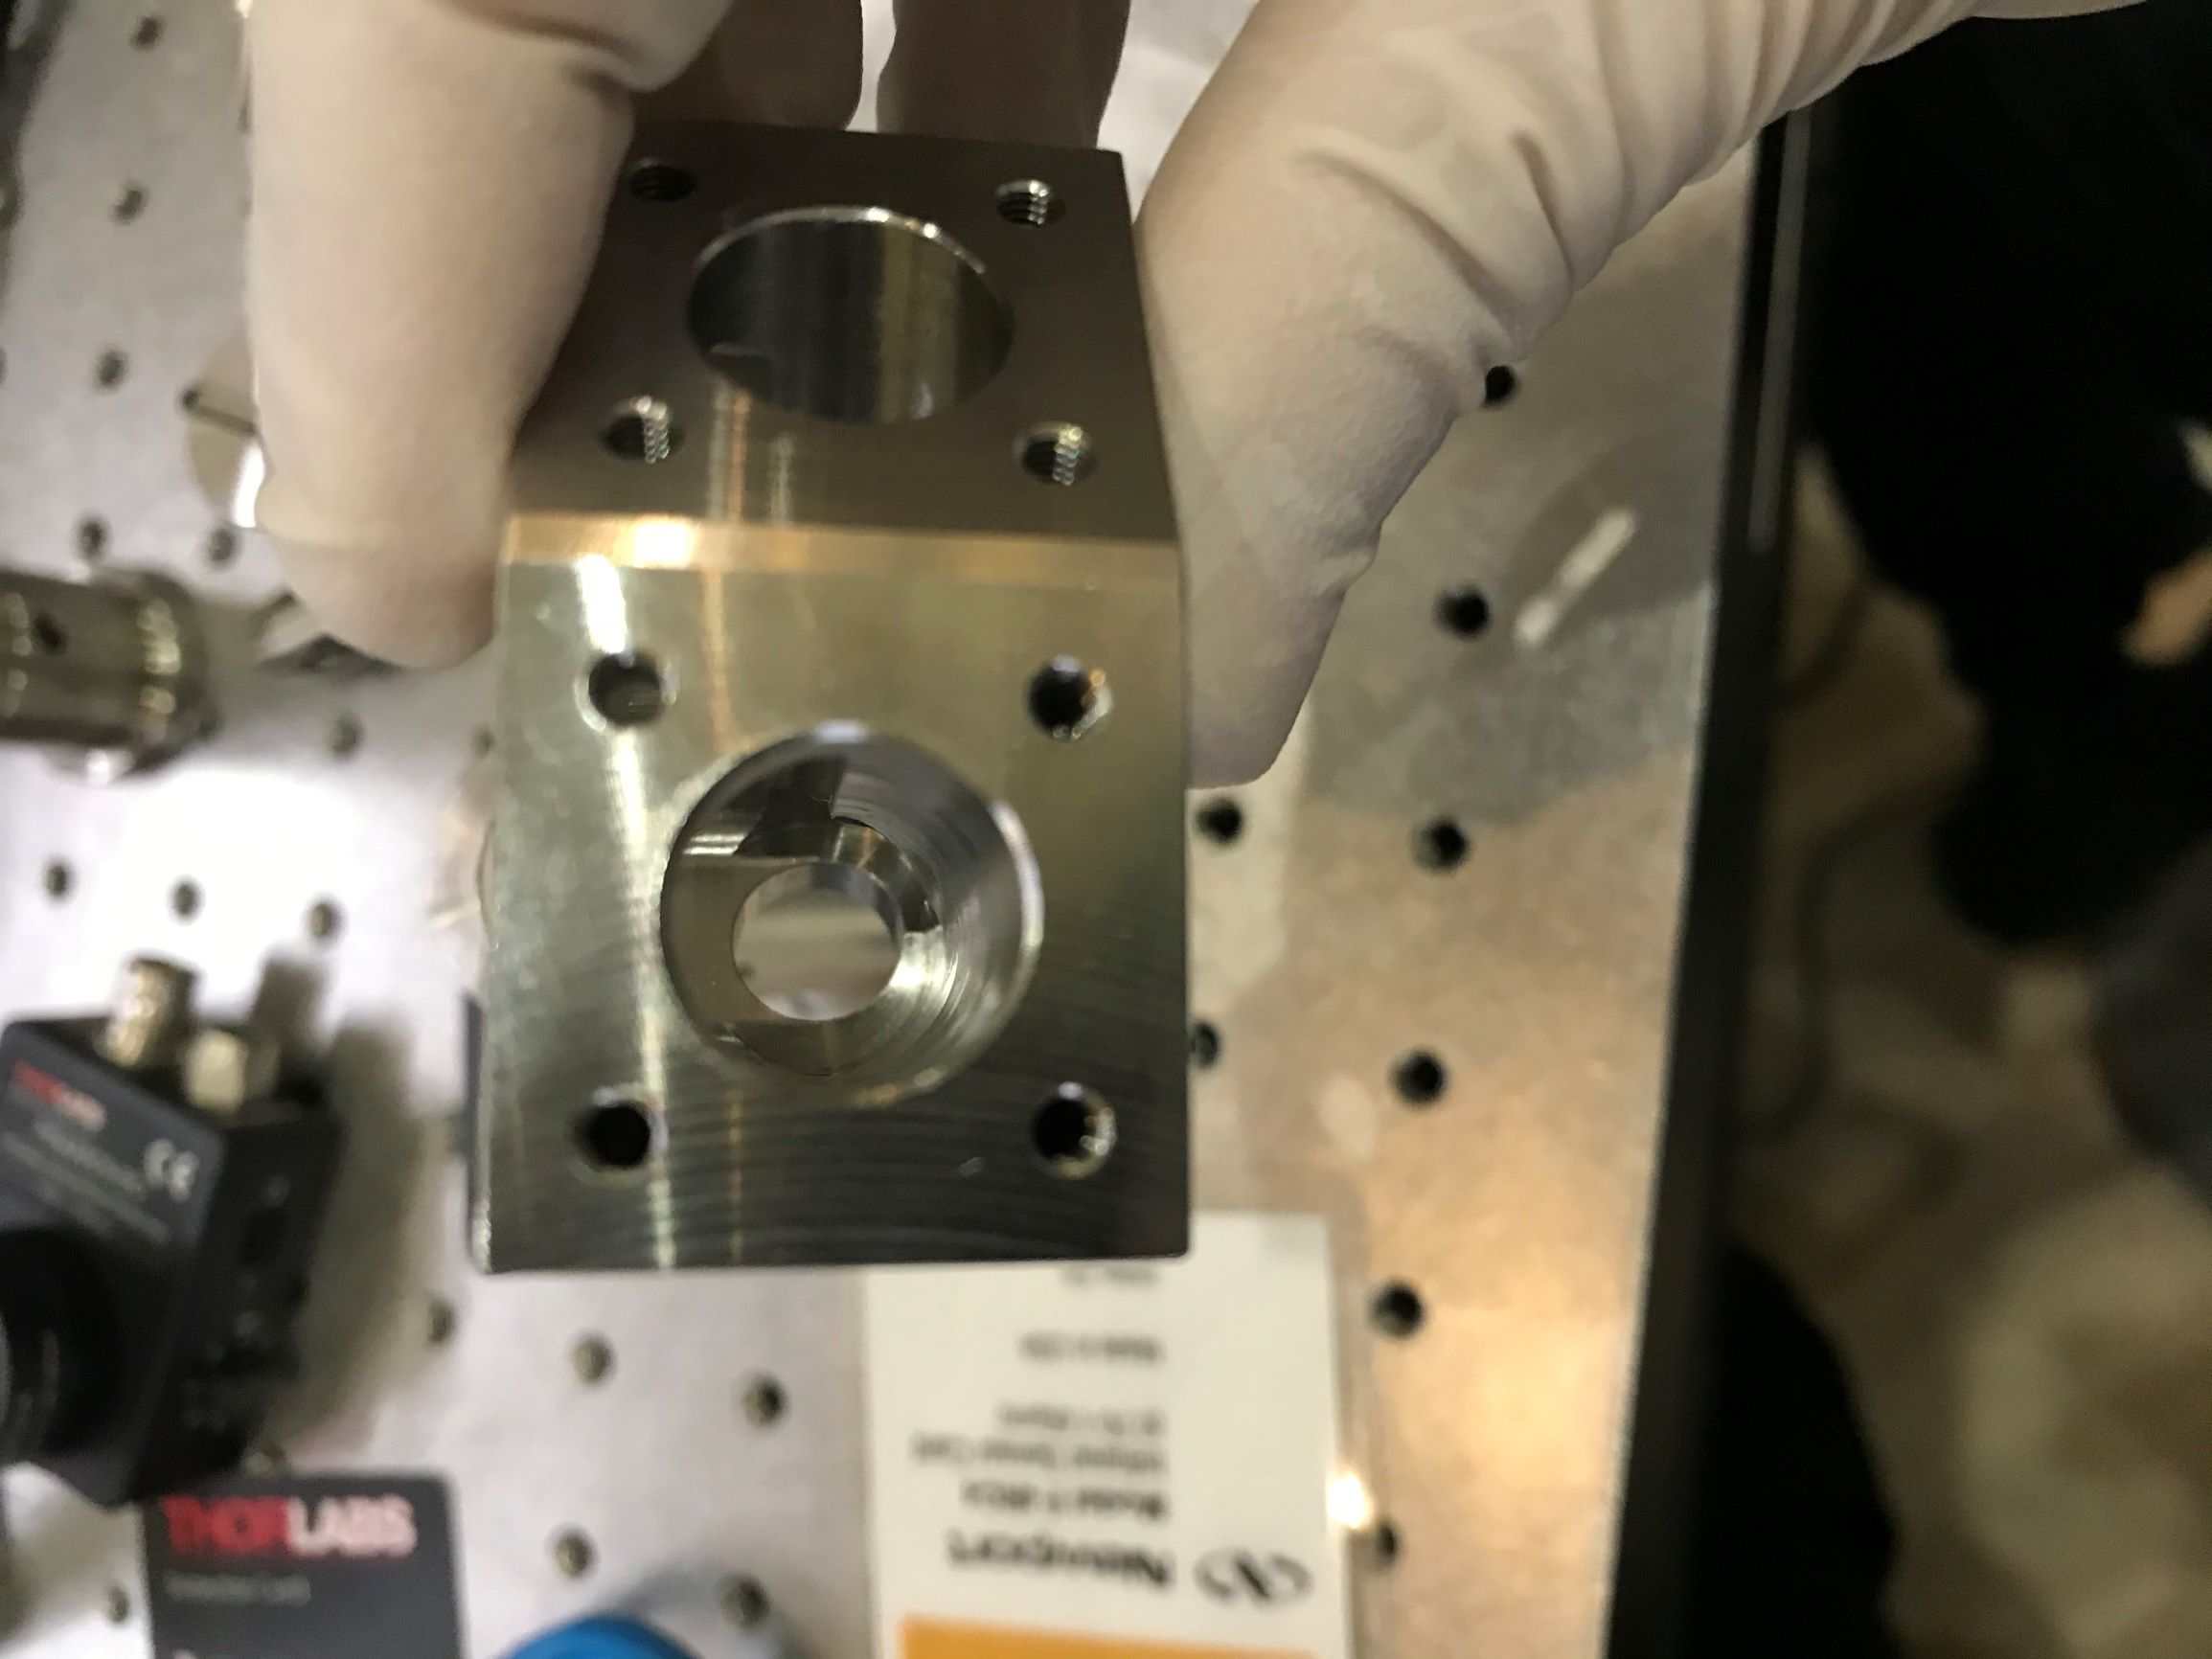
And the sensor card is shown in the attached figure 1, which has a plastic shining surface. It will reflect a little bit scatter light which contaminates the shot noise spectrum. Besides, this sensor card is put in the position which makes it easy to sense the motion of bench in EW direction. So we got the spectrum as in the attached figure2. (In this case, we are using our homodyne as a very sensitive sensor of reflective surface motion)
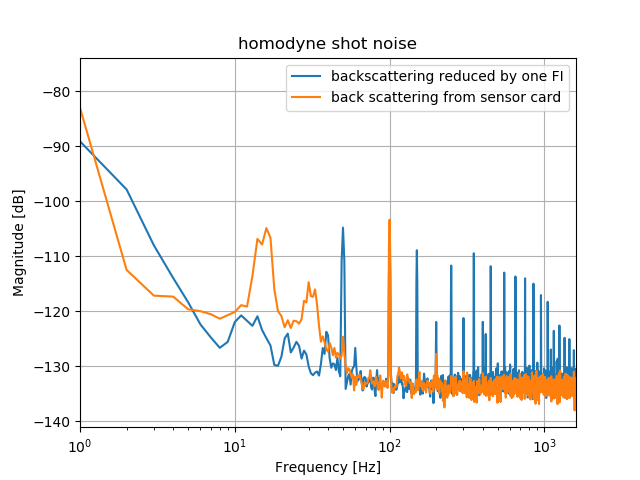
We tried to characterize the effect by putting it farther and farther, but the contamination doesn't change. Until we put it after a Faraday isolator, which means we have an FI to isolate this backscattered light. We got a reduction of peaks by 15dB. See attached figure 3. But the backscattering noise didn't disappear.
But we need to notice that if the reflected surface doesn't move, we will not have this backscattering noise. For example, when we don't put anything in-between OPO and homodyne, although there should be light back-reflected from OPO to homodyne, we don't have backscattering noise.
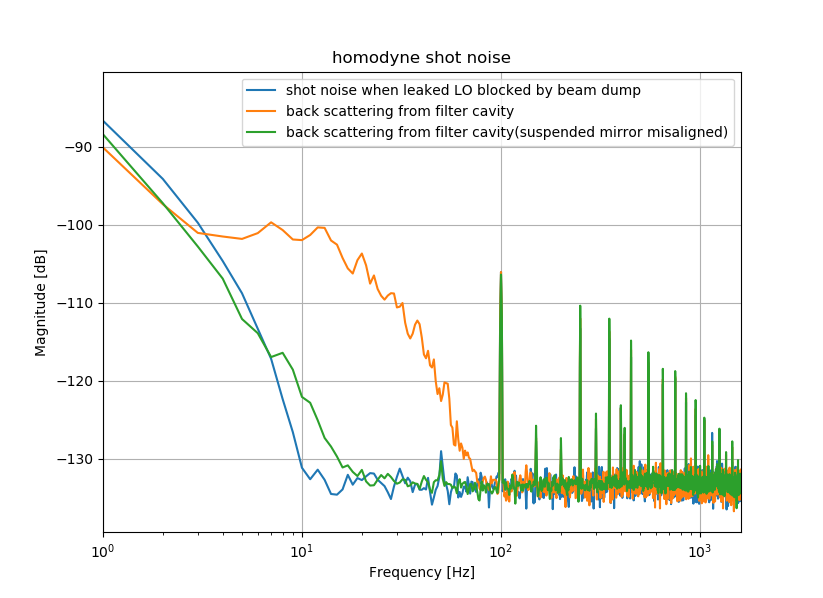
Then we tried to send this leaked LO to filter cavity, we got the homodyne shot noise spectrum as shown in the attached figure 4. This measurement suggests that our low-frequency bump in FDS is from this backscattering noise. Also, the phase noise of squeezing will not introduce the increase of floor by almost 30dB because the anti-squeezing is only ~15dB.
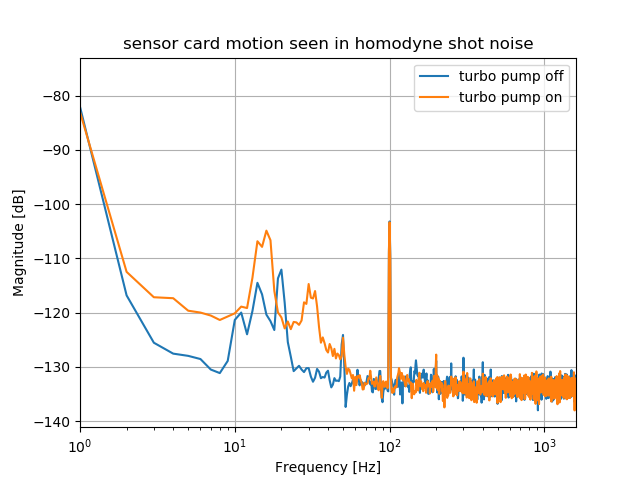
Additional: we measured the backscattering noise from the sensor card when turbopump is on and off. We could see the difference from attached figure 5, which means it really introduces more bench motion.
The scripts to open and close dithering loop has been changed from bash to python. This allowed to change the state of the loop input swiitch easily. This should make the loop engagment smoother in the case of integrators ( as we have for dithering)
According to the investigations done by Shoda-san and Yuhang last week, it seems that the excess of noise appearing sometimes in the BS oplev is due to the PSD itself.
Today I have replaced it with a simiar one, with the same gain. The spectra of pitch and yaw are exactly the same of the old one (when no noise was present) and for the moment no excess of noise has been observed with the new PSD. I could close the damping loop without change any gain. I will keep monitoring the spectra in the next days.
According to elog1868, there is a peak of bench appears at 14.2Hz when we excite EW direction.
Matteo and Yuhang
Today we tried to align homodyne to have flat shot noise until 10Hz. However, no matter what we tried(including aligning homodyne's BS, two lenses in front of homodyne, and adjusting the flipping mirror ) we always have a strong peak at 14.25Hz and its harmonics. We still don't understand why we have these peaks.
We checked the resonance of the bench and it is not the reason.
We checked we didn't send any modulation to IR phase shifter.
We checked we didn't send perturbation to IRMC. Also, IRMC error signal/reflection is very clean at low frequency.
We checked the main laser doesn't have strange behavior. We checked the noise eater. We checked PLL.
We will continue the investigation next week.
According to elog1868, there is a peak of bench appears at 14.2Hz when we excite EW direction.
I checked the shape of spaer which was re-machined with two half inch mirrors at output port and folding port.
The beam can pass through the spacer and the reflected beam can come out.
Therefore the shape seems roughly O.K.
The next step is that gluing the fused silica mirrors to mirror holders for installation of the folded cavity.
In addition, I installed a post and a translation stage in TEM00 path for mode matching lens.
I will continue installation of the posts and stages for other beam paths.
Today, just after I align GR well (GR transmission is at the level of ~2550counts, with 12.28mW GR injected to FC) to FC, I checked BAB in FC transmission and reflection.
For transmission, the level is 340counts. Then I measured the injected power into FC, it was 0.333mW. By comparing the standard number we recored in WIKI, transmission is misaligned by ~20%. ((340-100)/(392-100)=82%)
For reflection, roughly also 20% is misaligned. (check the last attached picture for reflection in to AMC)
Last time we aligned BAB to FC is this Monday.
I tried to align FC again and the second time, TRA got misalign 60% while reflection is also roughly 20%. So reflection seems to be less sensitive to alignment.
I have updated the RT model and medm screen.
- The WD system is added.
- The commish message is also added and that can be seen from the sitemap.adl. Here, you can leave the comment when you do not want someone else to touch the FC remotely.
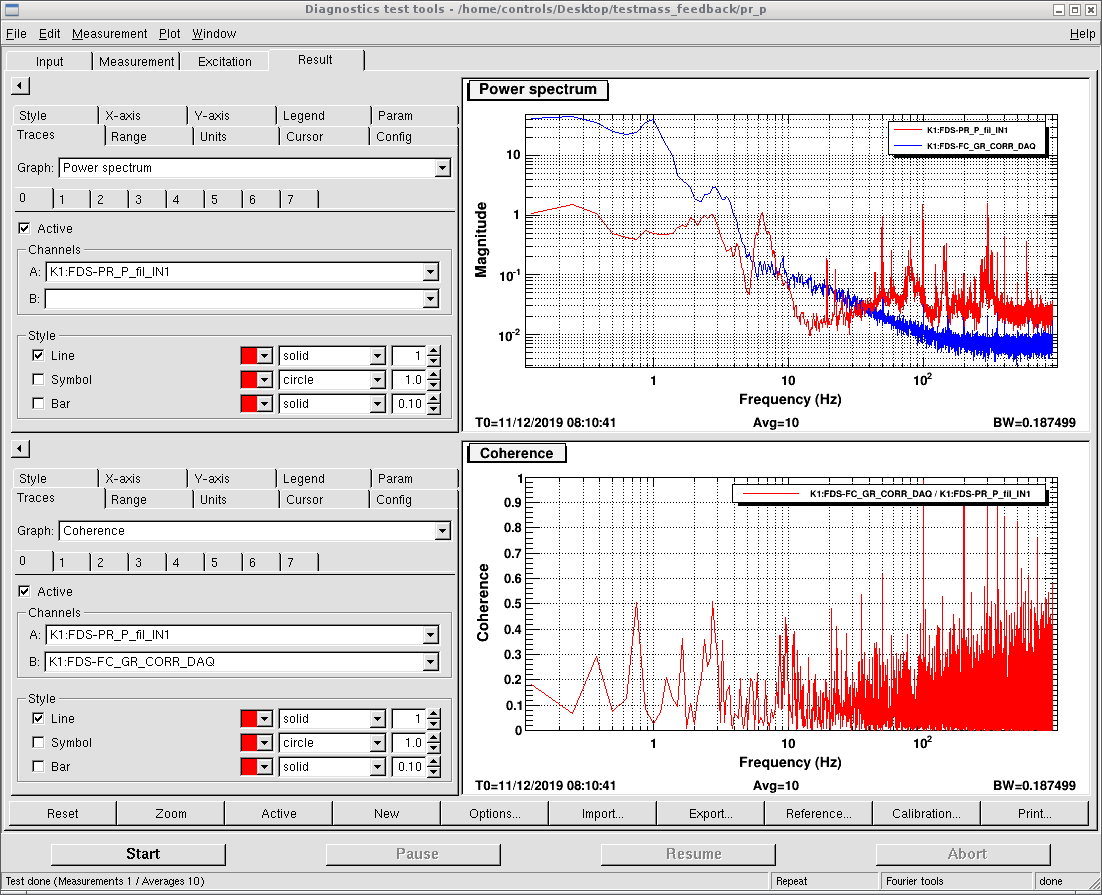
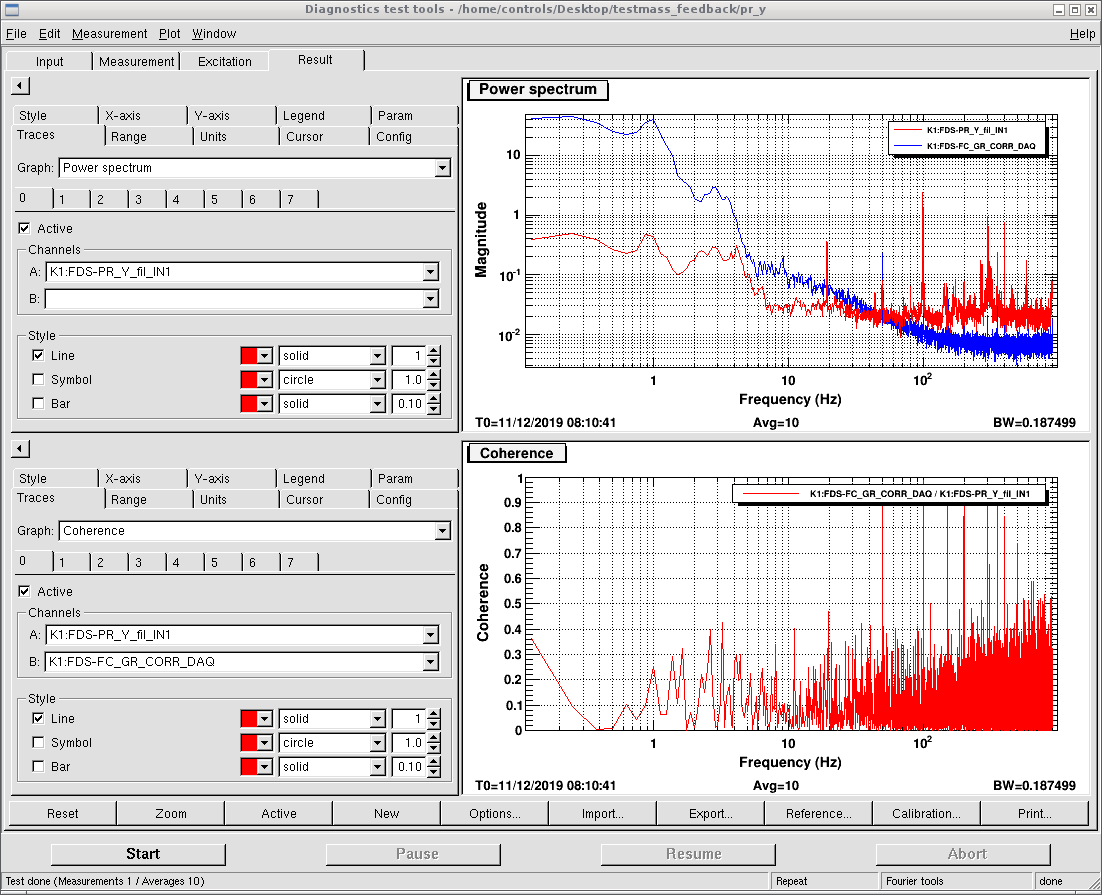
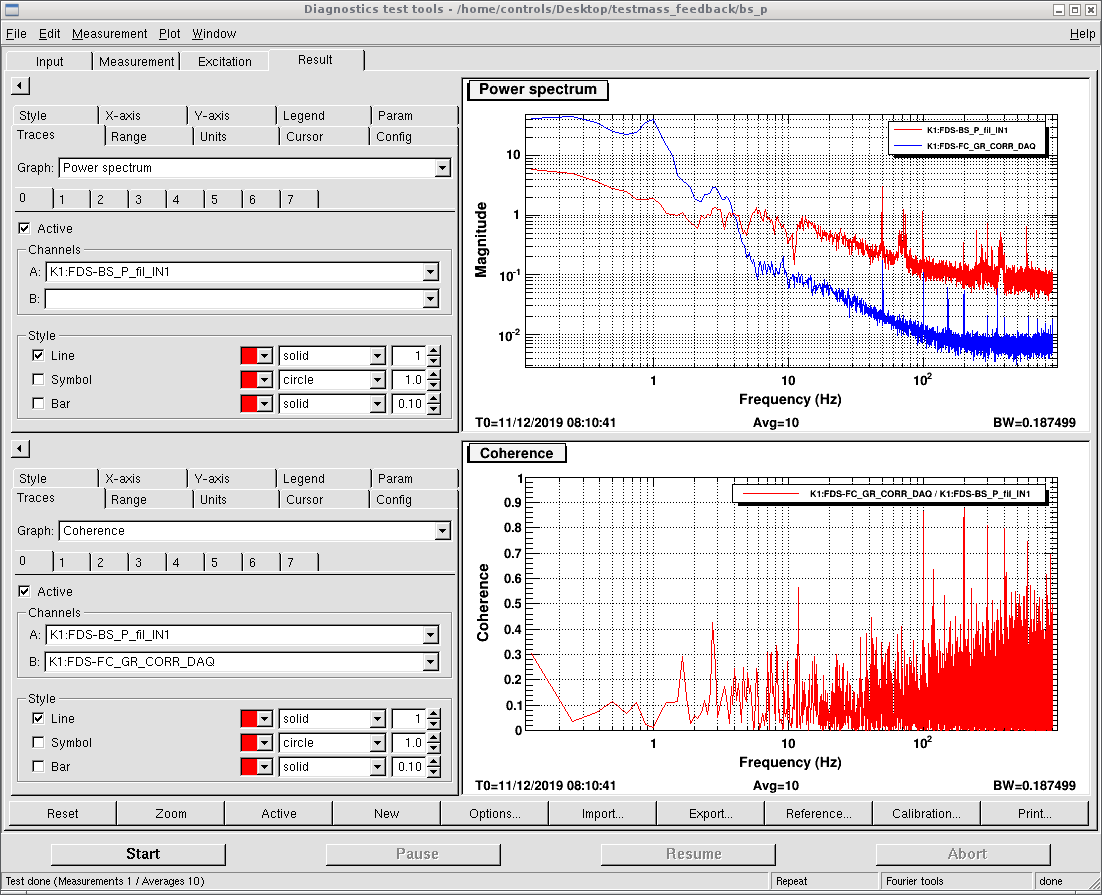
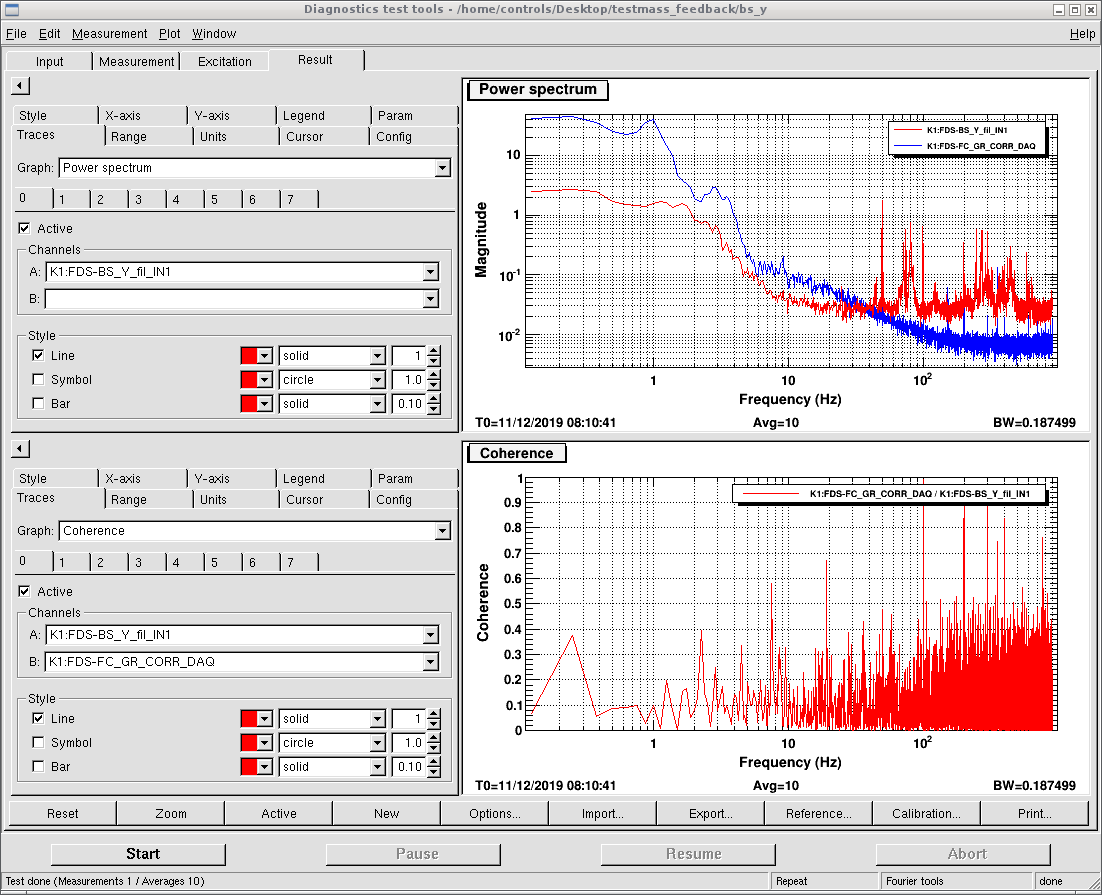
Shoda and Yuhang
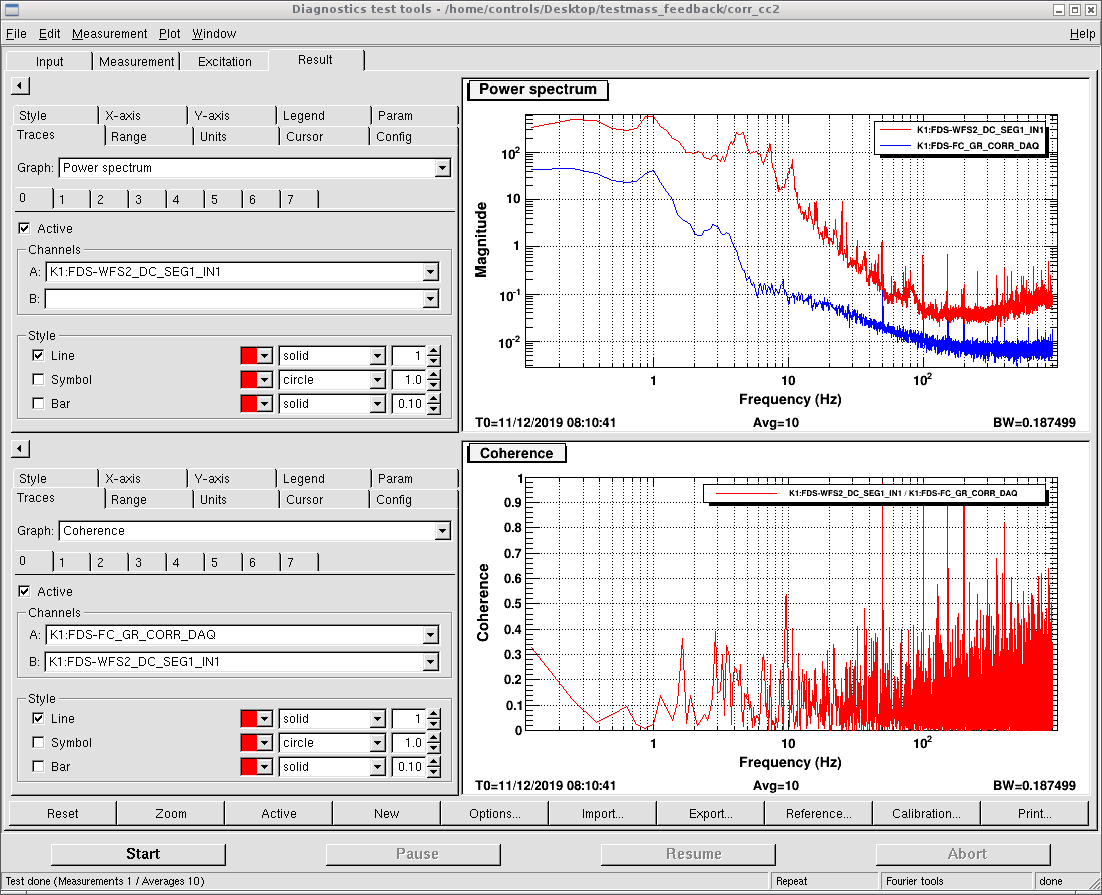
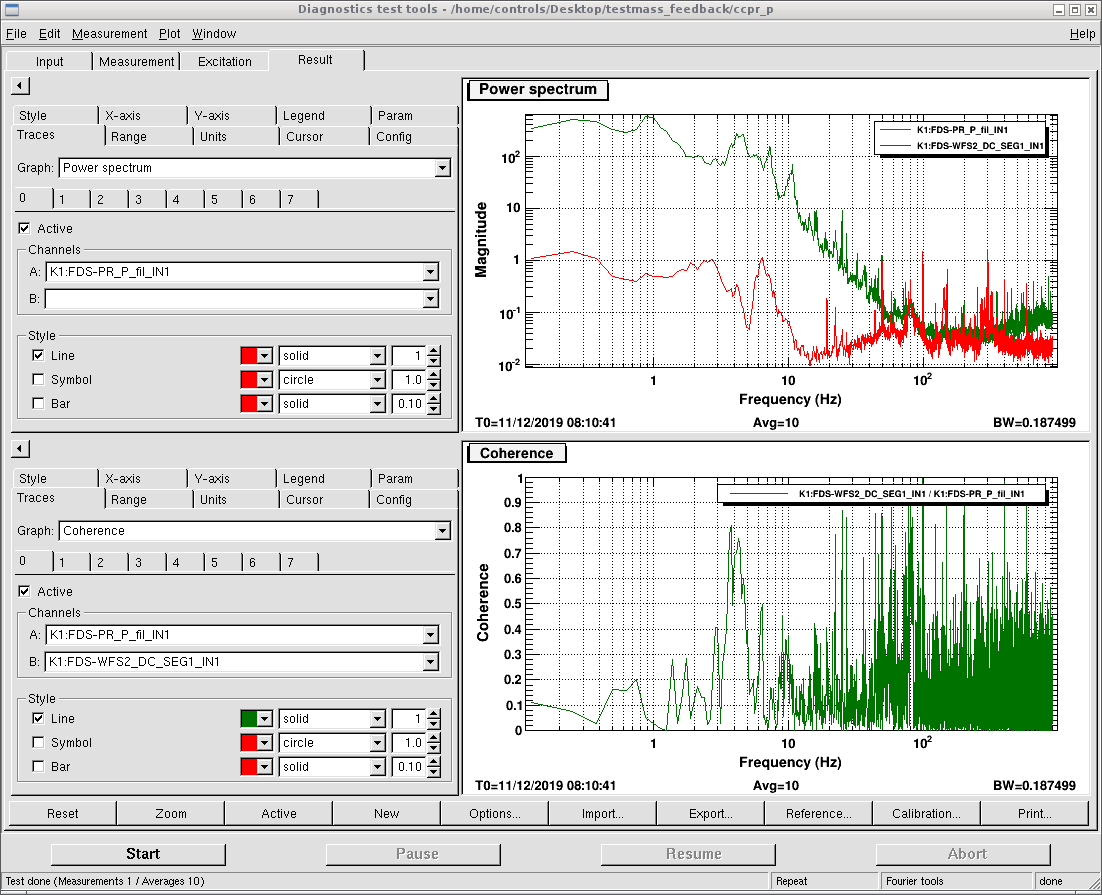
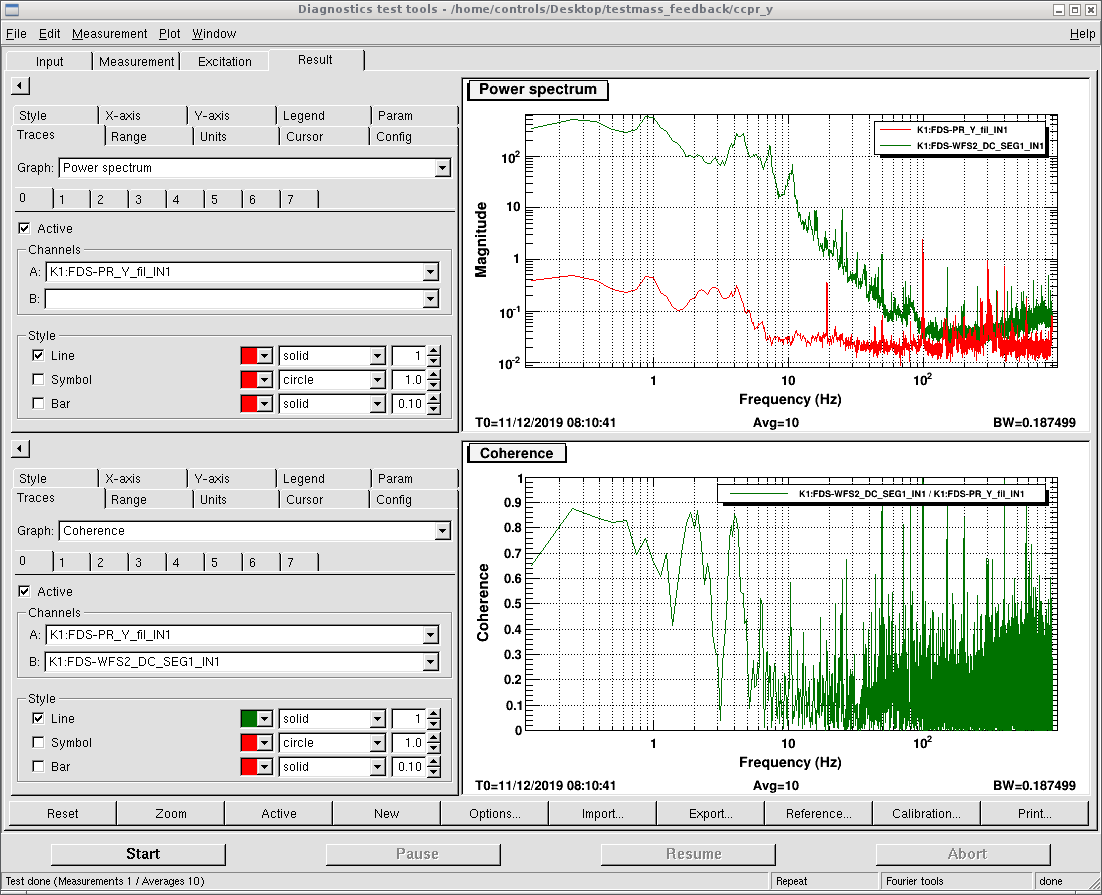
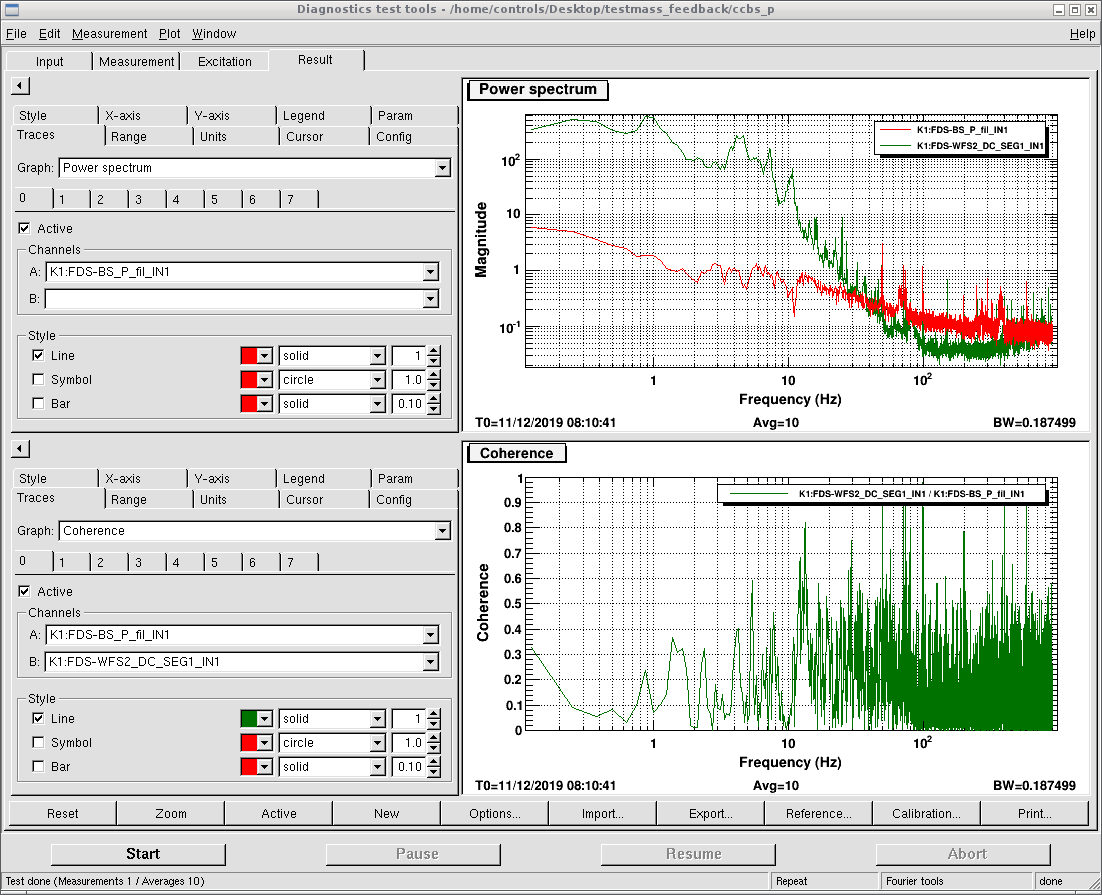
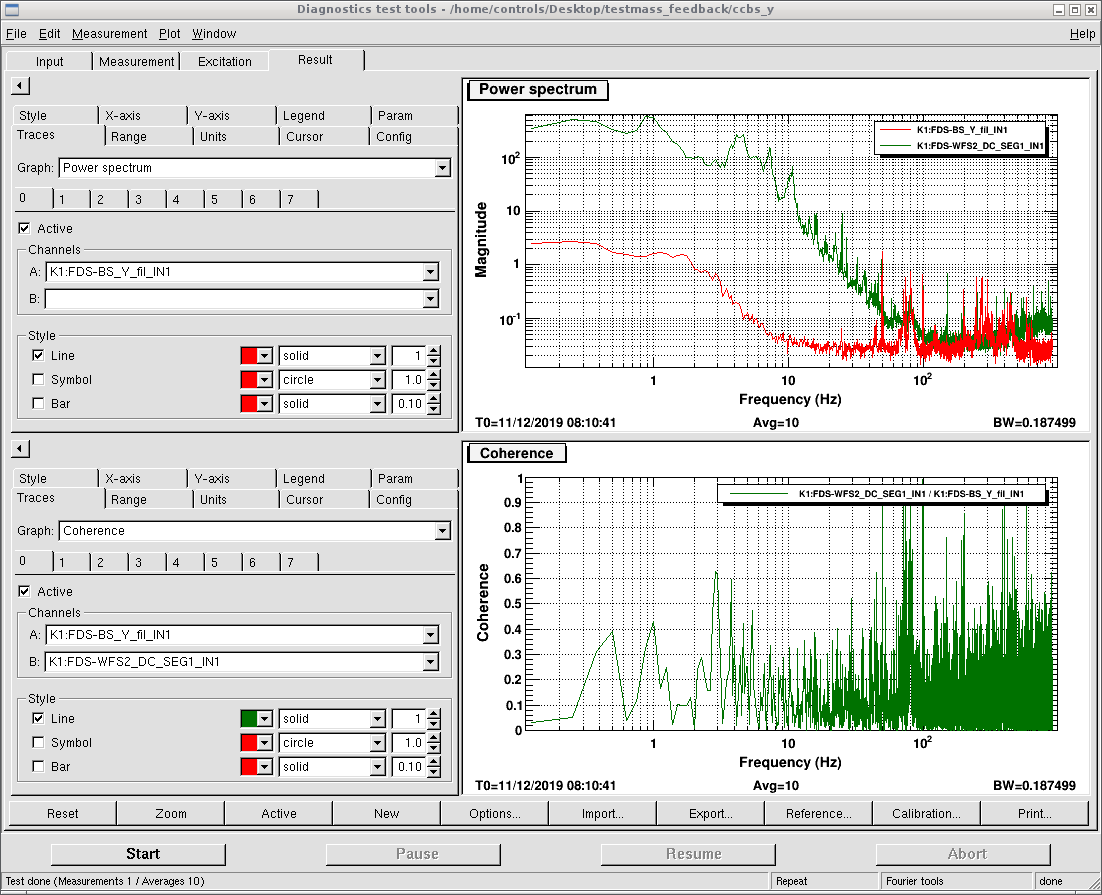
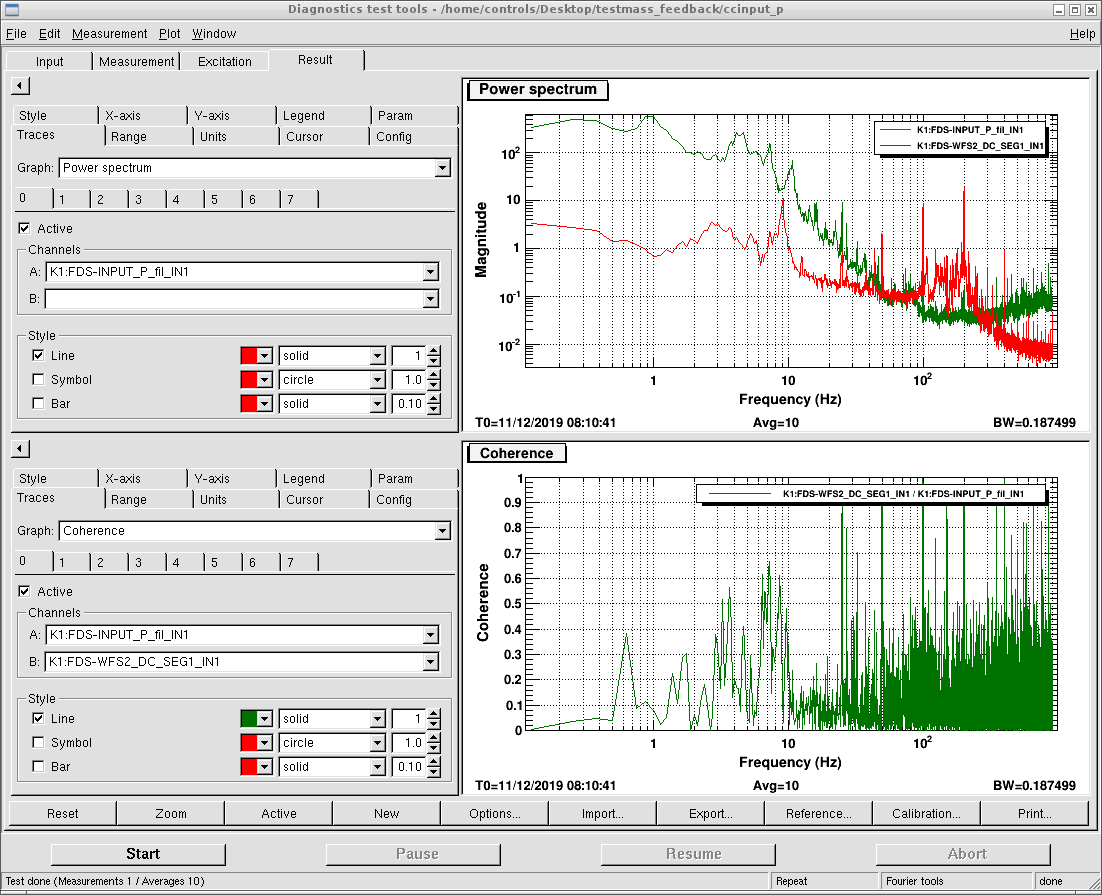
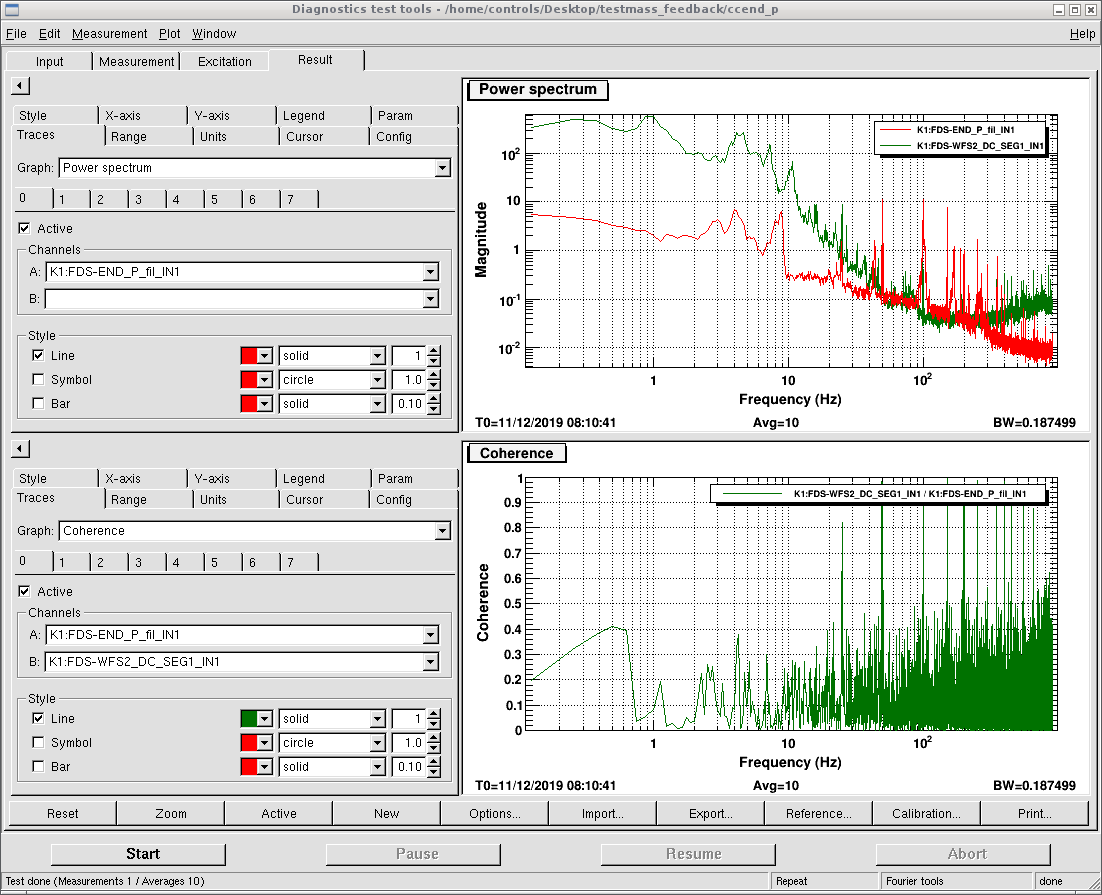
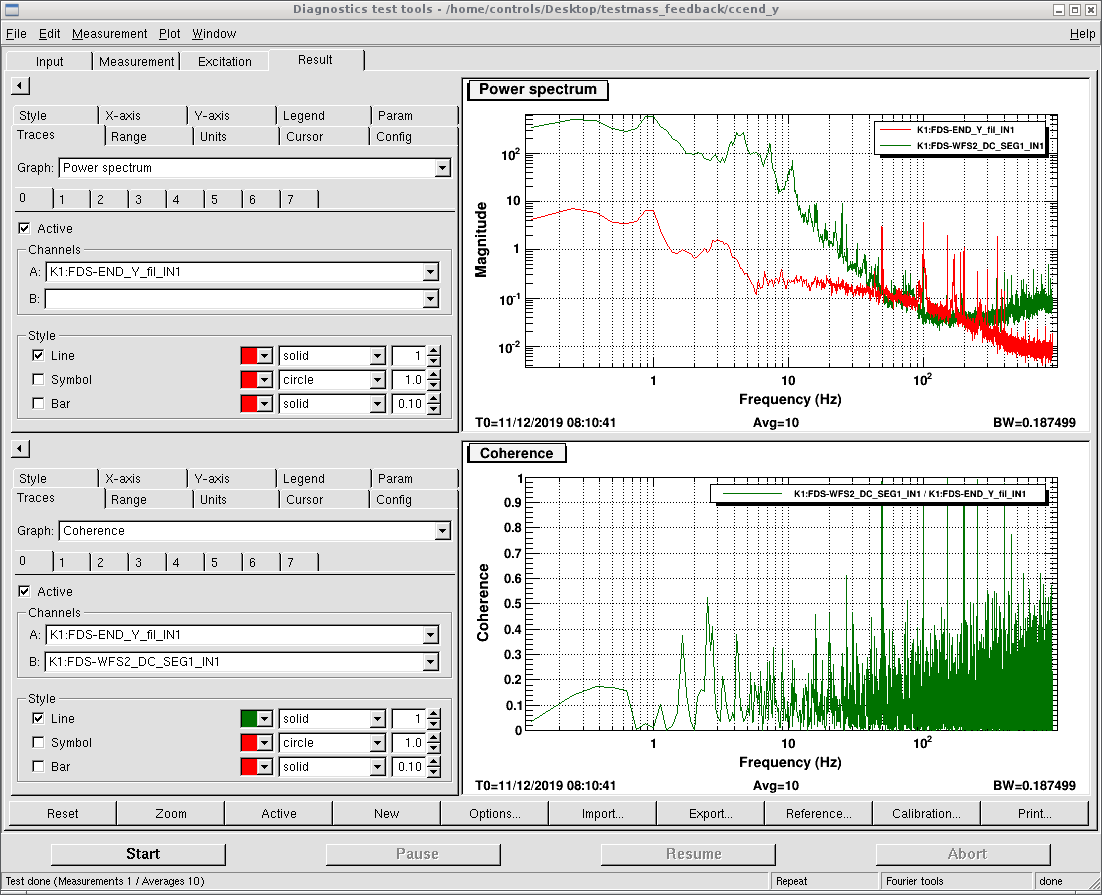
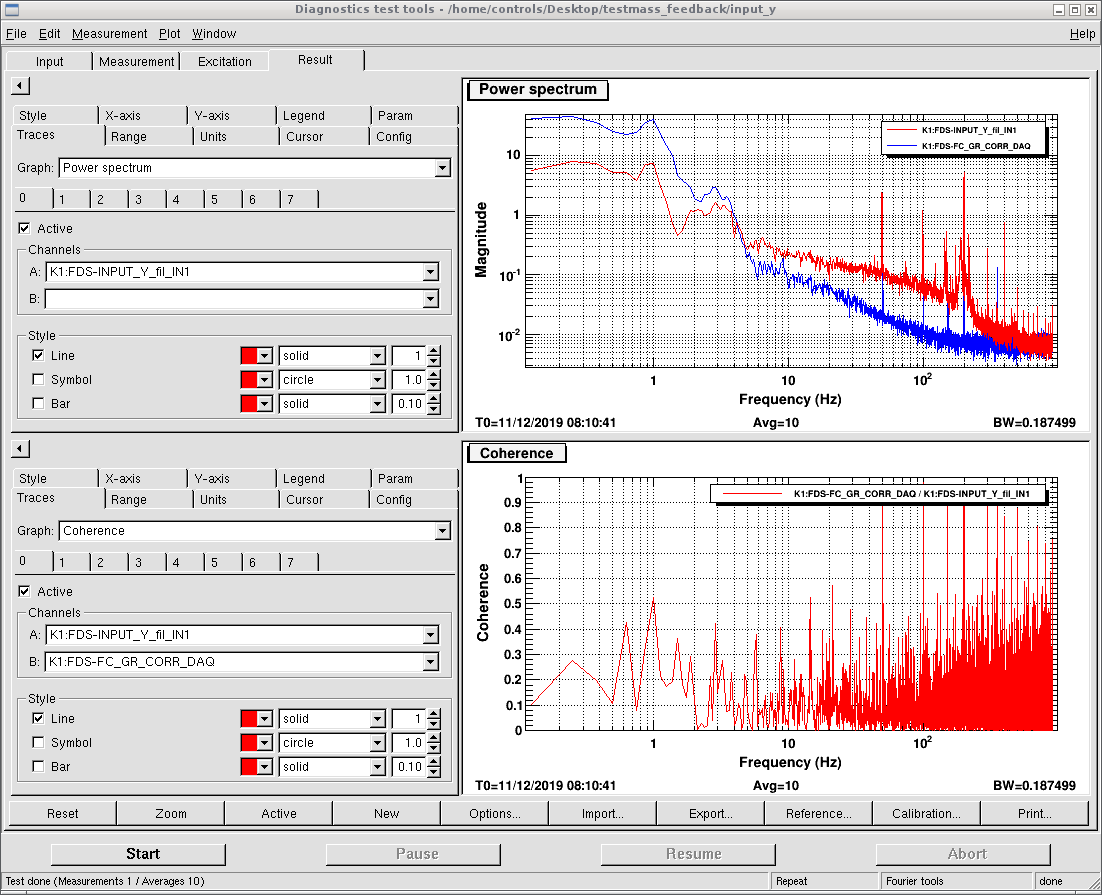
We checked the coherence between each suspended mirror and CC2 correction signal.
The coherence below 0.5 is not mentions in the following form, check detail in the attached pictures.
|
|
pitch |
yaw |
|
PR |
0.8 coherence around 4Hz |
0.9 coherence from 2 to 4Hz |
|
BS |
0.8 coherence @12Hz |
0.6 coherence @3 and 4Hz |
|
Input |
0.55 coherence from 3 to 10Hz |
0.9 coherence from 2 to 3Hz |
|
End |
no |
no |

Shoda and Yuhang
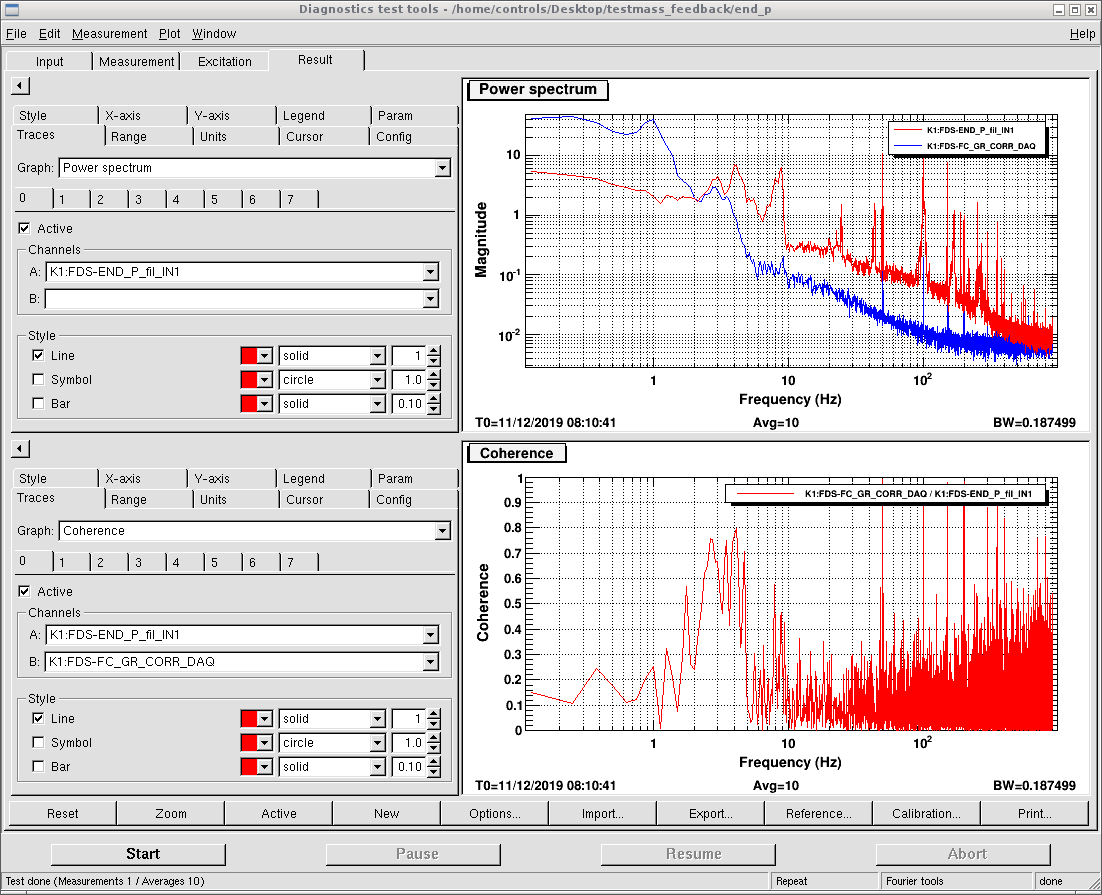
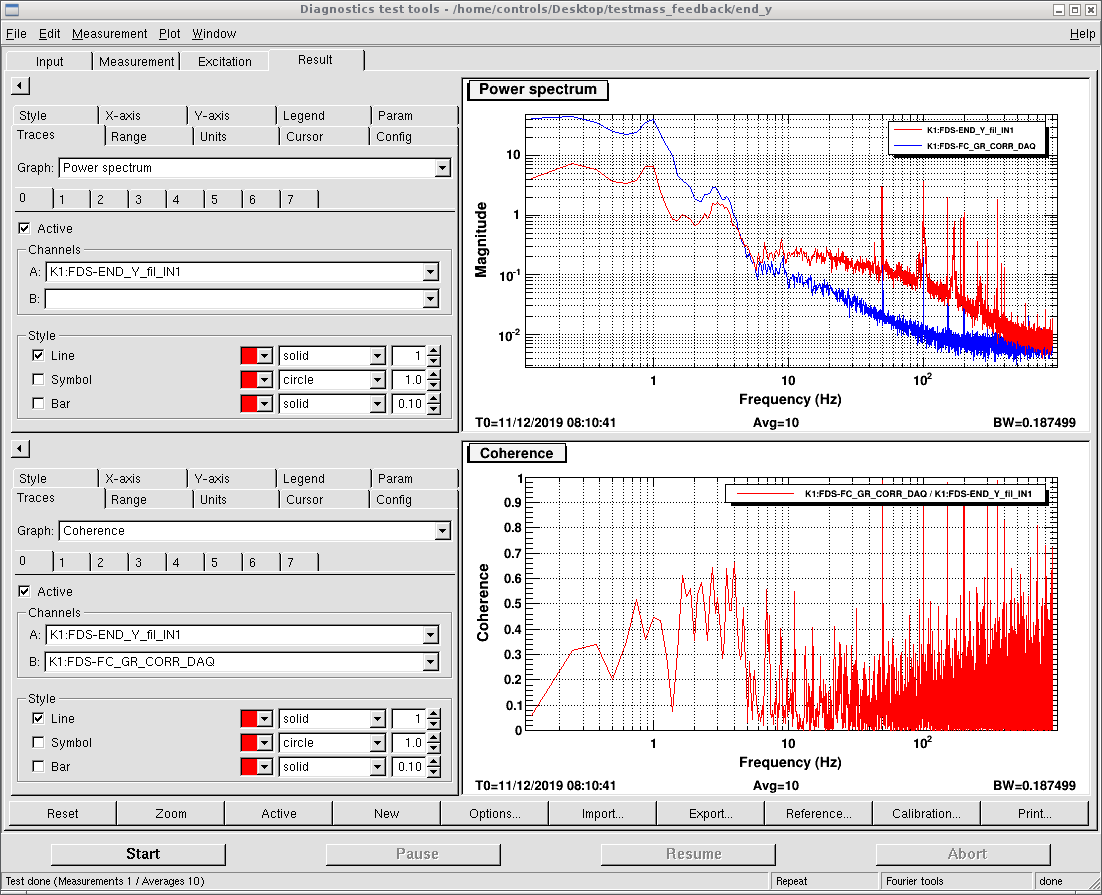
We checked the coherence between each suspended mirrors oplev signal and correction signal to FC length. The situation is summarized as follows.
The coherence below 0.5 is not mentioned. For the detail, please check the attached figures.
|
|
pitch |
yaw |
|
PR |
almost no coherence |
almost no coherence |
|
BS |
almost no coherence |
almost no coherence |
|
Input |
coherence of 0.8 @ 9Hz |
almost no coherence |
|
End |
around 2~5Hz coherence of 0.8 |
around 2~4Hz coherence of 0.6 |

Yaochin and Yuhang
Since last week we had again the problem of filter cavity. We saw filter cavity transmission varied from 2000 counts to 3000 counts. In the end, we found out actually we are not operating SHG in the optimal temperature. Also, we had a temperature change due to the change of air-conditioner mode, so it varied.
After everything settles down, we fixed again the setting of the filter cavity lock loop.
|
Attenuation |
2.9 |
|
Gain |
2.0 |
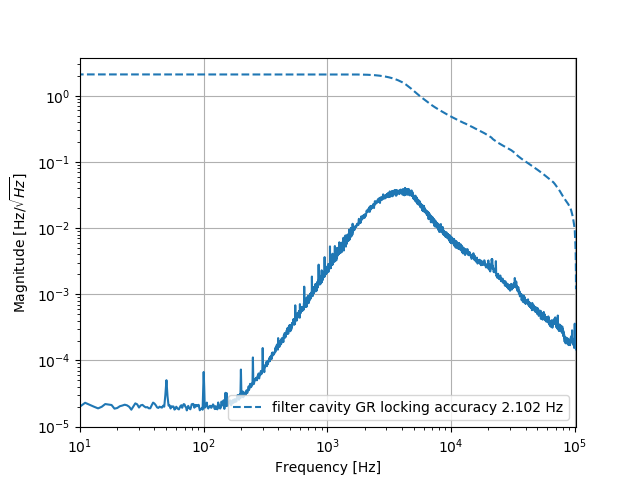
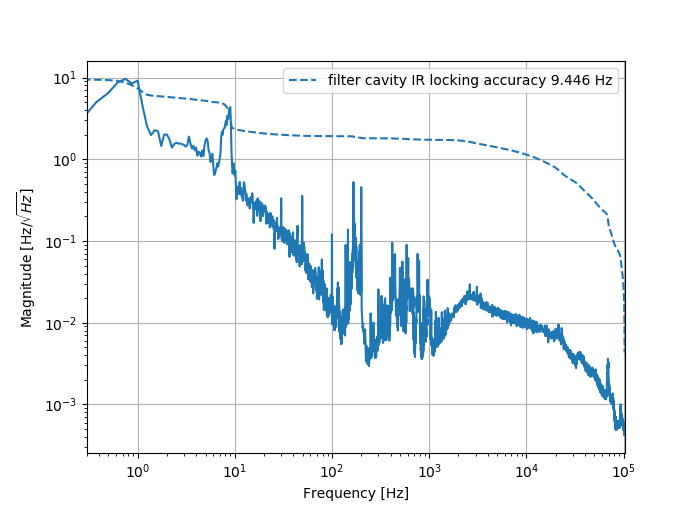
Then we measured the open-loop transfer function again. Also, GR locking accuracy and IR locking accuracy. Especially this time we measured more accurately the low-frequency part of it. And compared with the measurement we did more one year ago(elog 690), the high-frequency part is the same while the low-frequency part is quite different. We should consider more why we have this big difference in IR error signal now.
We should also measure coherence between IR error signal and each oplev spectrum.
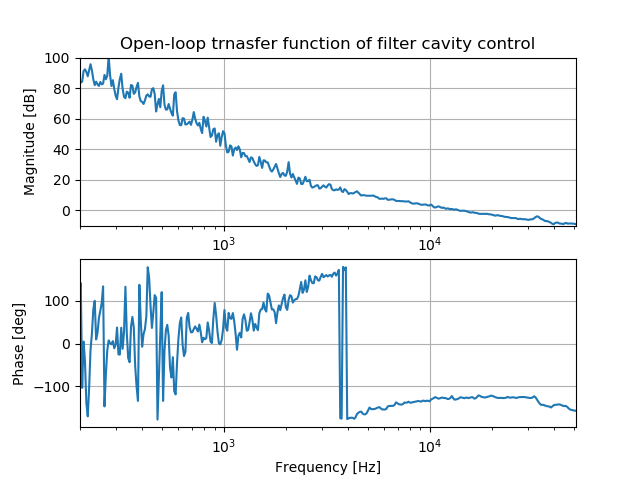
As pointed out in the last FC meeting, the error signal for green and infrared around 10kHz is similar. This is actually strange for me. Due to the cavity pole for infrared and green has a factor around 25 difference. Above their pole frequency, the green error signal should be around 25 times larger than infrared.
However, I checked several times this entry and compared with elog642, I couldn't find what is wrong. I will try to measure it again.
As pointed out by Aritomi-san, the formula used to calibrate the measurement had some problem (check entry642). After correcting that, the measurement result becomes reasonable.
I am sorry that what I wrote is wrong. The additional loss is 1-visibility**2. I think it is very clear for us that the efficiency of homodyne is visibility**2. This is written in Henning's thesis.
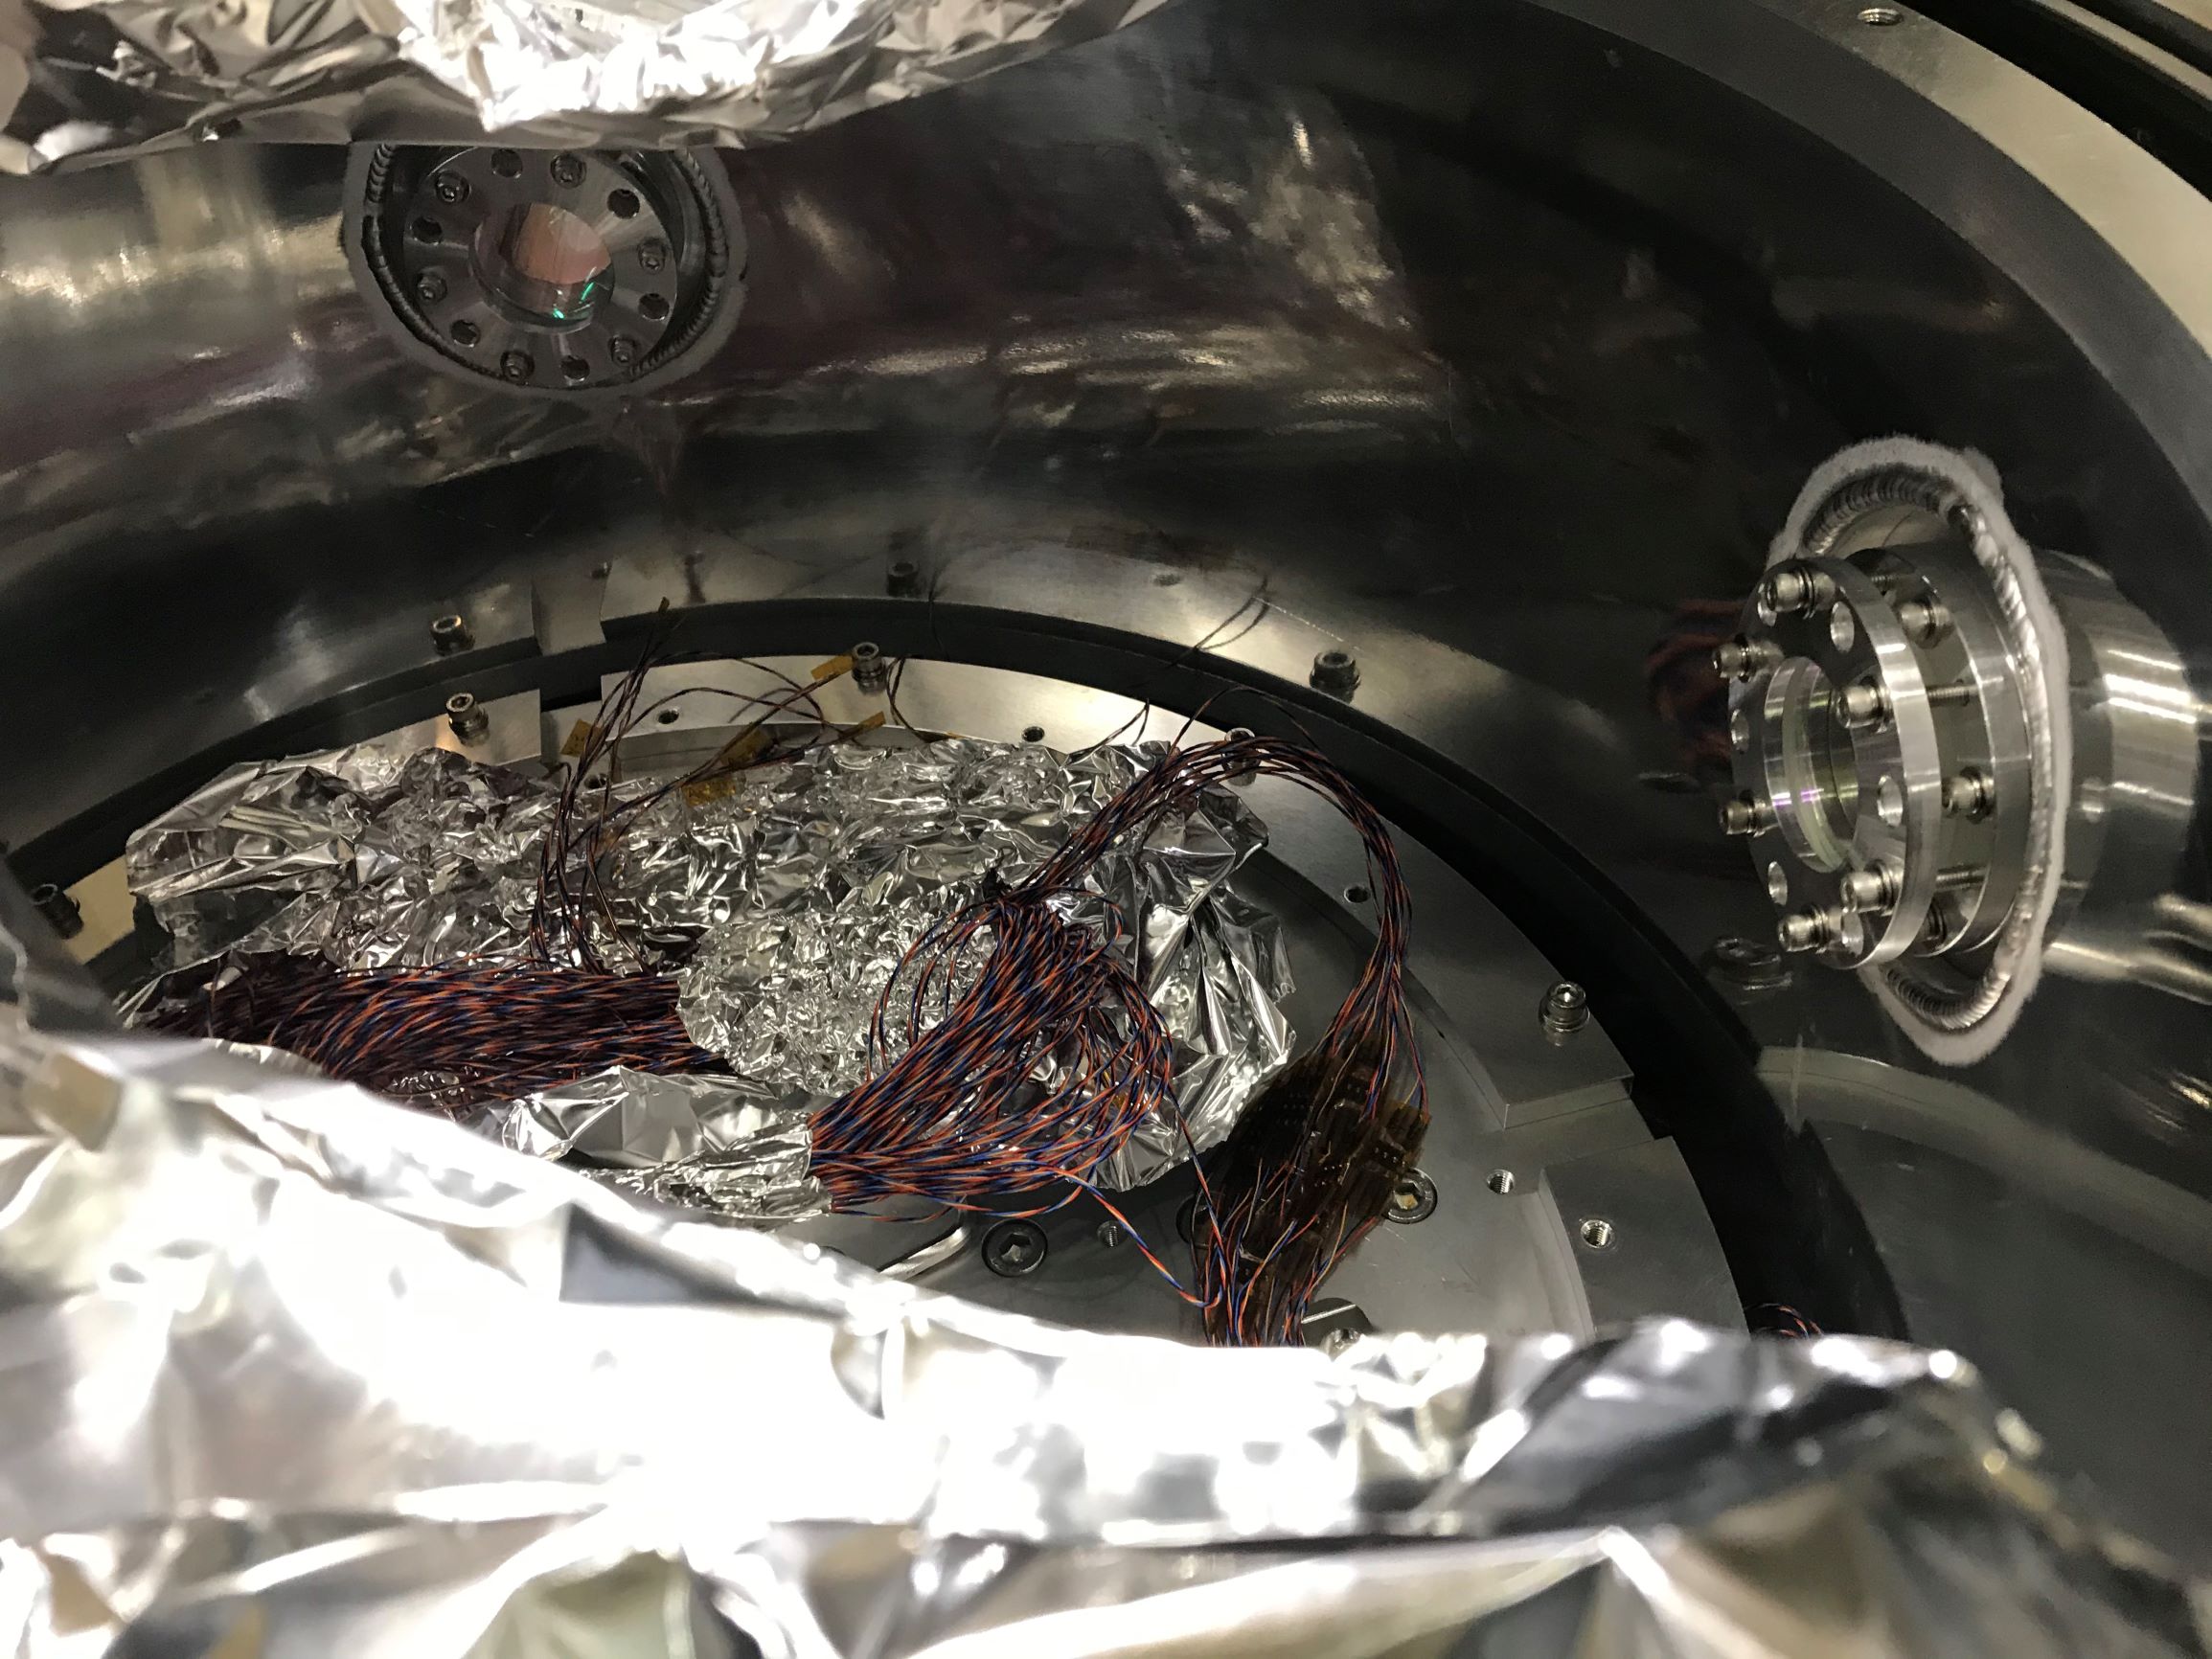
Today, I assembled the third 80K shield window because the first one has some scars (around the edge of the mirrror though).
Therefore I decided to use two better ones for my experiment.
After assembling, I installed two 80K shield windows on the adapters where they are attached at input and output ports as attached picture.
When I was installing, I used indium wire between the mirror holders and adapters in order to improve heat conduction.
[Next Step]
- Cabling inside the chamber
- Install 4K shield
- Cooling test
I think it's better to measure visibility directly.
>> We also considered the loss introduced by non-optimal visibility is the square of (1-visibility).
This seems not correct. This is how I calculated additional loss in entry 1587.
1. Measure voltage of LO, BAB (HWP 0deg), DC offset, visibility (HWP 0deg)
2. Rotate HWP and measure maximum and minimum of visibility
3. Solve the following equation in terms of V_BAB
(V_max-V_min)/(V_max+V_min-2*V_DC)/(2*sqrt((V_LO-V_DC)*(V_BAB-V_DC))/(V_LO+V_BAB-2*V_DC)) == visibility (HWP 0deg)
4. Additional loss should be 1-V_BAB/V_BAB (HWP 0deg)
Simon
Yesterday, while doing the reflection and transmission measurements, I briefly checked the existence of some ghost-beams of the examined polarizers.
It seems so far, that there are ghost beams but I could see them only for P-pol at large AoI (>65 deg).
For S-pol, I couldn't recognize any second order reflection...
Investigation is to be continued.
Simon
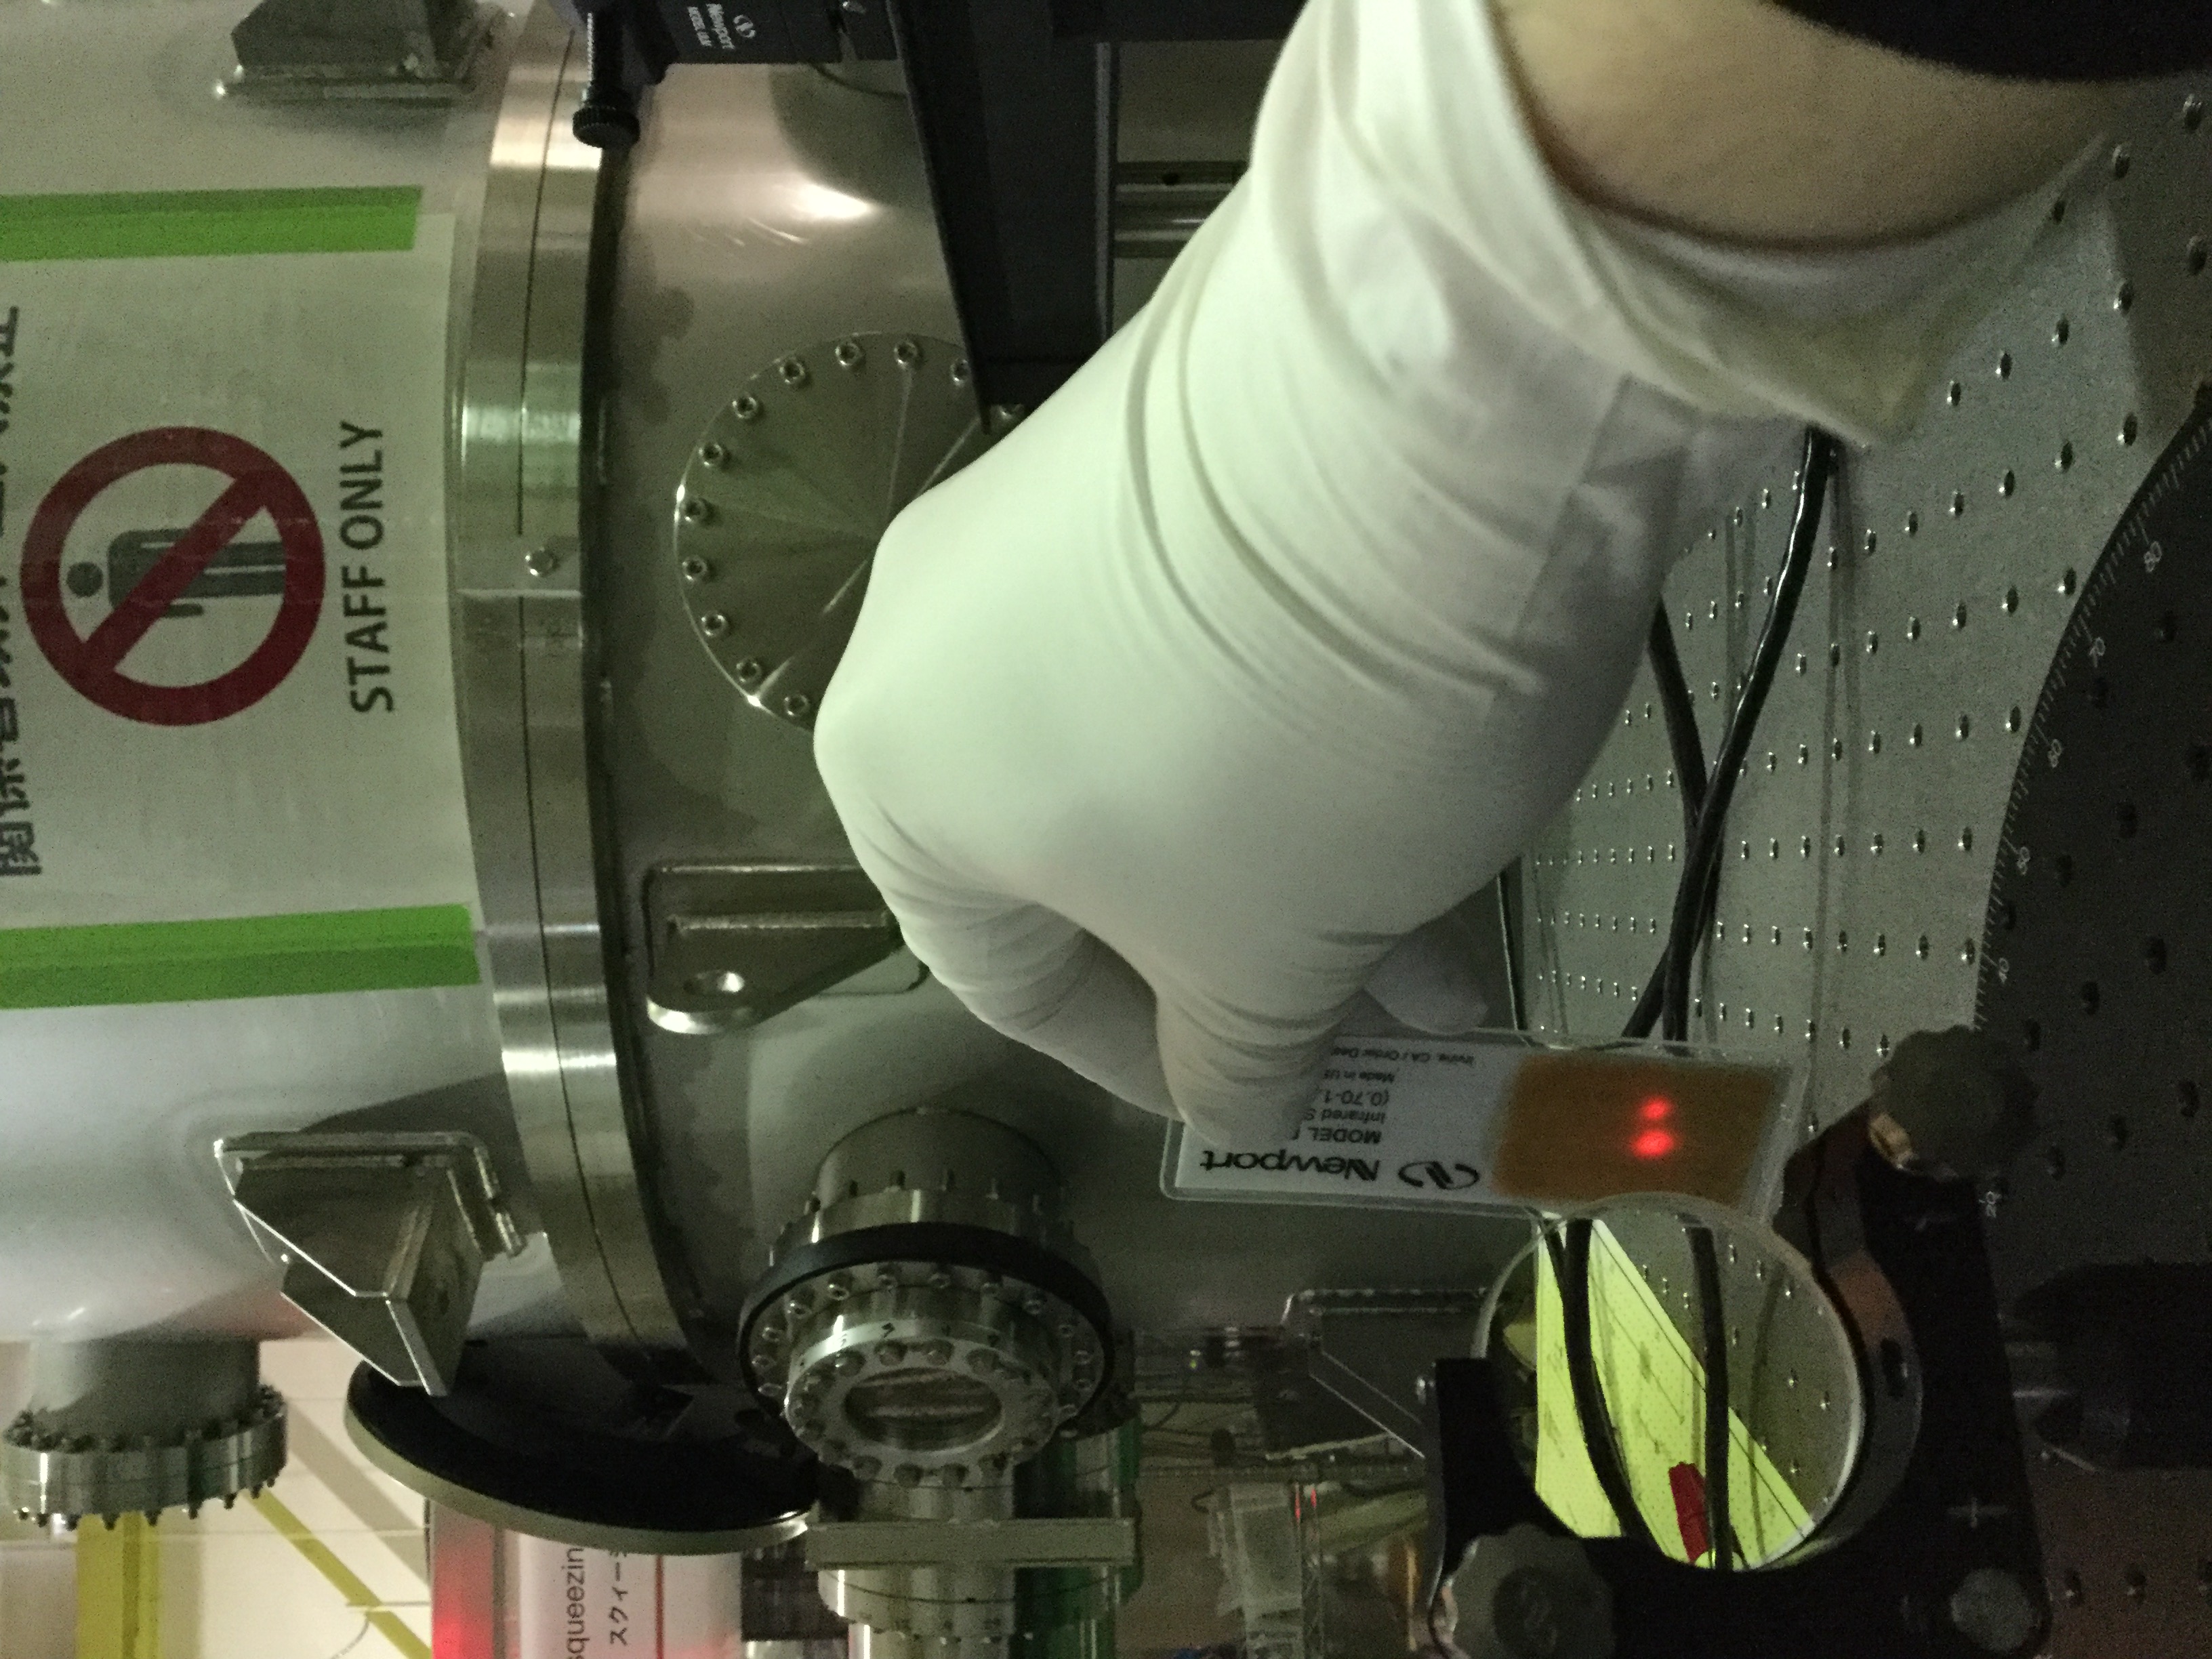
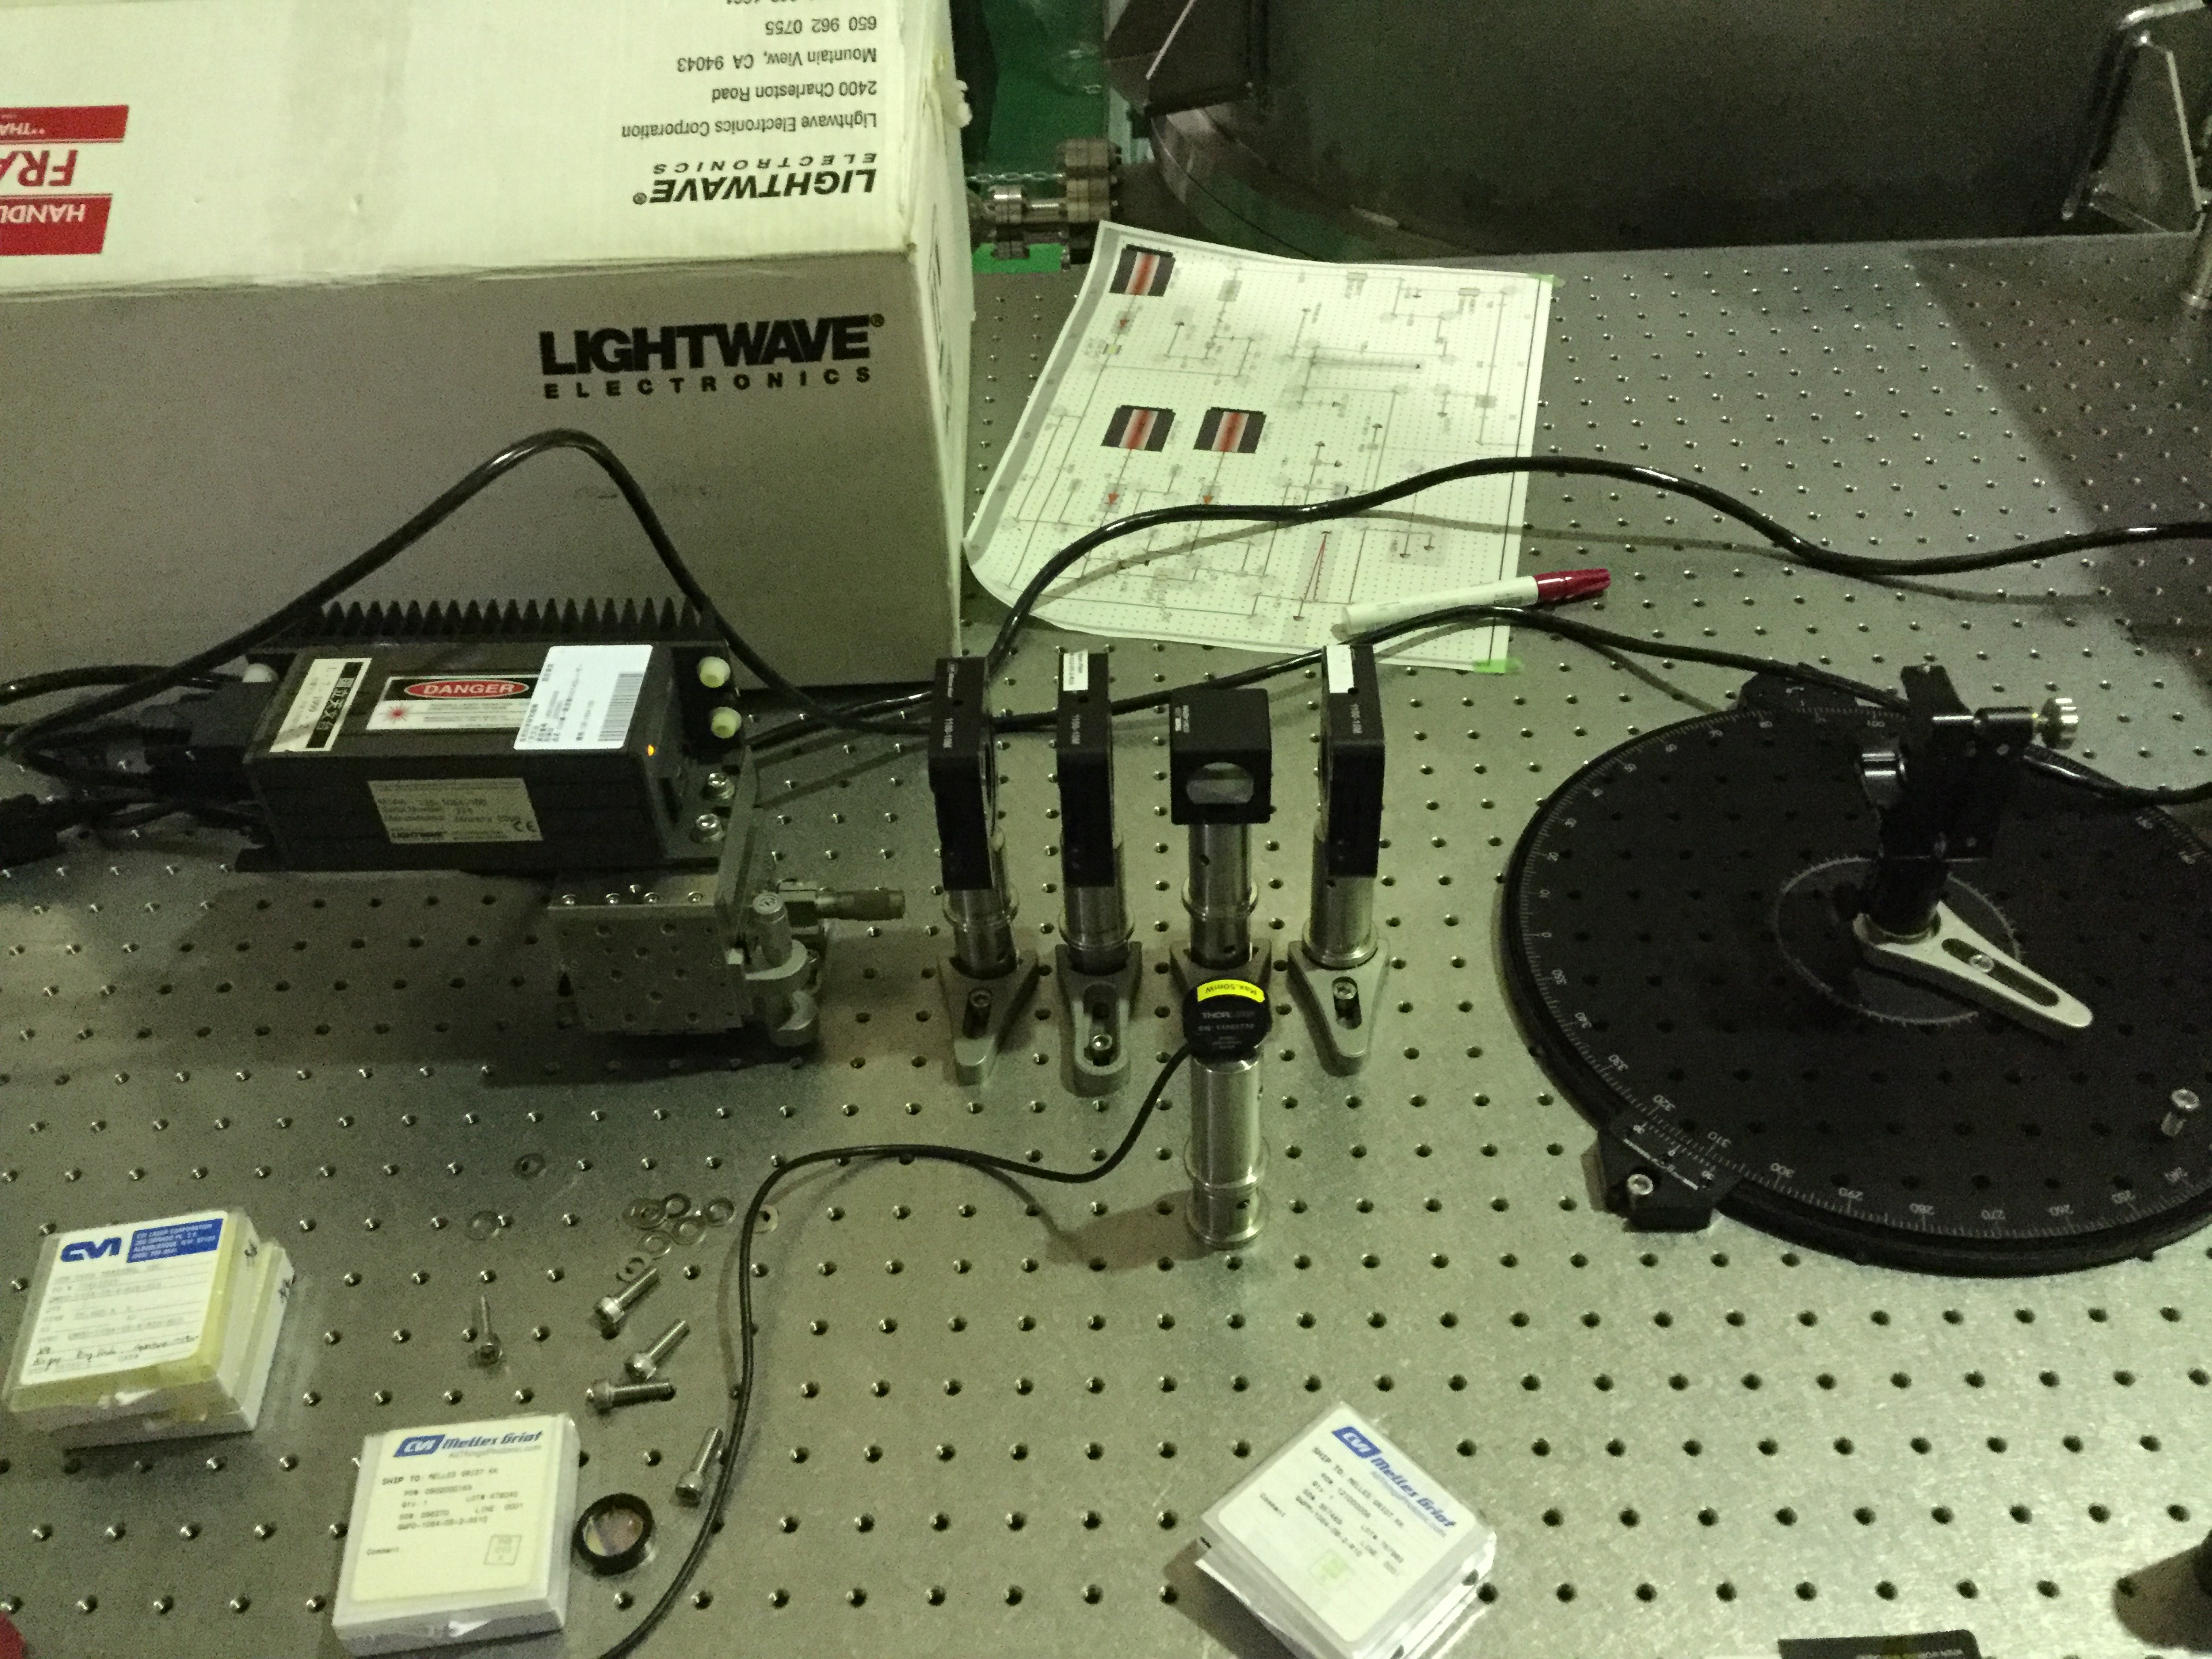
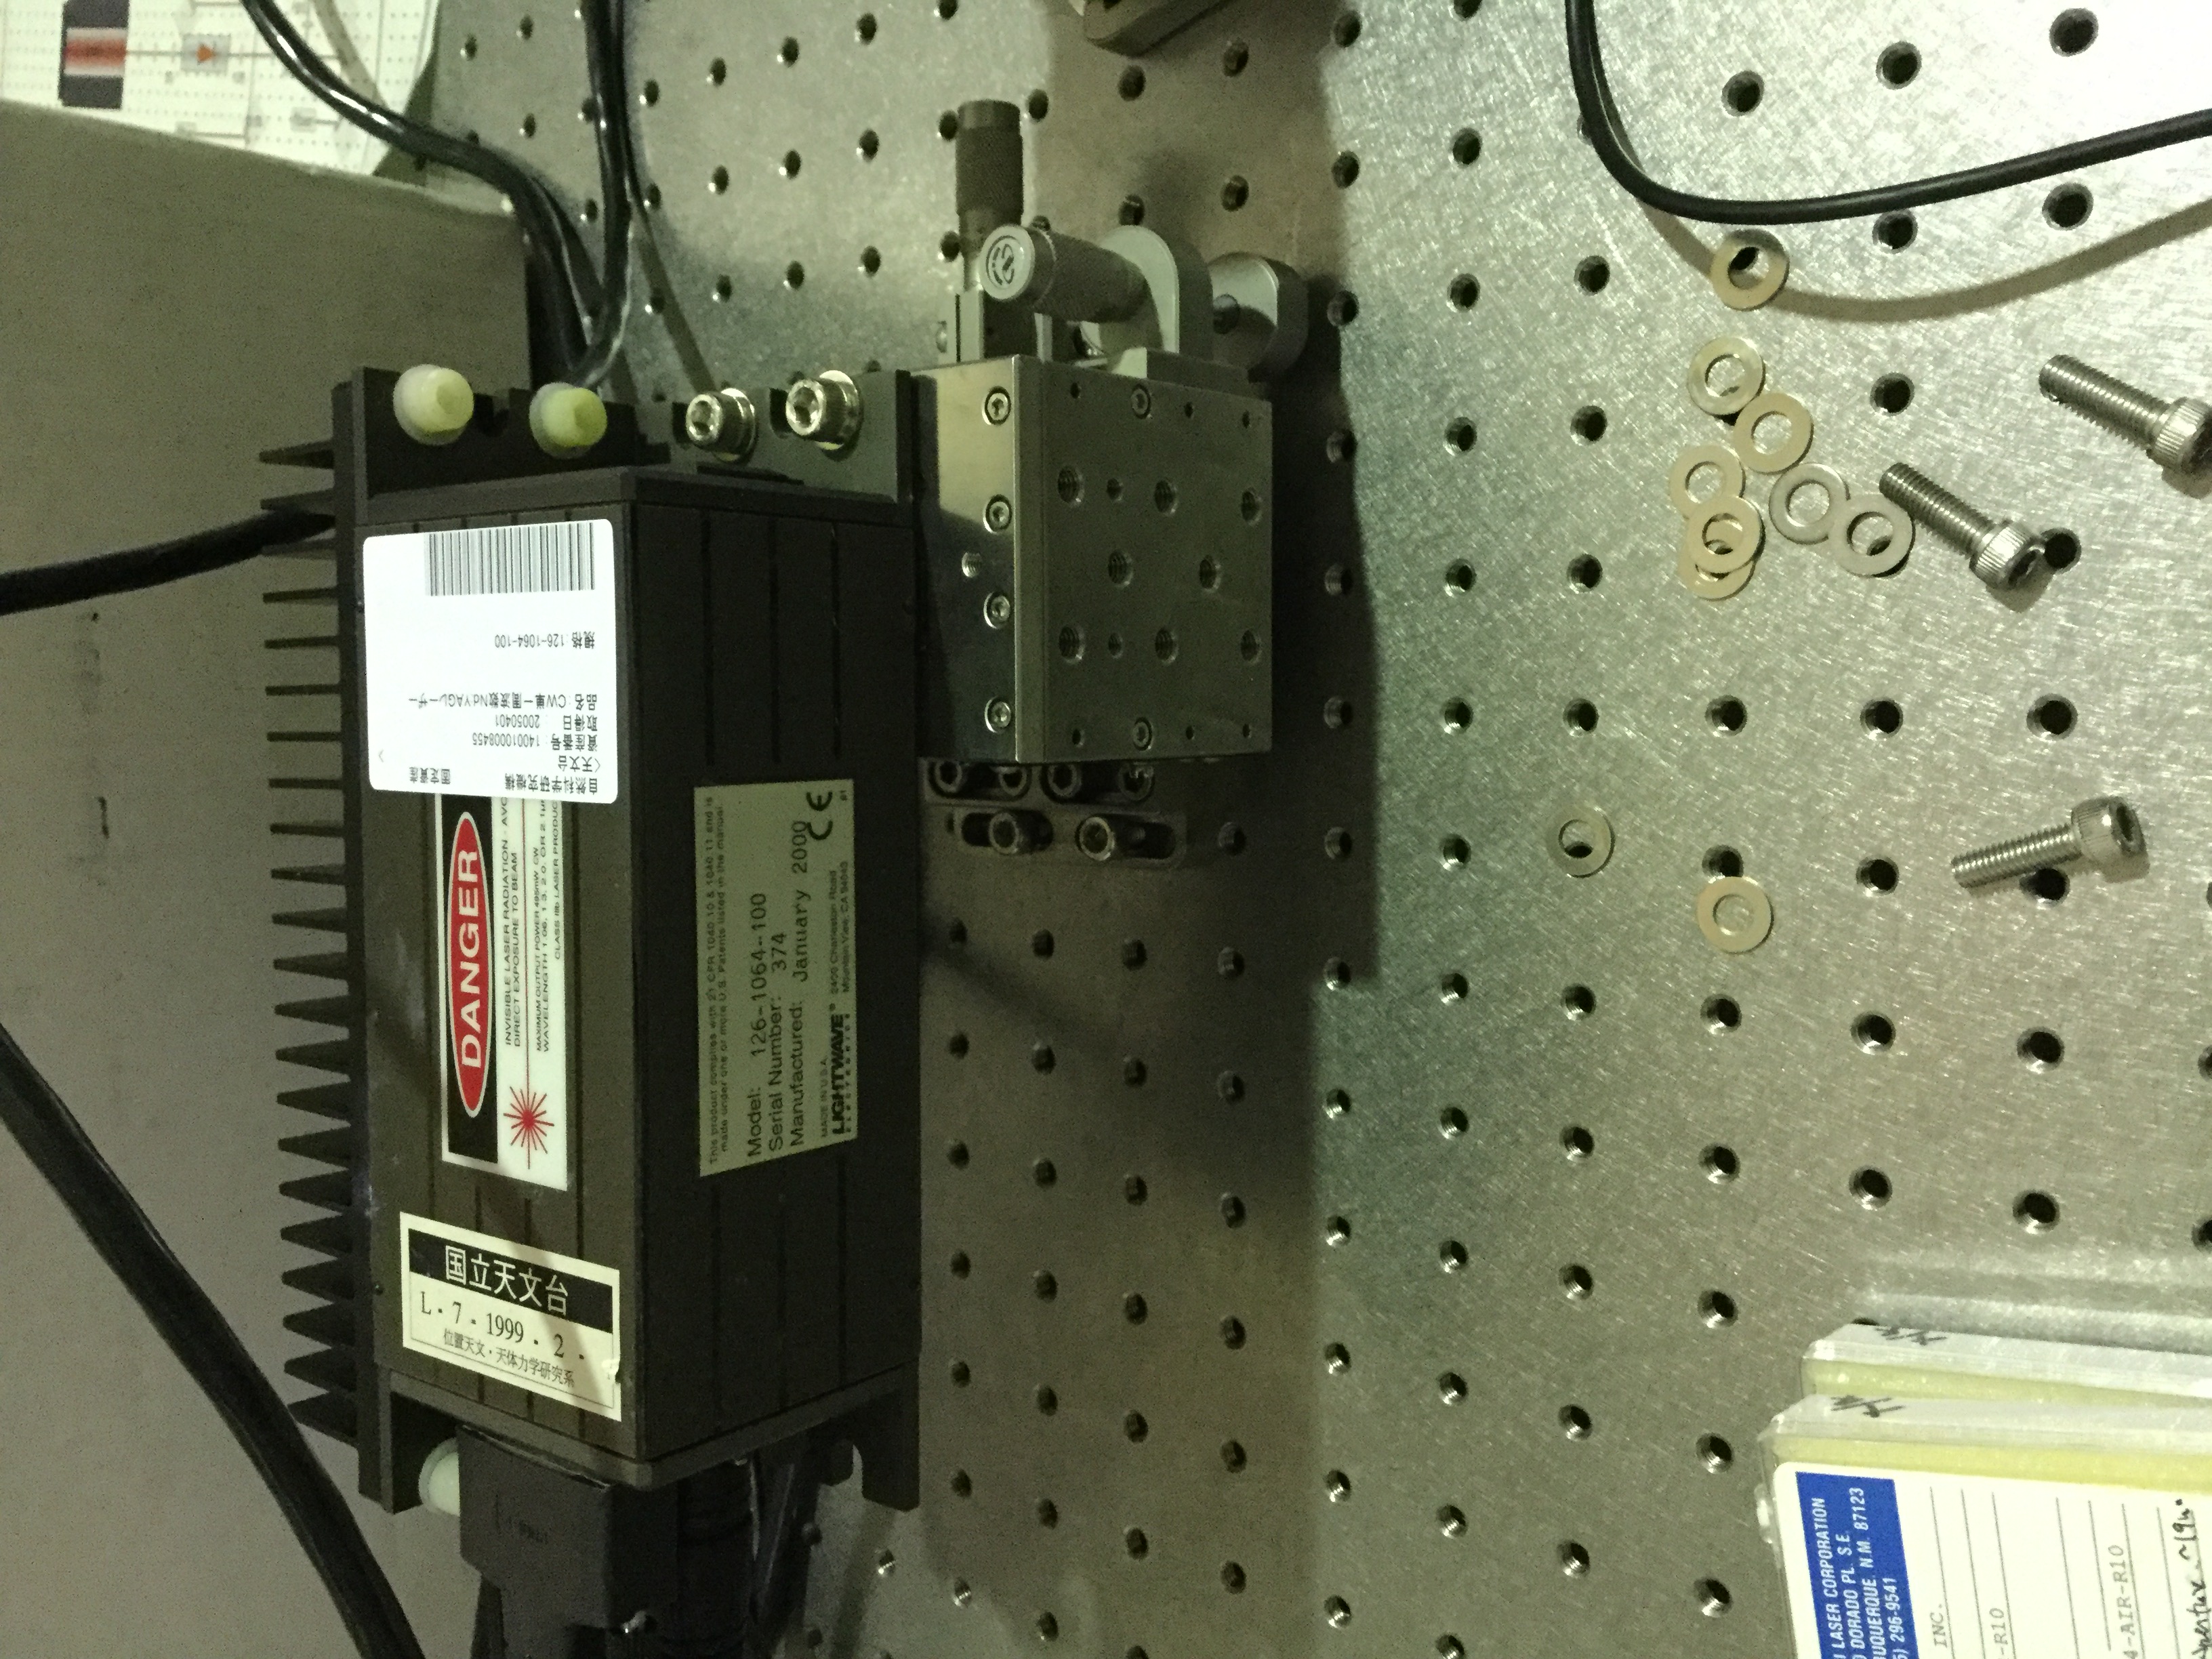
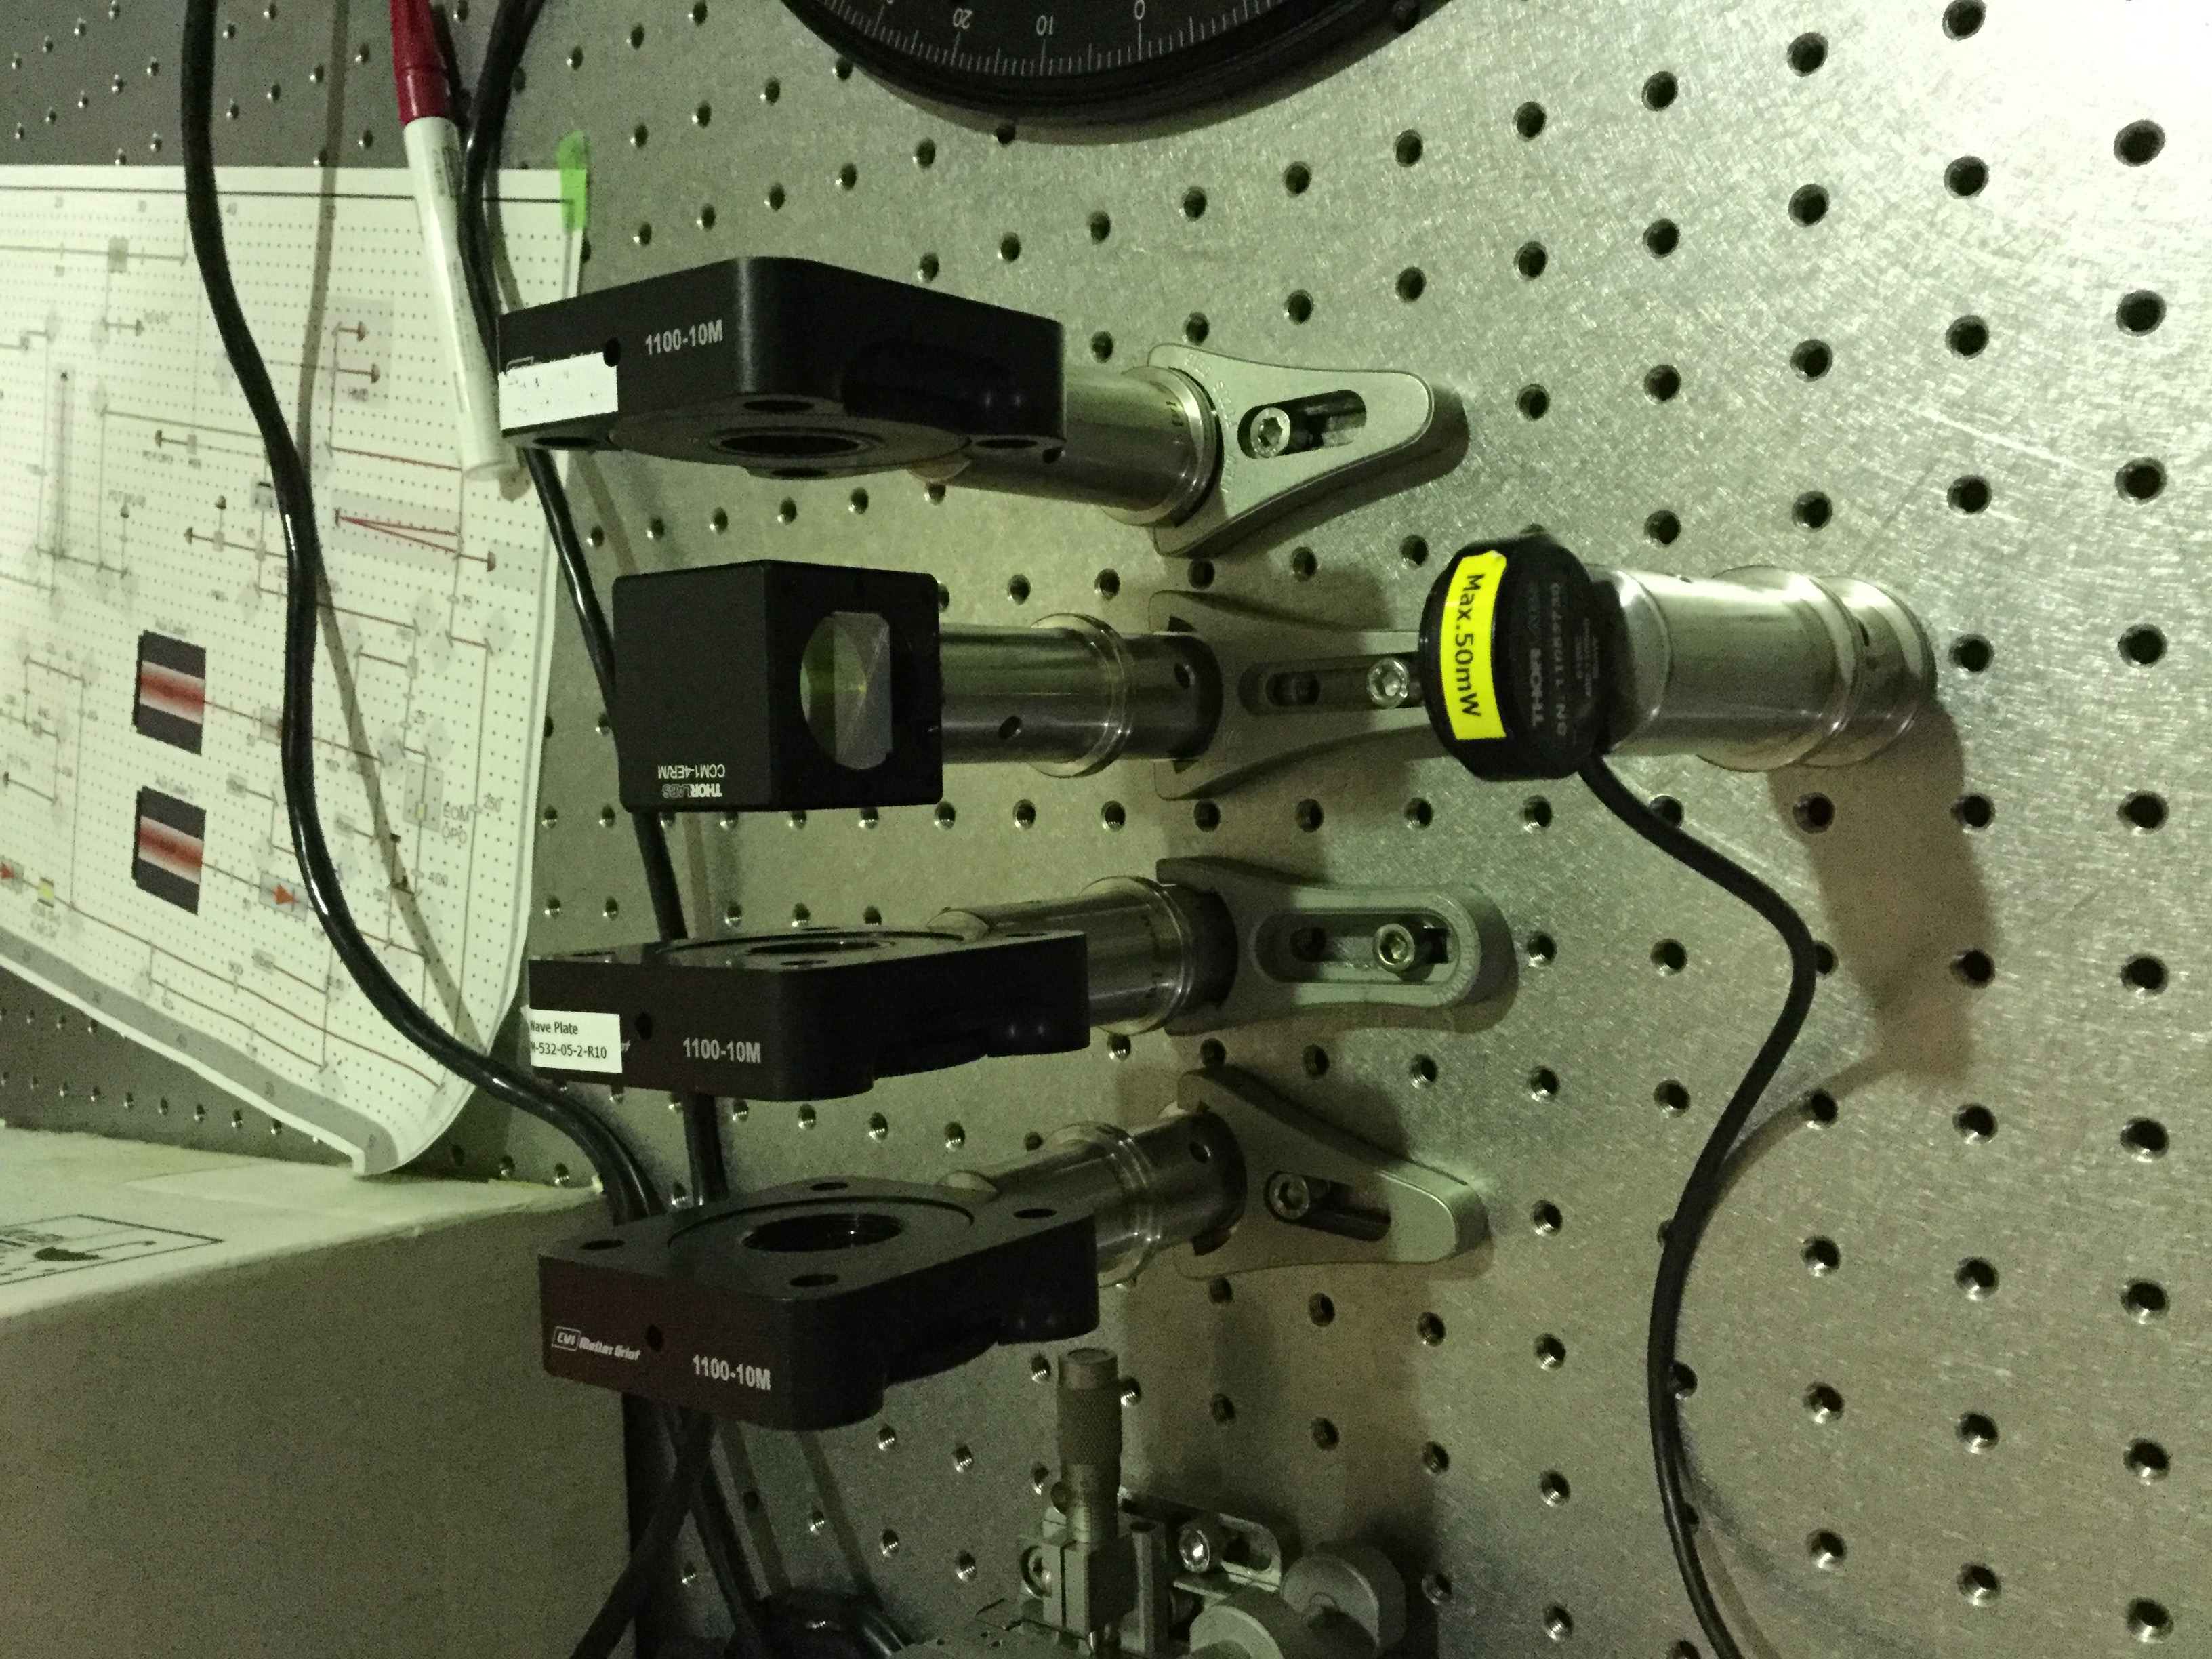
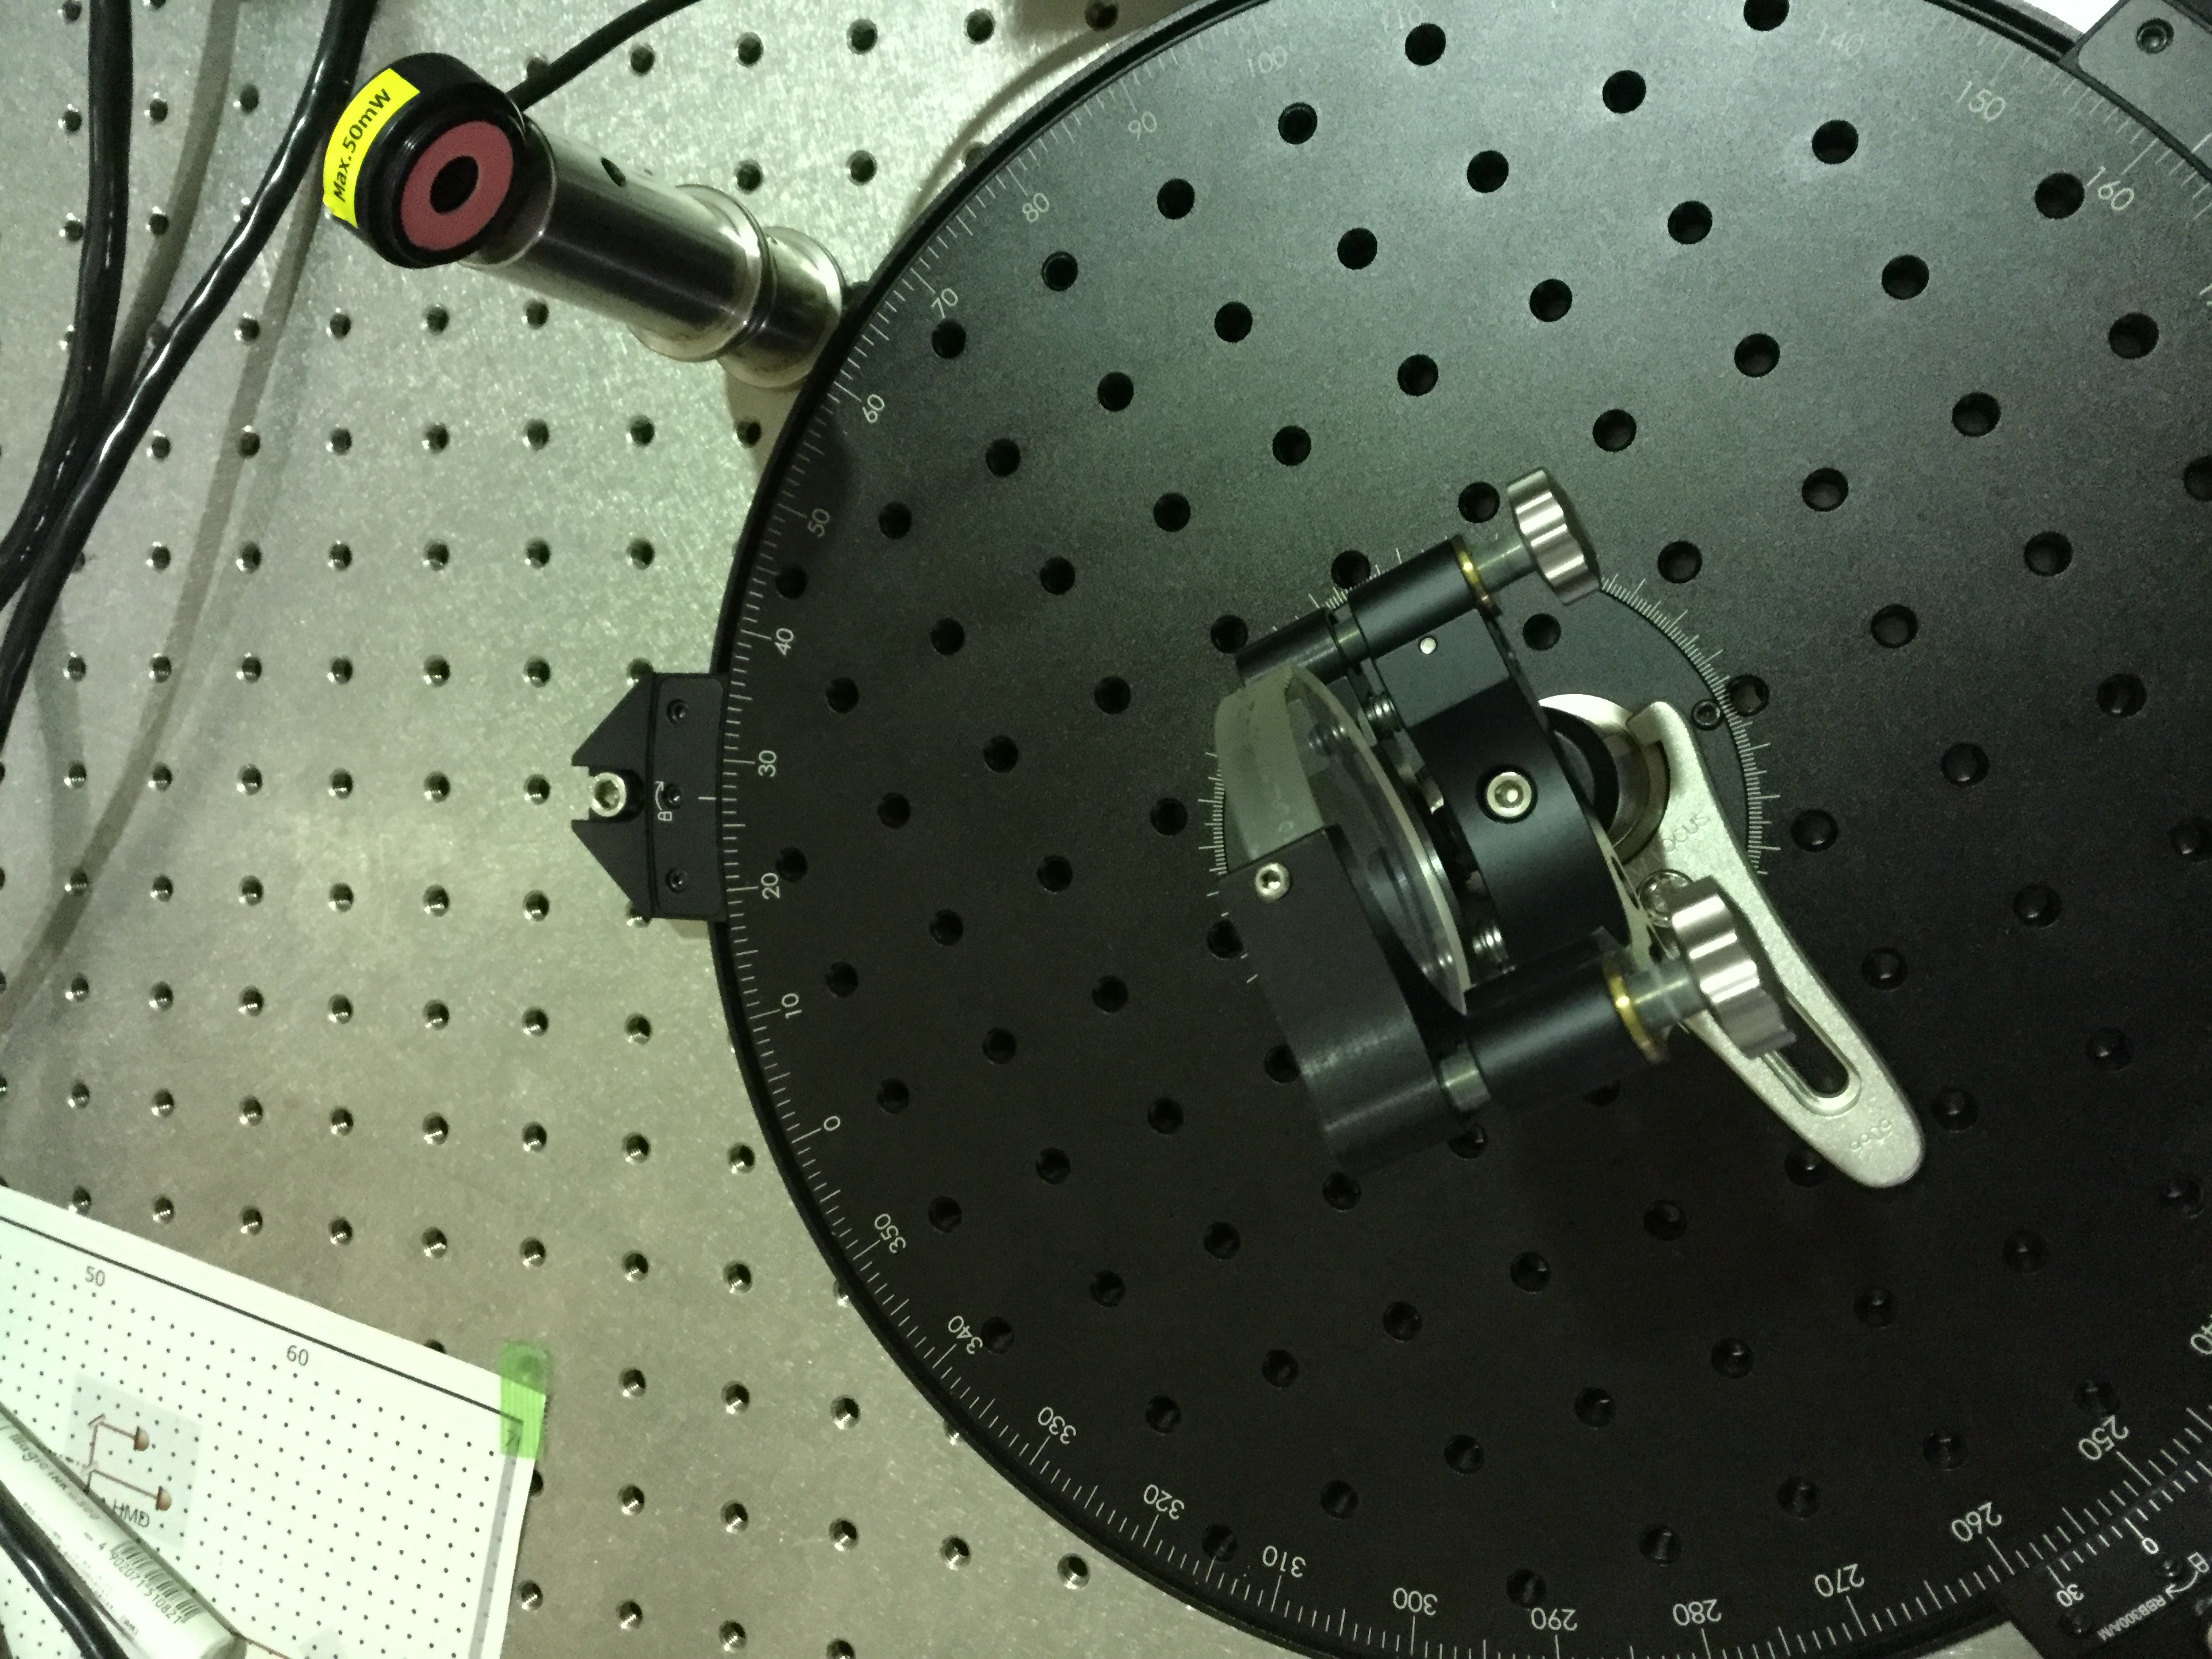
Note: The measurement bench is open for anybody who wants to do some quick characterizations of samples
Please find attached also some photos of the setup right now.
Simon
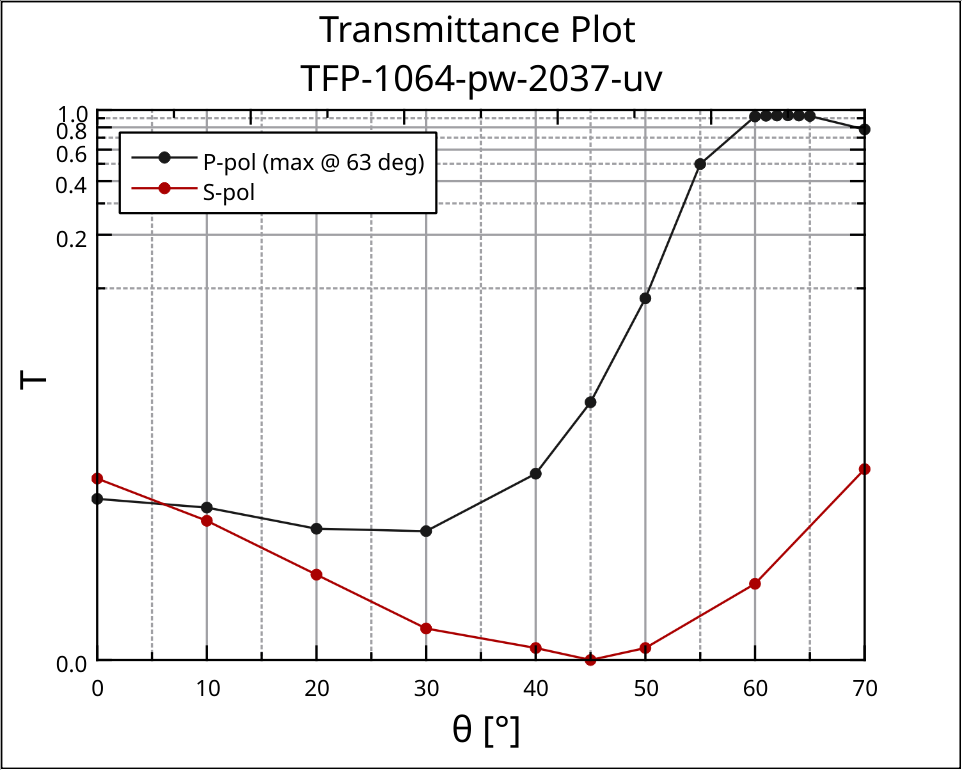
In addition to the measurements on Monday, I took the transmission data for both S and P polarization of the Brewster Polarizer. This is to further understand the type of coating that has been manufactured for it.
Attached is the respective graph.
As can be seen, in S-pol there is a distinct minimum at 45 degrees, while for the transmission in P-pol the minimum is at around 30 degrees with a maximum at 63 degrees AoI. This result correlates quite well with the reflection measurements.
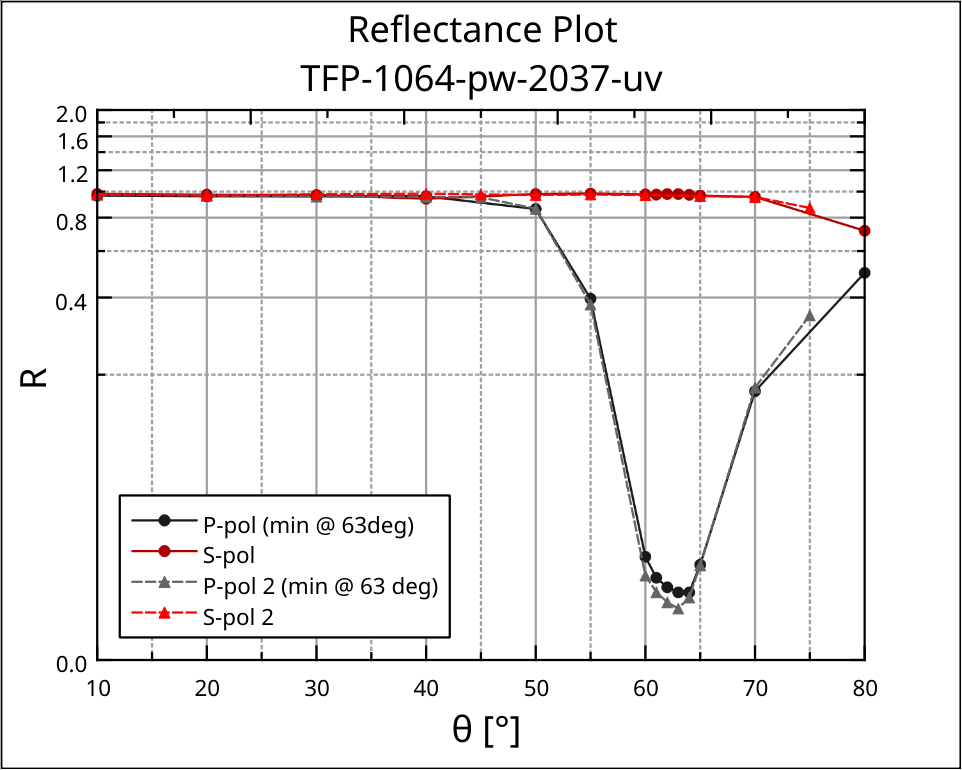
Also, I characterized a second polarizer of the same type in terms of reflection and compared it with the previous one.
The reflection curves of both polarizers are almost identical and show the same location of the minimum in P-pol (~ 63 degrees).
Attached is the designed OLTF of the previous and the new servoes on Dec 6th.
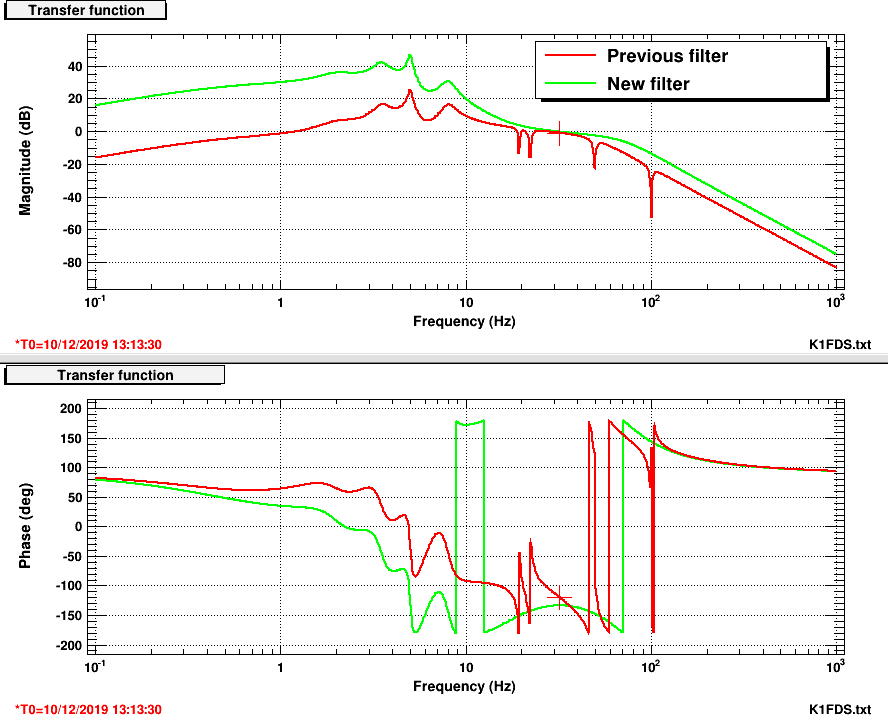
The phase mergin is about 40 deg. The difference of gain at above the UGF is about 10 dB.
Also, I have tried to look up the time the PR was resonating (at around 6/12/2019 6:00 UTC), but I could not find any DAQ signal for PR local damping loop.
Why don't we add some (if the storage allows)?

Yaochin and Yuhang
Since we did the optimization of the HWP angle for BAB. By this chance, we did again what Aritomi-san reported in elog1587.
First, we rotated HWP then measured the peak height of the s-pol peak and the p-pol peak.
|
BAB HWP angle |
286.5 |
290 |
294 |
298 |
302 |
306 |
310 |
314 |
|
s-pol (mV) |
4560 |
4400 |
4120 |
3720 |
3240 |
2640 |
1960 |
1440 |
|
p-pol (mV) |
2 |
95 |
372 |
880 |
1400 |
2080 |
2840 |
3480 |
We derived visibility from the peak height difference. We also considered the loss introduced by non-optimal visibility is the square of (1-visibility).
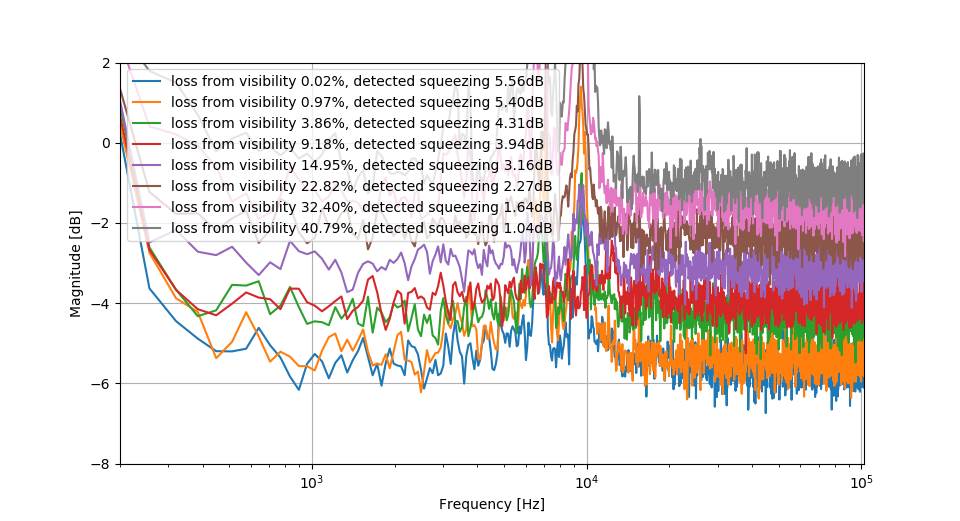
Then we removed BAB and put again CC and pump. We measured only squeezing at the previous HWP angle. (Now I realize that it will be better to measure anti-squeezing) Anyway, the measurement result is attached to the first picture.
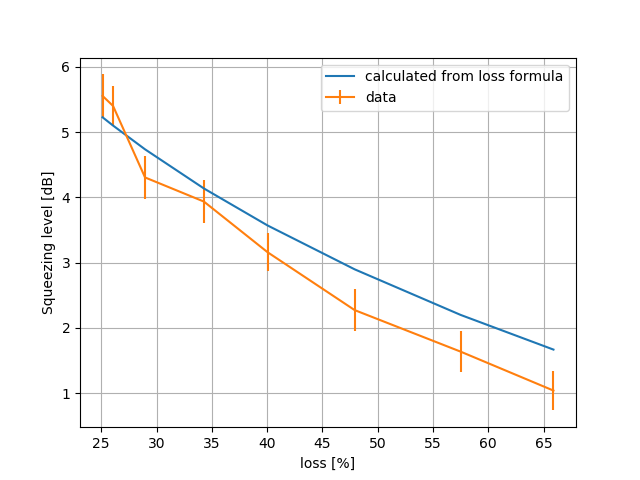
Finally, by using the formula of FIS degradation, we plotted the calculated squeezing value and compared it with measurement. The result is attached to the second picture. However, it seems data and calculation don't match very well.
I think it's better to measure visibility directly.
>> We also considered the loss introduced by non-optimal visibility is the square of (1-visibility).
This seems not correct. This is how I calculated additional loss in entry 1587.
1. Measure voltage of LO, BAB (HWP 0deg), DC offset, visibility (HWP 0deg)
2. Rotate HWP and measure maximum and minimum of visibility
3. Solve the following equation in terms of V_BAB
(V_max-V_min)/(V_max+V_min-2*V_DC)/(2*sqrt((V_LO-V_DC)*(V_BAB-V_DC))/(V_LO+V_BAB-2*V_DC)) == visibility (HWP 0deg)
4. Additional loss should be 1-V_BAB/V_BAB (HWP 0deg)
I am sorry that what I wrote is wrong. The additional loss is 1-visibility**2. I think it is very clear for us that the efficiency of homodyne is visibility**2. This is written in Henning's thesis.