NAOJ GW Elog Logbook 3.2

effect in the setup?
- When the loop is closed there is an oscillation at high frequency. Is the loop gain too high?
- Having the beams well focused within the photodiodes is important for this test.
Still looking for the sapphire calibration factor of ~3
I simulated the absorption signal for bulk reference and sapphire sample in two different conditions:
- pump size (waist radius) 40micron
- pump size (waist radius) 80micron
The absorption parameter used to simulate the sapphire absorption signal is 60ppm/cm.
To calculate the sapphire absorption from the simulated signal I applied the formula Abs = AC/DC / P / R
where the calibration factor is R = (AC/DC)_ref / P_ref / Abs_ref
with P = 10W and P_ref = 30mW.
I didn't apply the material correction because that's the final estimation of this simulation.
In the case of pump size 40micron, the absorption is 19.5ppm/cm, which, compared with the 60ppm/cm gives a material correction factor of 3.08
In the case of pump size 80micron, the absorption is 23.8ppm/cm, which, compared with the 60ppm/cm gives a material correction factor of 2.52
Conclusion:
decreasing the pump size results in a better estimation of the material correction (comparing it with the value of 3.34 given by the SPTS company),
But it is still far from the factor of ~3 discrepancy of my measurements.
If the discrepancy was all due to the pump size and the simulation were exact, the material correction in the case of 80micron pump size should have been about 1, instead of 2.52.
Comments:
- There is a strong approximation on the bulk reference material, which is schottglass#21 but in the simulation is silica (because I couldn't find the thermal properties of schottglass).
- The phase for the same material shouldn't change with the pump size. But the simulation gives different values of the phase. This may be due to a different optimal position of the Imaging Unit for different pump sizes, and I didn't optimize it for the new 40micron pump size.
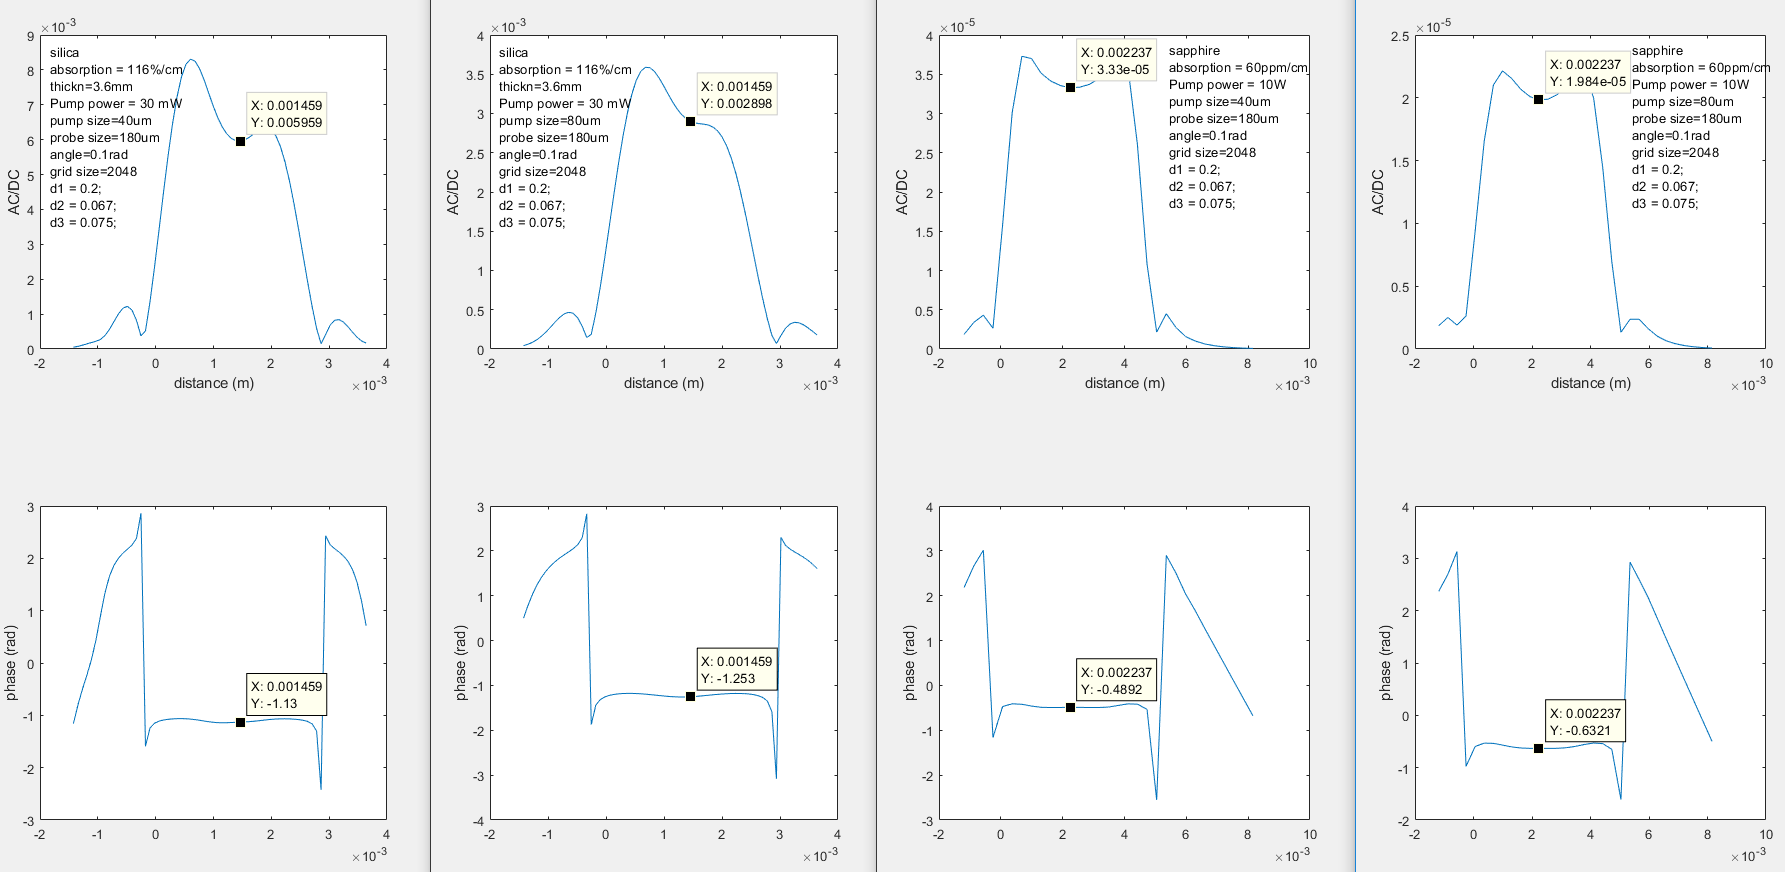
Simulating the absorption of the surface reference, I optimized the Imagin Unit distances to have the maximum signal in the two cases, pump waist 40um and pump waist 80um. See the first plot, it shows the signal as a function of the distance d2 from the lens and the small sphere.
Using the optimum value of d2 in the two cases, I repeated the simulation of elog entry 905.
In the case of pump size 40micron, the absorption is 14.7ppm/cm, which, compared with the 60ppm/cm gives a material correction factor of 4.09
In the case of pump size 80micron, the absorption is 19.7ppm/cm, which, compared with the 60ppm/cm gives a material correction factor of 3.03
the probe size is still 180um in both cases, next step is to reduce it as well to be 3 times larger than the pump
I reduced the probe size as well, from 180um to 120um, to be 3 times larger than the pump (which is 40um), but the signal doesn't change much.
For the 7 of step, first thing is to demodulate this signal with the frequency of beat note. Then by chaning the phase of this demodulation signal, we can make the demodulation output close to zero. This is crucial for the measurement of phase noise with DC coupling.
Participaint: Eleonora and Yuhang
Following the procedure of Marco, we measured the phase noise again. The difference is now rampeauto doesn't have ramp-in port and one of the resistors is changed.
Before, we found the error noise spectrum is limited by the laser frequency noise after change.
The measurement of phase is performed in three different cases: rampeauto off, rampeauto on and lock on.
The result is shown in attached figure. However, we found the phase noise level is comparable with before while locking.
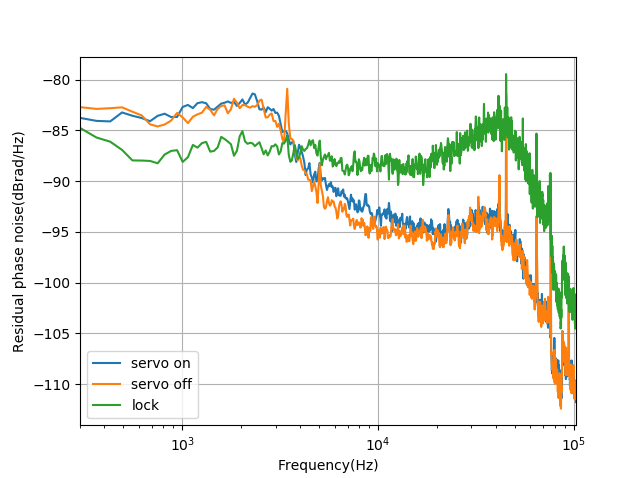
I'm wondering if the increase of the phase noise at high frequency when the cavity is locked is due to the fact that, when the cavity is locked, the frequency changes of the master laser are very large ~ MHz.
Possible tests to check this hypothesis are to damp the mirrors (sending the PZT correction signal to the mirrors, upon filtering) or to excite the mirror oscillations, to artificially increase the laser frequency changes.
A related question: when we compute the residual RMS phase noise between the main laser and the auxiliary laser we integrate down to 100 Hz. Maybe the 1 Hz region is dominant with respect to the high frequency region, and thus we should solve in any case this problem of the main laser frequency changes in the Hz region.
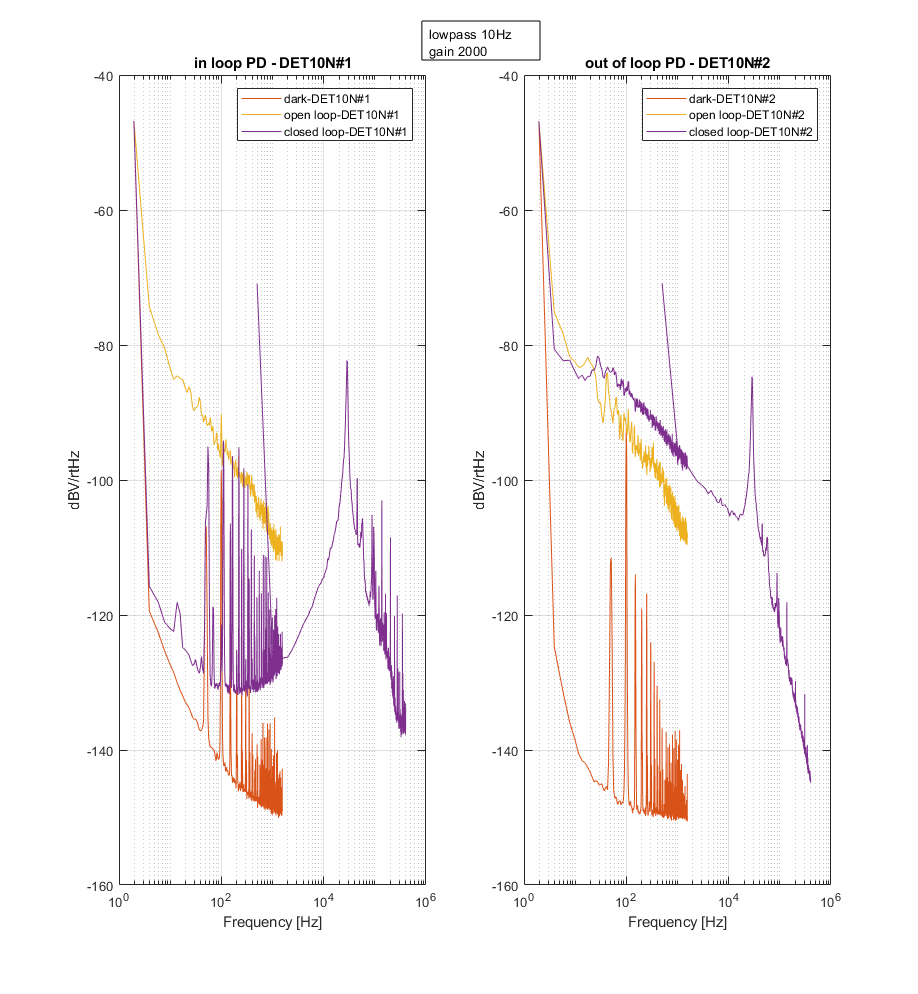
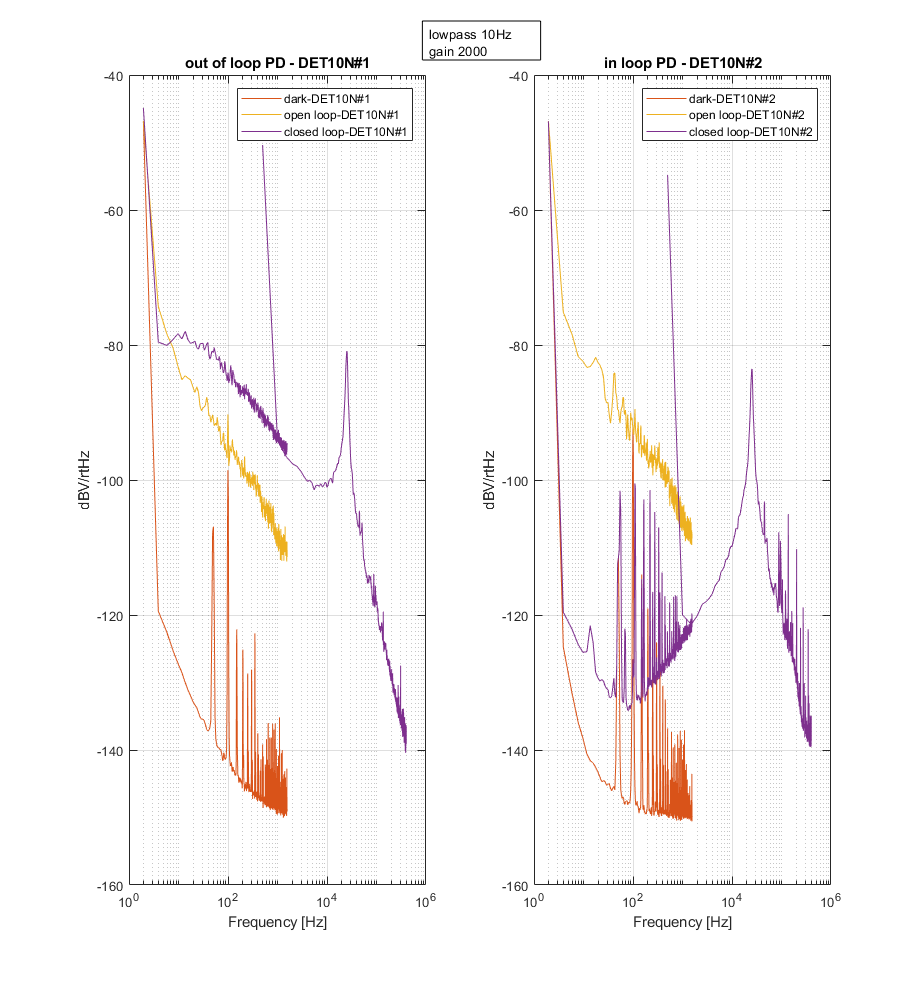
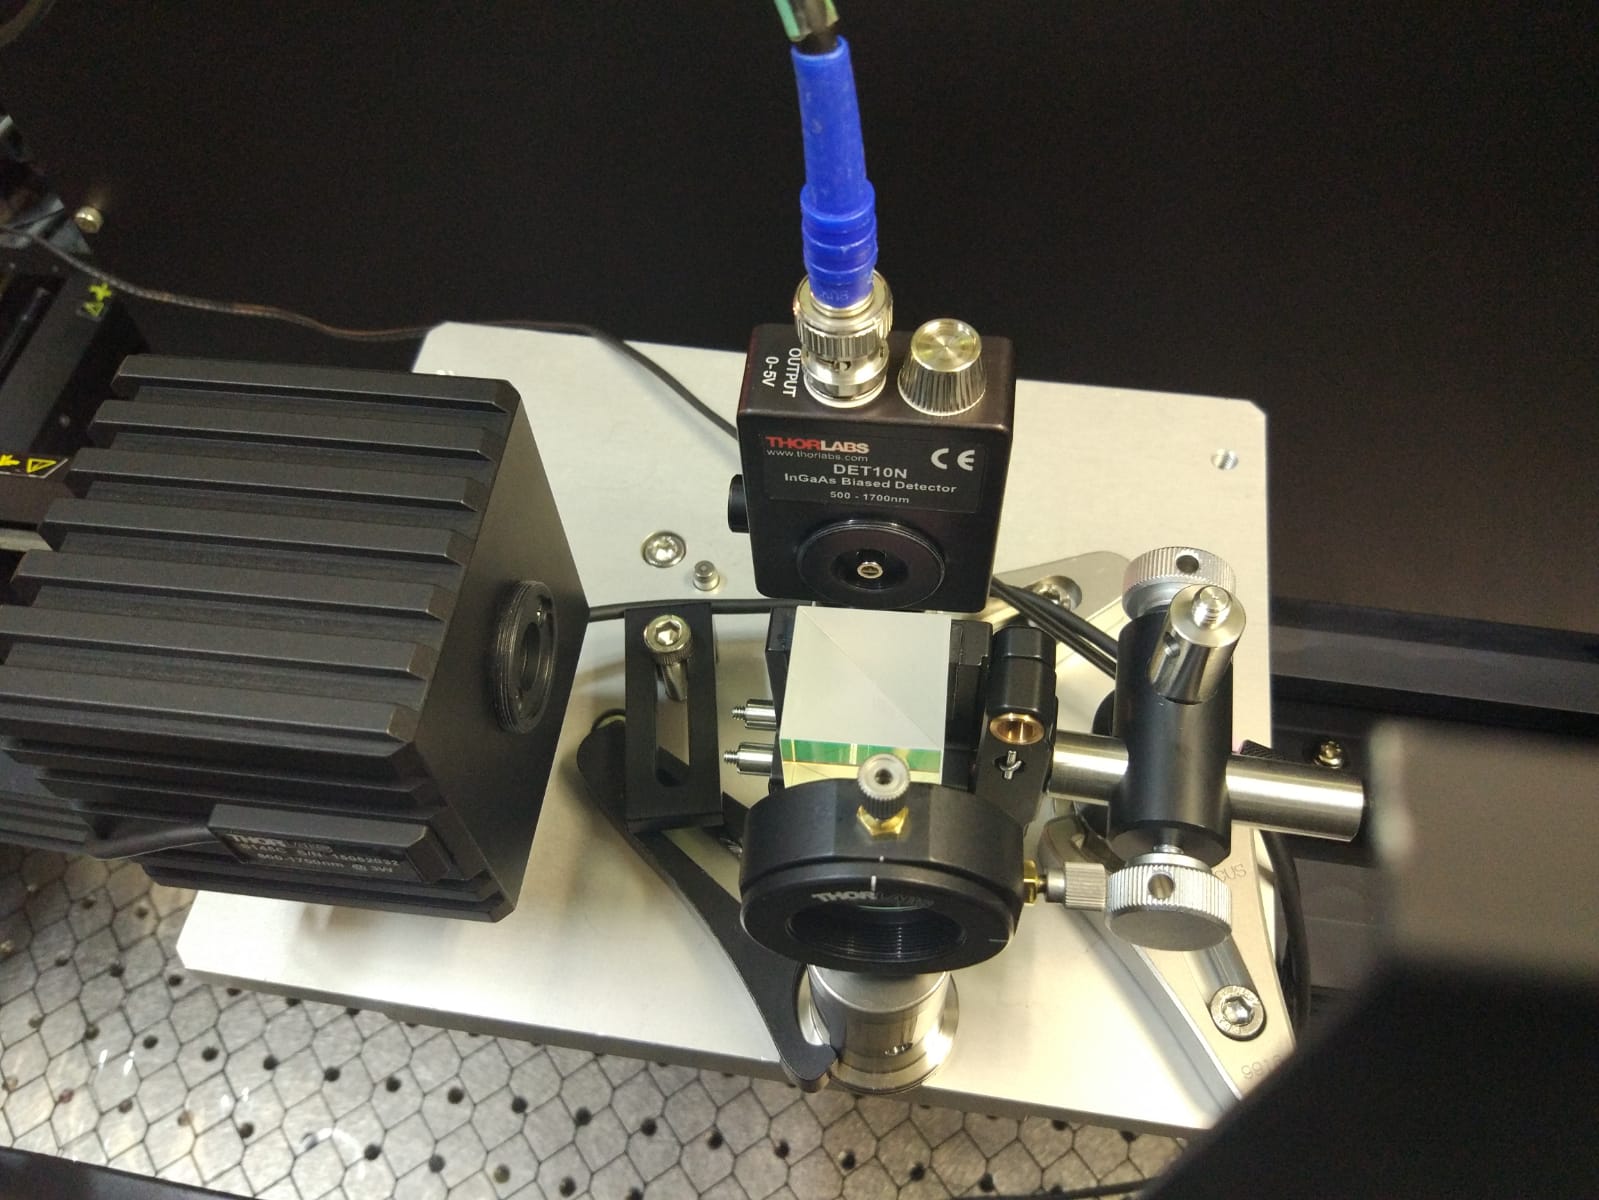
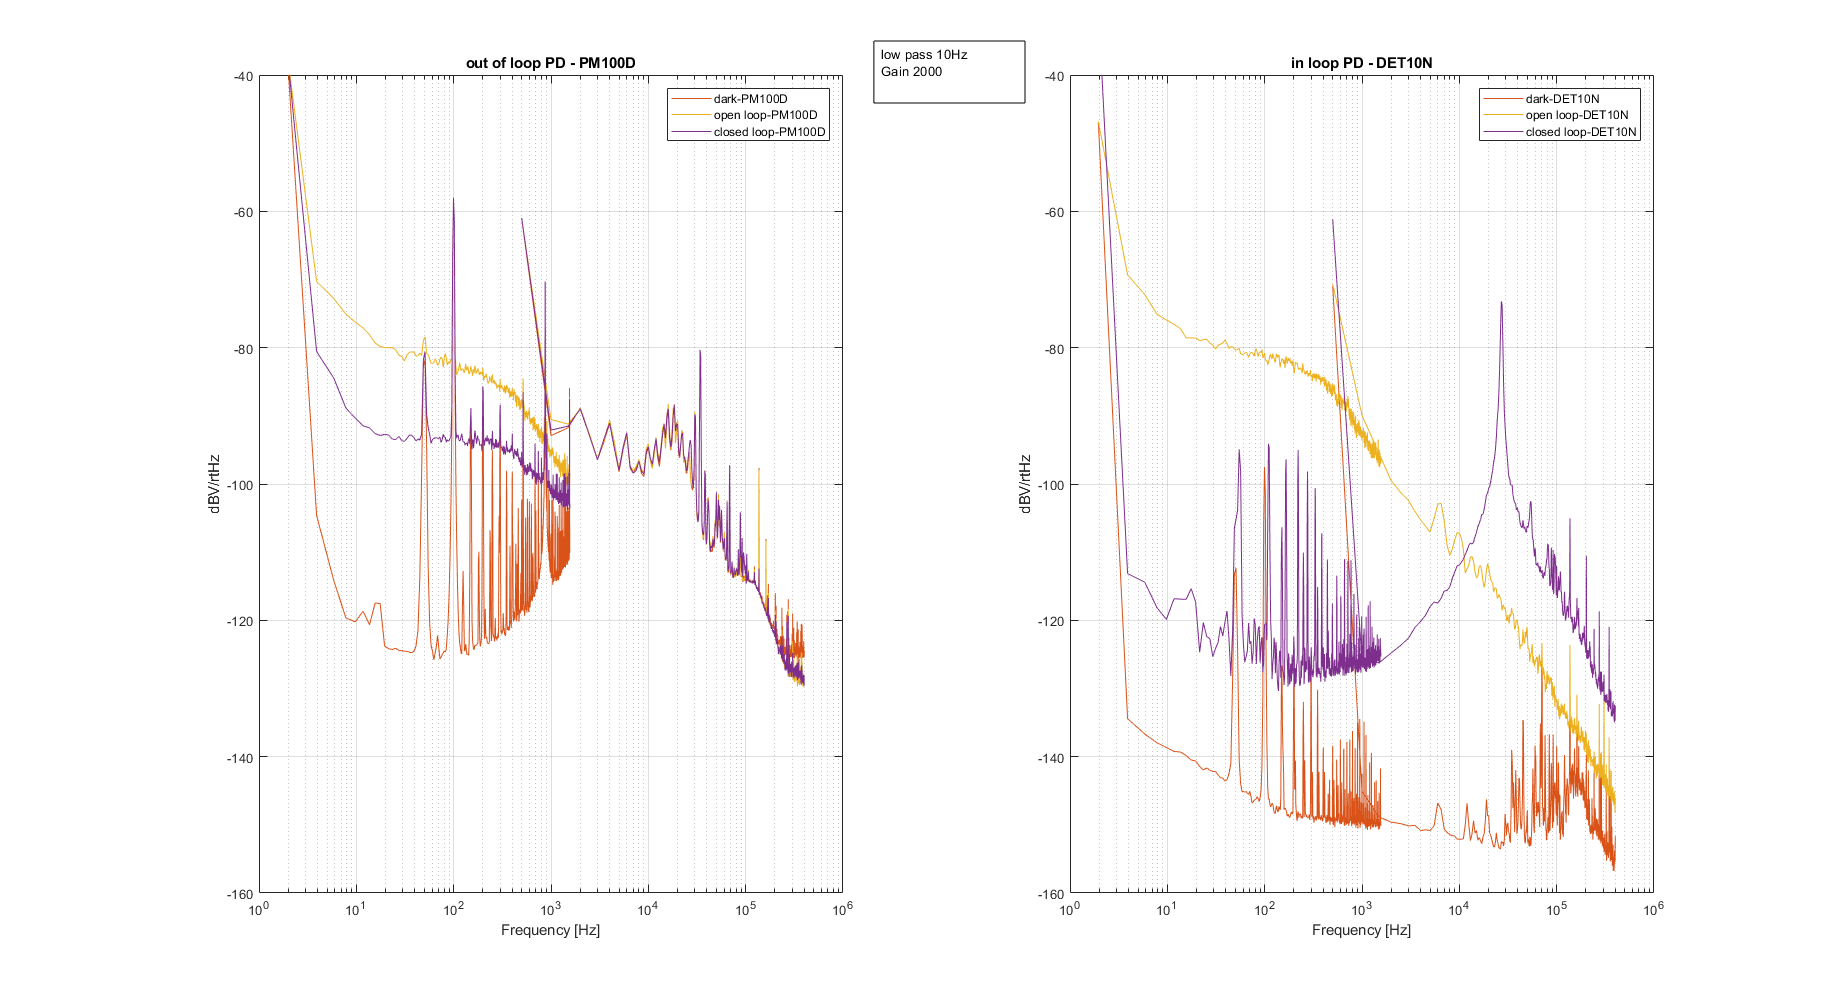
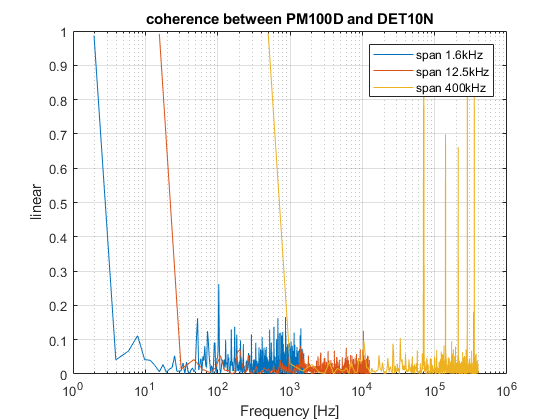
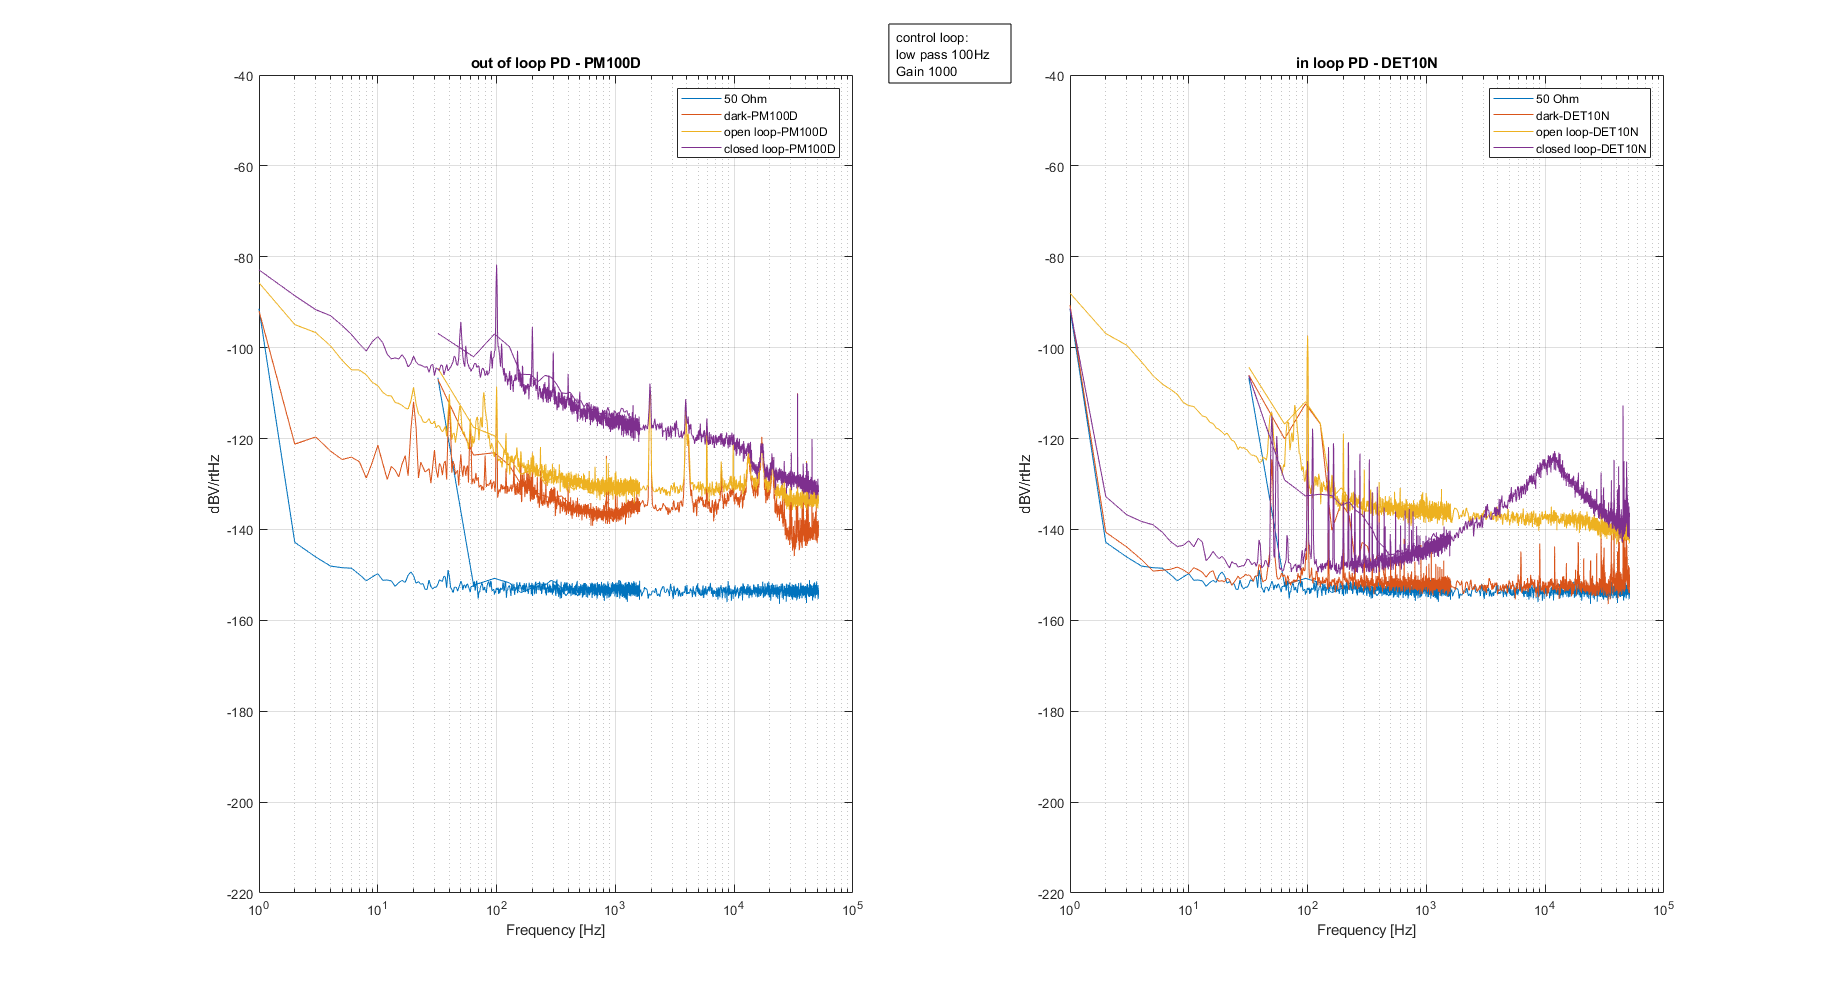
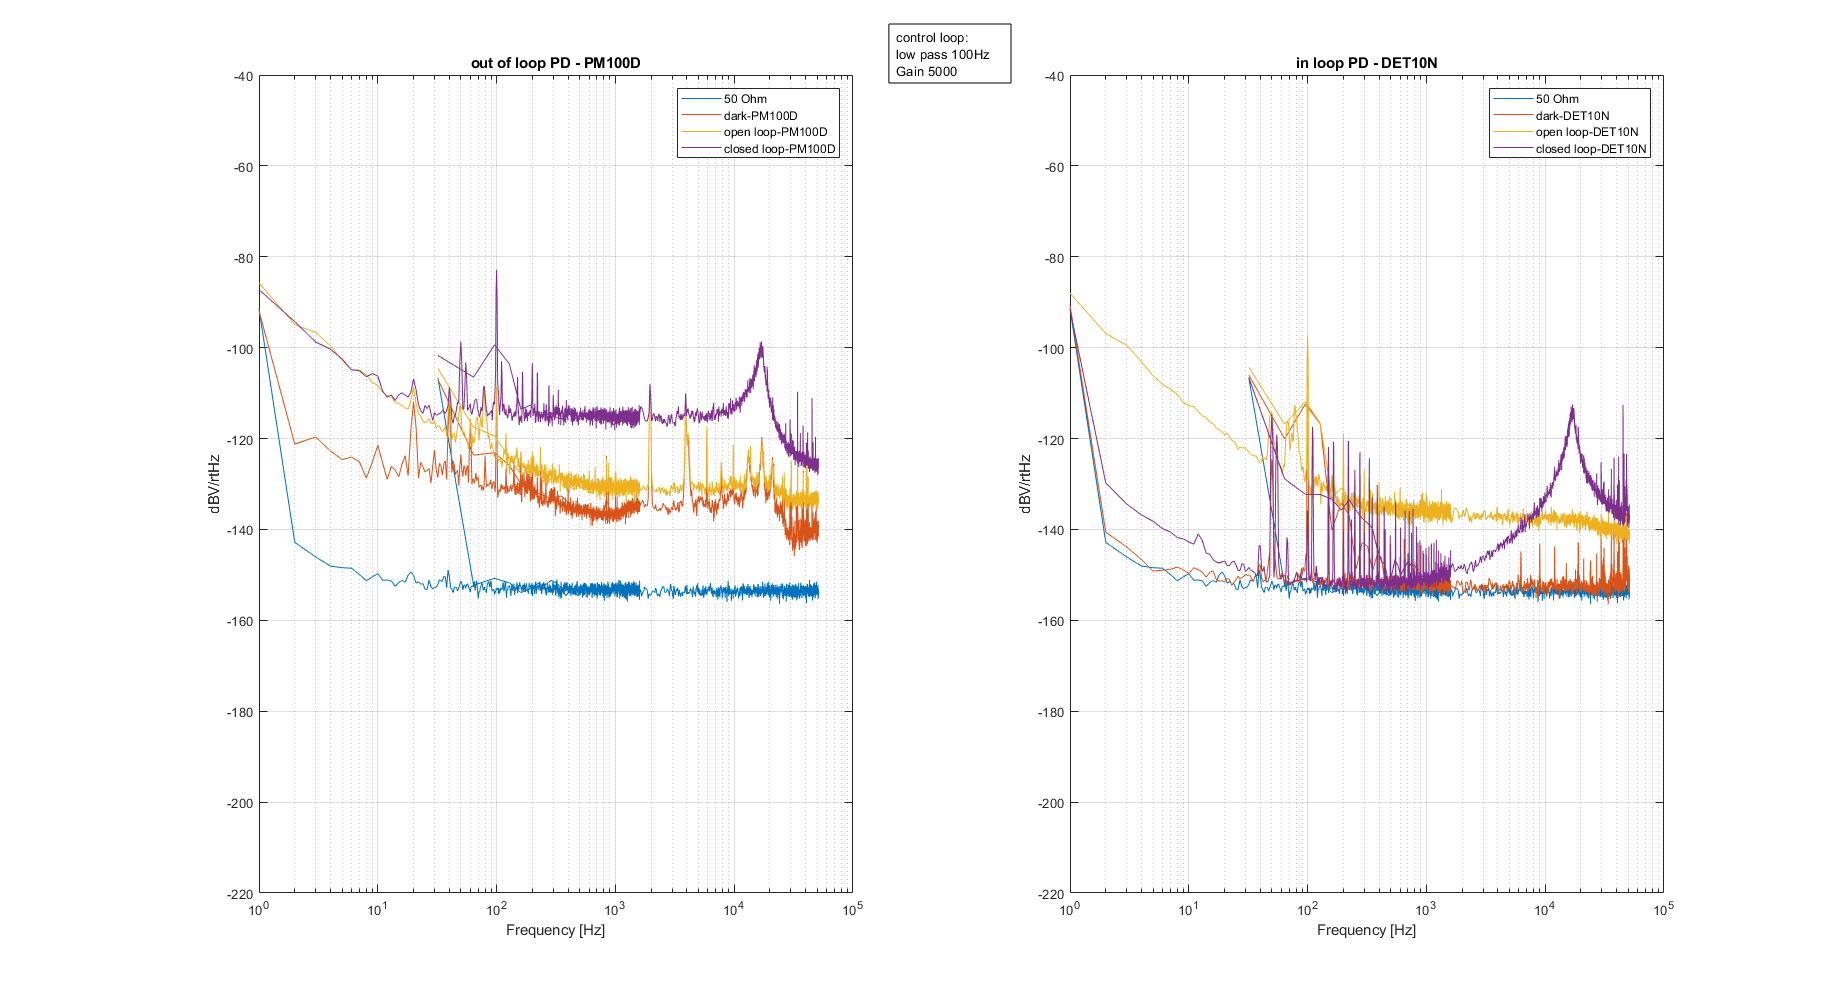
I replaced the PM100D power meter with another DET10N that I borrowed from Tanioka-kun, and I repeated the measurement.
This time the two signals at the oscilloscope look really similar. See the attached videos. (also the coherence on the spectrum analyzer is close to 1, sorry I didn't save the coherence data).
Then I closed the loop using the PD#1 in-loop and the PD#2 out-of-loop.
Then I exchanged them and closed the loop. See the two figures.
The control loop reduces a lot the noise in-loop but it doesn't really work for he out-of-loop PD (same situation when they are exchanged).
One possible reason could be the clipping noise, because I'm not sure how precisely the beam is focused inside the area of the PD.
Another possible reason could be the OD2 filter (that I'm putting after the laser to limit the power and avoid the PDs saturate). If I remove it, 40mW would imping on each PD. I'm not sure how safe it will be for the PD, and In order to avoid saturation, I will have to drastically reduce the load resistance.
Another way to reduce the power would be to enlarge the beams up to much more than the PD size (which is 1mm).

Participants : Yuefan, Eleonora
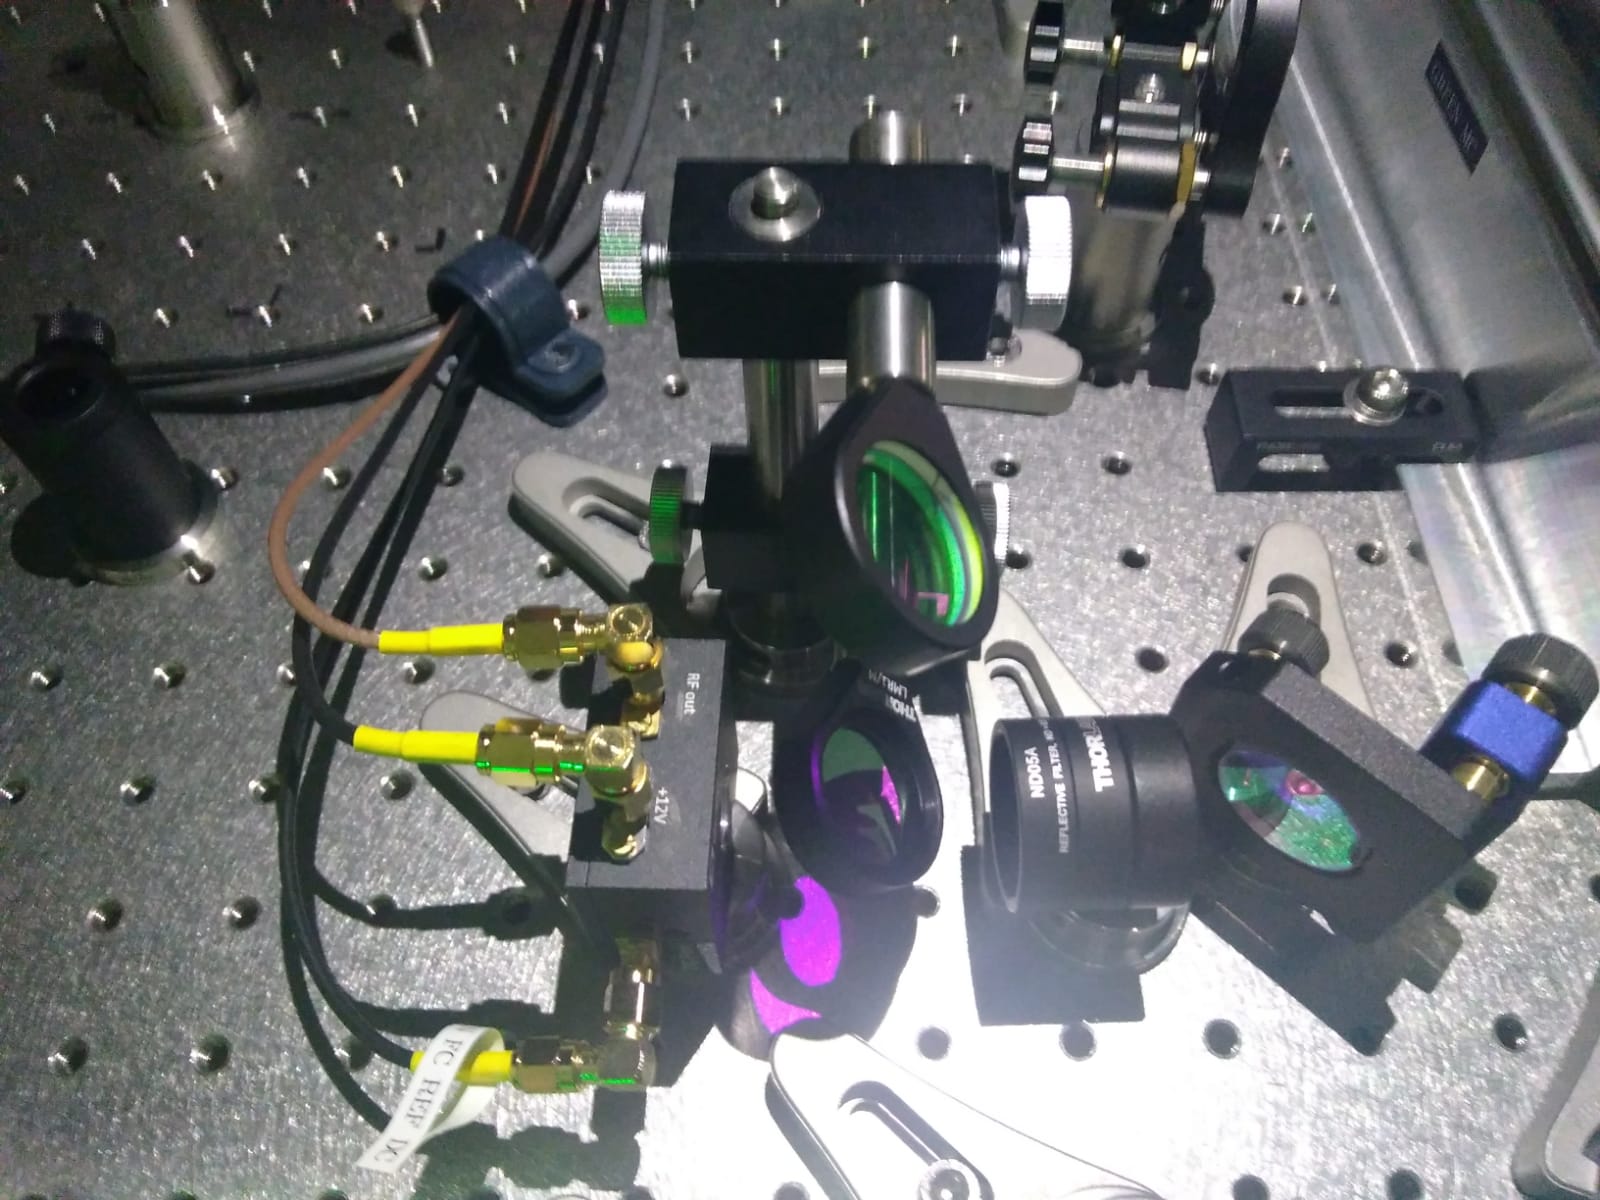
We prepare the set up to characterize the reflected beam from the FC. In the final configuration we will need to take a part of the reflected beam to send it to the quadrants for the AA.
At present the green FI reflects about 4.5 mW which are attenauted in order to send only 150 uW to the PD used for the filter cavity lock. (150 uW corresponds to a DC output of 88 mV )
Up to now we used a set of optical densities just placed on the bench to attenuate the power and today we changed them with two "mirror shaped" optical densities ( ND 1 and ND 0.5) which we coud directly screw on the last lens before the PD, making the setup more stable.
Since the beam height is only 3.8 cm, we prepere a periscope to be installed before the PD. The lower mirror of the telecope should be a BS which trasmit at least 3% to the PD and send the rest to the quadrants. Since we couldn't find any suitable mirror we could not perform the beam characterization with the FC cavity locked. We will do it as soon as we can get the mirror for the green.
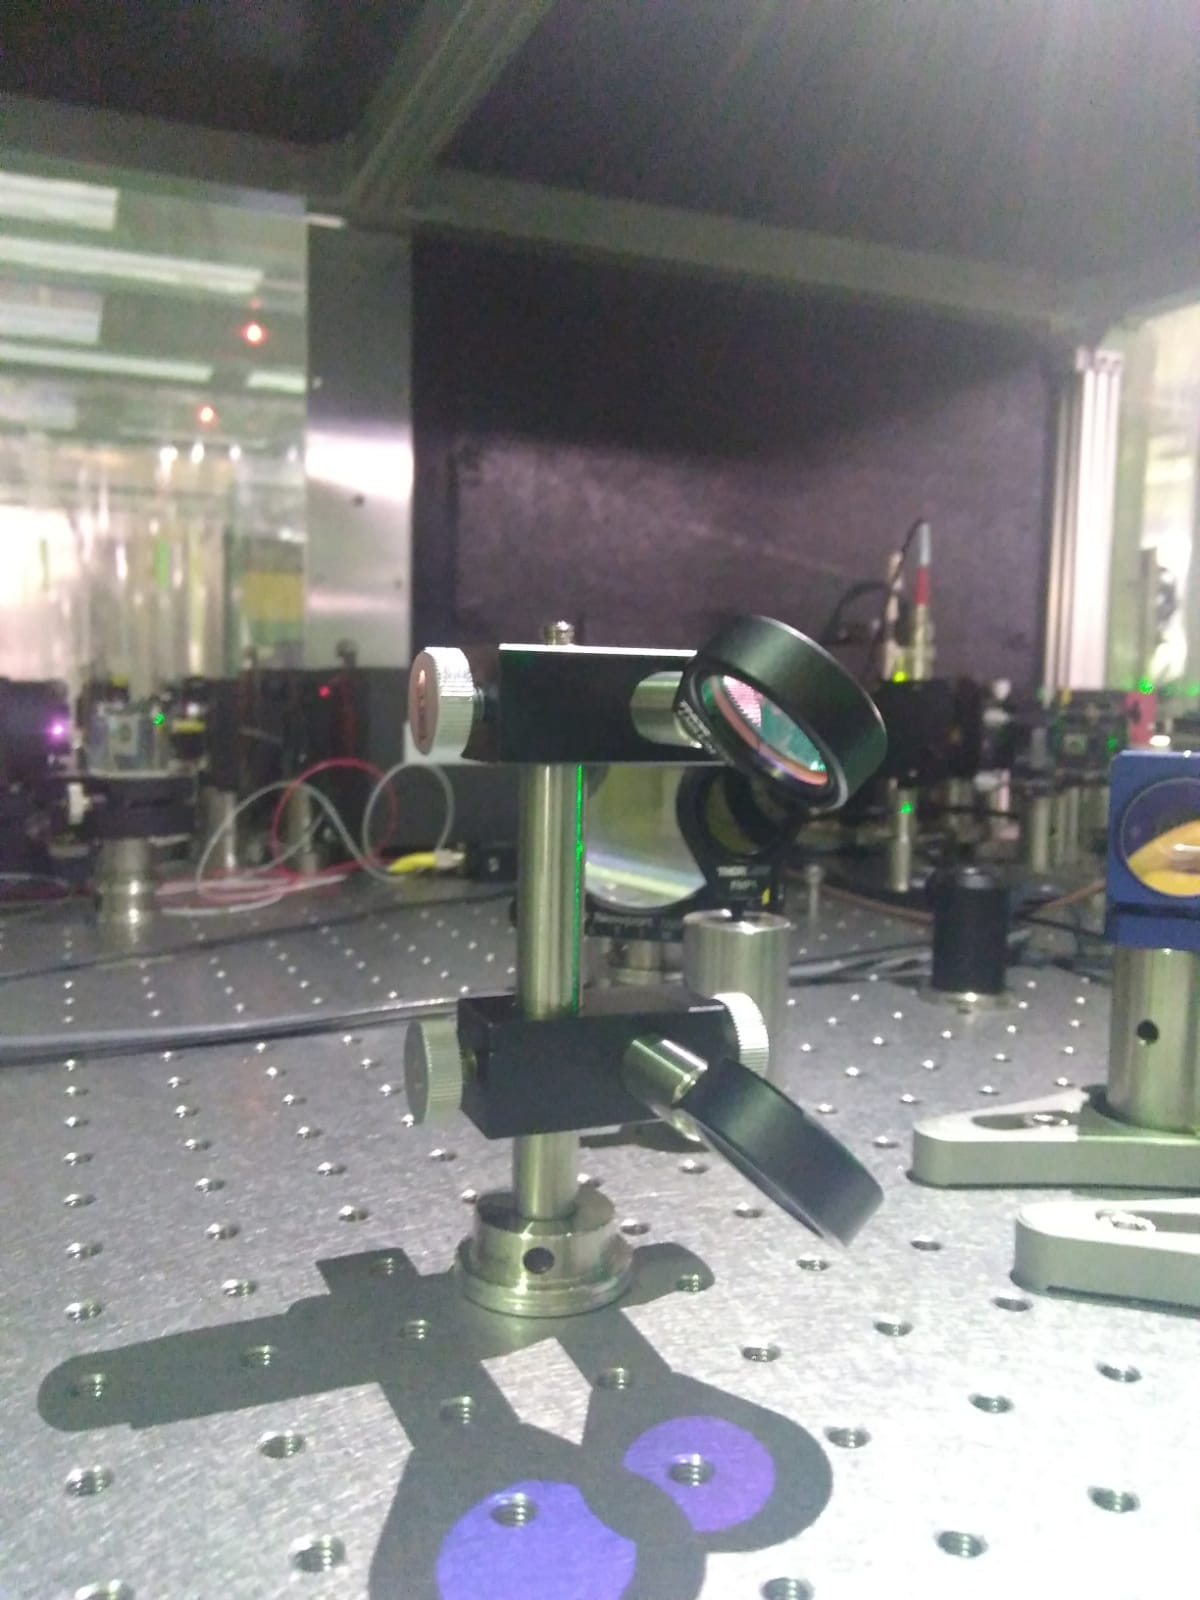
Pic 1 and 2 show the periscope we assembled.
We remark that there won't be a lot of space to put quadrants and galvo in that area of the bench, so the desing has to be studied carefully.
Following Yuhang: Procedure to lock MC green (MCG) and MZ
- Lock SHG
- turn on high-voltage drivers of MZ and MCG
- Check alignment of MCG using a ramp (typical value 7.05Hz, 1Vpp) now we are using s-pol but anyway it should be the same procedure with p-pol
- if the alignment is fine, set the gain of standford to gain = 1. Use a simple lowpass pole at 3Hz on the standford.
- tune MCG PZT driver offset to go as close as possible to the TEM00 peak
- close the loop of MCG (put MCG correction in input of MCG driver)
- increase the gain of standford to 5
- tune the MZ high voltage offset. You should see max and min. Now we are locking a little higher than mid-fringe in order to get enough tranmitted power by MCG (1V on oscilloscope which corresponds to 12.5mW)
- On MZ servo check EP mon (Error Point monitor) and put it to 0 changing its offset
- NOTICE : WE NEED TO MAKE SURE THE GAIN IS HIGH ENOUGH (USUALLY 10) TO AVOID THE UNSTABILITY AT 600 HZ
- On MZ servo turn on lock and integrator
To measure MZ openloop TF we injected noise in the servo input ''add'' and take TF between EP mon and input. For a swept sine typical noise value is 50 mVpk
Notice: if you vibrate the bench too much, you will destory the lock of MZ.
We left the Mach-Zehnder and green mode cleaner locked and we found them still locked when we came back after about 2 hours.
The attached picure shows the transmitted power from the MC over a period of about 8 min (the longest that can be recorded with the oscilloscope) after two hours of lock.
The gain of the potentiometer of MZ was 9.9 and fluctuations seem to be of the order of 1.5%
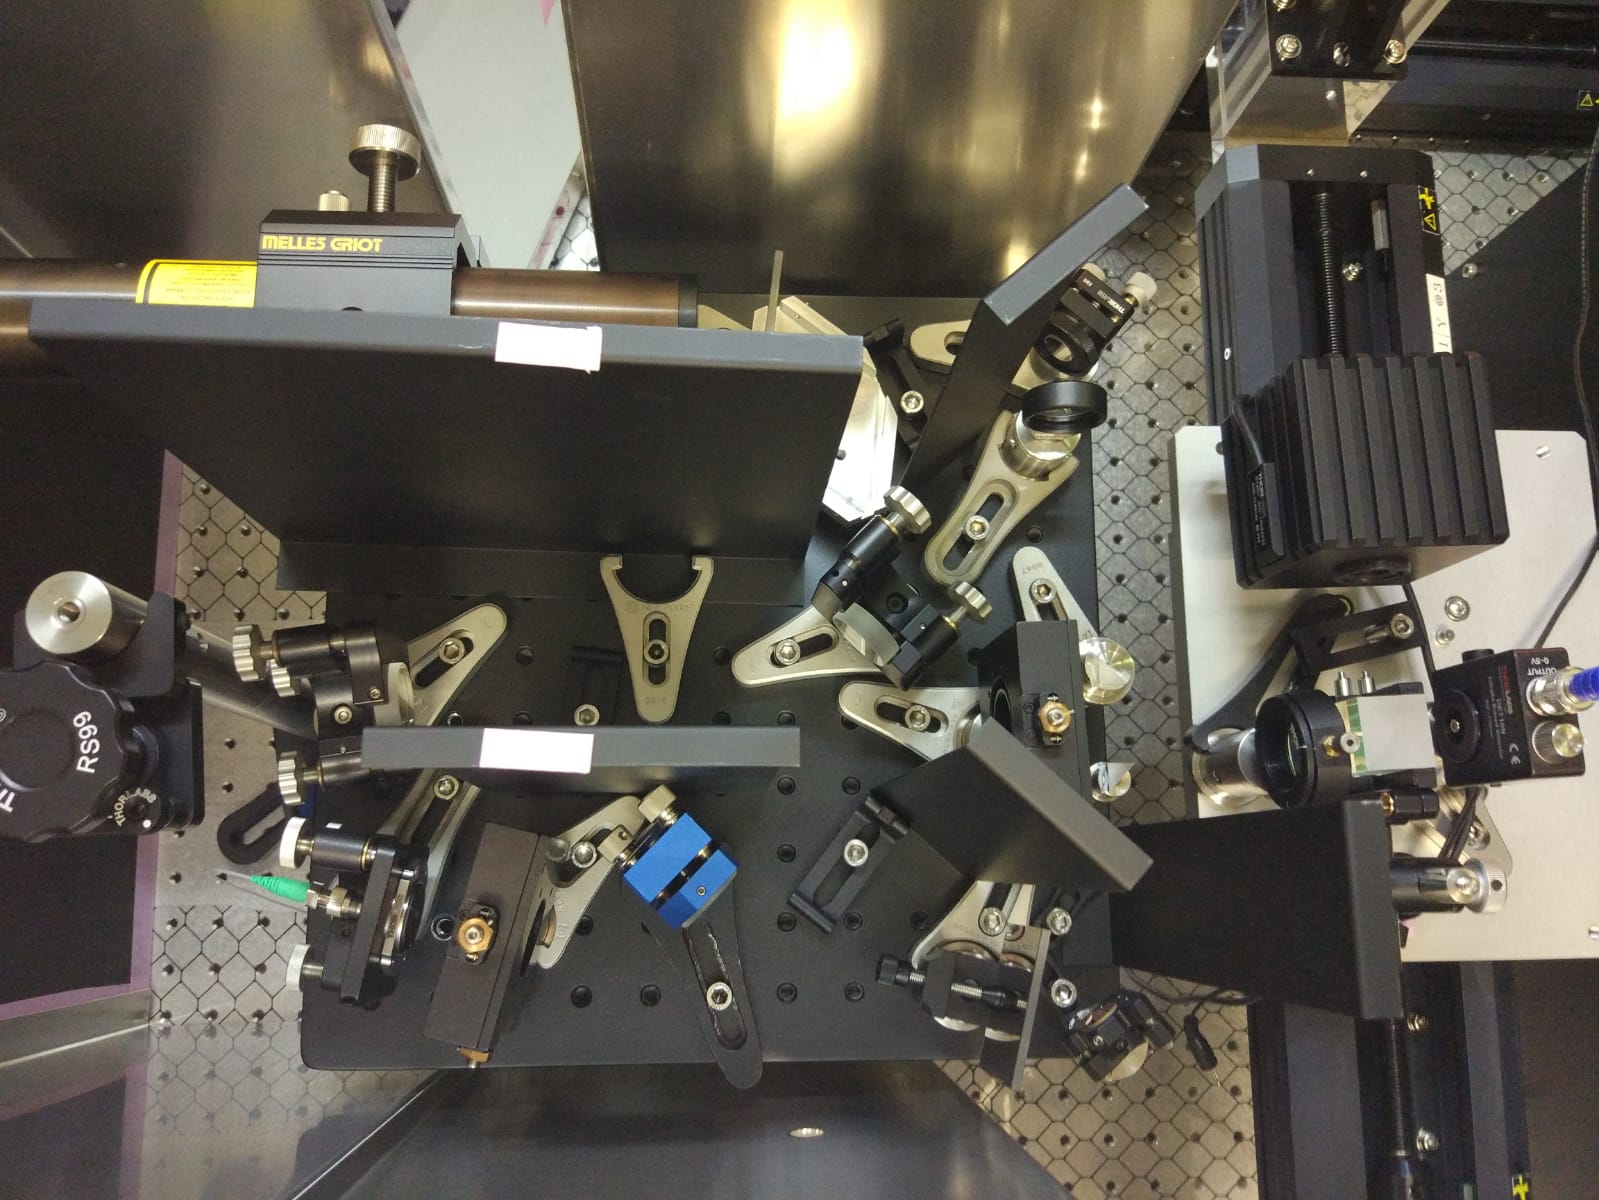
The laser is polarized. Using a non-polarizing 50:50 cube beam splitter I separated the 1310nm probe in 2 beams. One beam is detected by the DET10N and the other by the PM100D integrating sphere.
Conditions:
laser current = 200mA,
power attenuated by a od2 nd filter,
power on each PD = about 250microW,
load resistance of DET10N = 7.5kOhm.
DC PM100D = 1.52 V
DC DET10N = 2.62 V
I recorded 2 videos of the oscilloscope measuring the two signals simultaneously.
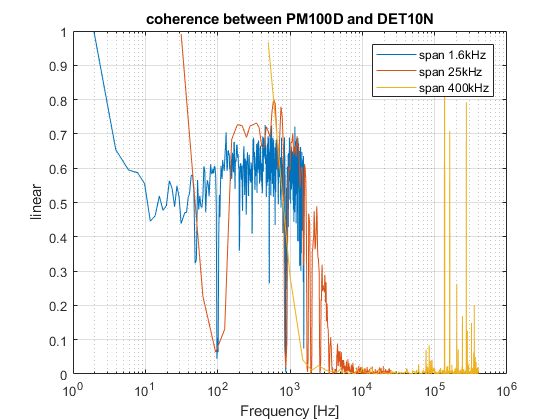
Then I measured the coherence, and this time the signals are more coherent. See plot
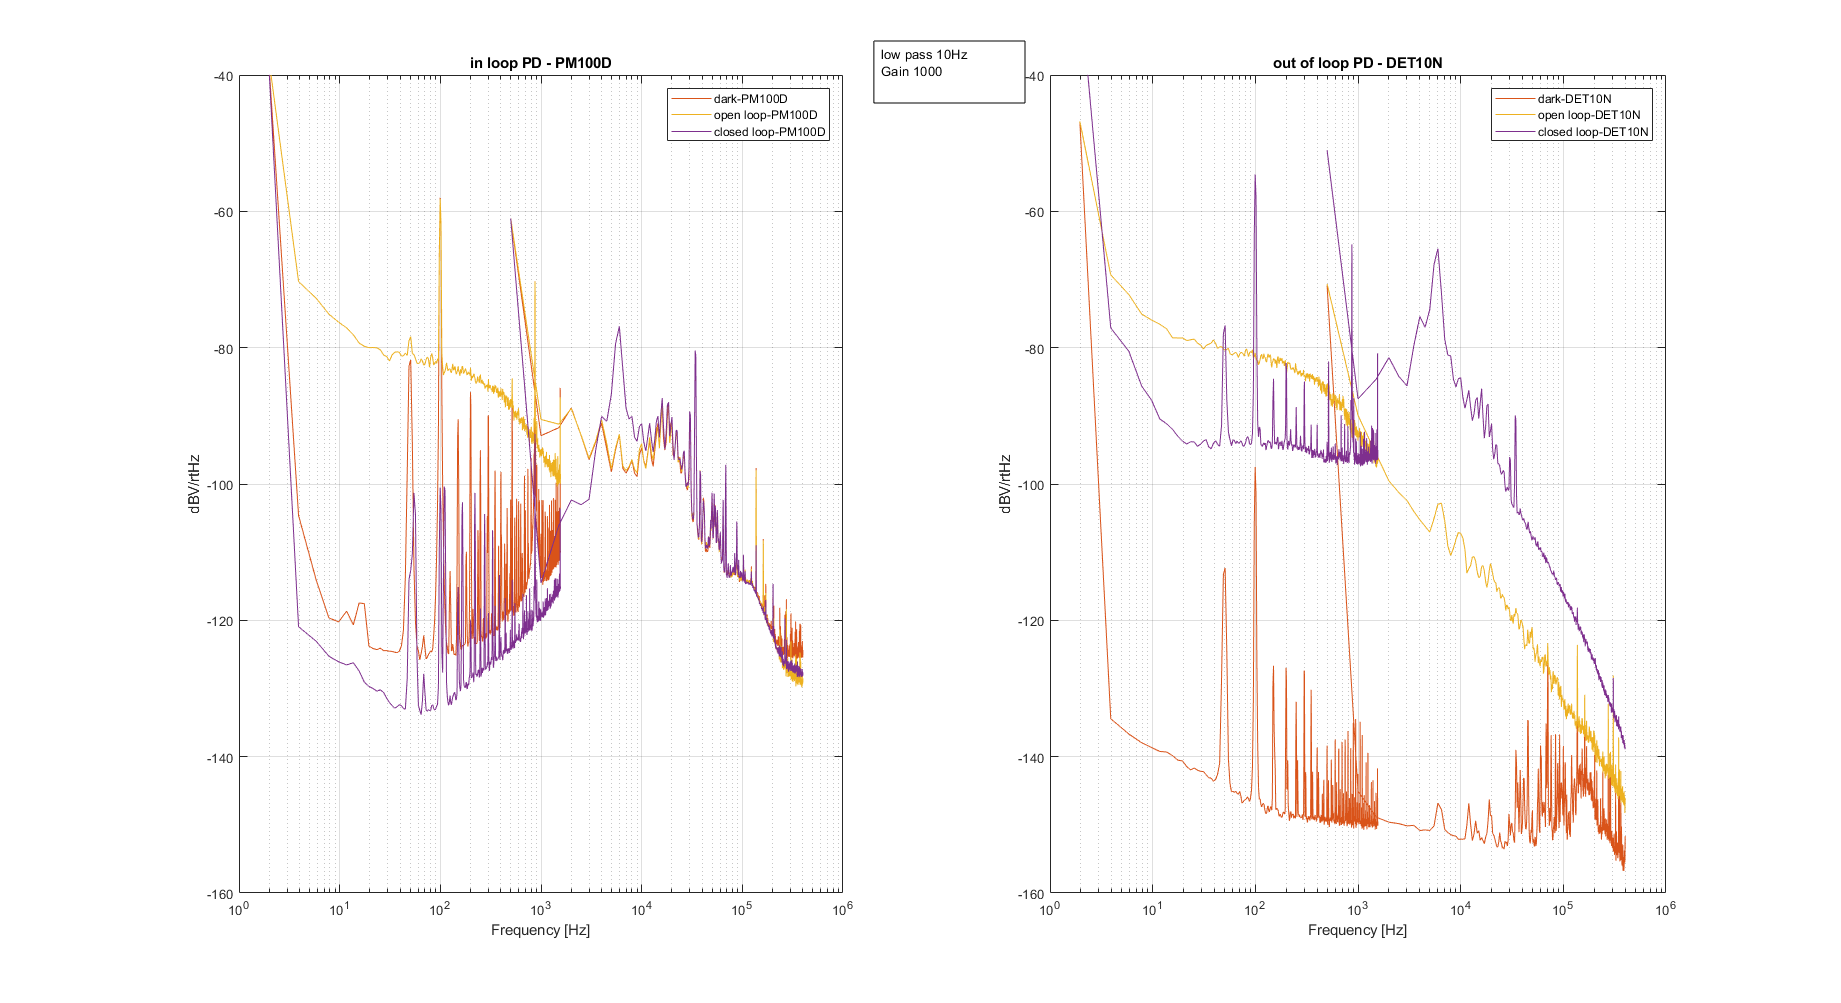
then I closed the loop with the PM100D in-loop and then I closed the loop with the DET10N in-loop. See the plots.
Now the loops work better, but maybe its better to use another DET10N, because it looks less noisy.
I replaced the PM100D power meter with another DET10N that I borrowed from Tanioka-kun, and I repeated the measurement.
This time the two signals at the oscilloscope look really similar. See the attached videos. (also the coherence on the spectrum analyzer is close to 1, sorry I didn't save the coherence data).
Then I closed the loop using the PD#1 in-loop and the PD#2 out-of-loop.
Then I exchanged them and closed the loop. See the two figures.
The control loop reduces a lot the noise in-loop but it doesn't really work for he out-of-loop PD (same situation when they are exchanged).
One possible reason could be the clipping noise, because I'm not sure how precisely the beam is focused inside the area of the PD.
Another possible reason could be the OD2 filter (that I'm putting after the laser to limit the power and avoid the PDs saturate). If I remove it, 40mW would imping on each PD. I'm not sure how safe it will be for the PD, and In order to avoid saturation, I will have to drastically reduce the load resistance.
Another way to reduce the power would be to enlarge the beams up to much more than the PD size (which is 1mm).
effect in the setup?
- When the loop is closed there is an oscillation at high frequency. Is the loop gain too high?
- Having the beams well focused within the photodiodes is important for this test.
We made a measurement of the power stability after the green mode-cleaner with both mode-cleaner and MZ locked.
The mode-cleaner was locked with the Stanford preamplifier (first order low pass, cut off frequency 3 Hz, gain = 5). The unity gain frequency should be measured, but the lock was very stable.
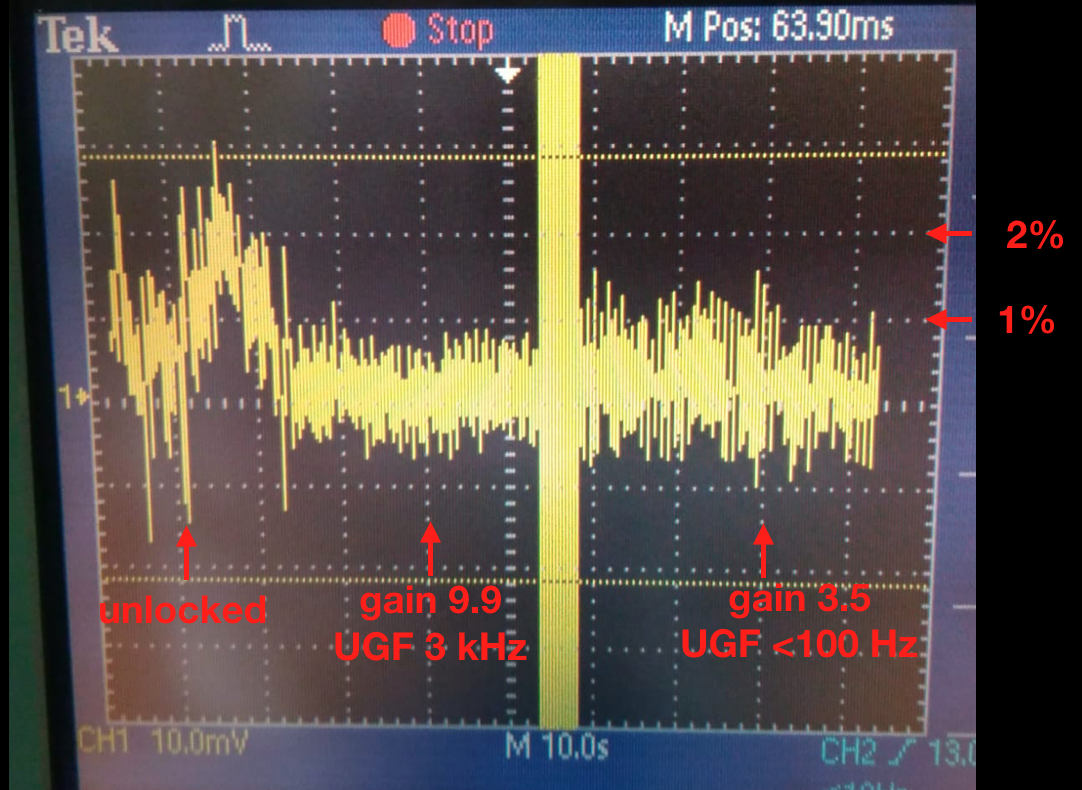
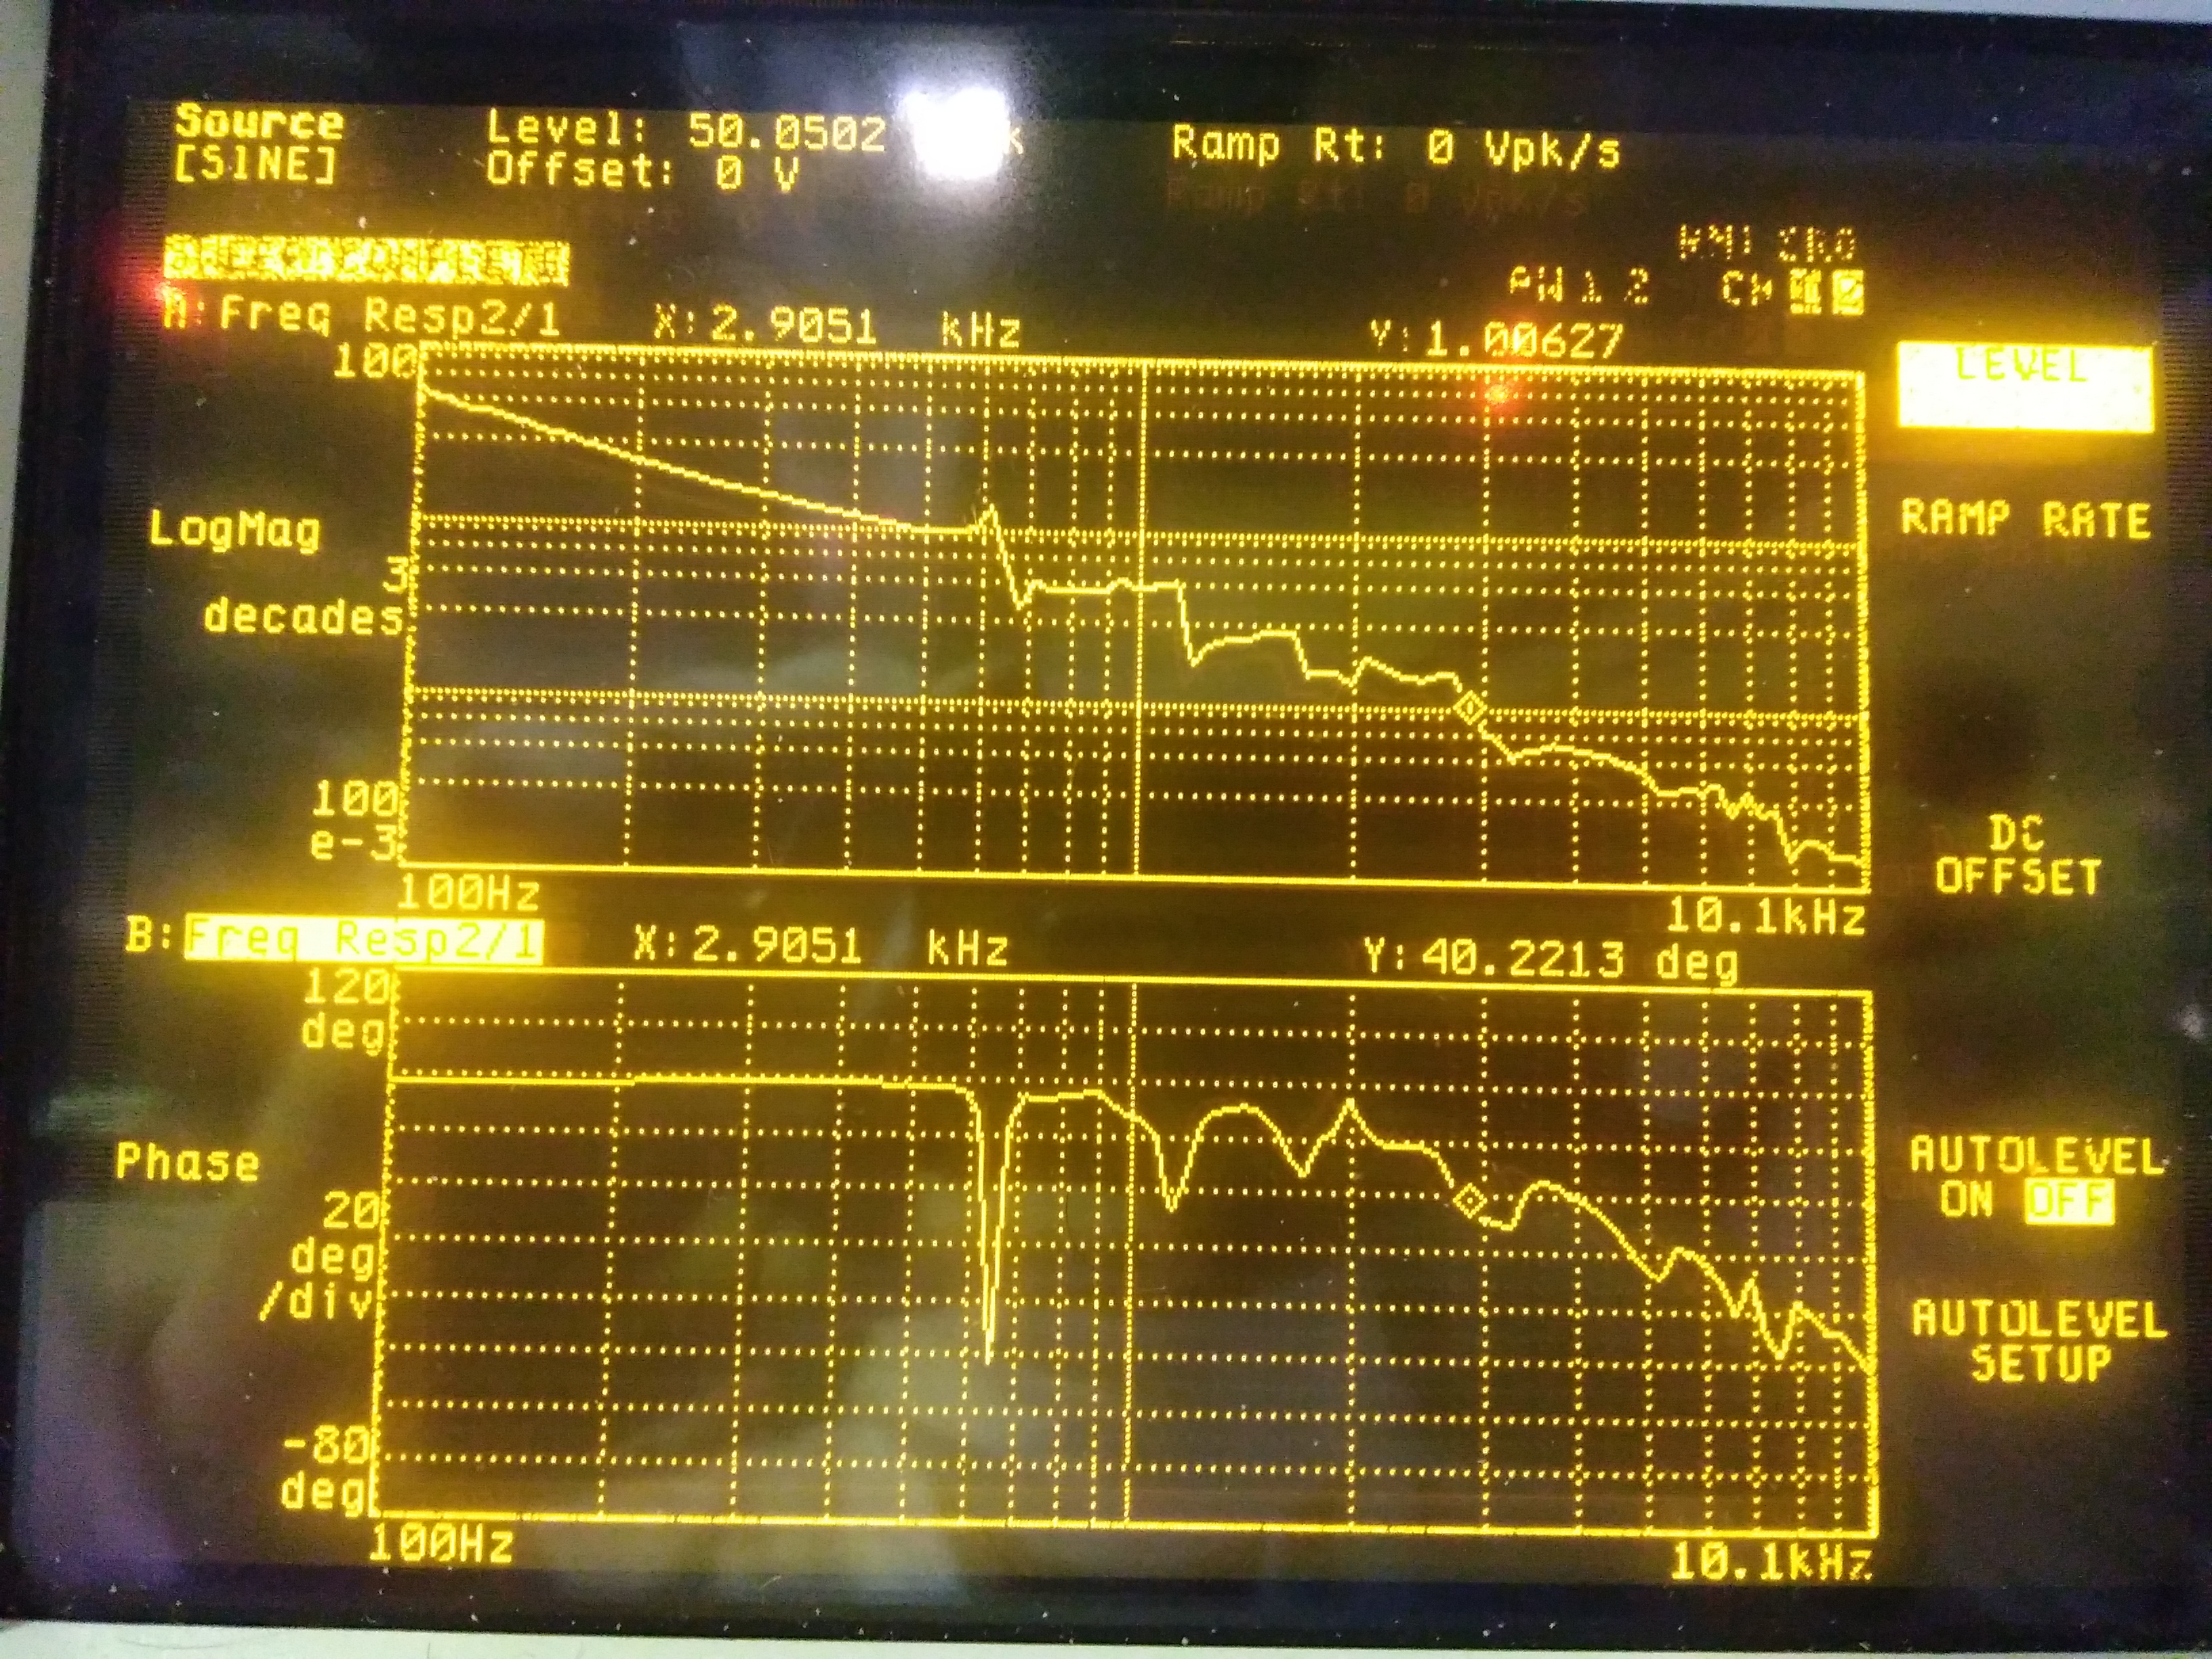
The MZ was locked with the Emil board at a position of the frange intermediate between the half fringe and the bright fringe (bright fringe correspond to 1,3 V and MZ was locked at about 1 V, corresponding to 11.3 mW), using the transmisison signal after the mode-cleaner. The measurement of the unity gain frequency gave a 3 kHz ugf (see picture 2), compatible with the ugf measured by Emil. (gain of the potentimeter 9.9).
Figure 1 shows the power transmitted with no lock, then with the 3 kHz ugf lock and with a gain reduced (from the position 9.9 to the position 3.5, corresponding to a measured ugf less than 100 Hz). We remark that, during the transition between high gain and low gain the loop experiences an instability at about 600 Hz (as altready observed by Emil) and it is coming back to a stable position.
The power transmitted by the mode-cleaner was 11.3 mW (corresponding to about 1 V). The fluctuations of the transmitted power on several tens of seconds timescales have an amplitude less than 10 mV (which corresponds to 1%) with the high gain. With the reduced gain, the fluctuations increase by roughly 1.5 and they remain less than 2%.
We left the Mach-Zehnder and green mode cleaner locked and we found them still locked when we came back after about 2 hours.
The attached picure shows the transmitted power from the MC over a period of about 8 min (the longest that can be recorded with the oscilloscope) after two hours of lock.
The gain of the potentiometer of MZ was 9.9 and fluctuations seem to be of the order of 1.5%
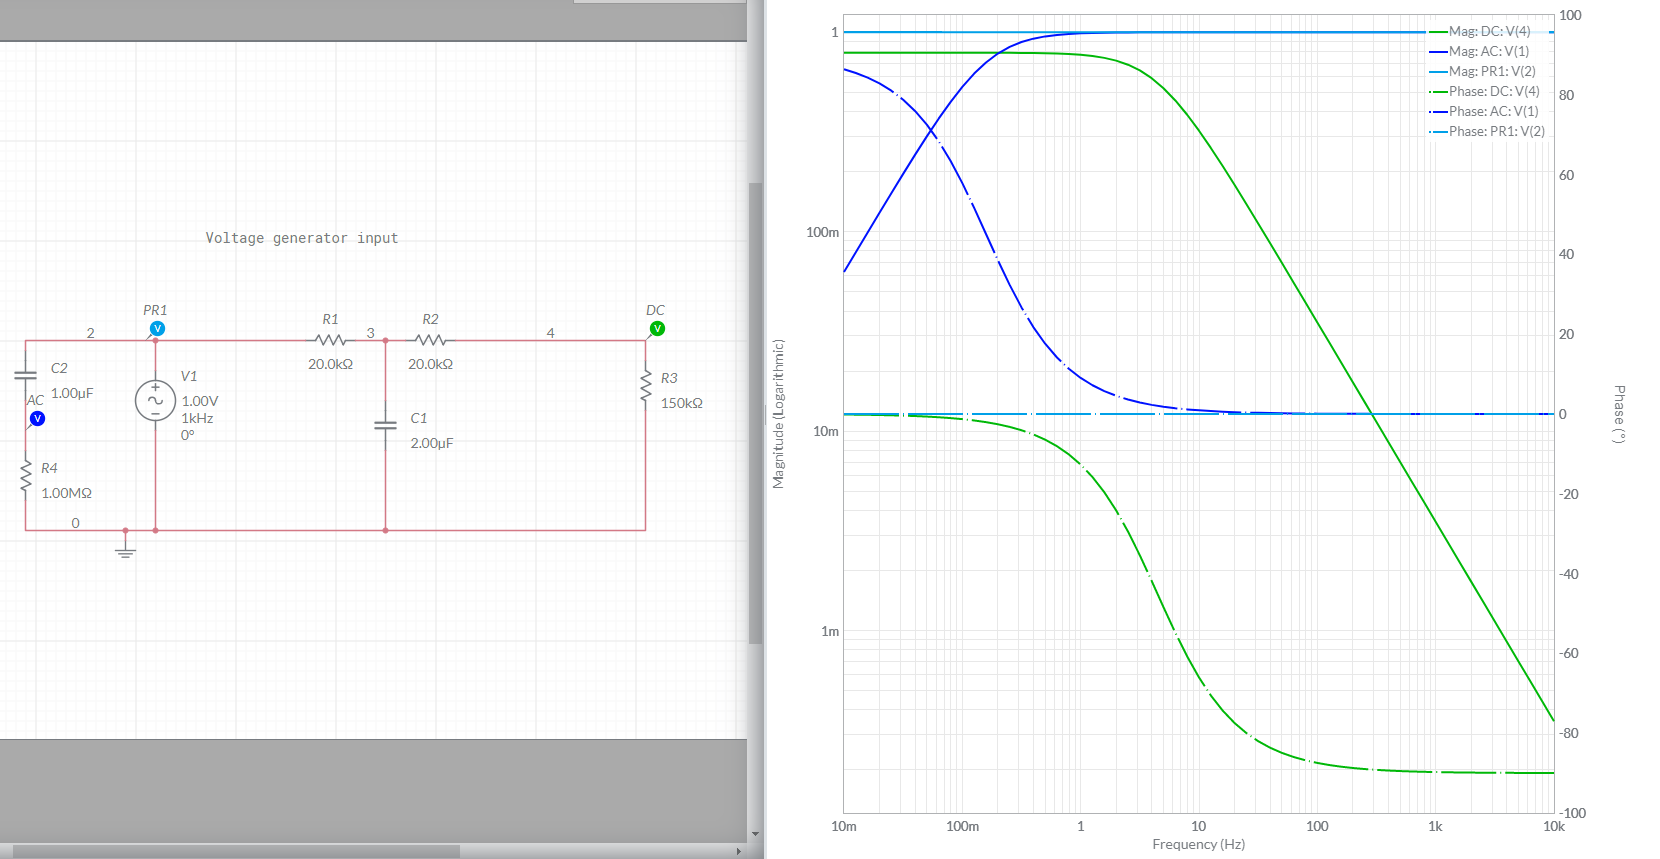
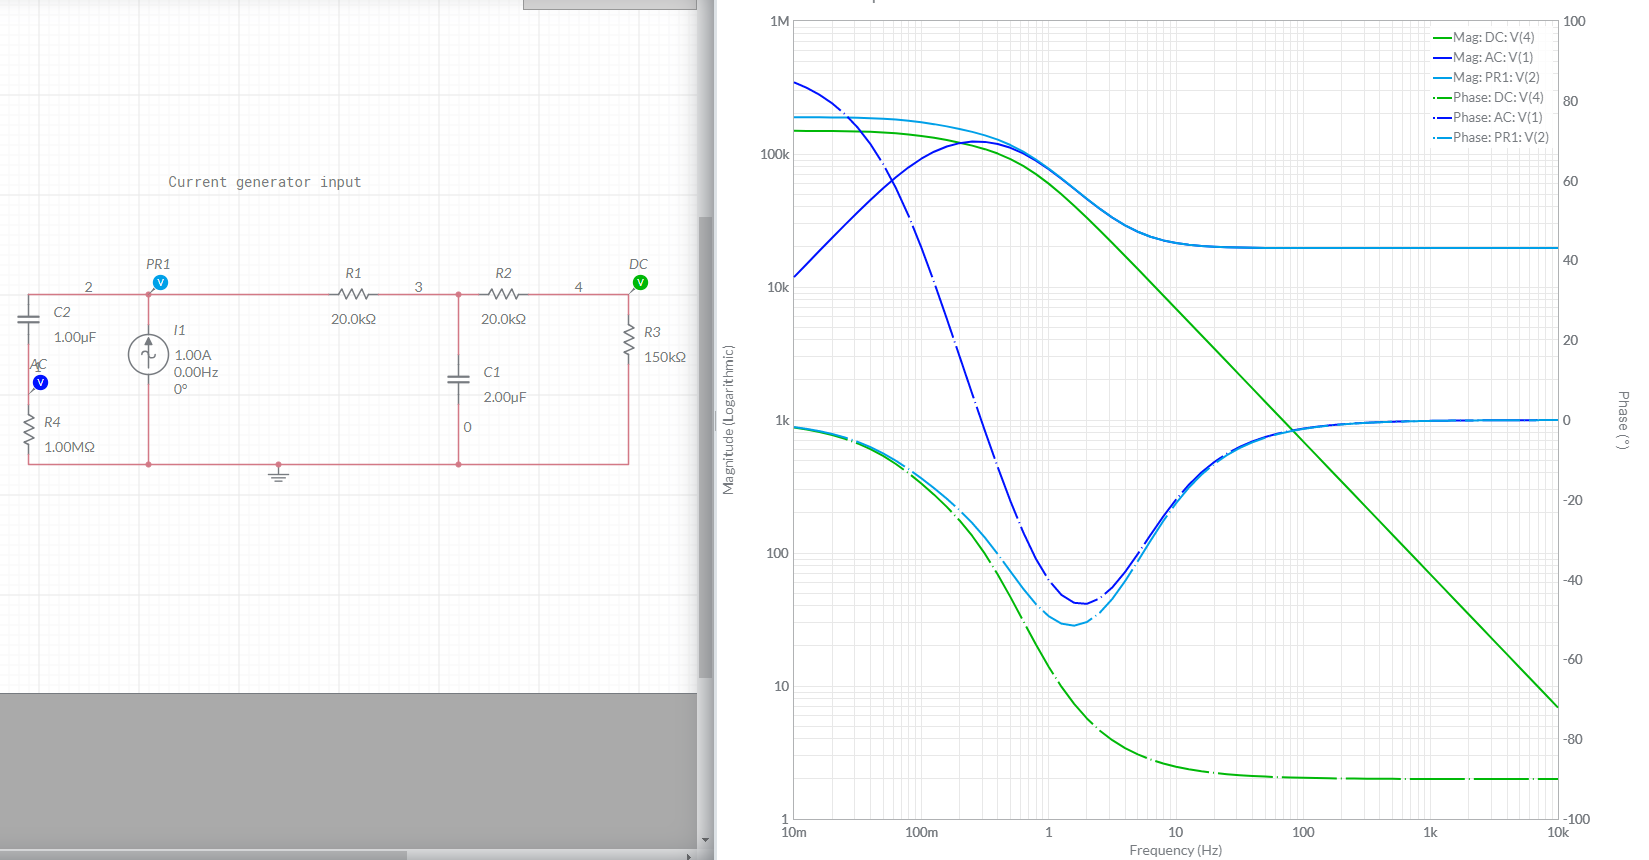
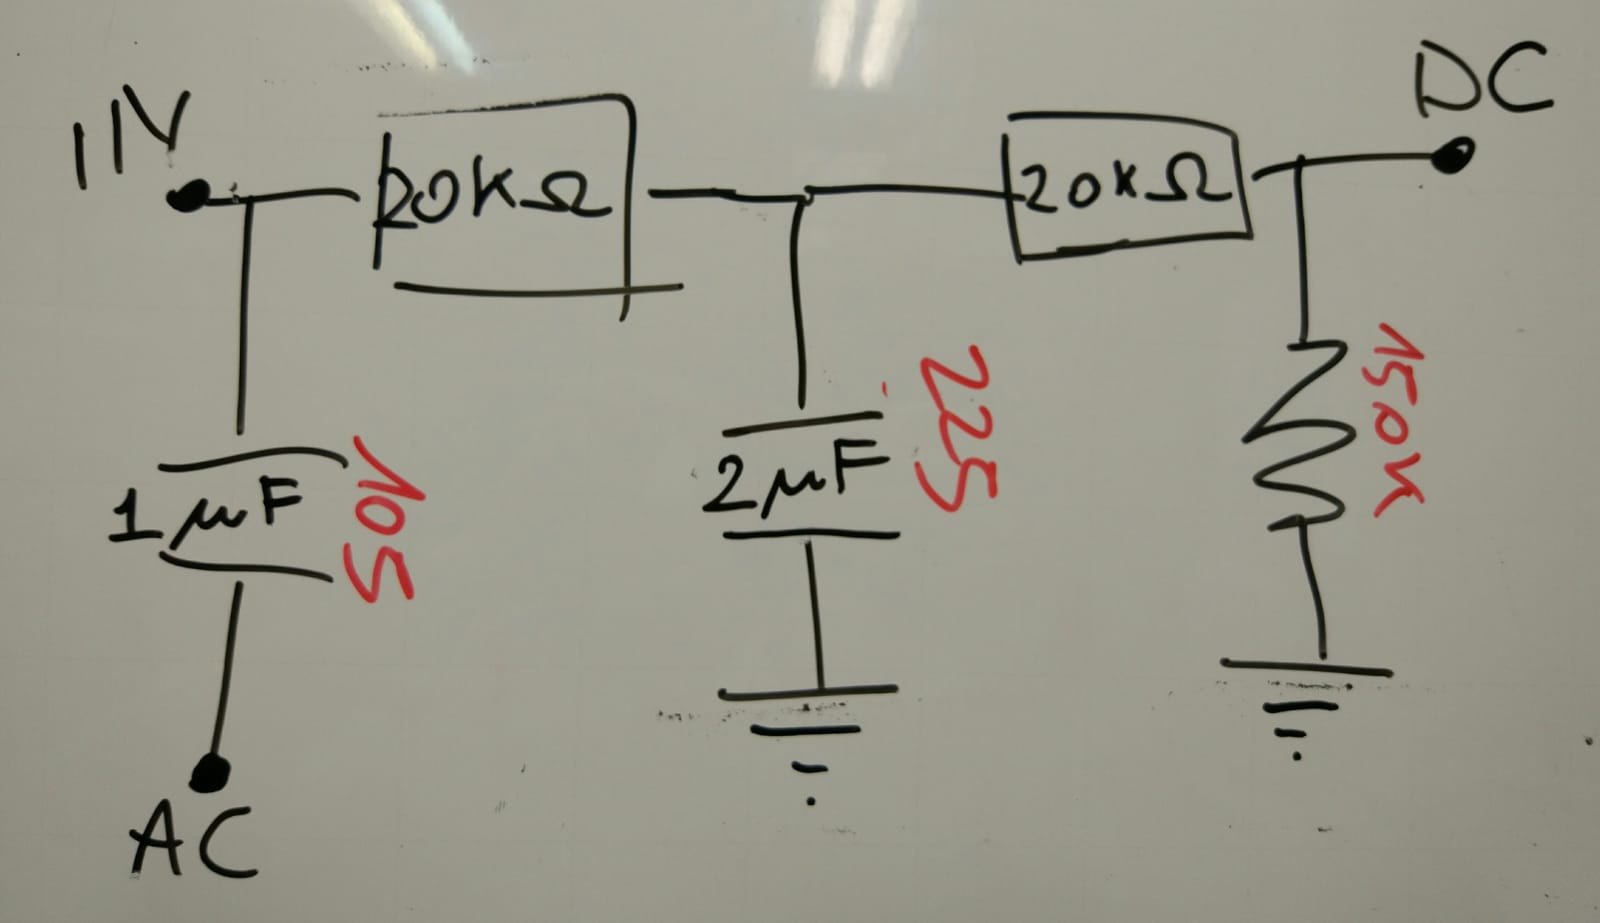
I simulated the box that separates the DC and the AC before input in the lock-in amplifier.
I drew the box with a voltage generator to show that the transfer function is a simple low pass filter and a simple high pass filter.
A more realistic simulation is with a current generator from the PD.
Today we have continued the investigations about the mode-cleaner transmission.
First of all we have tried to carefully align the cavity. To do that we have blocked one of the beams of the MZ and turned the polarization of the incoming beam to have the "p" polarization (lower finesse). In this way the peaks are broader and more visible. In the final alignment, the power in the 01/10 modes was of the order of a few % (see figures 1 and 2).
Note that, since in a 3-mirrors triangluar cavity the 01 and 10 are at different resonance frequency, we can align the vertical and horizonal directions and check immediately the effect on the peaks.
We have also measured the visibility of the cavity using the reflected DC photodiode. Note that when the the two beams of the MZ are present, the photiode saturates and then we put an optical density OD1 in front of the photodiode.
Measurements with the cavity locked
We have made three measurements. All the powers are in mW
1) MZ blocked - "p" polarization
trans = 6, in = 7.6, ref = 1.2, end 0.03
--> transmitted power = 79%, reflected power = 16%, Losses = 5%
2) MZ blocked - "s" polarization
trans = 4.5, in = 7.6, ref = 1.5, end 0.26
--> transmitted power = 59%, reflected power = 20%, Losses = 21%
3) MZ unblocked - "s" polarizaton
trans = 11.7, in = 18, ref = 4.2, end 0.6
--> transmitted power = 65%, reflected power = 23%, Losses = 12%
Measurement with the ramp
In the three cases the cavity visibility (1-R_res/R_nores) ~ 20%, which is in rough agreement with the measurements with the cavity locked.
Conclusions
1) the measurement of the cavity visibility ~ 20% (and the reflected power at resonance) seems to exclude a problem of asymmetry in the in/out mirror reflectivities.
2) a transmission of the order of 80% for "p" polarization and 60% for "s" polarization is possible. The 80% transmission for "p" polarization is compatible with the lower finesse of the "p" polarization.
3) we still have some non understood losses. More investigations are needed.
Figure 1 and 2 shows the alignment conditions with "p" polarization (we see that the high-order modes are a few %).
Figure 3 shows the cavity visibility
Participants: Matteo B., Yuhang, Eleonora
In entry # 876 we reported a computation about the difference between the reflectivity of the input and output MC mirrors needed to explain the low transmission. The results in that is has to be of the order of 0.5%
In order to see if the low transmissivity of the green MC is due to such a difference, we have changed the input and output mirrors, hoping to find a combination with smaller difference.
The mirrors installed belong to a batch of 6 mirrors with nominal reflectivity 99.2%. (see pic in entry 850). Among them 2 have been used in the mode cleaner, other 2 have been used to extract pick off of the MC reflected and transmitted beam. One was still in the box and the last one I don't know.
Here the different combination we tired:
| in | out | tra pickoff | spare | transmissivity | |
| initial | 1 | 2 | 3 | 4 | 44% |
| 12/07 | 3 | 2 | 1 | 4 | 45% |
| 17/07 | 3 | 1 | 2 | 4 | 35% |
| 17/07 | 3 | 4 | 2 | 1 | 56% |
The best results have been found with the last configuration
INPUT POWER : 23 mW
TRASMITTED: 13 mW
REFLECTED: 7 mW
We added a lamba/ 2 to improve the polarization and we observed that we can get rid of the broad mode observed in the spectrum.
The alignment was good but can be further improved.
Note that between the second and third configuration I have reduce the modulation depth sent to the 15.2 MHz EOM of a factor 2 (selecting 1/2 scale in the windows 'channel control' of the DDS software). As expected it improves the transmissivity of few percents. The lock of the SHG doesn't seem affected by this change.
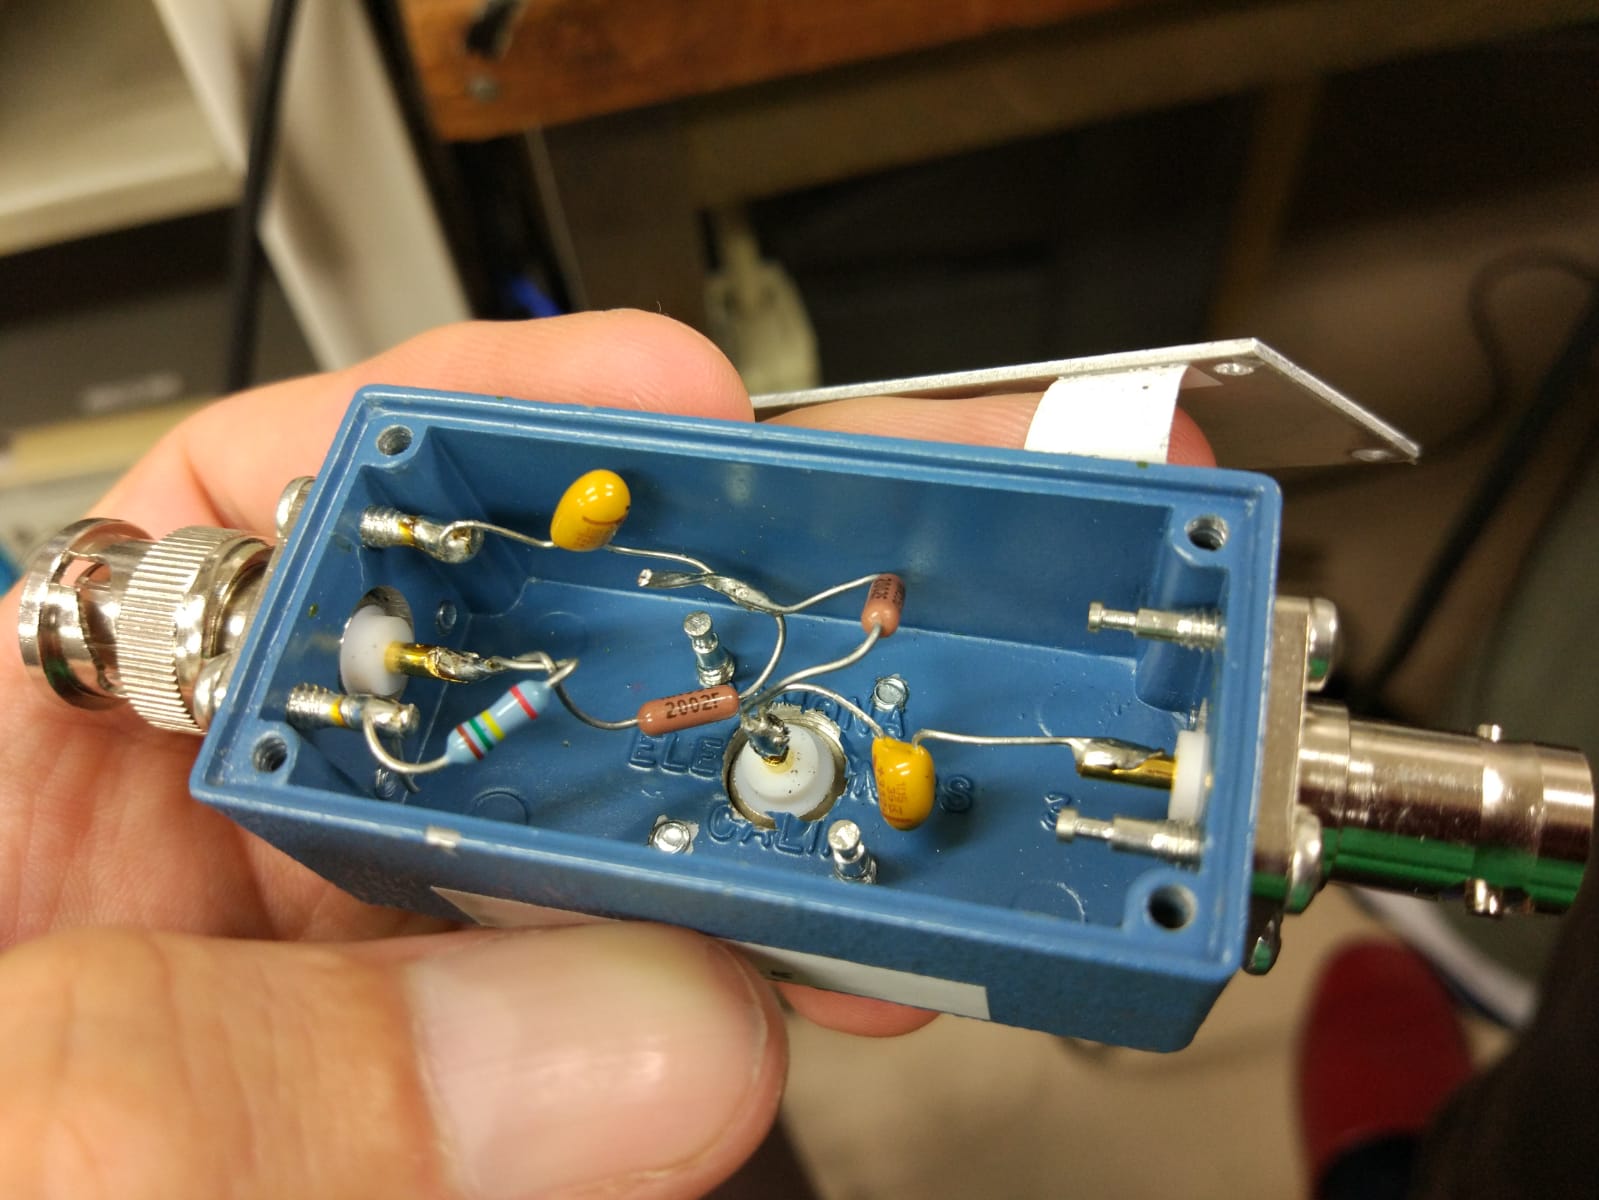
I upload the circuit diagram of the box used in the original setup from the SPTS company. (they made it)
I'm still using it in the current setup, but since the InGaAs PD has a higher Current/Power responsivity, It could be that I should reduce the load resistance and send more power on the PD. If it helps to reduce the noise, I will make a new box for the InGaAs PD.
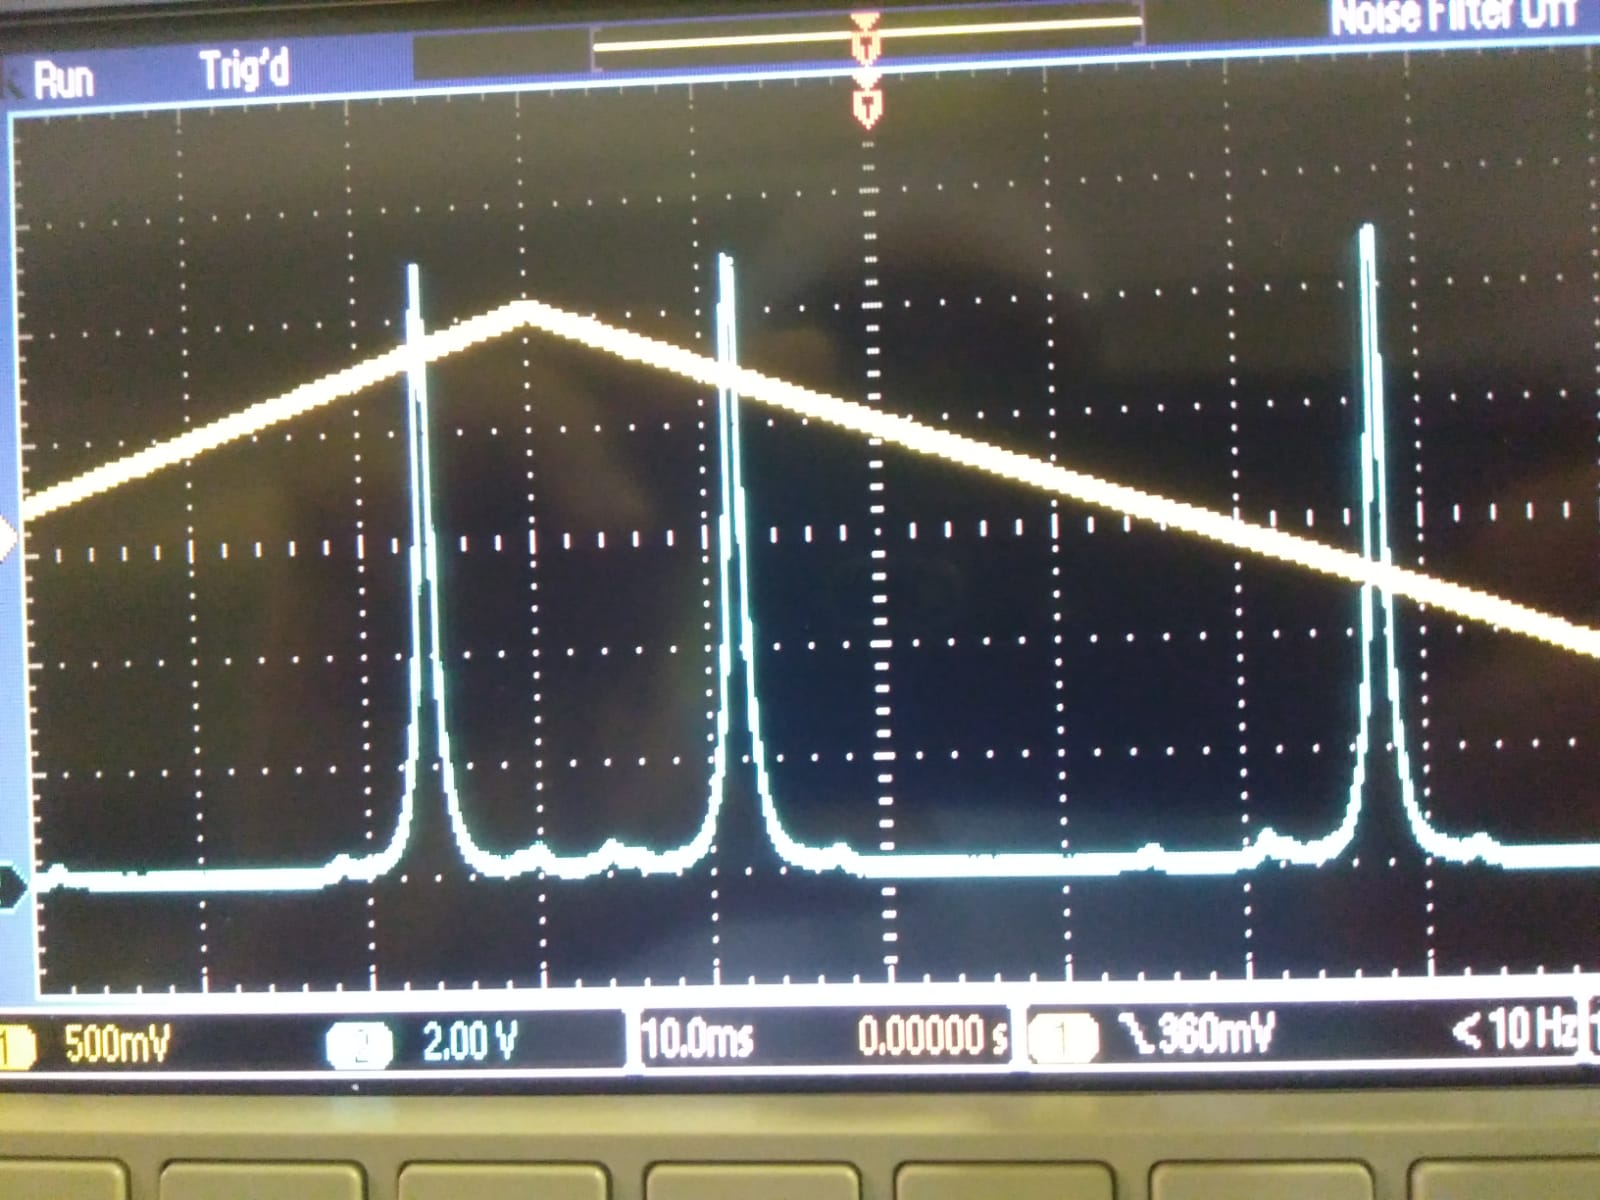
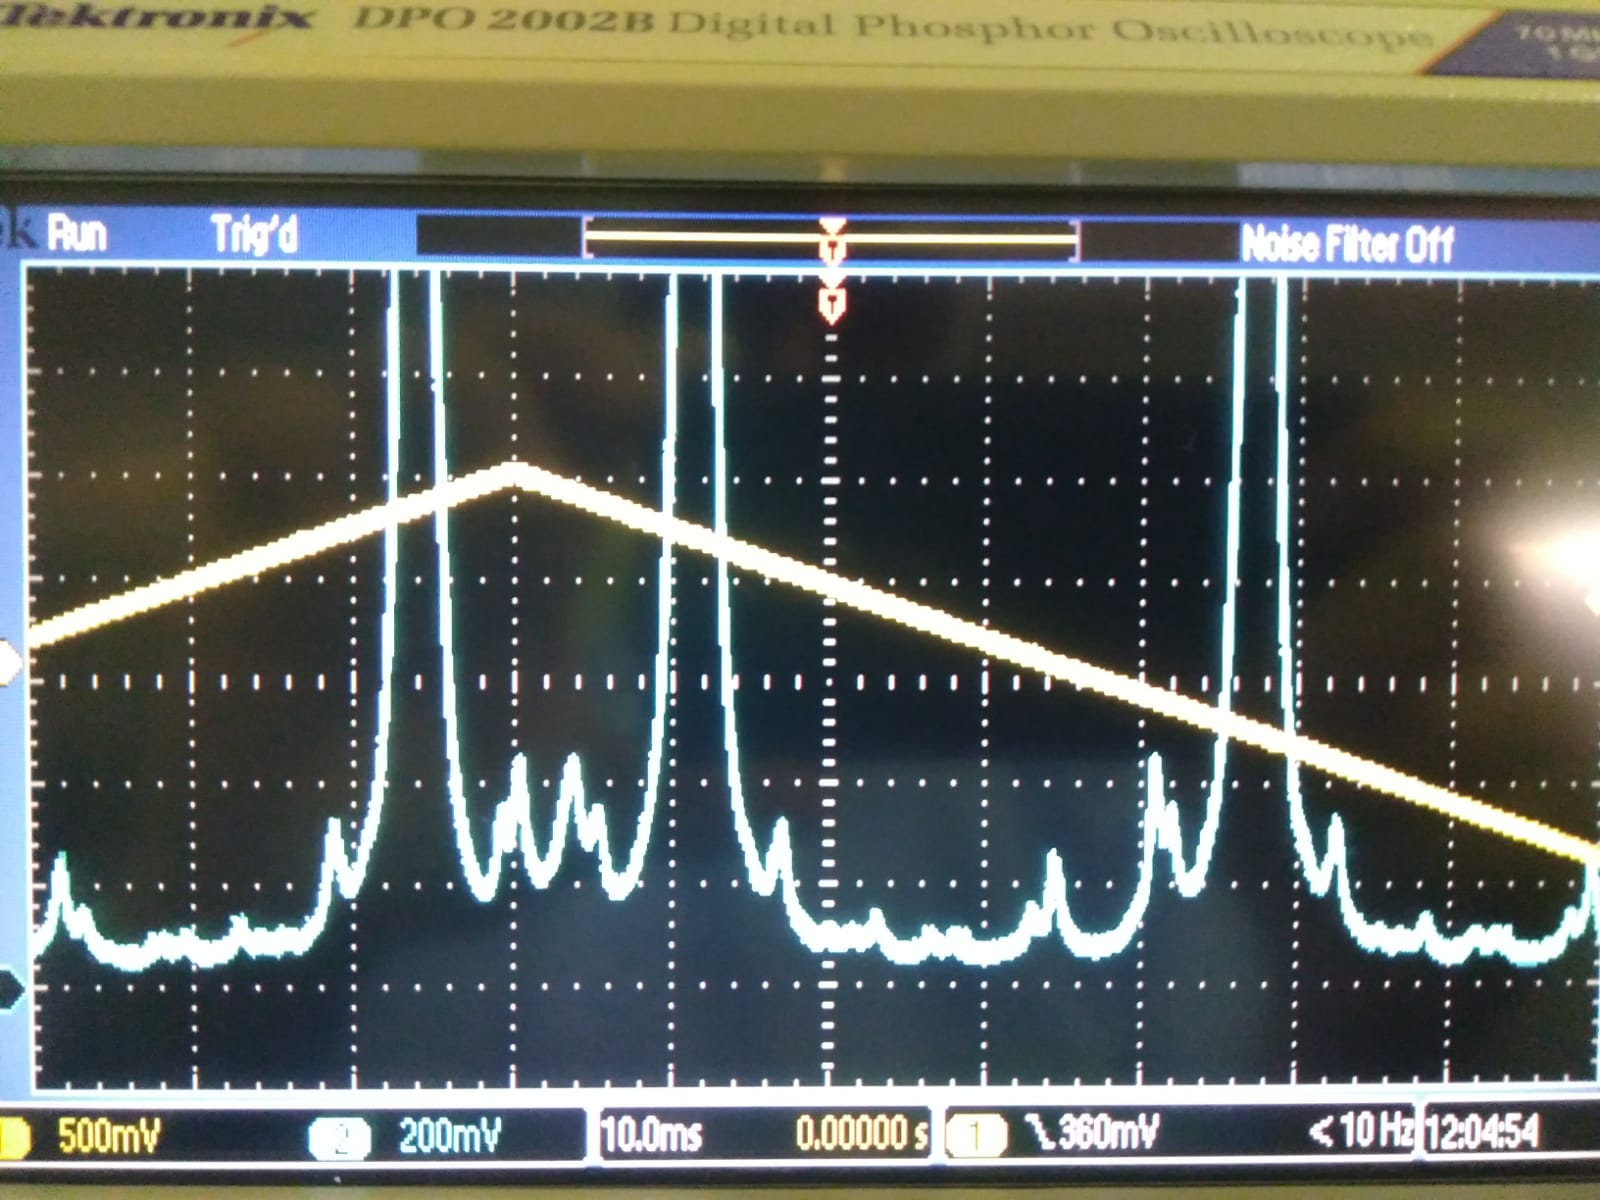
Using the Yokogawa2400 spectrum analyzer I measured the correlation between the signals coming from the two photodiodes:
- PM100D (incident power 85mW) DC 470mV, analog out
- DET10N (incident power 15microW) DC 104mW (load resistance 6kOhm)
The signals don't look coherent. It could be that they are really not coherent, or that the spikes at high frequencies invalidate the spectrum measurement.
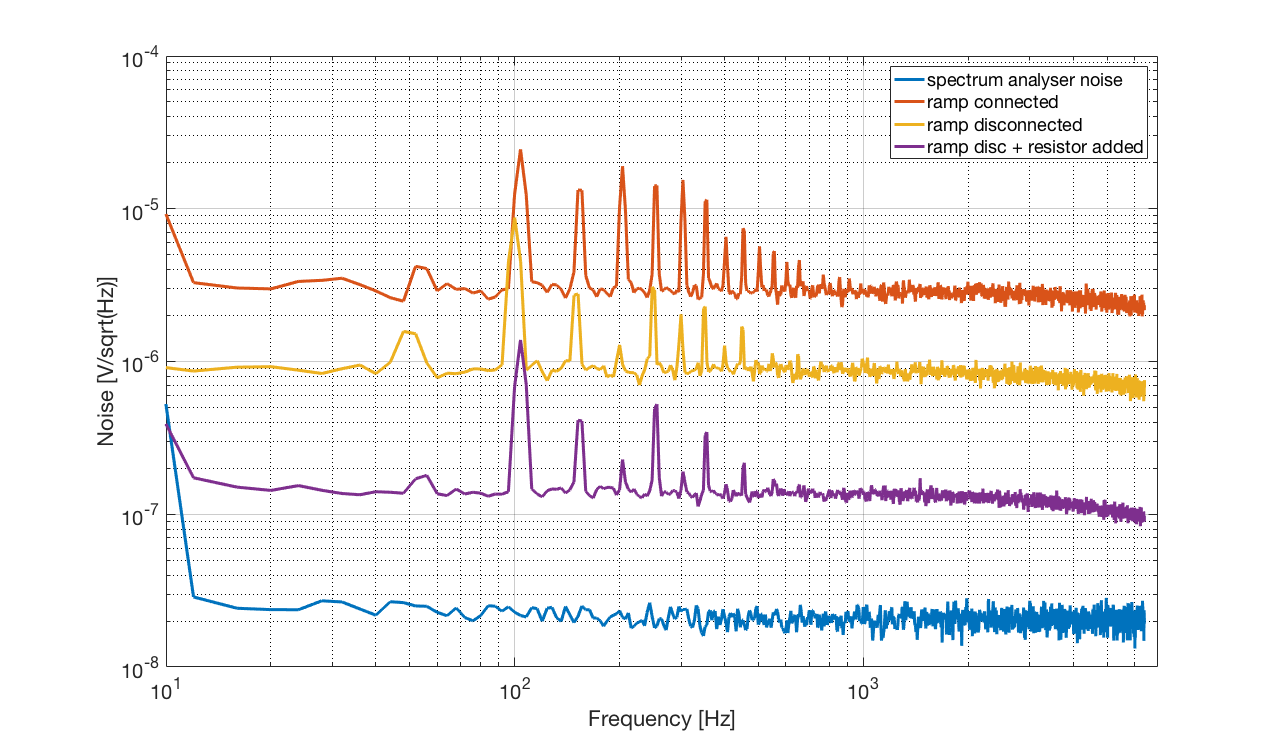
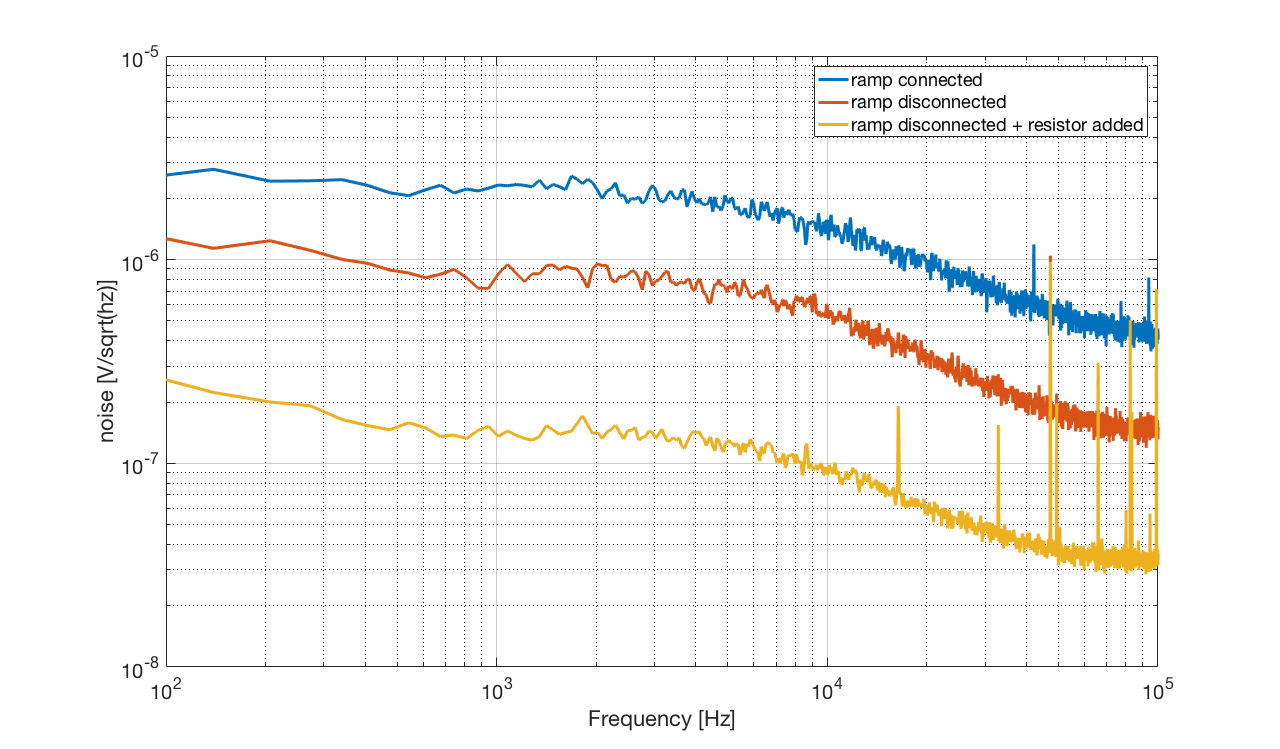
After having disconnected the potentiometer of the ramp in the actuator section of the rampeauto (see previous entry # 875) we have further modified the rampeauto to reduce its noise. Following Pierre's instructions, we have soldered a 2.2K resistor in parallel to the resistor R24, in order to reduce the gain of the PA83 amplifier and then the effect of its input noise. In practice, since the resistor R24 was difficult to access, we have put the resistor in parallel with C23.
- The attached PDF shows the electronic scheme of the rampeauto (actuator part).
- Figure 1 and 2 show the rampeauto noise taken at the PZT output without any input signal. We see that the rampeauto noise is reduced by a factor ~ 20 in the kHz region, as expected.
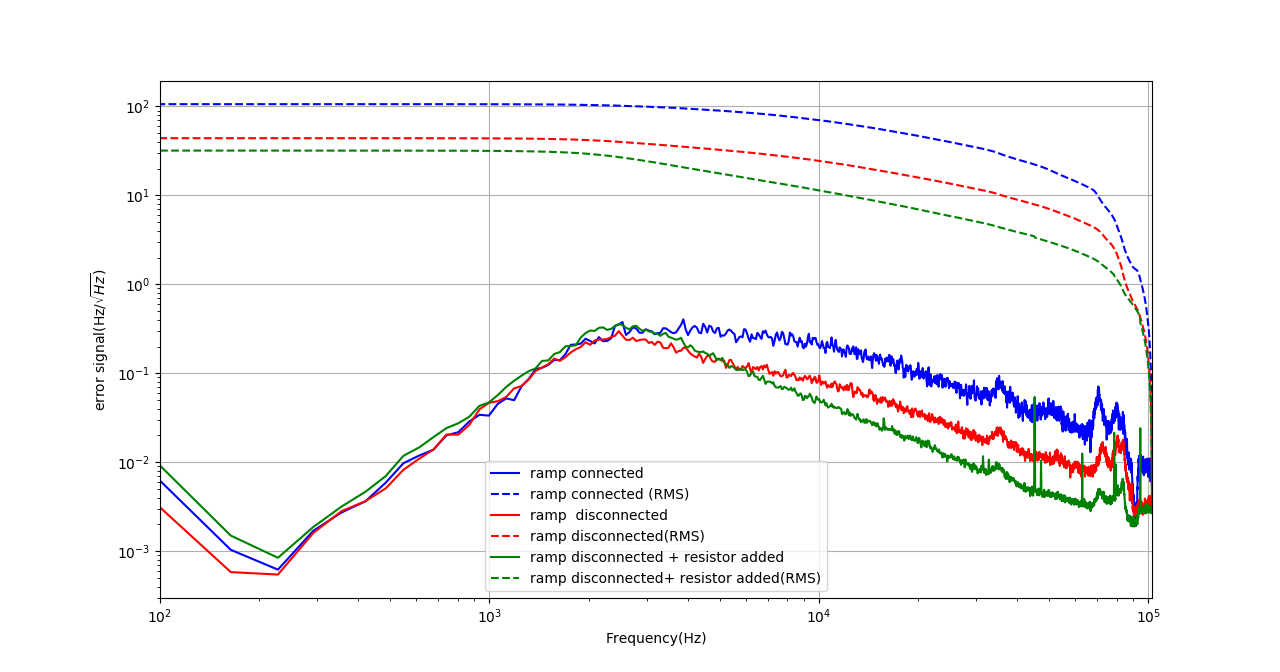
- Figure 3 shows the error signal of the filter cavity (green) with this new configuration, compared with the old ones. Note that, since now the gain of the P83 is reduced, we should increase the gain of the loop increasing the signal at the input of the P83 with the potentiometer "PZT gain". With respect to before, the error signal at high frequency is reduced by a factor ~ 8.
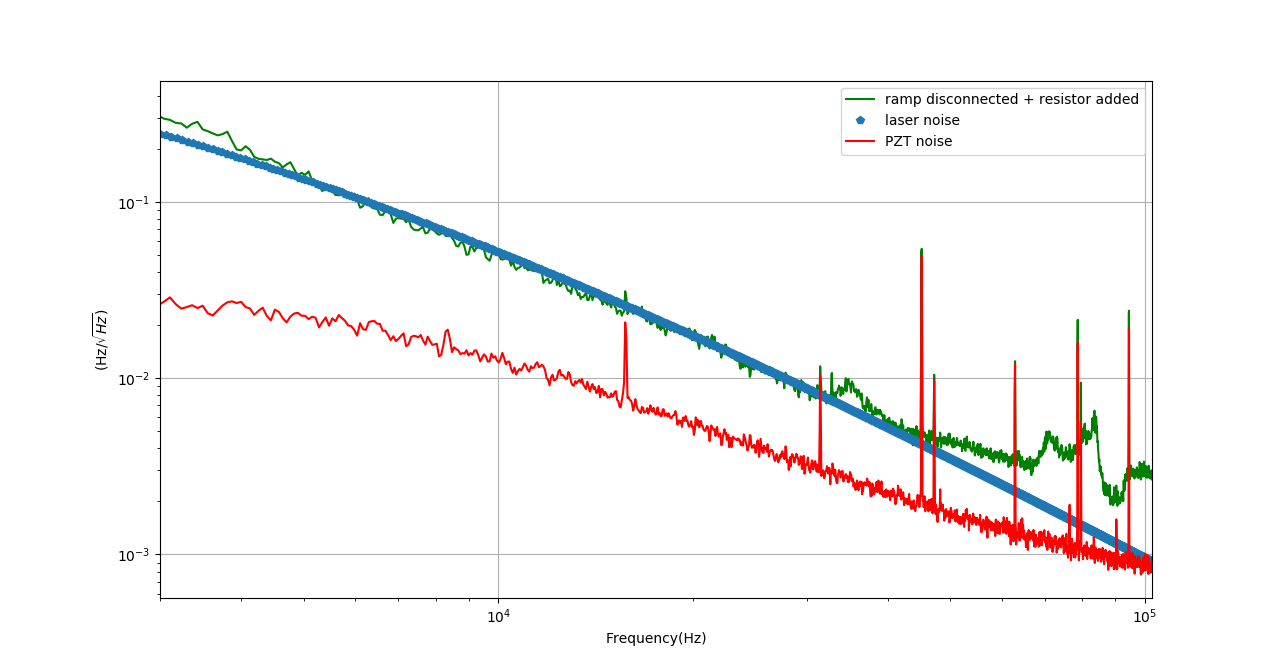
- Figure 4 shows the error signal of the filter cavity (green) compared with the noise projection of the laser frequency noise (7.5 kHz/f [Hz/sqrt(Hz]) and rampeauto noise. Both the laser frequency noise and the rampeauto noise have been filtered by the pole of the cavity (2.4 kHz) and multiplied by the open loop transfer function of the loop, which assumes a 1/f behaviour at f> 3 kHz and a unity gain frequency of 10 kHz. We see that with this new configuration the error signal of the filter cavity (green) is explained very well by the laser frequency noise.
Note that after the modification of the rampeauto it was not possible to obtain a ugf larger than 10 kHz. This should be understood better.

I repeated the same measurements with another spectrum analyzer, the Agilent35670a
This instrument spectra are much cleaner, I did only 32 averages instead of 256 with the Yokogawa sa2400
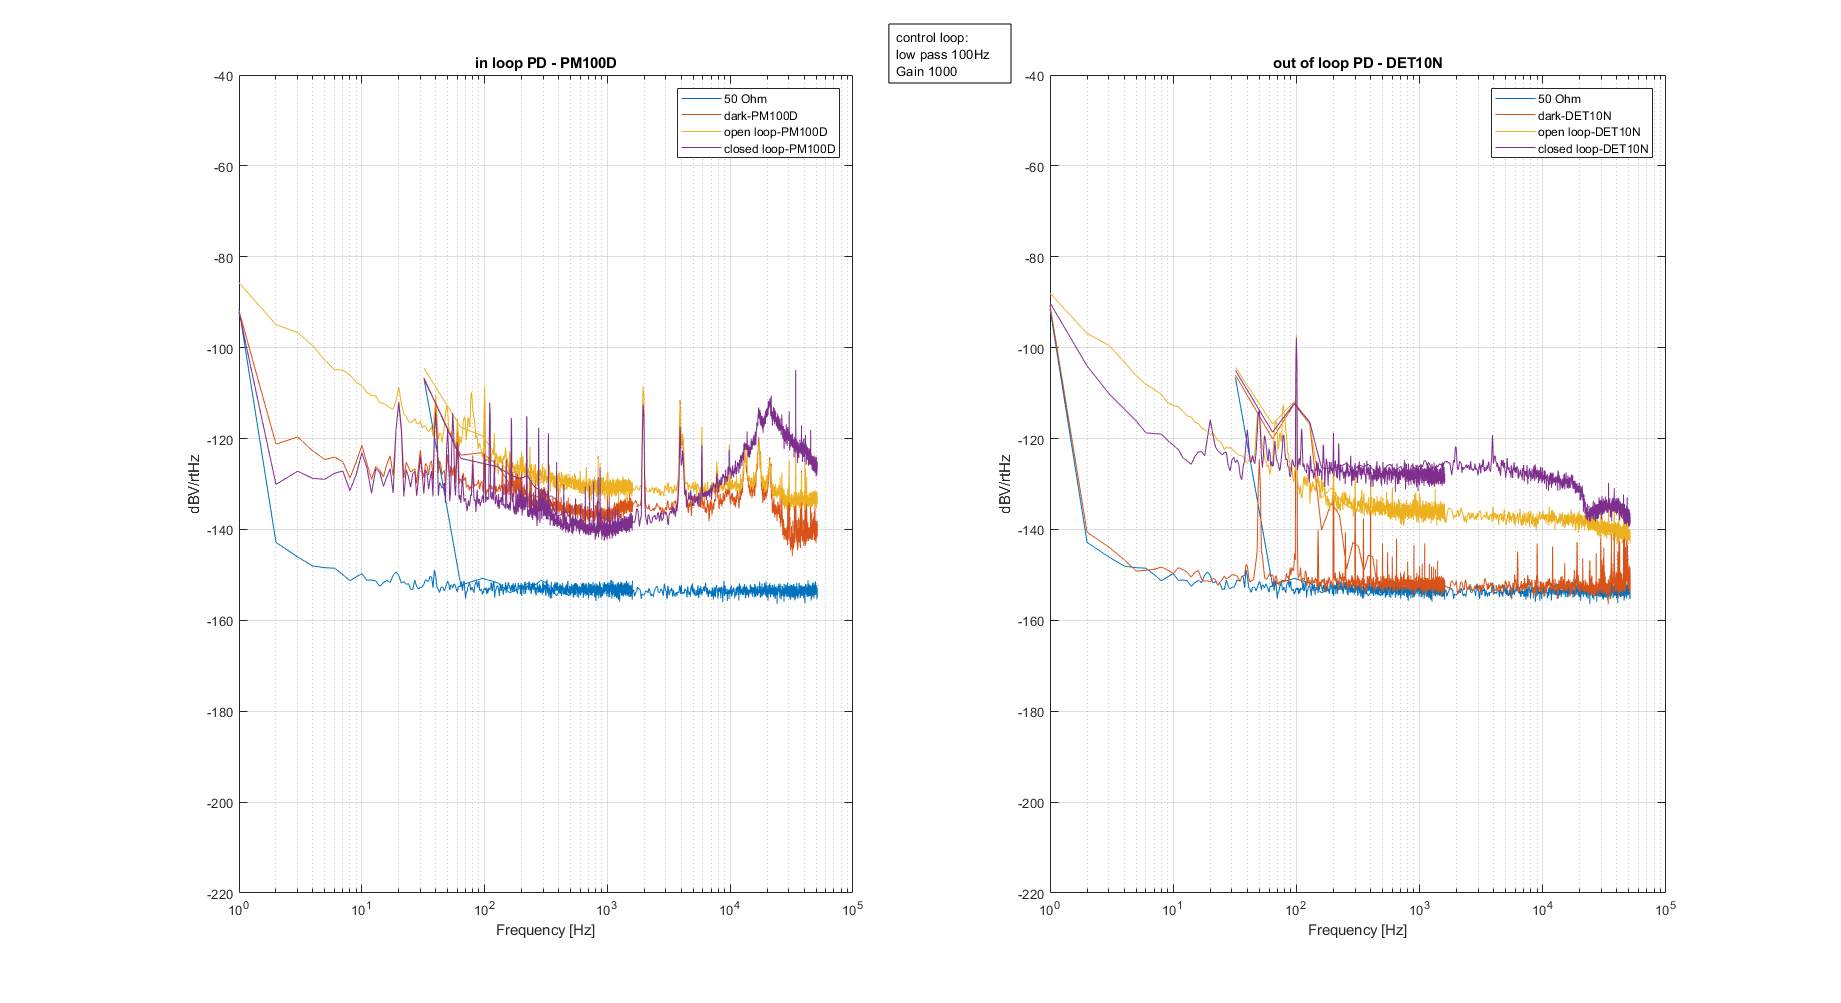
First plot: gain 1000 in-loop pd: PM100D
Second plot: gain 1000 in-loop pd: DET10N
Third plot: gain 5000 in-loop pd: DET10N
Participiant: Matteo.B, Yuefan and Yuhang.
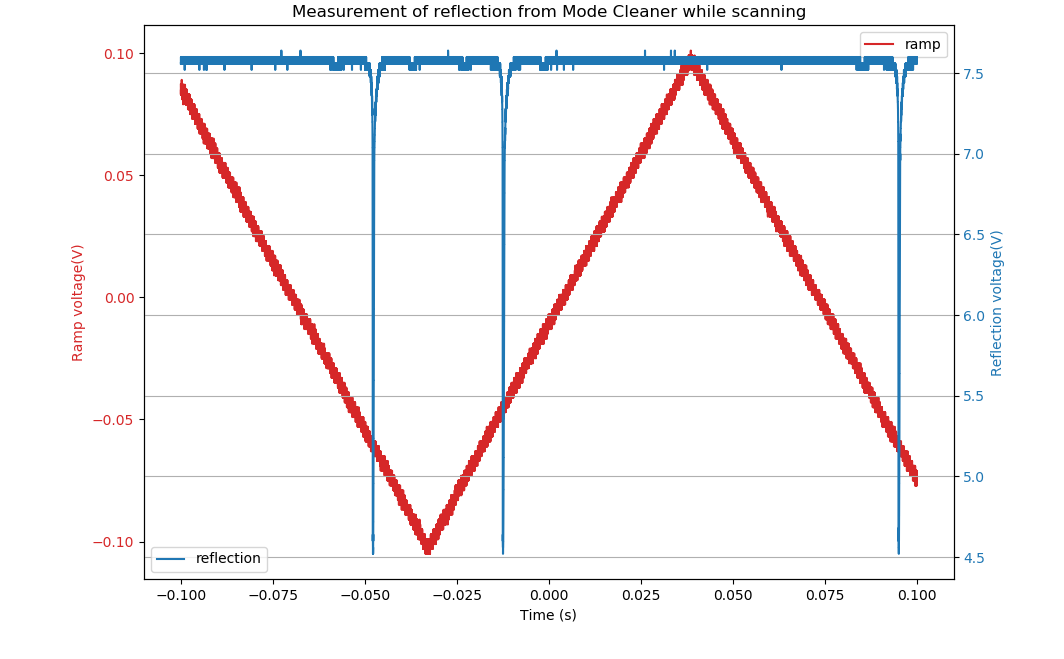
Yesterday, we installed a photo dector(PD) to monitor the reflection of green mode cleaner. This PD was put in the path which is the pick off of green reflection. And the monitor point has almost all the reflected power.
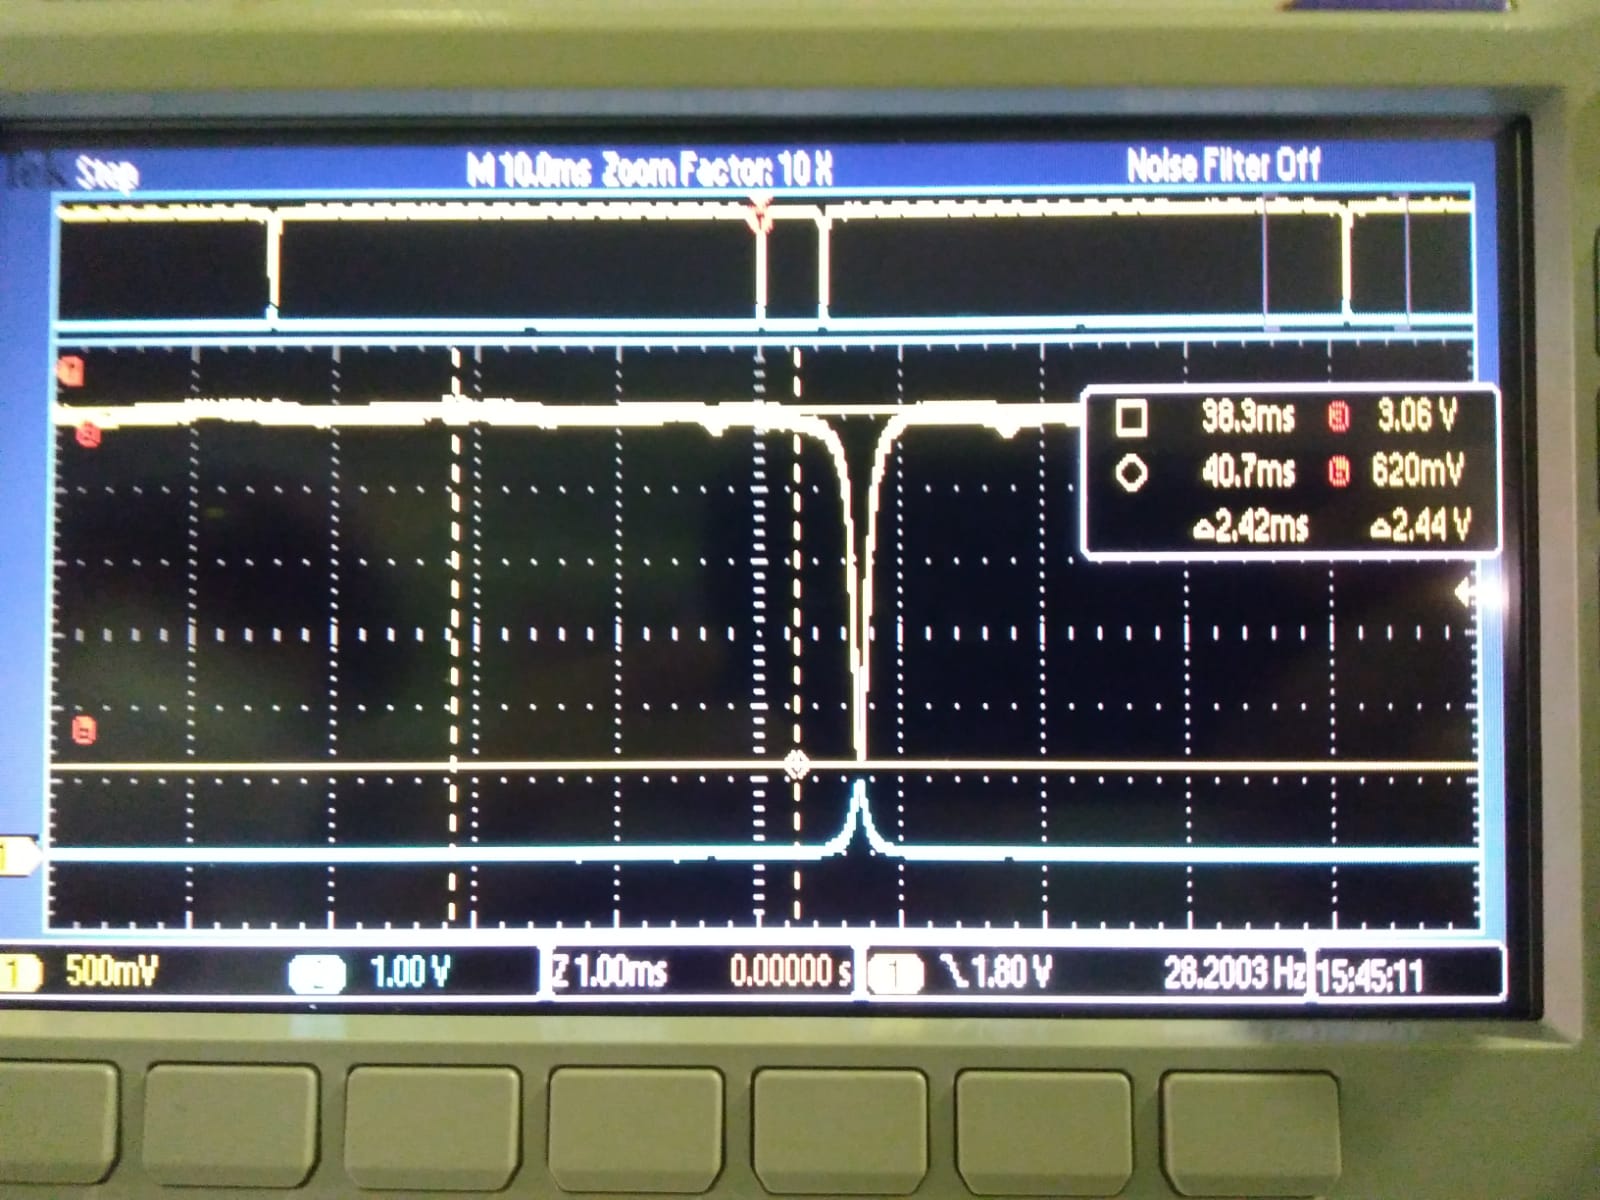
Then we scan the mode cleaner by sending a ramp signal to the mode cleaner. Actually here I made a mistake which was mentioned by Matteo.L before, but I didn't pay attention. It is I use a very large ramp amplitude, which is 700mV p-p. In that case, the scan is very fast. So I cannot see the reflection peak. See attached Figure one.
Then we decrease the ramp amplitude to 100mV. And we can see the reflection peak.
We can see from the figure 2, when we are in the resonance, the reflection is around 55%.
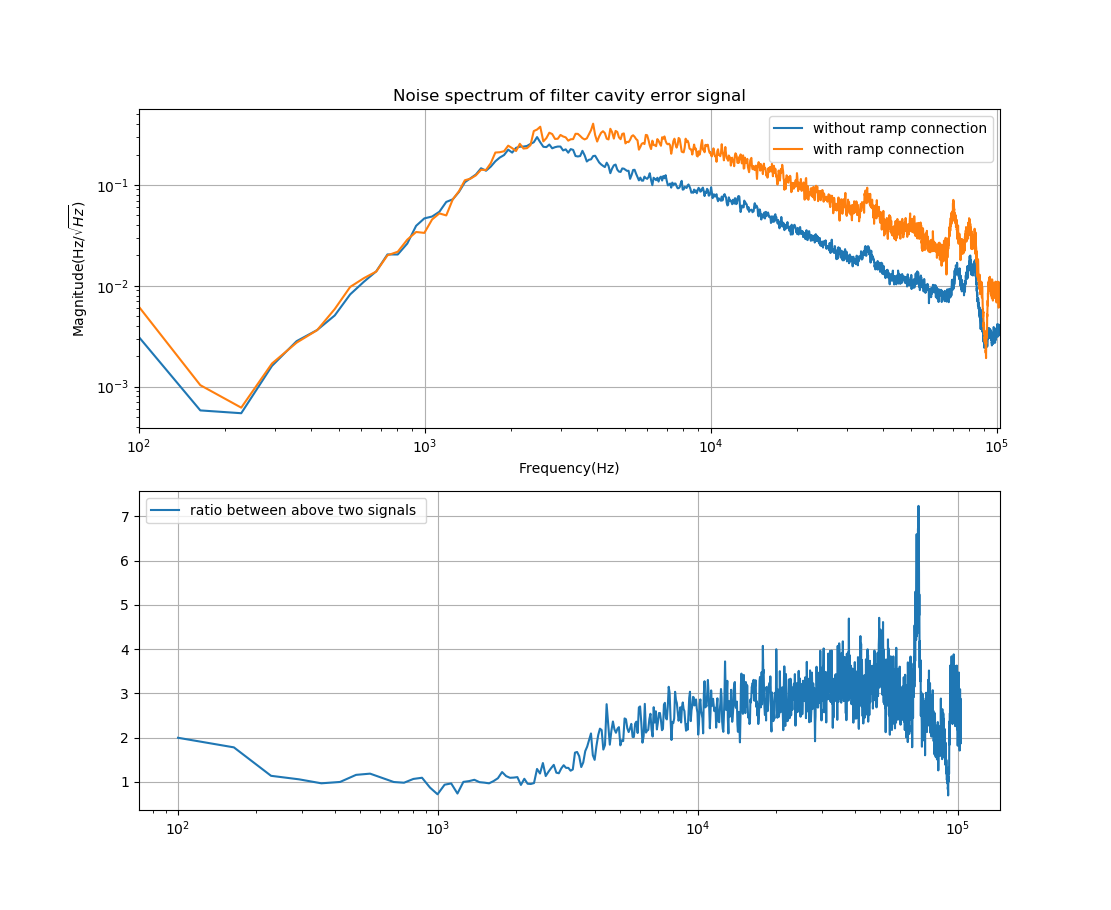
We compare the green error signal spectrum before and after the disconnection of Ramp injection point in the circuit. We can see the noise level is reduced by a factor up to 3 from 2kHz.