NAOJ GW Elog Logbook 3.2

Participant: Eleonora, Marco, Matteo and Yuhang
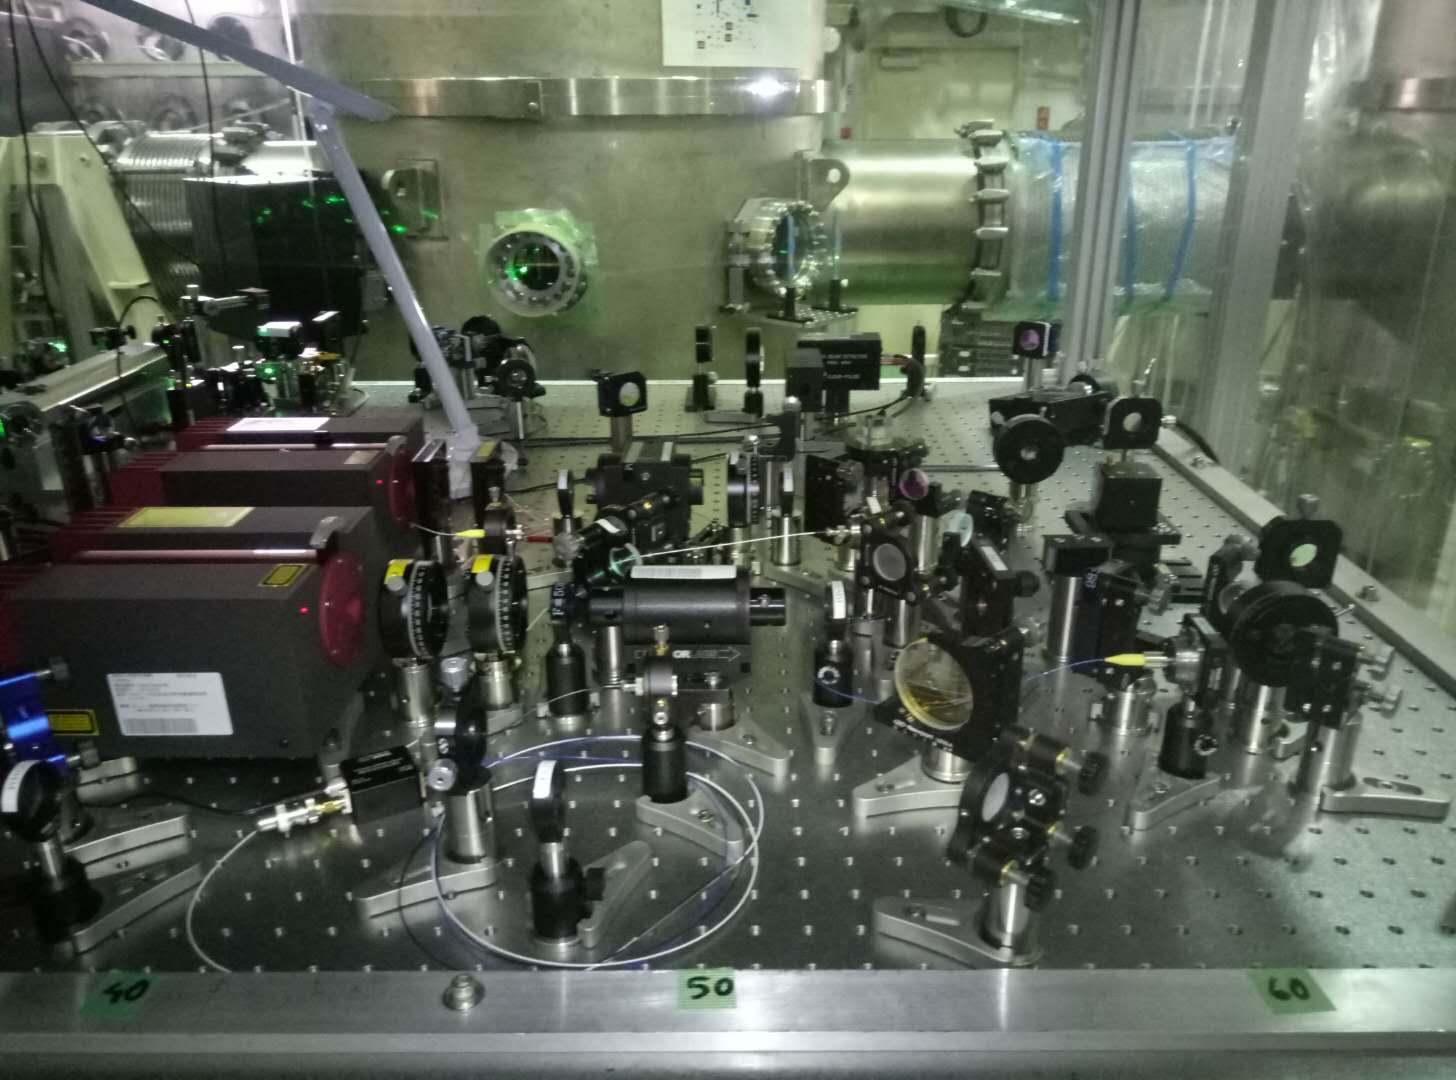
After realize the 7mm collimator is more suitable, we replace the 11mm one. Then we finalize the optical layout of PLL. The main task we did is the new telescope design and fiber alignment.
The new telescope is shown in attached picture. However, the actual case is a little bit different because of the Faraday influence of optical length. But we made sure the beam is very collimated with a size of 2mm in diameter.
For the fiber coupling, we develop a procedure. We assume you have already a coupled fiber.
1. Put the output of this already coupled fiber to collimator. Now, you have both light going in and back through this collimator. Then use the steering mirror to make them overlap. Always make sure the light is a good round shape after you take off the fiber from collimator.
2. Put the multimode fiber to do pre-alignment. If you did very well the first step, you will have a very large coupling directly after you put multimode fiber. Then use steering mirror to align until get 100% coupling. If you cannot, remember to check the shape after collimator is round.
3. Put the single mode fiber. If you did step 2 as we suggest, you will have very good coupling now even for this single mode fiber. Then just use the steering mirror to do standard alignment. You will get a good coupling result.(we got 70 percent)
According to this procedure, we coupled the fiber for the second main laser pick off and AUX 2 laser(p pol). We got 70% coupling for both of them.
The final layout is attached as picture two.
Participant: Yuhang and Eleonora
Green power measurement
| before EOM | after EOM | before AOM | before PR | before MZ |
| 74mW | 71mW | 13.7mW | 8.8mW | 33.6mW |
Infrared power mesurement
| before PR | after pick off | before pick off |
| 9.4mW | 10.6mW | 17mW |
After rearange the control devices, we recover the green and infrared lock.
| FC green transmission | FC infrared transmission |
| 1.3V | 1.6V |
To transfer data from the Yokogawa SA2400, the only way is through the GPIB port. (otherwise, there is an oldfashioned paper plotter)
So, I wrote a labview program to read the spectra and save it on a file, based on a library I found here: http://sine.ni.com/apps/utf8/niid_web_display.download_page?p_id_guid=E3B19B3E936A659CE034080020E74861
The list of commands for the GPIB is in the (in Japanese sory...) manual I uploaded to the wiki: http://gwpo.nao.ac.jp:8989/wiki/Documents?action=AttachFile&do=view&target=SA2400+GP-IB+manual.pdf
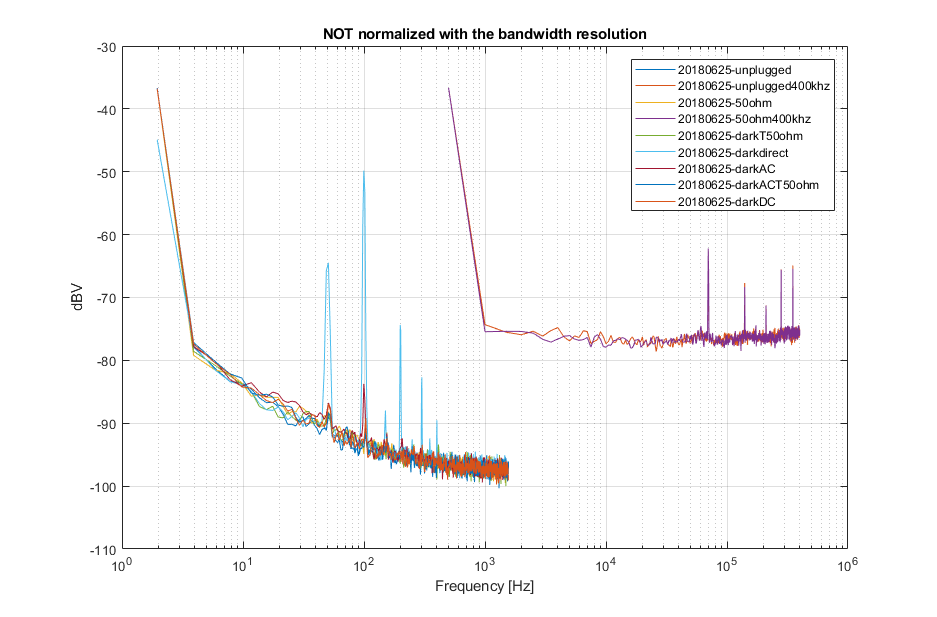
I did some spectrum acquisitions of the photodiode signal. Average number 64. in several conditions.
Plot 1. spectrum in dbV (not normalized per rtHz)
20180625-unplugged (noise without anything connected)
20180625-unplugged400khz
20180625-50ohm (noise with the 50ohm terminator
20180625-50ohm400khz
20180625-darkT50ohm (PD dark noise with a T and 50ohm terminator)
20180625-darkdirect (PD dark noise
20180625-darkAC (PD dark noise after the high pass filter box)
20180625-darkACT50ohm (PD dark noise after the high pass filter box with a T and 50ohm terminator)
20180625-darkDC (PD dark noise after the high pass filter box)
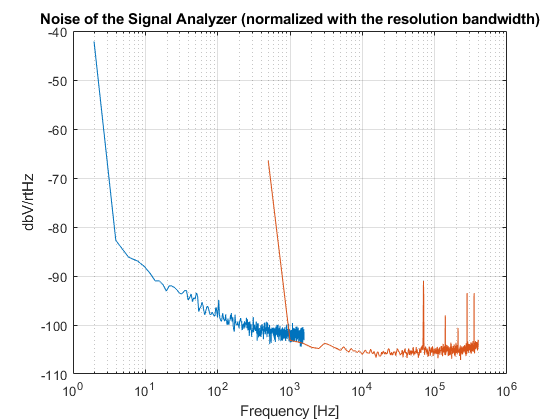
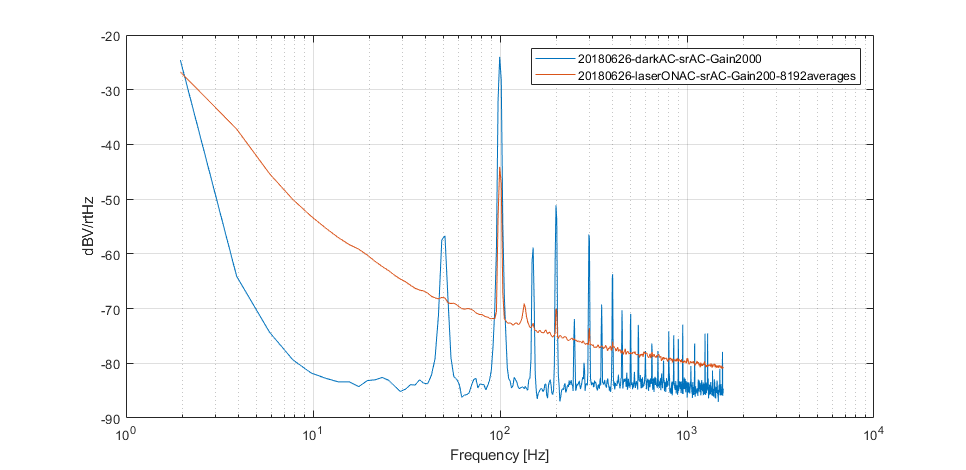
Plot 2. spectrum in dbV/rtHz ( normalized per rtHz)
noise floor
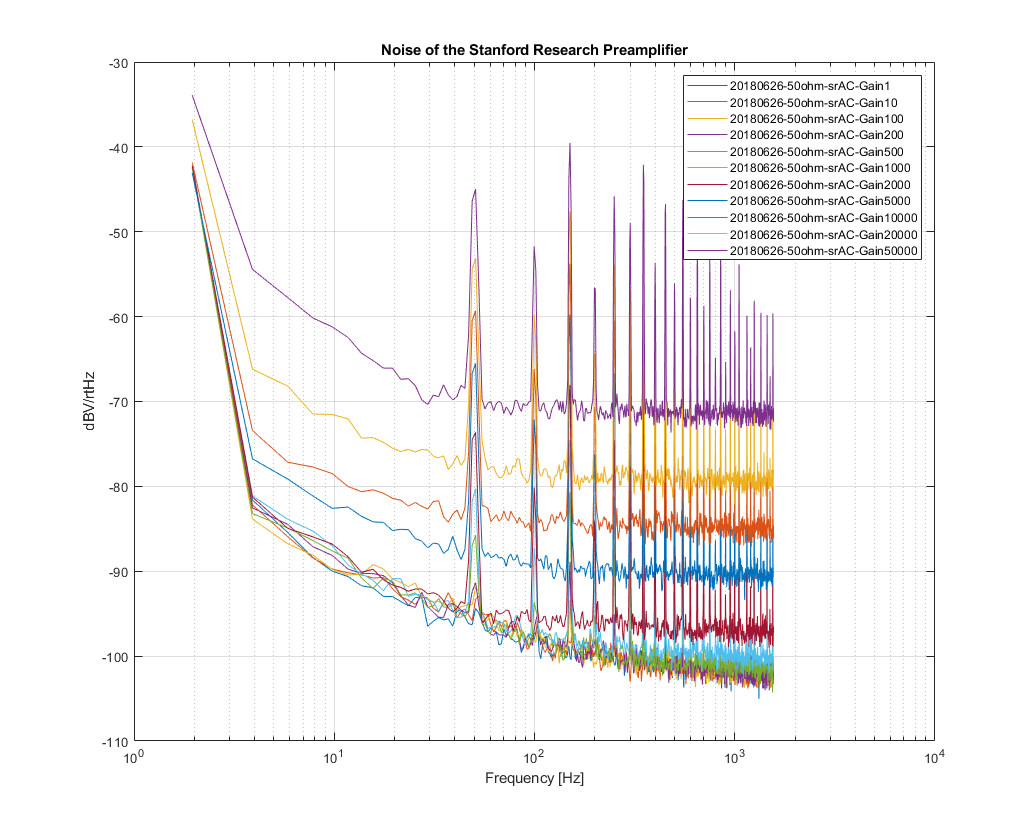
Plot 3. 50ohm terminator as input of the SR560. Icreased the gain of the preamplifier to check where is the noise floor of the SR560.
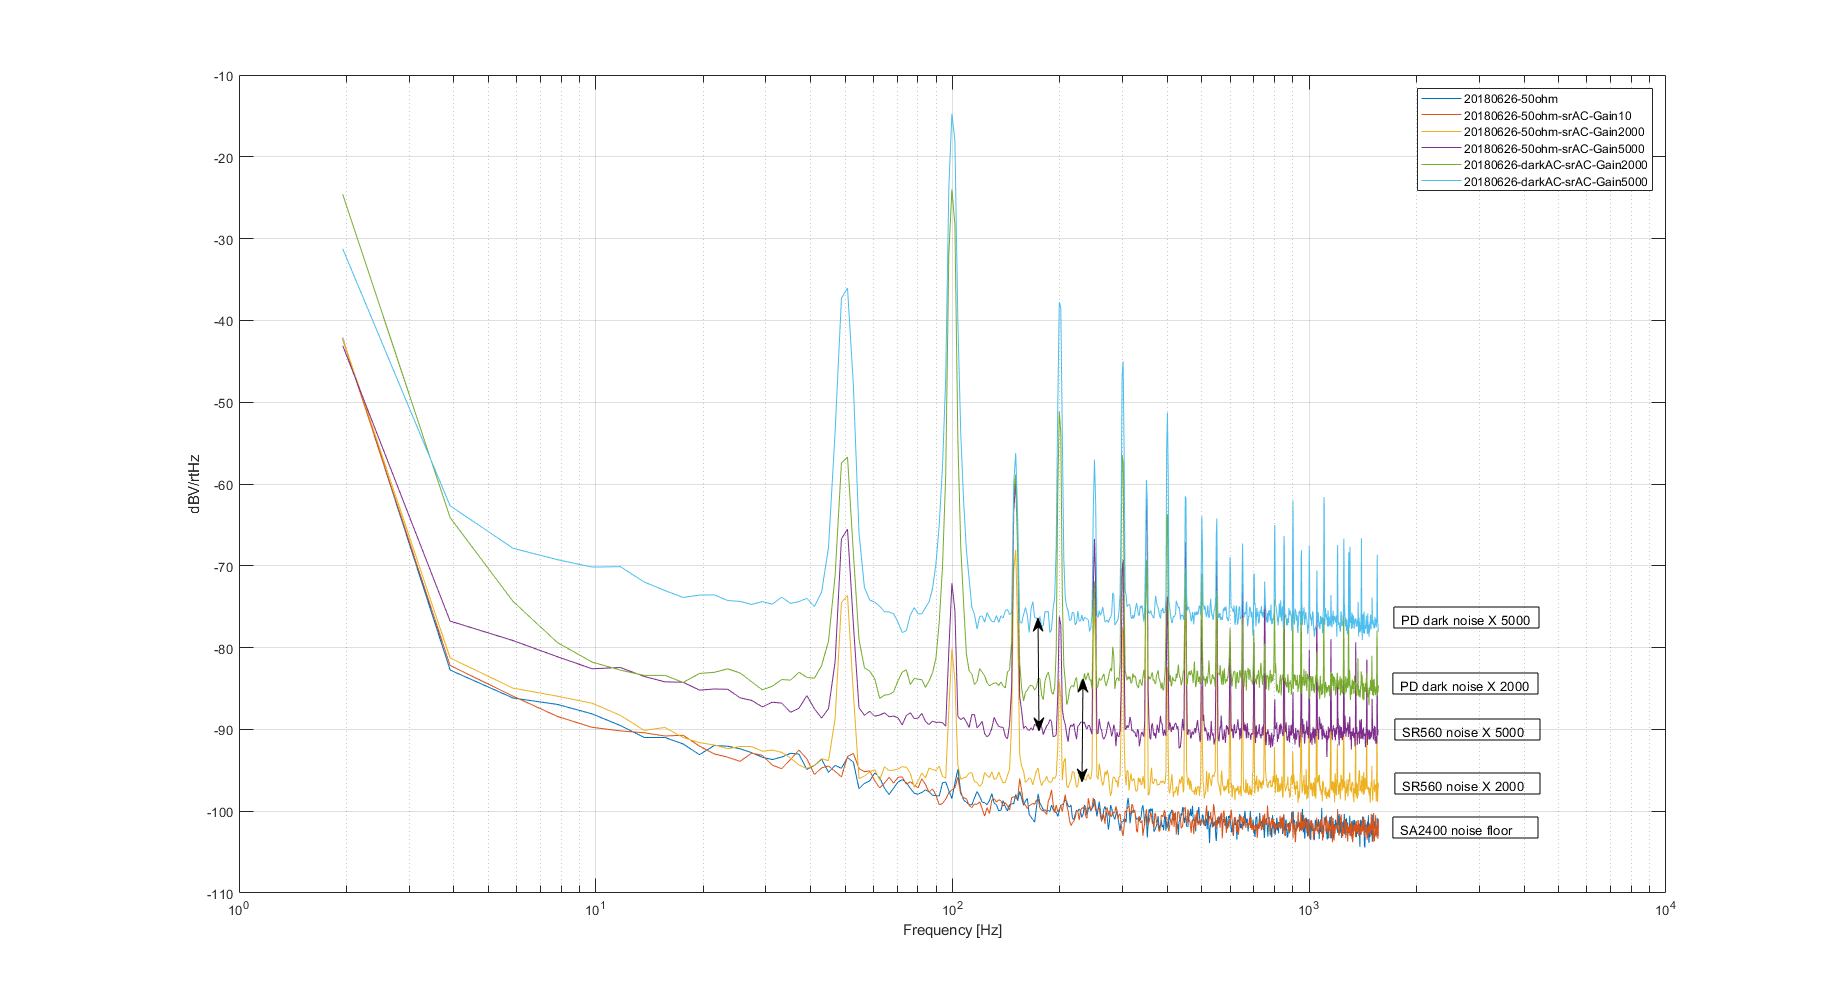
Plot 4. Comparison of the noise floors of SR560 and PD dark noise
Plot 5. Laser on / off
to be compared with the noise on the HeNe PD
On the other hand there is a strange "large" peak in the middle of the FSR. Where is that coming from? Is there a polarization problem? In the entry it is written that the polarization is OK.
Question: did somebody already check that the input and output mirrors are mounted with the HR side facing the inside of the cavity?
Partecipants: Marco, Eleonora , Yuhang
We match the light of the ML into the fiber.
Input power: 3mW
Matched power: 0.71*2mW
Fiber matching: 47%
After that we control the matching of the AUX2 fiber:
Input power: 3.5mW
Matched power: 1.25*2mW
Fiber matching: 71%
Voltage level on photodiode:
ML: 7.8V
AUX1: 5.2V
Total: 2.6V
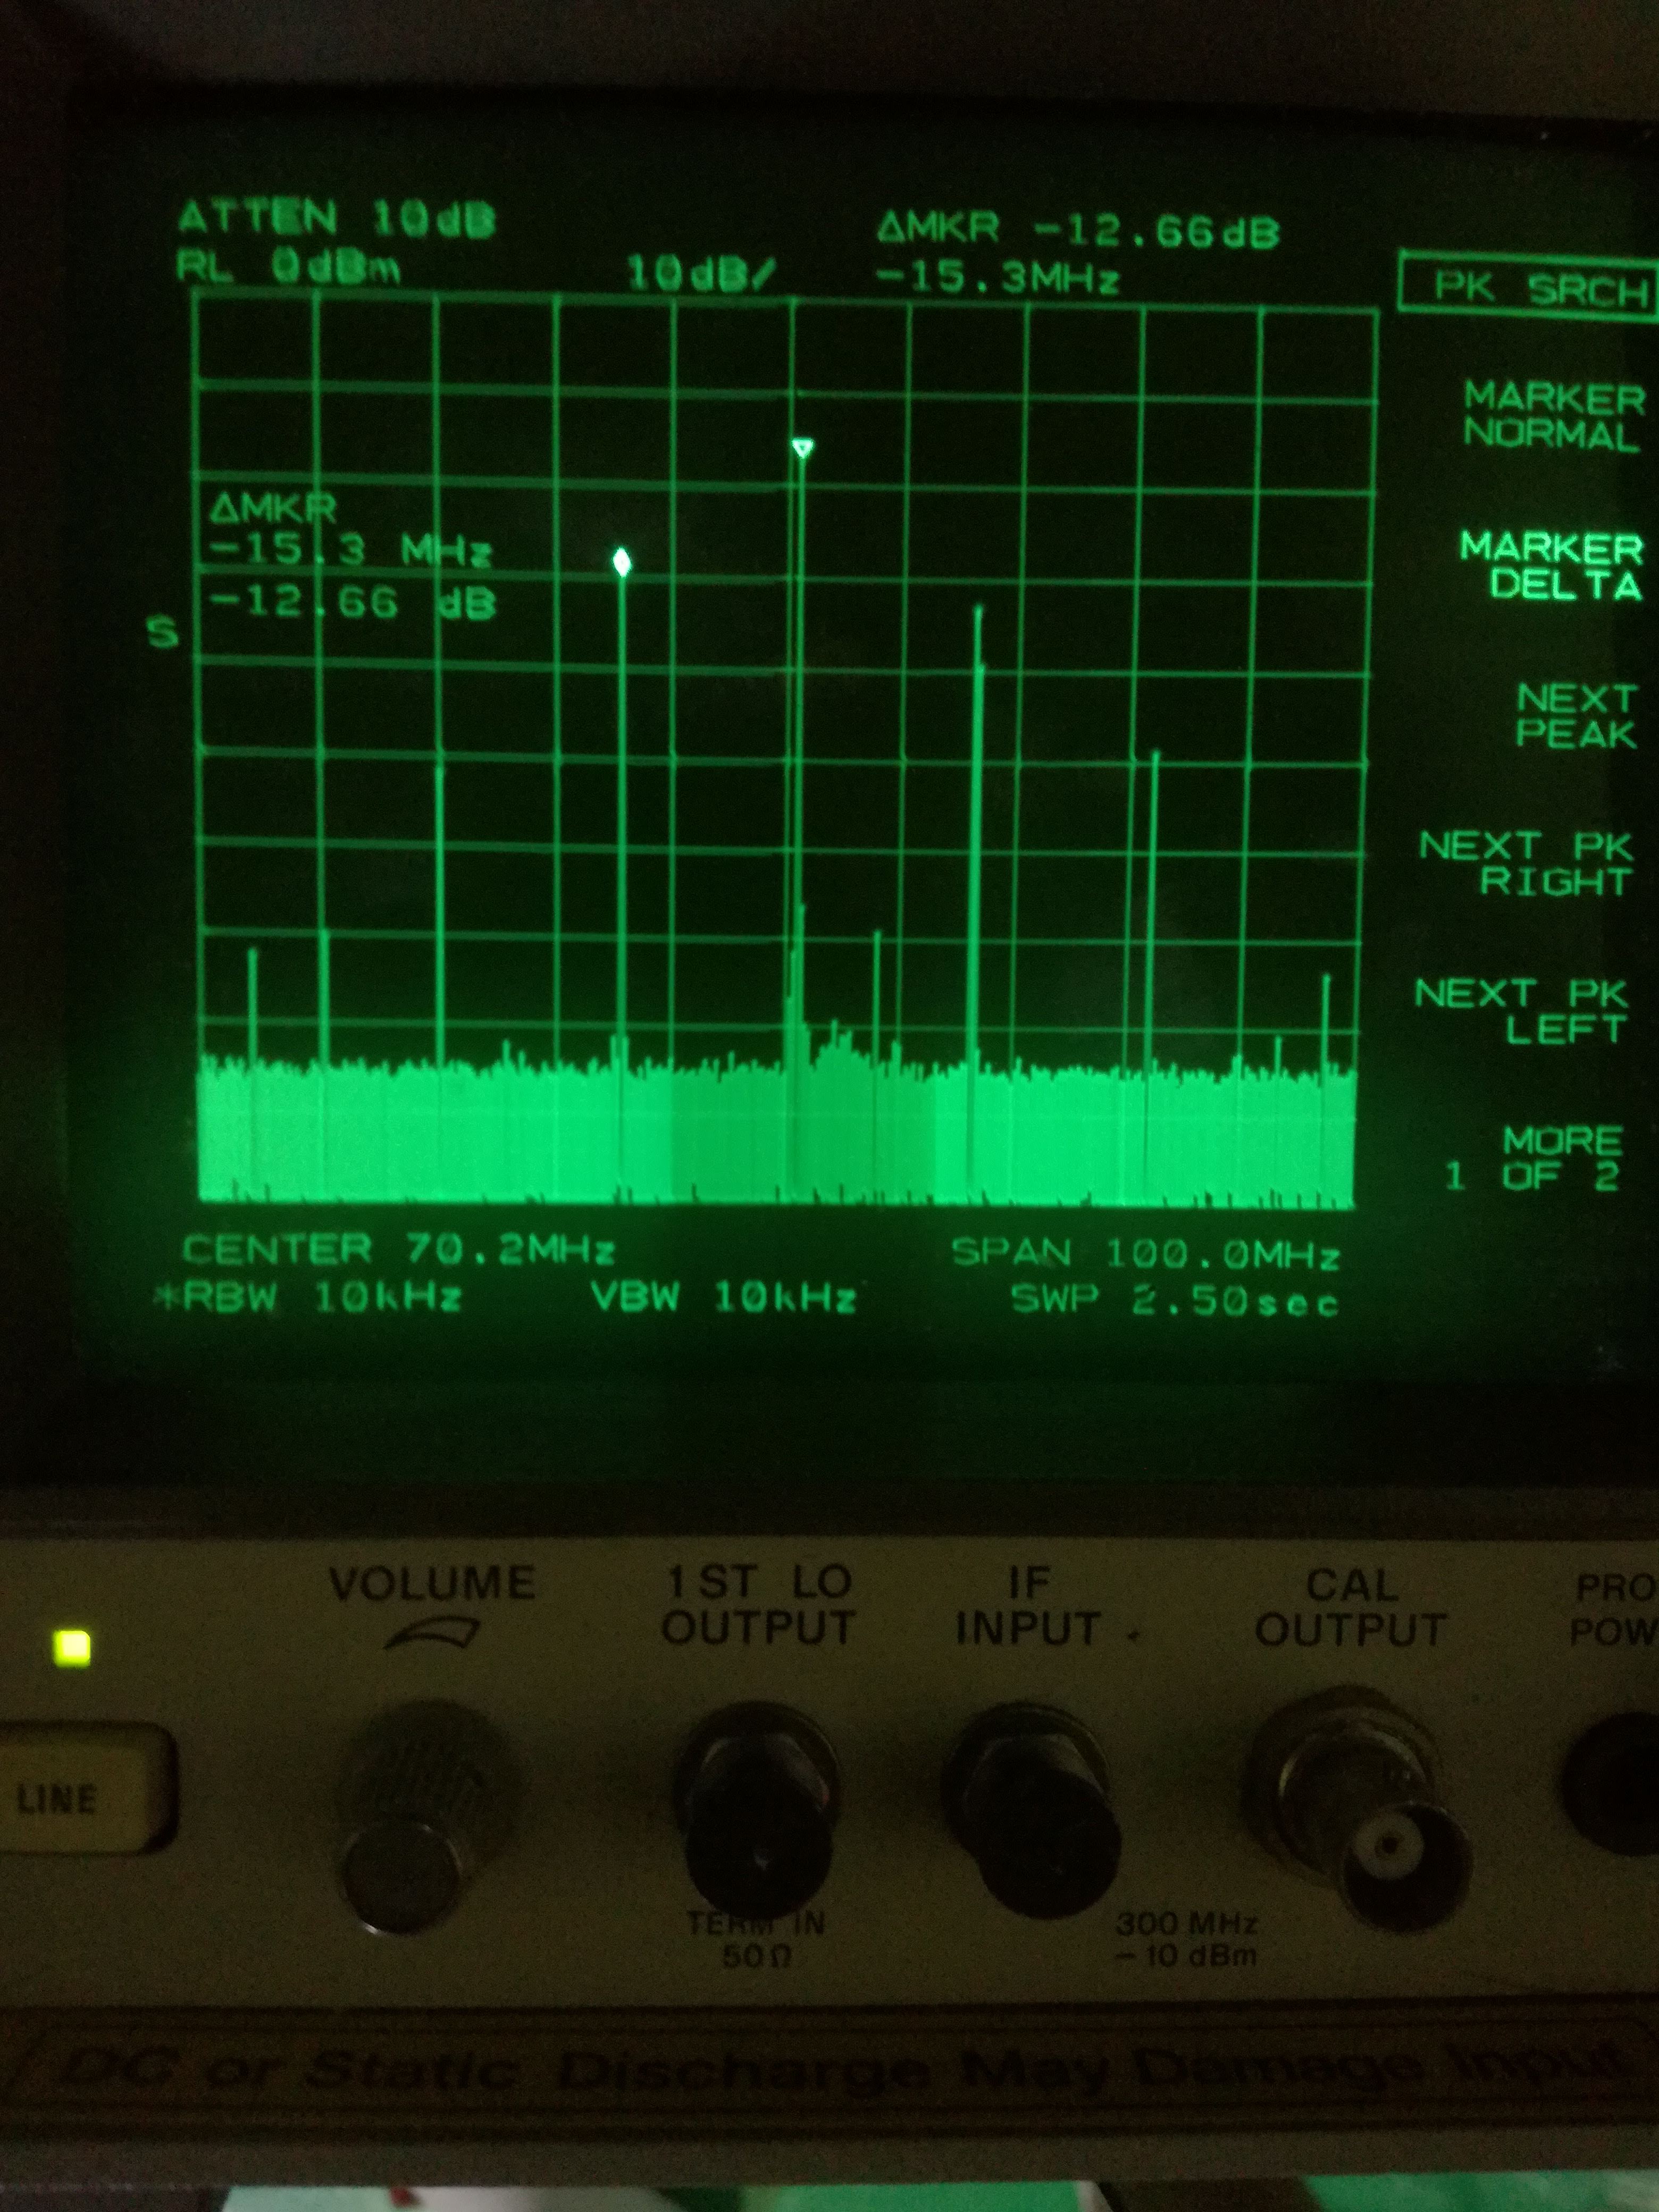
We found the beat note between the two lasers and we measure the following levels:
| Beat note | Amplified signal | 90% signal | 10 % signal | |
| Carrier | -21dBm | -6.33dBm | -7.67 dBm | -17.60 dBm |
| Sideband 1° order | -33.8dBm | -17.67dBm | -18.33dBm | -29.43 dBm |
| Sideband 2° order | -54dBm | -38.17dBm | -38.67dBm | -49.77 dBm |
| Sideband 3° order | not visible | -65.33dBm | -61.50dBm | not visible |
The AUX1 laser temperature was set at 30.67 °C, at the spectrum analyzer we see both the beat note and the lateral sidebands due to EOM modulation.
The minimum level required for the beat note to lock the PLL is -16 dBm, thus the amplitude of the carrier is enough to perform the PLL locking. Concerning the sideband to perform the lock on them their level must be incresed at least of 2-3 dBm
[ Yuhang, Matteo, Eleonora]
After locking the Green mode cleaner we measured a trasmissivity below 50% which is much lower than what we expected.
An extremely rough power budget gave us:
P_in = 22 mW
P_tra = 8.5 mW
P_ref = 10.5 mW
P_tra from end mirror = 0.5 mW
Missing = 2.5 mW
We investigated some of the following possibilities:
Mirrors transmissitvity
For a triangular cavity, as our modecleaner, the transmission is given by:
T = (t_in*t_out)/1-r_in *r_out *r_end)^2
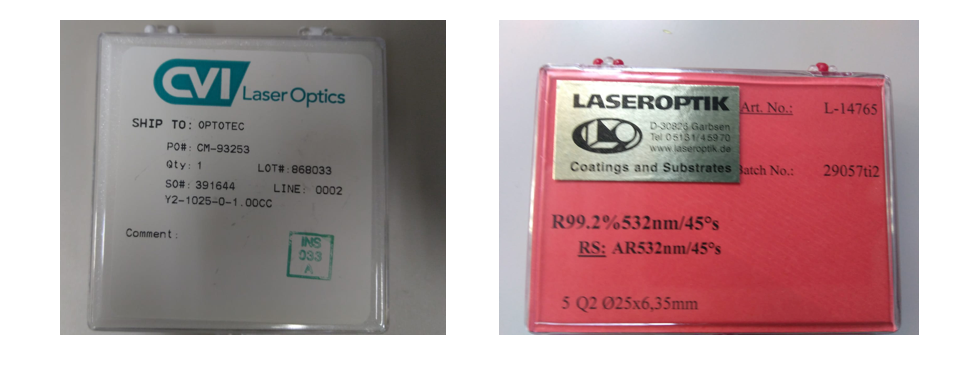
according to the spec for the mirrors used (see pic 1) :
R_in = R_out = 0.992 and R_end > 0.995 (measured from the producer 0.9993)
= > T = 0.92 (taking R_end 0.9993)
Considering an error of +/- 0.003 in all the three nominal transimissivity, the expected cavity trasmissivity is 0.92 +/- 0.33
Matching and alignment
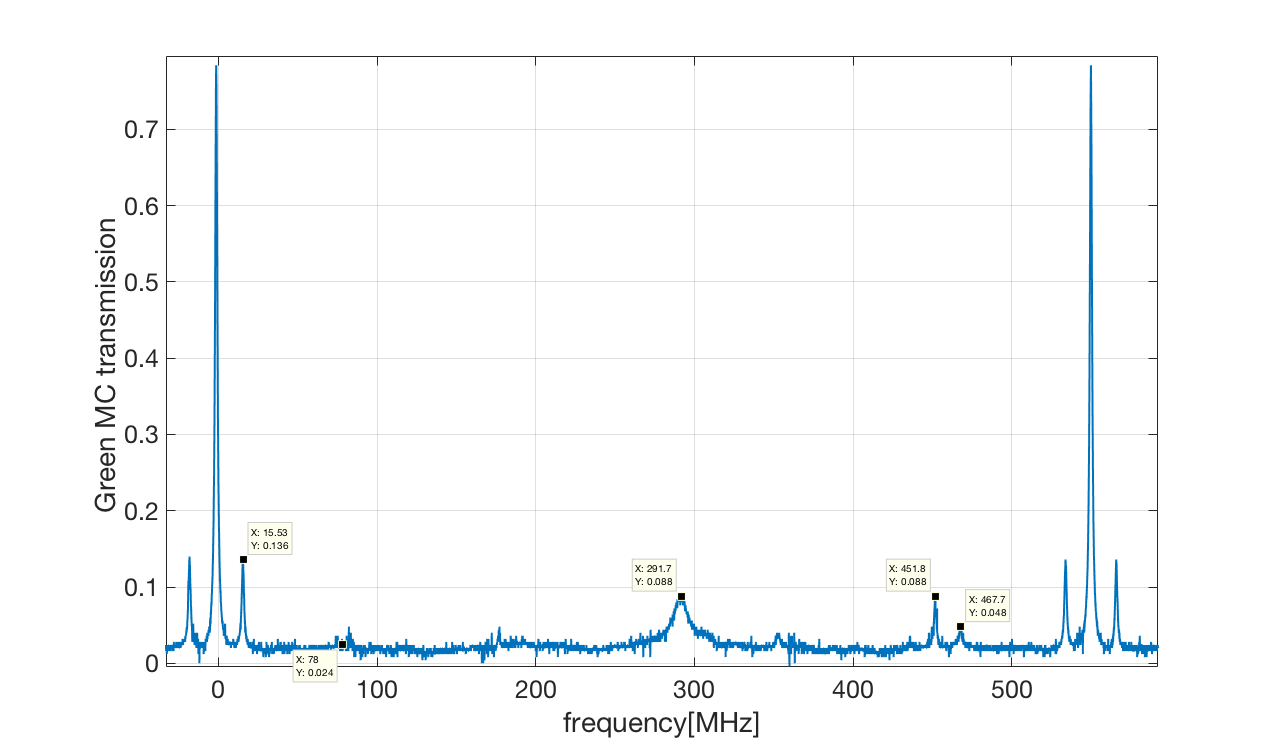
The optical spectrum of the cavity is shown in pic.1. The alignement seems good. The sidebandes at 78 MHz ( used for the lock of the MC) are not visible while we can see the 15.2 MHz modulation that we know to be high.
[ Note that we are sending at the 78 MHz resonant EOM, a driving RF signal with amplitude 1 V pp which should correspond to a modulation depth of 0.185 rad. this means that the expected power in the sidebads is 0.0086]
input beam polarization
Yuhang used a PBS for 532nm and verified that the light is almost all in s-pol, as it should be.
Conclusions: The origin of the low MC transmissivity is not clear but the most probable hypotesis, among those considered, is that the effective transmission of the mirrors are a bit different from the nominal ones.
On the other hand there is a strange "large" peak in the middle of the FSR. Where is that coming from? Is there a polarization problem? In the entry it is written that the polarization is OK.
Question: did somebody already check that the input and output mirrors are mounted with the HR side facing the inside of the cavity?
I checked the input and output mirror. From the point view of marker on the side of mirror, I am sure the mirror is installed in a correct way.
I checked also the mirror from the same box, this arrow points to the HF side of this mirror.
Are the values given above now confirmed?
P_in = 22 mW
P_tra = 8.5 mW
P_ref = 10.5 mW
P_tra from end mirror = 0.5 mW
Missing = 2.5 mW
Are the 2.5 mW still missing?
Partecipants: Marco, Matteo
In addition to the ADF4002 phase frequency detector evaluation board we design an external board to perform both the fast loop that acts on the Laser PZT and the slow loop that acts on the Laser PLT.
Description of the external circuit
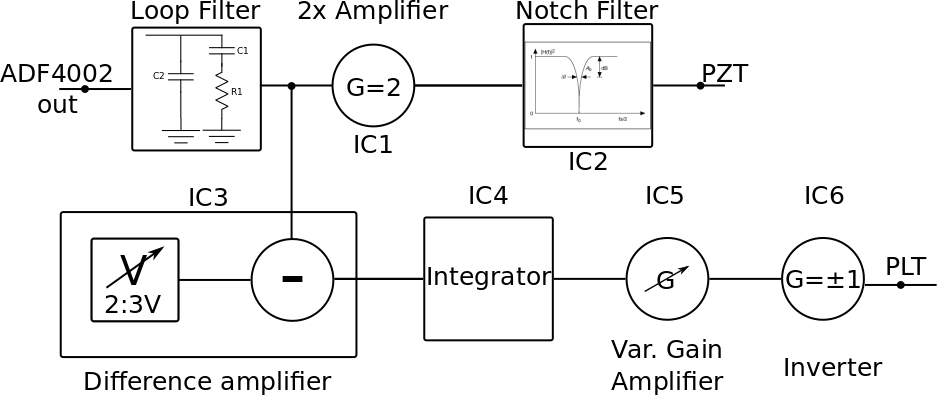
Attached: Fig 'boardblockscheme.png' shows the block scheme of the board and Fig '8.pdf' is the board electrical scheme.
The board mounts the loop filter (see entry 837 ) and 6 Op-Amps:
Loop Filter
C1 = 33nF, C2=680nF, R=27 Ω
Fast loop (PZT) input loop filer output
- IC1 is a 2x non-inverting amplifier (with the aim to amplify the correction signal from 0-5V to 0-10V)
- IC2 is an active notch filter with center frequency 270kHz. Fig 'pllnotchcharacterzation.pdf' represents the notch filter magnitude transfer function.
Slow loop (PLT) input loop filter outout
- IC3 is a difference amplifier in order to center arond zero V the loop filter output. The 2.5V offset can be tuned from 2V to 3V acting on a trimmer,
- IC4 is an integrator with a zero around 2Hz
- IC5 is a variable gain non iverting amplifier (gain from 1/2 to 1/5000)
- IC6 is an inverter to change the slow loop sign
Loop performances
We lock both the loop on PLT and PZT and measure the loop performances. The PLL servo loop was closed acting on AUX2 laser as slave laser.
Concerning the long term stability the PLL remains locked between Friday evening and Monday morning.
Concerning the loop phase noise I measured the PLL output phase noise between 100Hz and 102.k kHz with different charge pump gain. The used gain, the rms phase noise and the approximative loop bandwidth are reported in the following table:
| CP Gain [mA] | r.m.s phase noise [mrad] | Approx. loop bandwidth [kHz] |
| 1.875 | 8.67 | 30 |
| 2.5 | 7.78 | 36 |
| 3.125 | 6.56 | 38 |
| 3.75 | 5.13 | 43 |
| 4.375 | 4.53 | 49 |
| 5 | 3.96 | 53 |
Fig. 'phasenoisevsgain.pdf' shows the ouptput phase noise in the different configurations of the table above.
Fig 'phaenoisecp5mA.pdf' shows the phase noise and its cumulative rms value of the final configuration CP Gain = 5mA.

Considering the space we have, we designed the telescope for main laser pick off.
Participant: Eleonora and Yuhang.
For the locking of main laser with two auxiliary lasers, we need to use part of mian laser.
So we used a 70:30 BS, which is now put after the first BS 25cm. The transmission is 21mW and reflection is 11mW. After put it, we aligned the two steering mirrors so that we can have infrared beam aligned in the filter cavity.
After locking the filter cavity, we can have infrared transmission as 900mV.
The sequence is like this: 1. Mach-Zehnder 2. green mode cleaner 3. OPO
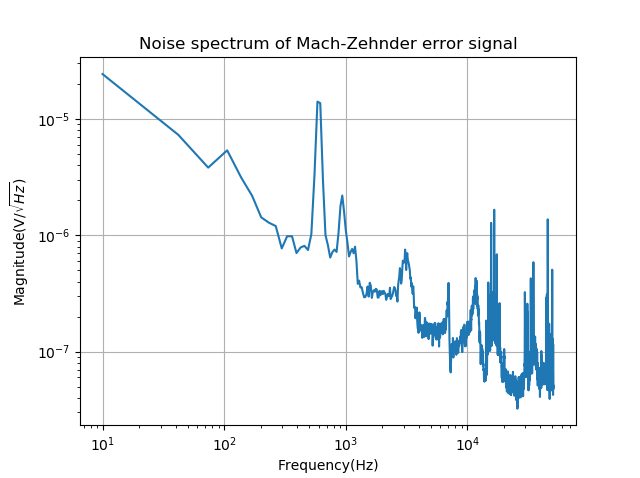
For the purpose of offering a stable light for OPO, we decided to use the transmission of mode cleaner as a feedback signal. Then take this signal to Mach-Zehnder to control MZ's PZT.
We put a beam splitter to get this feedback signal. The transmission is used for feedback. The reflection is used for OPO. The ratio between them is 99.2:0.8 (reflection:7.7mW and transmission:67uW)
The signal we get from transmiaaion photo detector is around 20mV(read from oscilloscope).
The procedure I did:
Firstly, I use SR560 lock green mode cleaner.
Secondly, I make sure the loop for MZ is fine.(check signal is going to control board, move the offset to make error signal close to zero, turn on lock switch, turn on intergrator)
Thirdly, I moved the offset of MZ control, I could see the mode cleaner transmission changed with my adjust.
The noise spectrum is attached.
However, the duration of lock is not good. I tried only once. It is around 10minutes.
Characterization of the minicircuits ZFRSC-4-842-S+ (one to four splitter)
The characterization frequency is 500MHz. (wenzel output)
power splitter Input: 3.07dBm
power splitter output: (1) -4.77dBm (2) -5.10dBm (3) -4.27dBm (4)-4.43dBm
This means we loss around 8dB.
Partecipants: Marco, Eleonora
We repeat the same work reported in the entry 838 but this time we reverted the lasers configuration: AUX1 is the Slave laser and AUX2 is the Master laser of the OPLL.
The circuit scheme is the same used for the other measurement, the selected loop filter was the same of the Config1: C1=680nF R1=27Ω and C2=100nF. The charge pump current was set to 3.75mA and the frequency offset was set to 20MHz.
Picture 'PLL_20MHz.jpg' shows the 20MHz beat note peak once locked. We can see the same structures of the previous configuration.
The phase noise was measured again with the demodulation technique. The mixer calibration factor is measured at 100Hz and is again Vpp=98mV.
The measured phase noise is shown in picture 'pll20mhzpn.pdf' the blue line represents the phase noise of the pll with AUX2 slave laser and the red line represents the phase noise with AUX1 as slave laser.
The rms phase noise between 120 Hz and 102.4kHz is equal to 10.04 mrad.
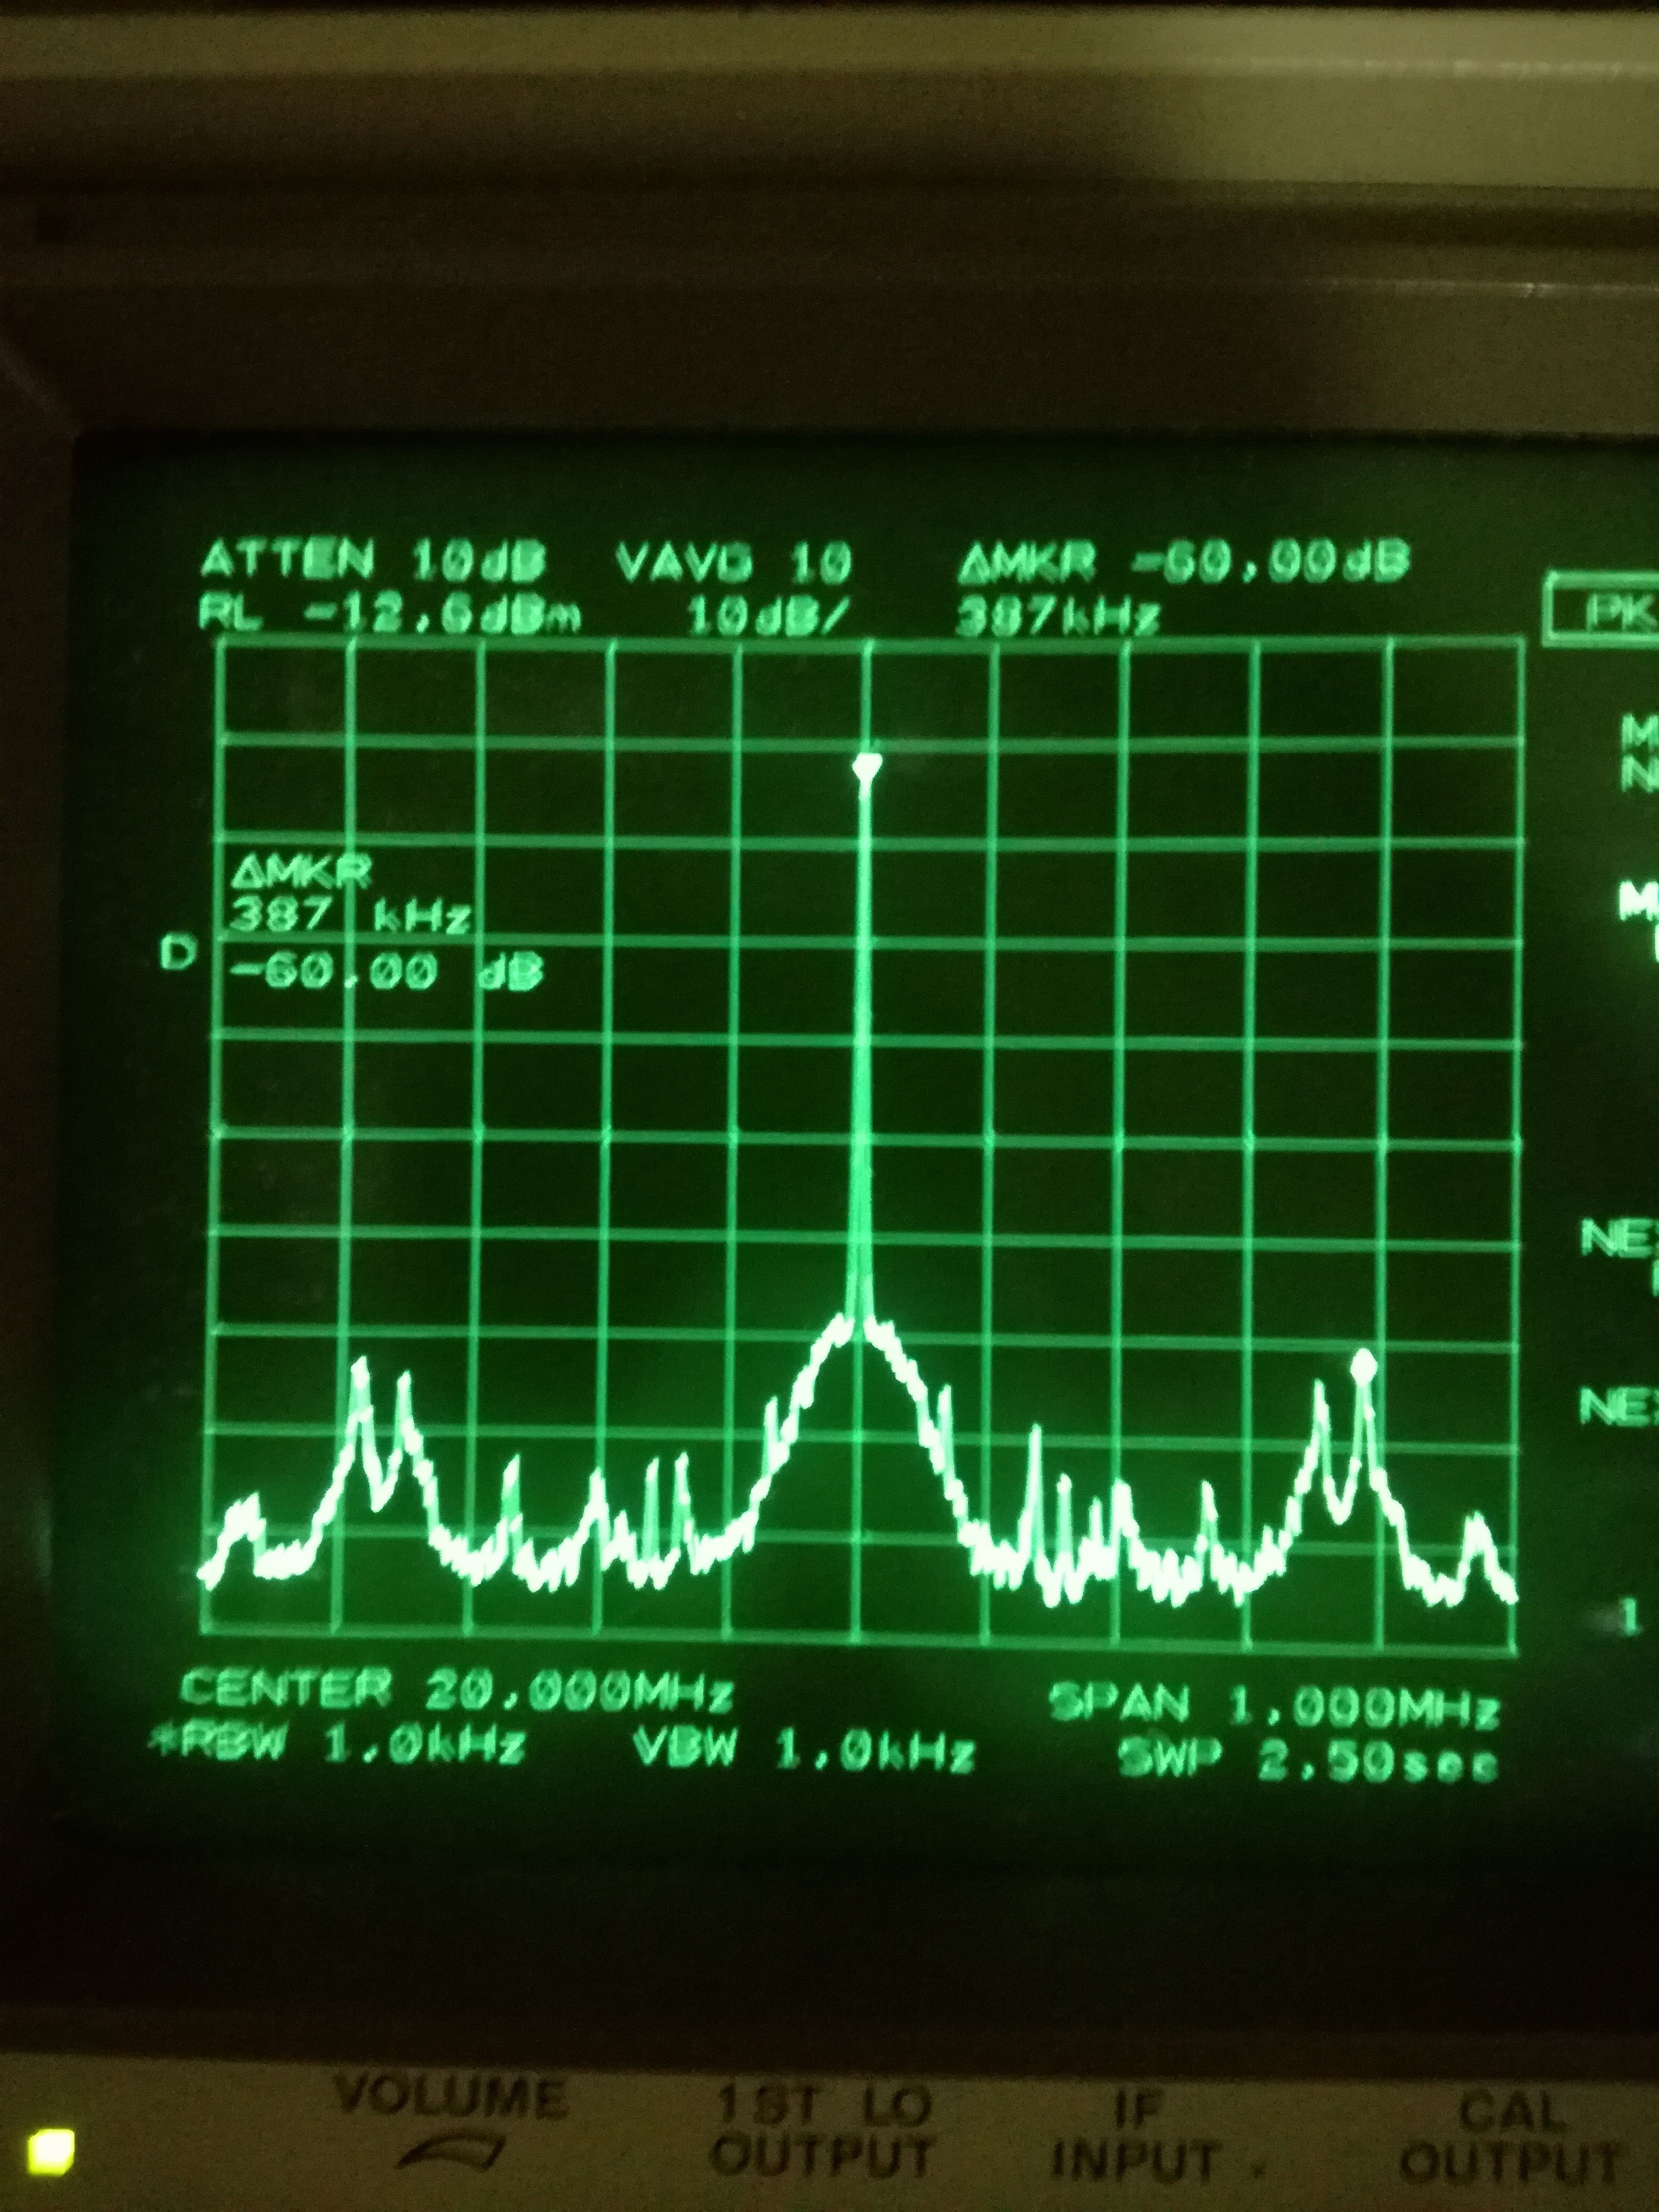
We try to increase the CP gain in order to decrease the phase noise but the first laser PZT resonance was excited (see fig 'pll20mhzaux2res.jpg'). A notch filter centered at f=160kHz will be added in series to the loop filter.
Participants: Marco, Eleonora
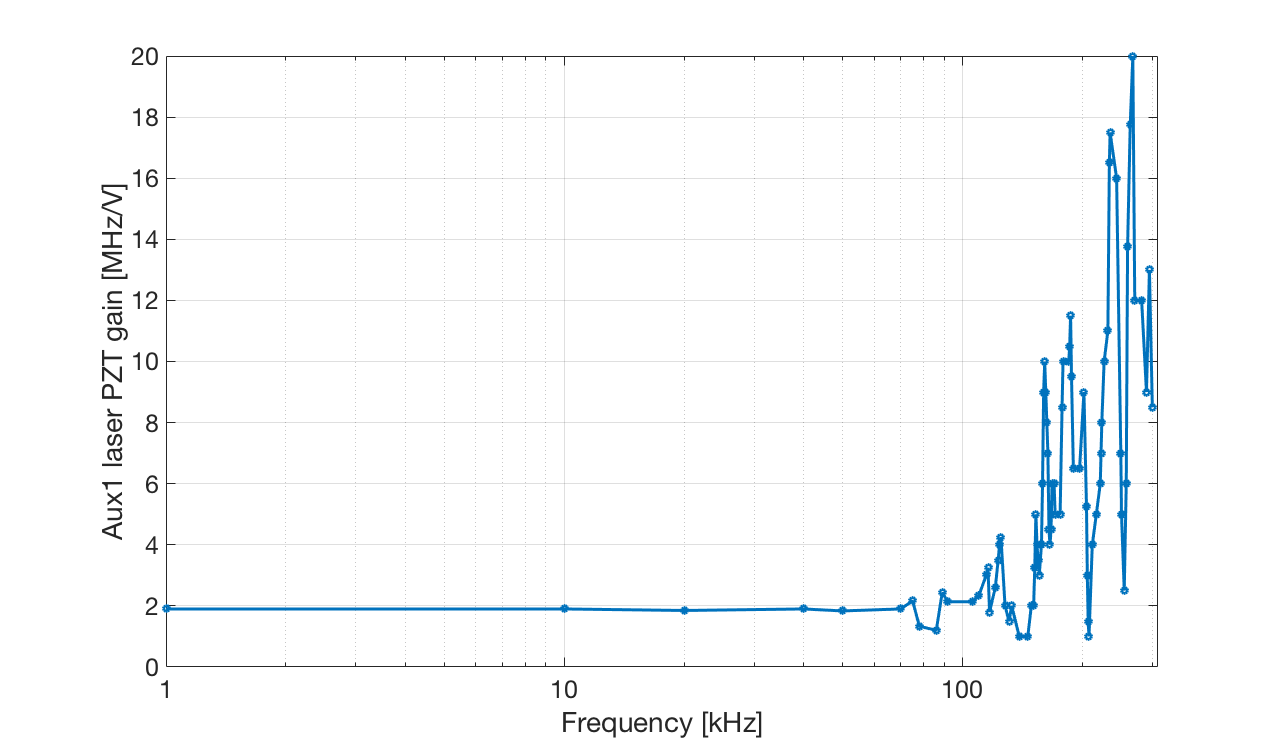
We did the characterization of the AUX1 laser PZT gain with the same procedure reported in entry 830.
The attached plot shows the PZT gain as a function of the frequency from 1 kHz to 300 kHz. A forest of piezo resoances appear above 160 kHz.
Partecipants: Marco, Matteo, Eleonora
Description of the servo loop:
The phase detector was implemented using the ADF4002 chip of Anlog devices.
We start from an ADF4002 evaluation board modified as follows (see pag 13 of Evaluation board manual http://www.analog.com/media/cn/technical-documentation/user-guides/UG-108.pdf):
- a BNC debugging cable was soldered in the position J3
- the output of the charge pump (R1 first pin in the scheme) was connected to an external filter mounting the loop filter and a 2x inverting amplifier see 'pll_scheme.pdf'
| Config 1 | Config 2 | |
| R1 | 27 Ω | 27 Ω |
| C1 | 680 nF | 1 uF |
| C2 | 100 nF | 100 nF |
| C3 | n.c. | n.c |
| R2 | 0 Ω | 0 Ω |
| R3 | 10 kΩ | 10 kΩ |
| R4 | 20 kΩ | 20 kΩ |
The evaluation board and the external board are powered with the same power supply with output set ± 12 V.
The output of the external board is connected directly to the PZT controller of the laser and it provides to it a correction signal in the range [0,-10V].
The two input of the pahse detector are the channel 4 of the DDS1 board (-8dBm at 20 MHz) and the beat note between the two lasers detected with the fiber photodiode and amplified by a factor 15 dB. (The amplified signal was splitted with a 90:10 directional coupler, the 90% of the power was sent to the ADF4002 Evaluation board whereas the 10% is used for monitor and diagnostic).
With this setup we locked the beat note between the AUX1 and AUX2 lasers at 20 MHz acting on the AUX2 PZT.
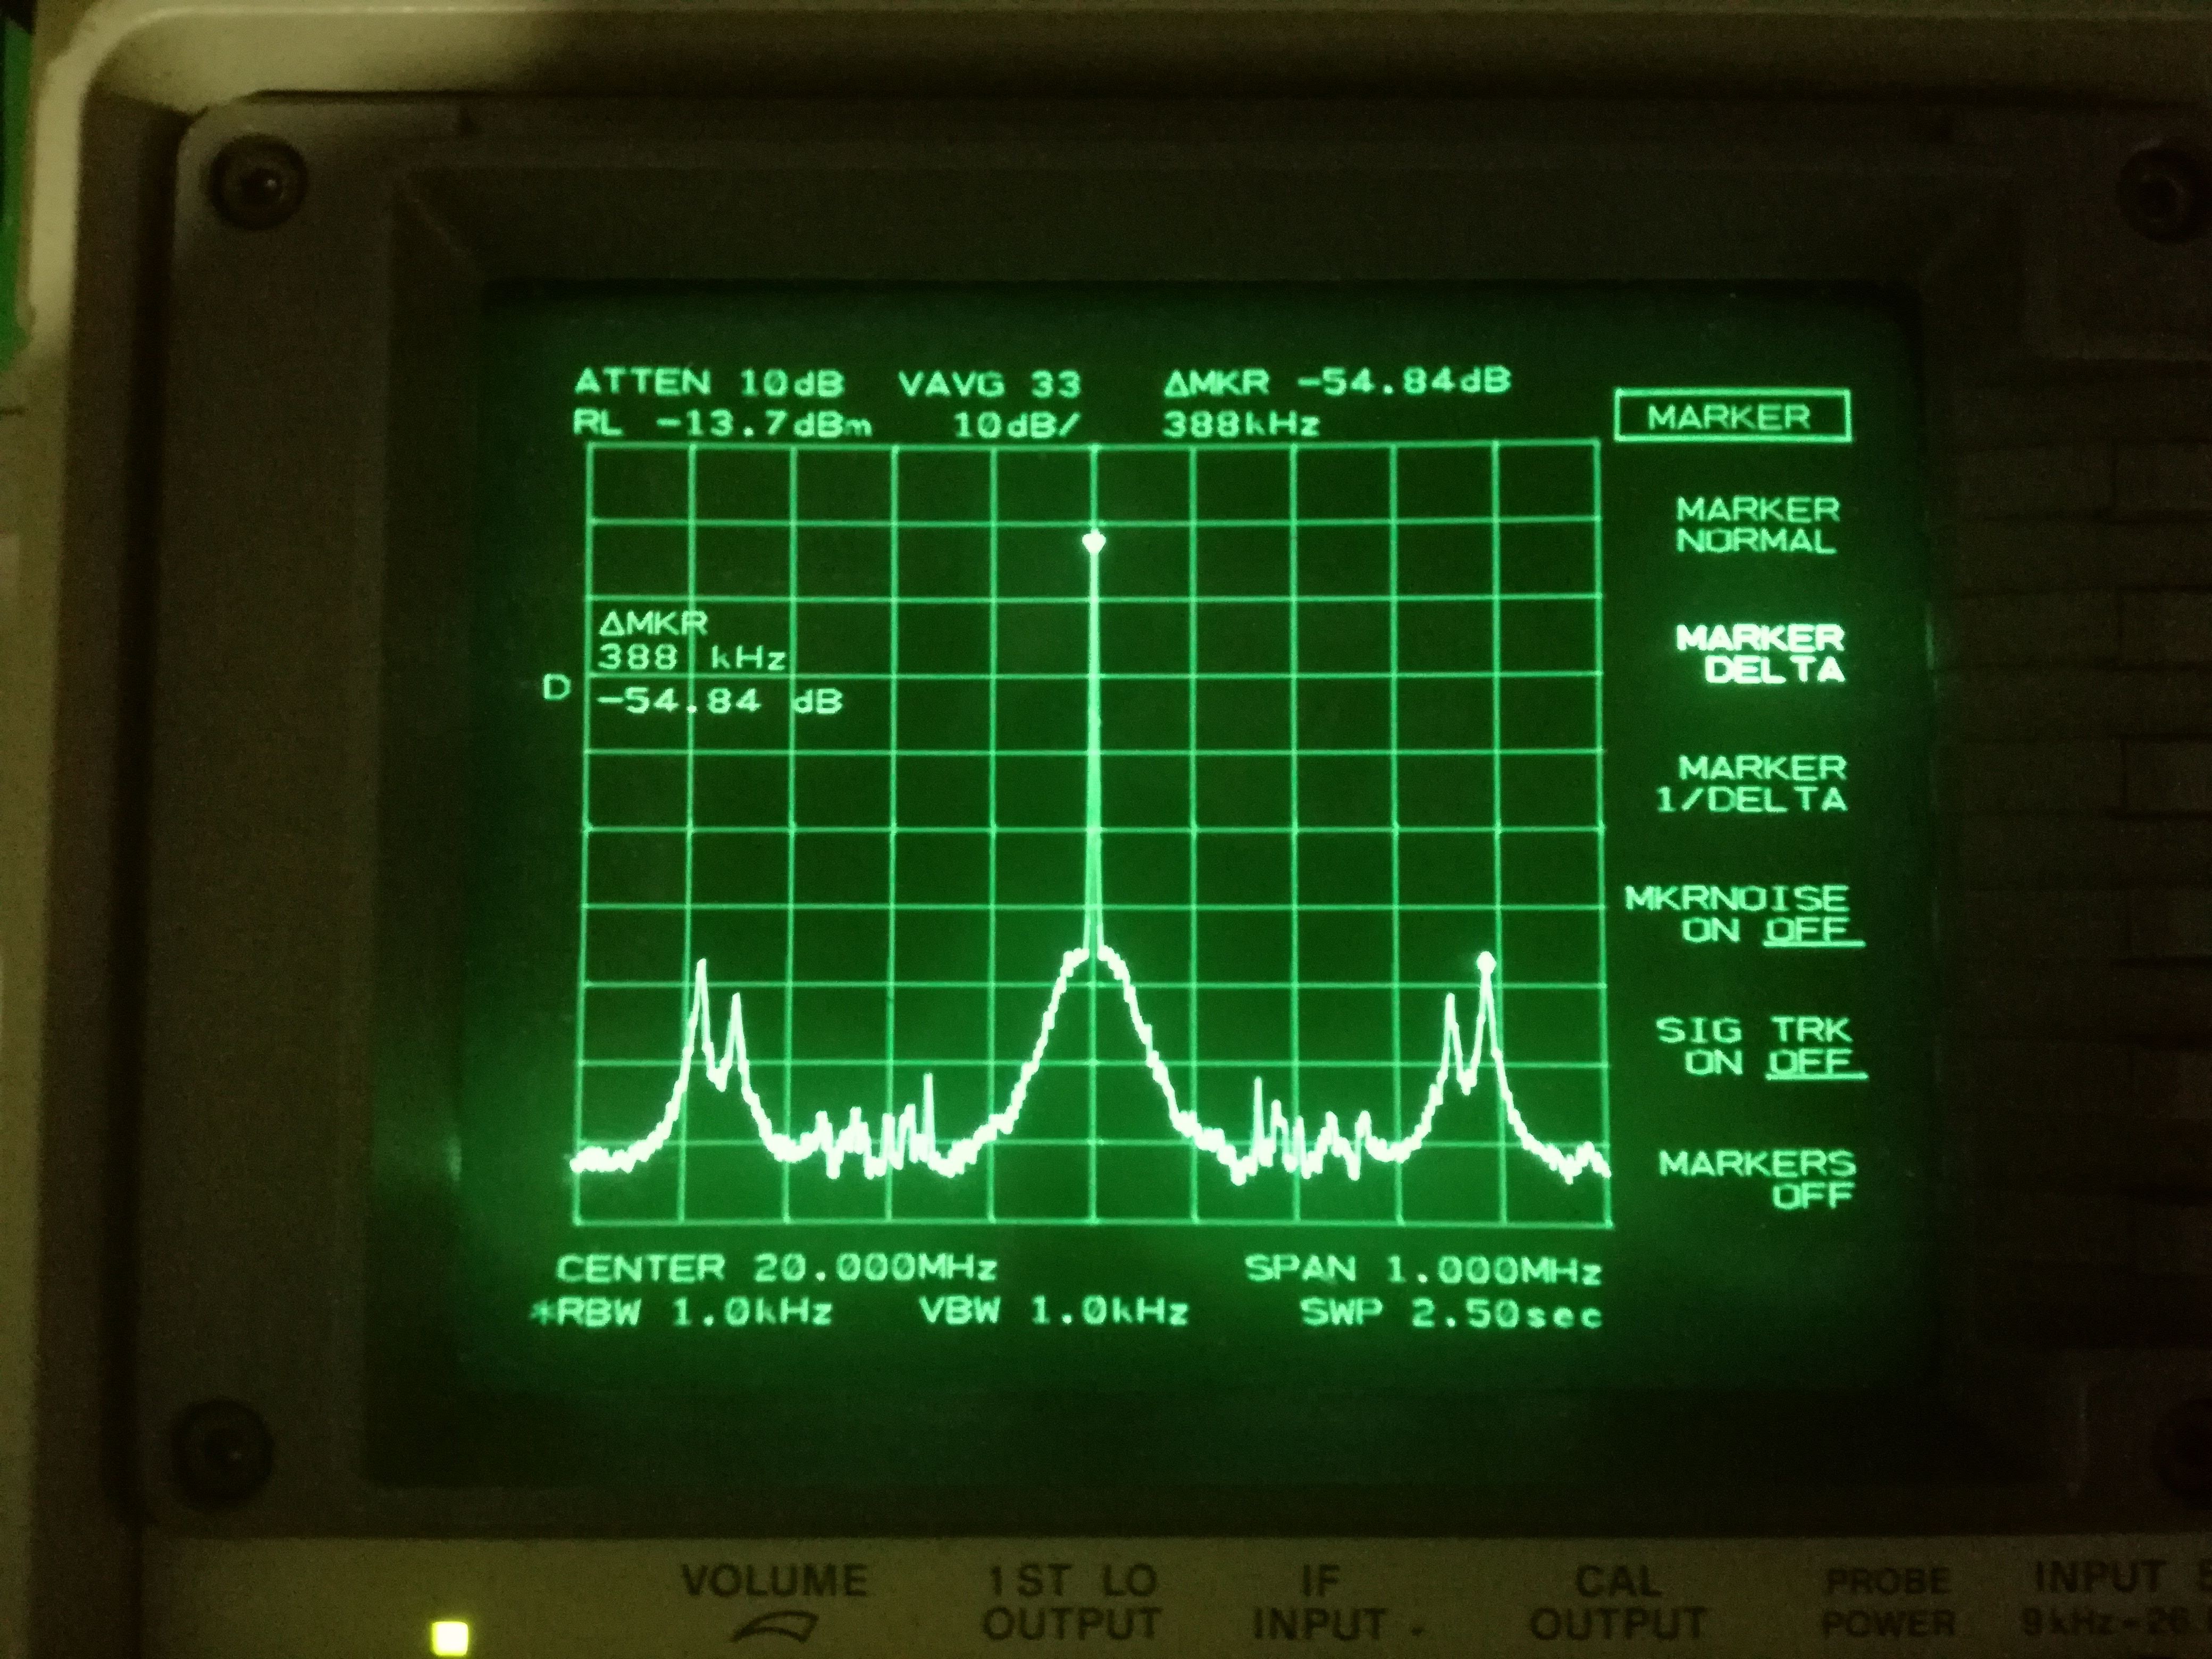
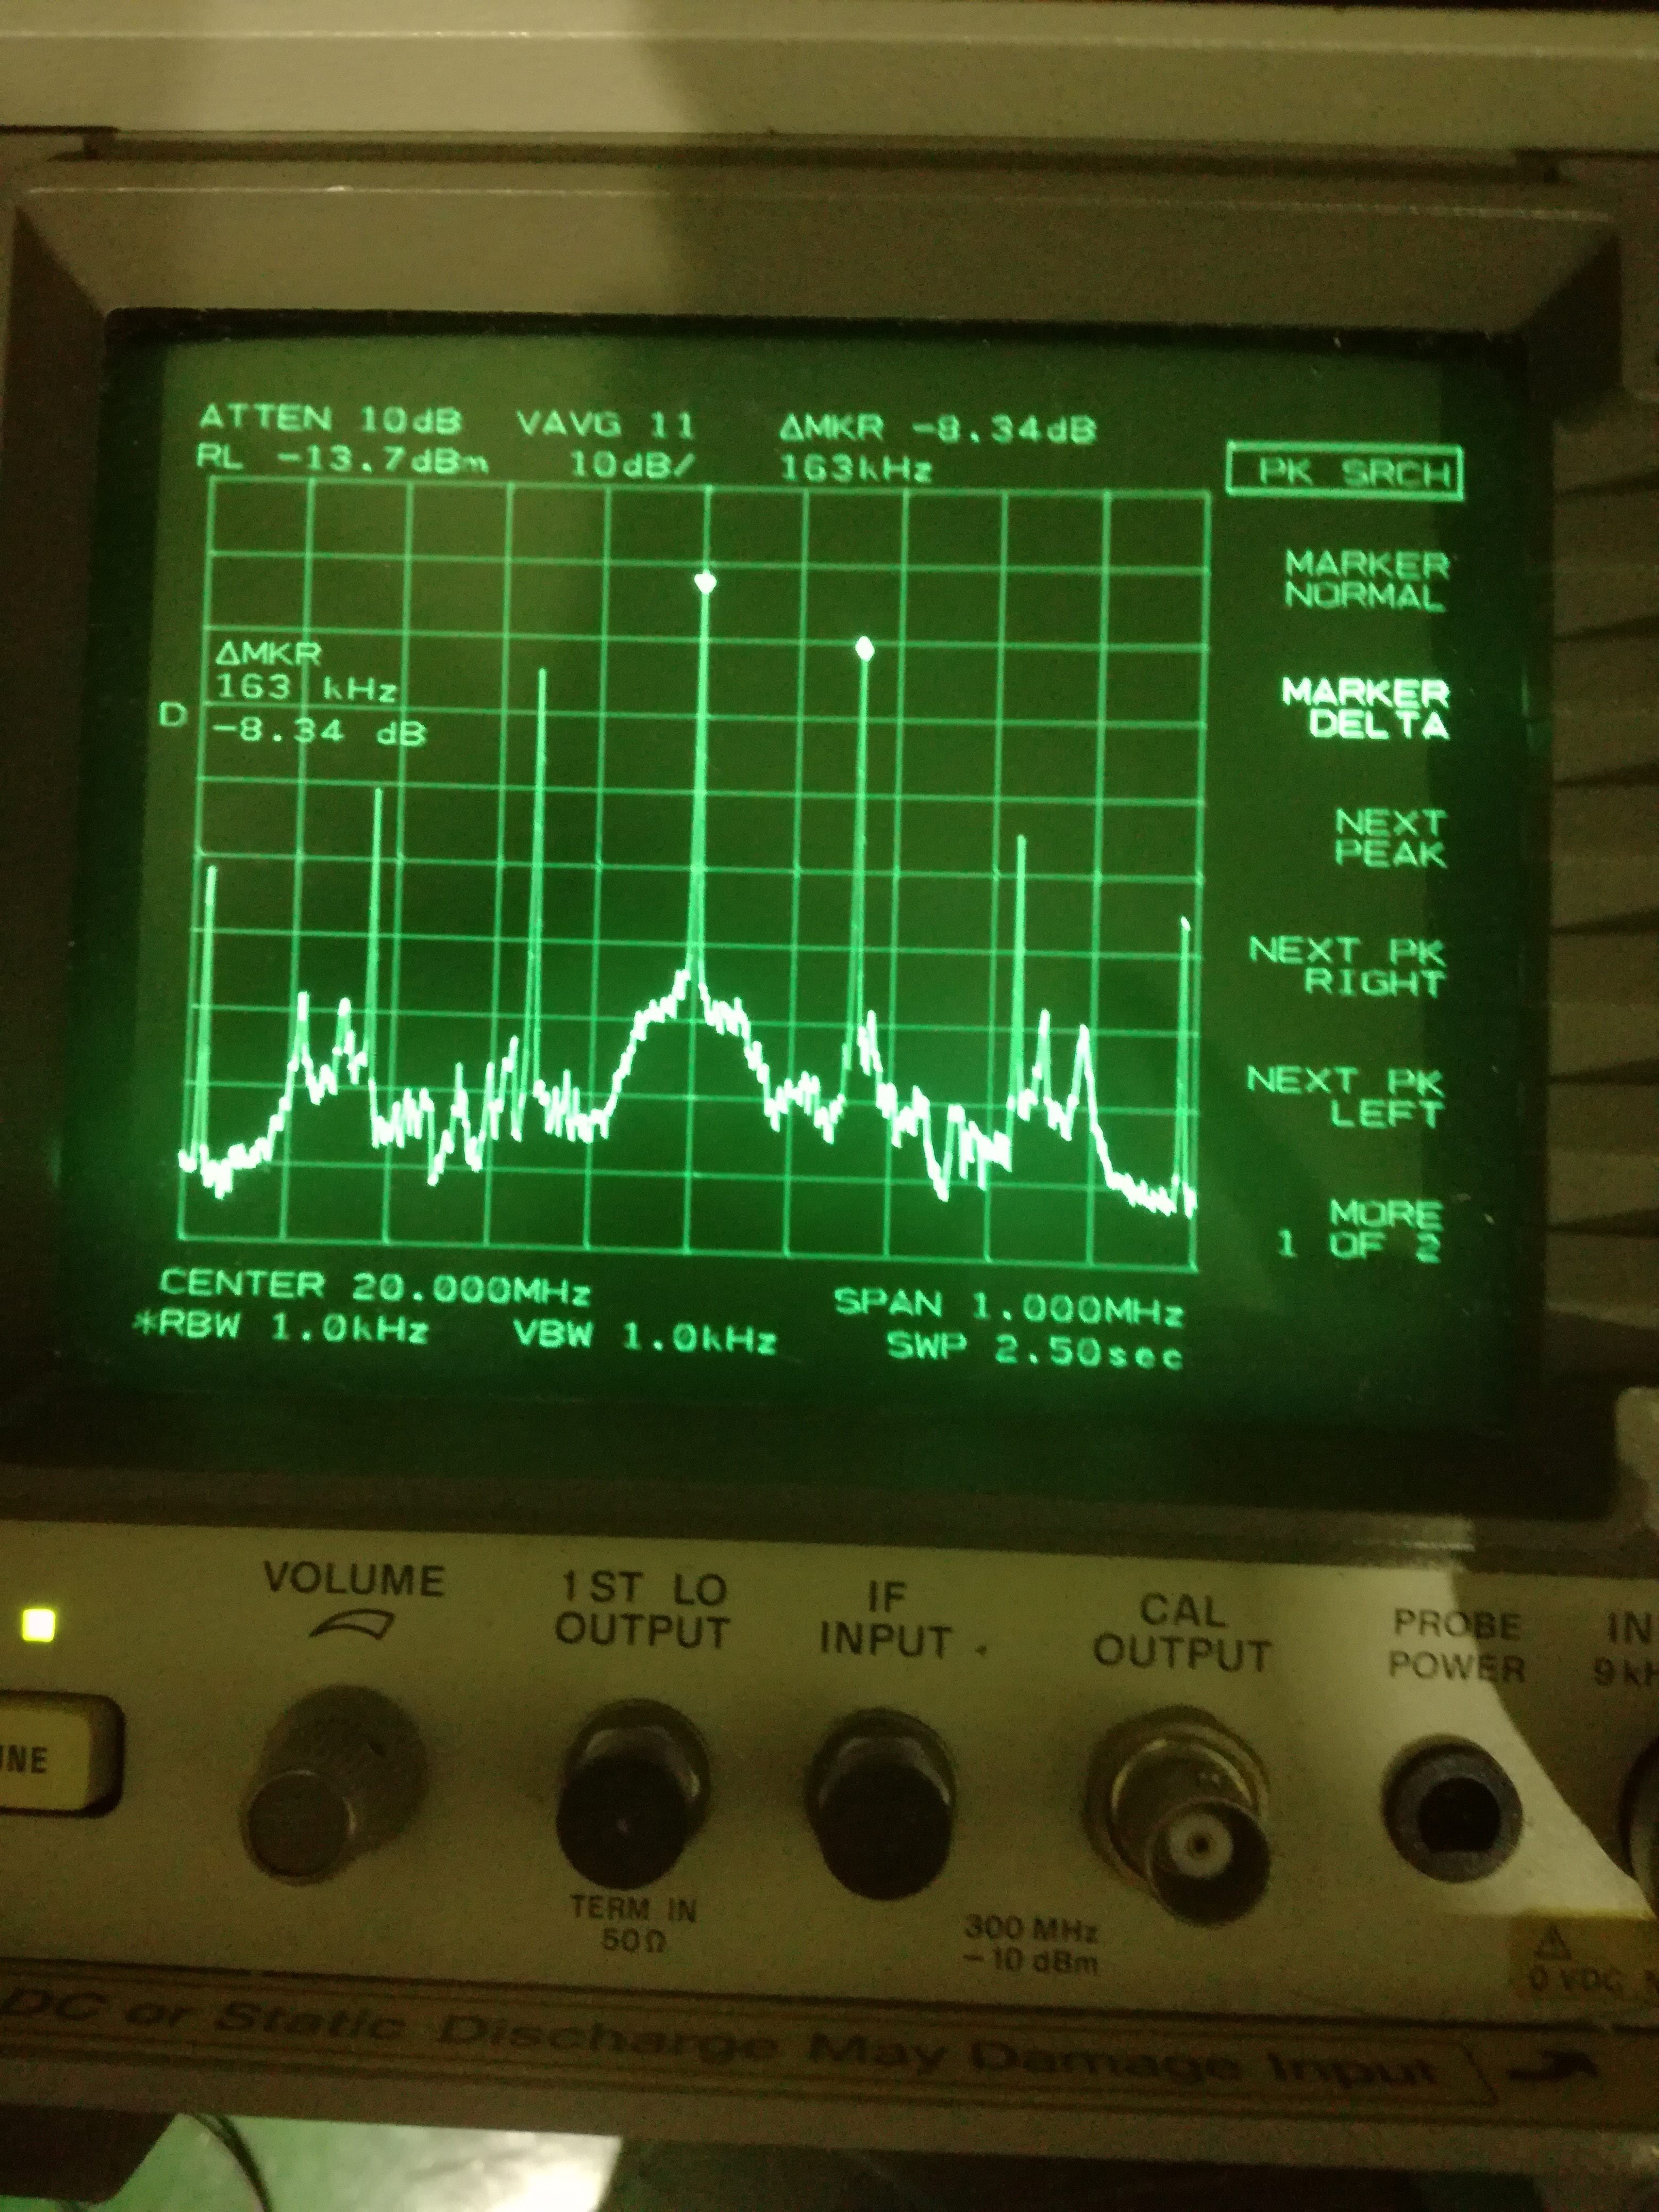
Description of the locked beat note measured with HP 8563E spectrum Analyzer
The attached picture 'pll_20MHz.jpg' shows the shape o the locked beat note, locked in the Config 1 (charge pump current 3.75 mA). The spectrum analyzer settings were SPAN 1 MHz, RBW 1 kHz, VAVG 10. From it we can see the loop bandwidth around 30-40 kHz, the first PZT resonance peaks around 160 kHz and some some structures around 380 kHz.
Phase noise measurement
The phase noise is measured with the demodulation technique. Using a Minicircuit Mixer (Class +7). The mixer channels are connected as follows:
LO: Reference clock at 20 MHz (Channel 3 of the DDS board amplified to have 7dBm output)
RF: 10% of the locked beat note power
OUT: 1.9 MHz low pass filter
1. Mixer V/rad constant measurement:
The LO frequency was set to 20.0001 MHz, in order to have a difference frequency between RF and LO of 100 Hz. The Vpp of this oscillating signal was measured with the oscilloscope input impedance set to 1MΩ. We obtain Vpp= 98 mV => Mixer constant = 49 mV/rad.
2. Phase alignment.
We re-set the LO frequency at 20 MHz and we change it phase offset in order to have the mean value of the demodulated signal around 0V.
3. Phase noise measurement with Agilent 35670A signal analyzer
We connected the output of the mixer to the spectrum analyzer. We set the following parameters: Meas Type PSD, Unit: V^2/Hz, Input coupling: DC, Ground settings: Float
The attached plot pll20mhzpn.pdf' shows the measured and expected phase noise from simulation in the Configuration 1 (CP=3.7mA) and in the Configuration 2 (CP=2.5mA)
The measured RMS phase noise between 120Hz and 102.4 kHz is:
- Config 1: 7.3 mrad
- Config 2: 9.4 mrad
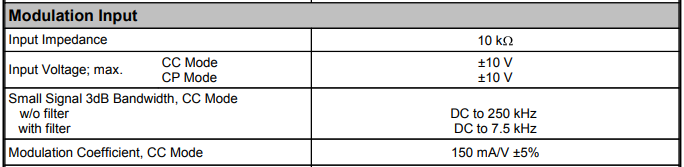
I checked the manual of the LD and Temperature Controller - CLD1015
It is possible to modulate the current with an external source.
The input is a SMA connector on the rear panel of the controller.
Details on the modulation parameters are in the attached table (from the manual)
manual link: https://www.thorlabs.com/drawings/a2689db57be706ee-B083F81C-0501-84ED-9463F9E7DF4E37B5/CLD1015-Manual.pdf
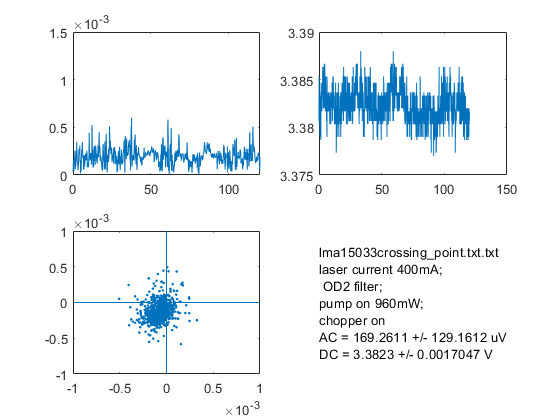
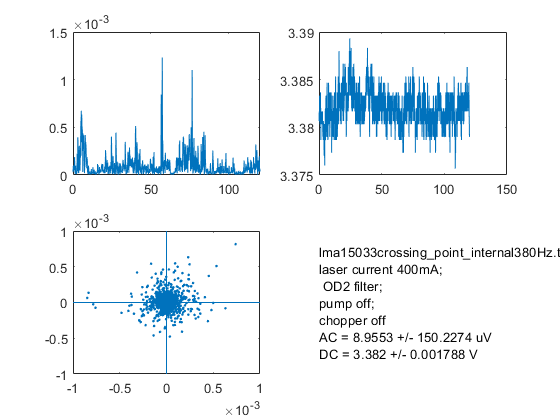
I checked the noise on the pd of the 1310nm probe laser. with and without sample. then I tried to switch off the chopper, to switch off the pump and to put the PD in the crossing point where the waist of the probe is inside the size of the detector. In all the cases the noise is around 100 uV. This means that the noise comes from the laser. So we are planning to make a power stabilization control loop on the laser.
Details and plots of the noise follow:
note that in the case of LMA sample with power=960mW, the SNR is about 1
with lma#15033 sample at the crossing point:
laser current 400mA; OD2 filter
pump on 960mW; chopper on
filename: lma15033crossing_point.txt
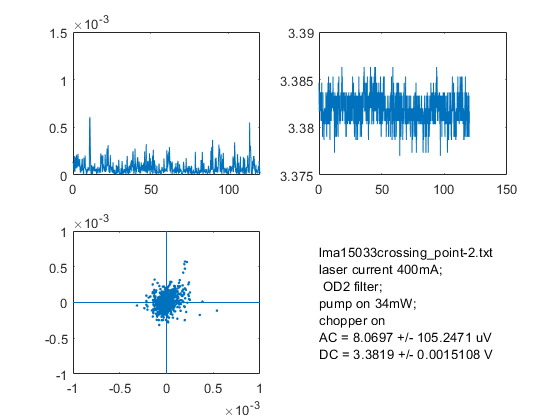
with lma#15033 sample at the crossing point:
laser current 400mA; OD2 filter
pump on 34mW; chopper on
filename: lma15033crossing_point-2.txt
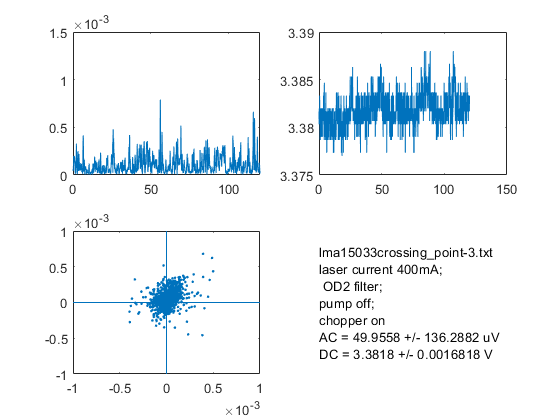
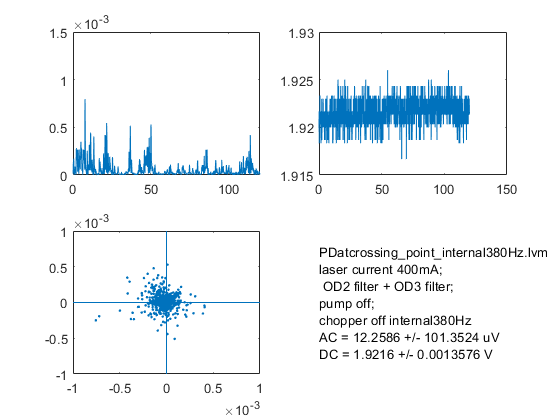
with lma#15033 sample at the crossing point:
laser current 400mA; OD2 filter
pump off; chopper on
filename: lma15033crossing_point-3.txt
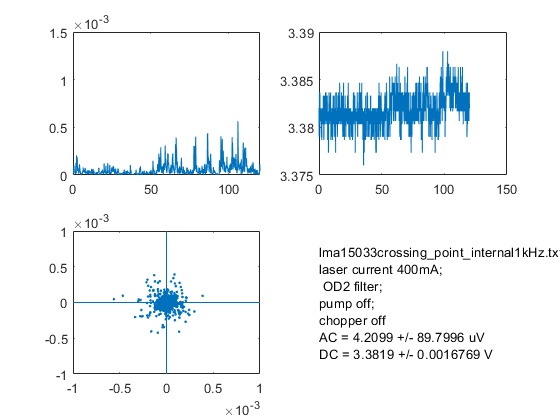
with lma#15033 sample at the crossing point:
laser current 400mA; OD2 filter
pump off; chopper off
filename: lma15033crossing_point_internal1kHz.txt
with lma#15033 sample at the crossing point:
laser current 400mA; OD2 filter
pump off; chopper off
filename: lma15033crossing_point_internal380Hz.txt
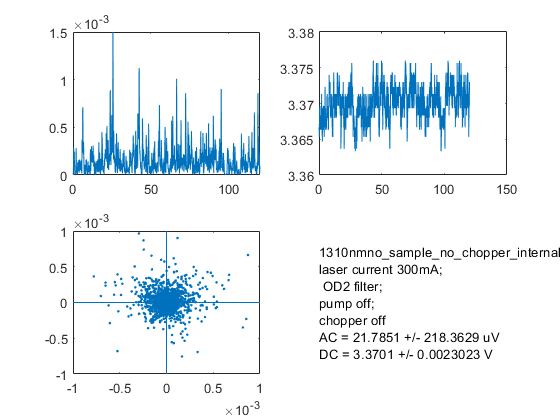
no sample
laser current 300mA; OD2 filter
pump off; chopper off
filename: 1310nmno_sample_no_chopper_internal380Hz
pump off; chopper off internal380Hz
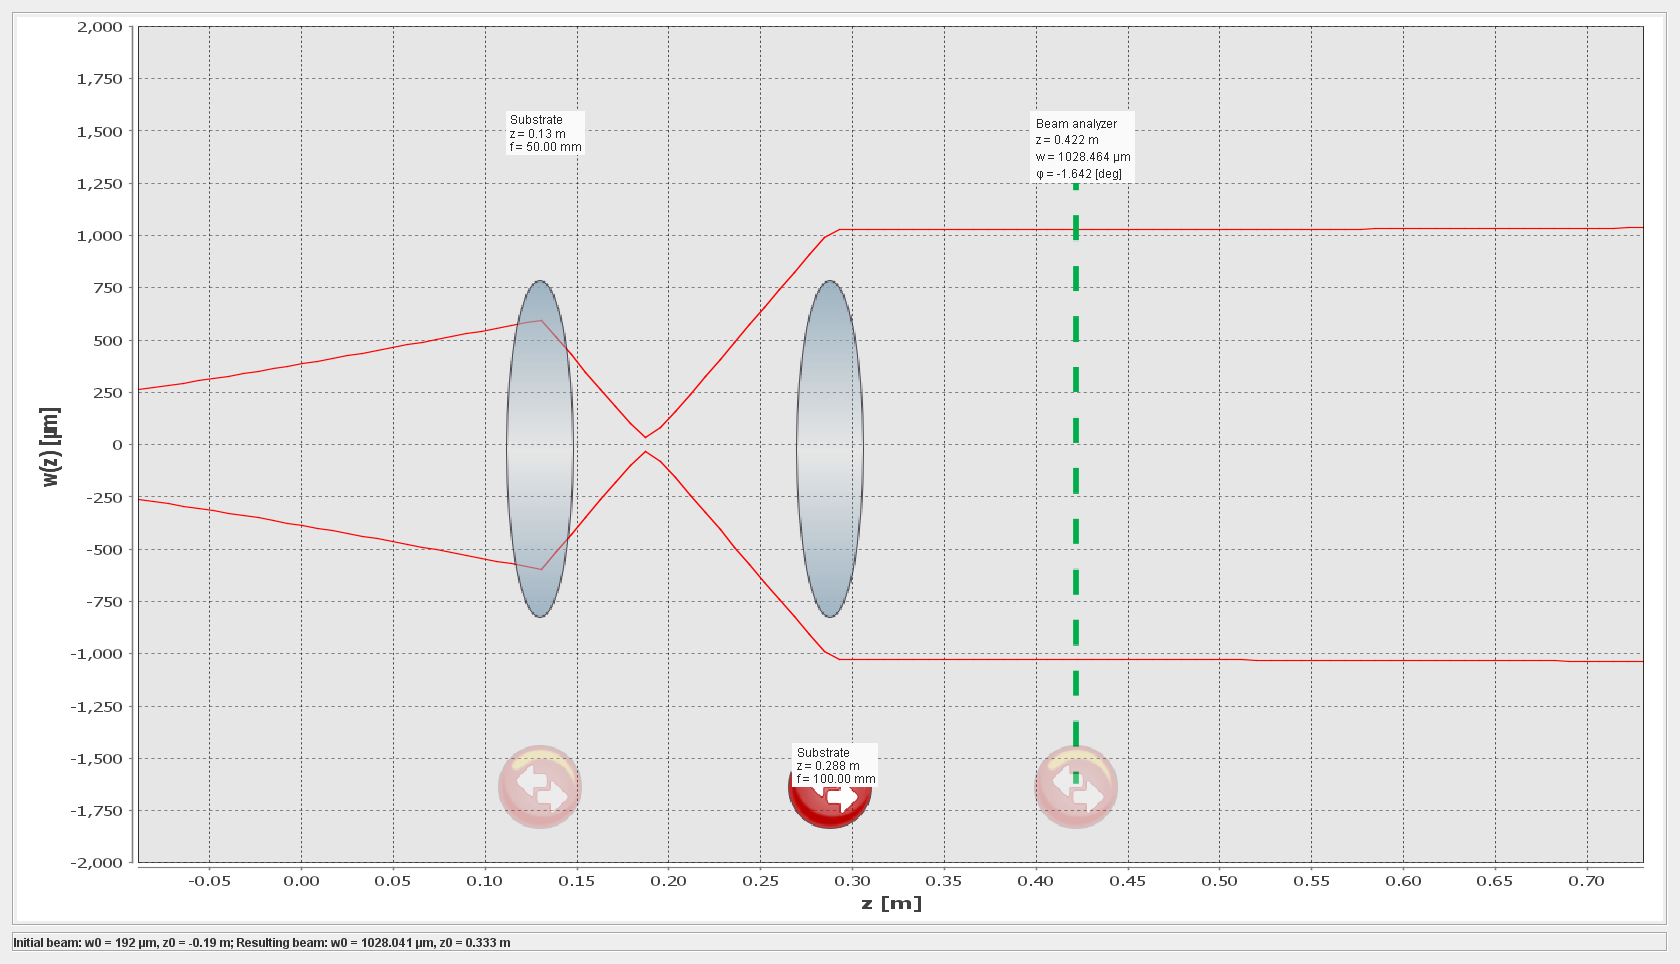
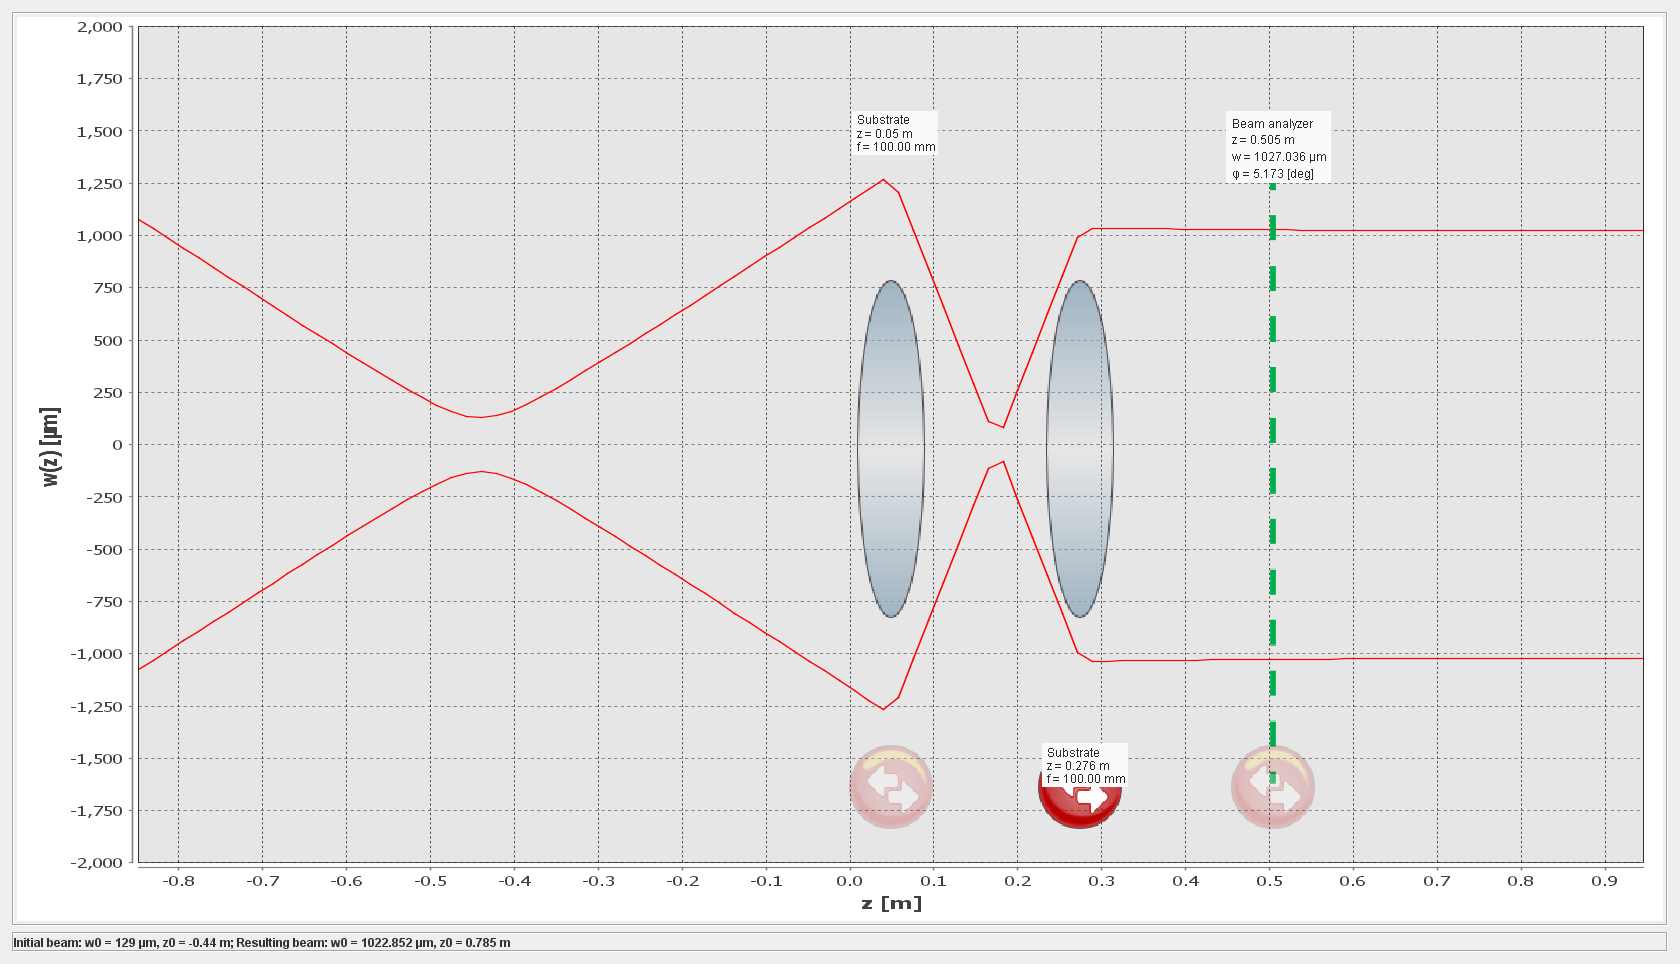
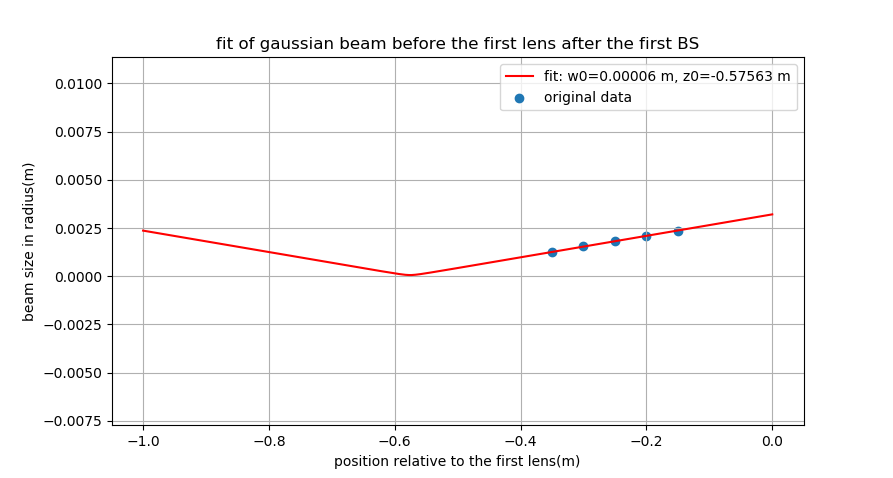
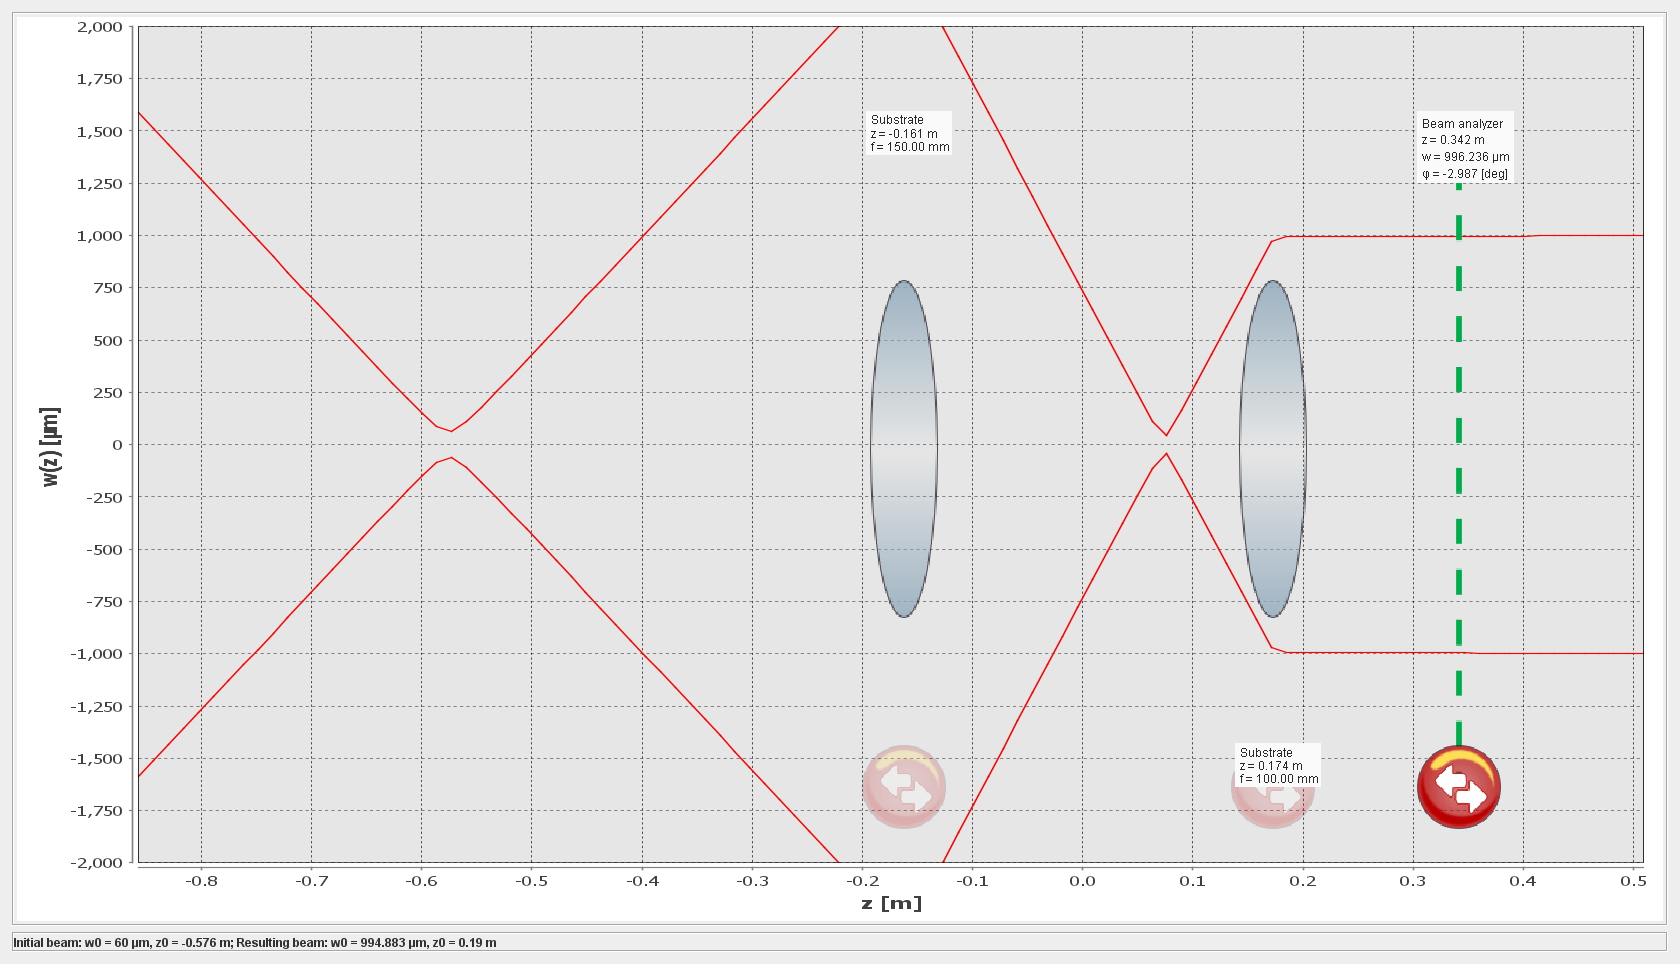
I measured the beam dimension of it.
The reference point is the first lens(after the first BS). The beam waist is 60um and position is -0.576m.
According to this result, we designed the telescope. The purpose it to get a beam collimated and approximate 2mm. The simulation is in attached picture 2.
[Raffaele, Eleonora]
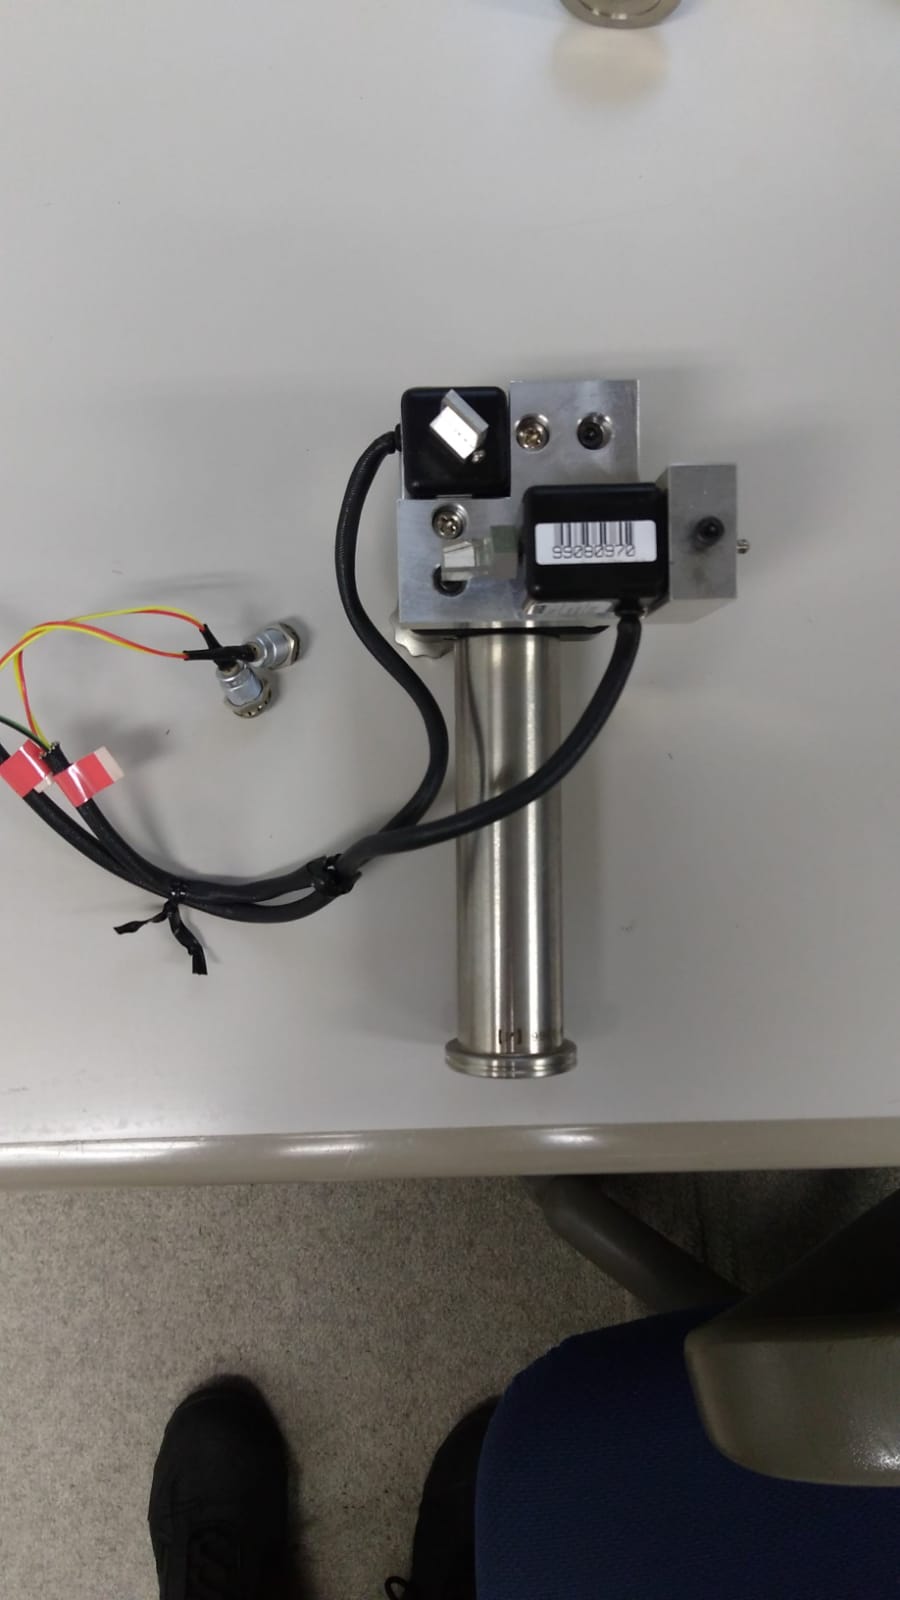
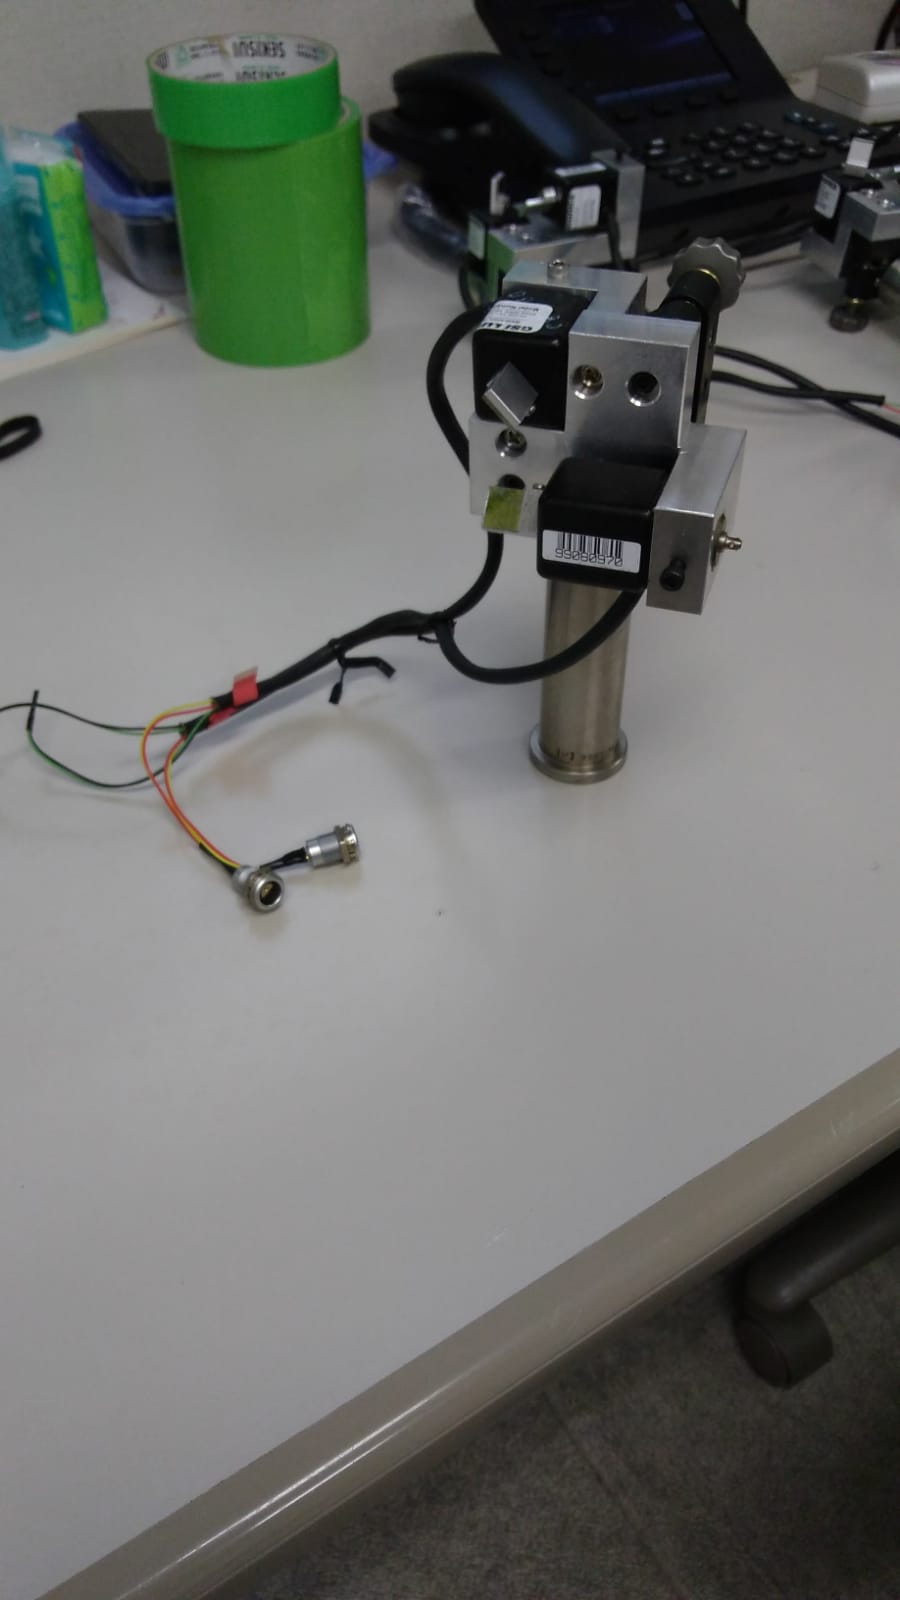
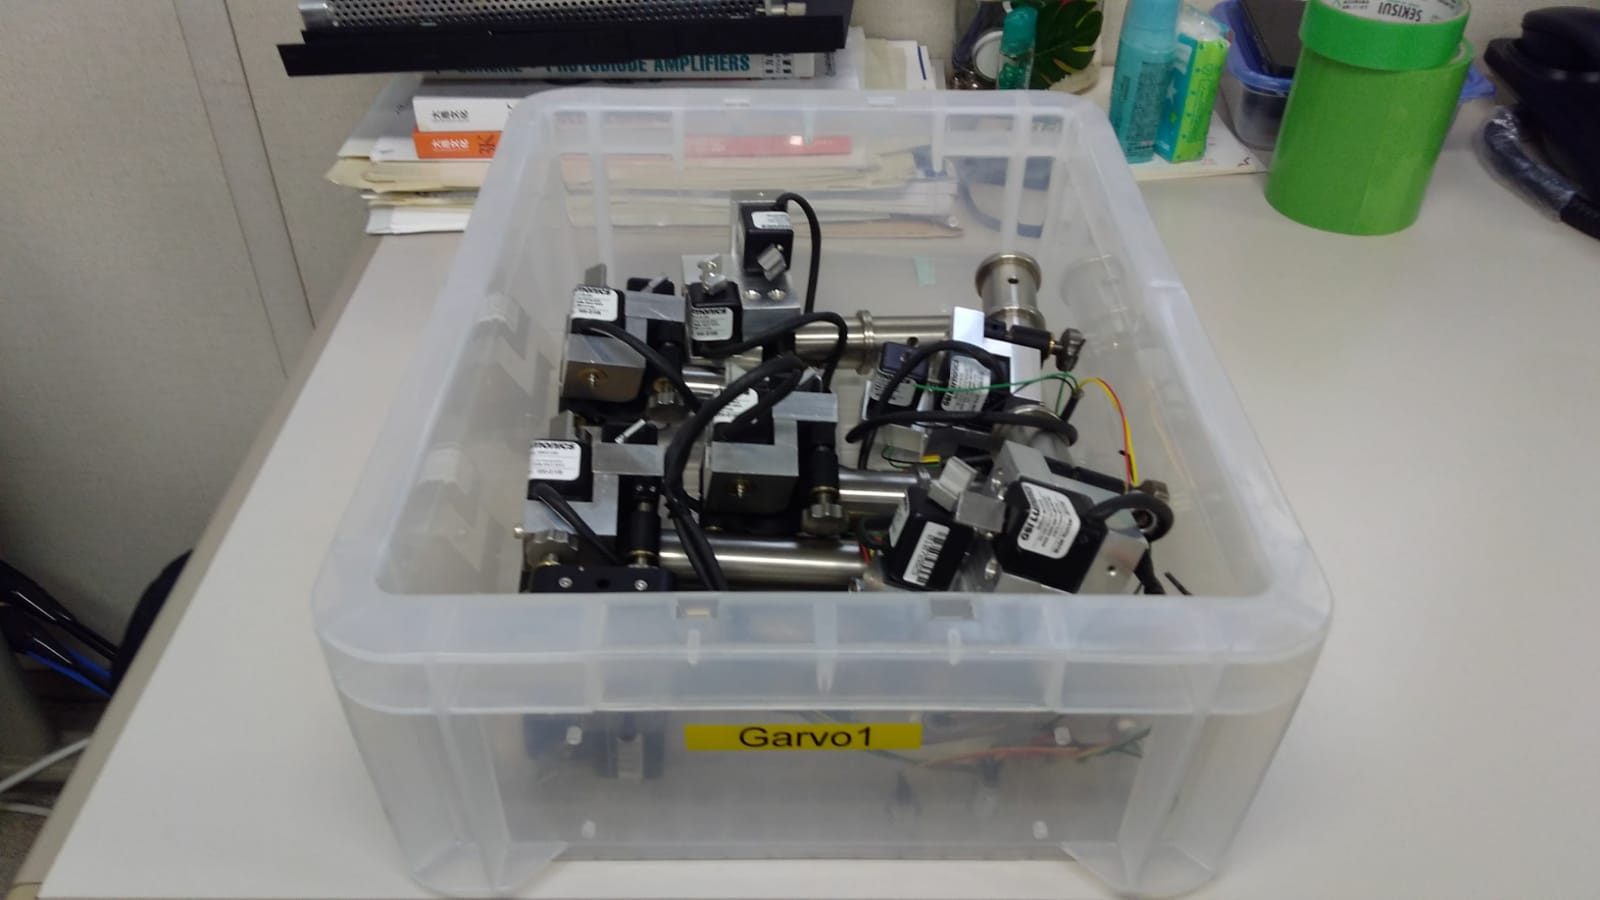
We have found in Tama storage room a box containg 9 so-called galvo, used to keep the beam centered on the quadrants in TAMA automatic alignment system. (Pic 1-2-3)
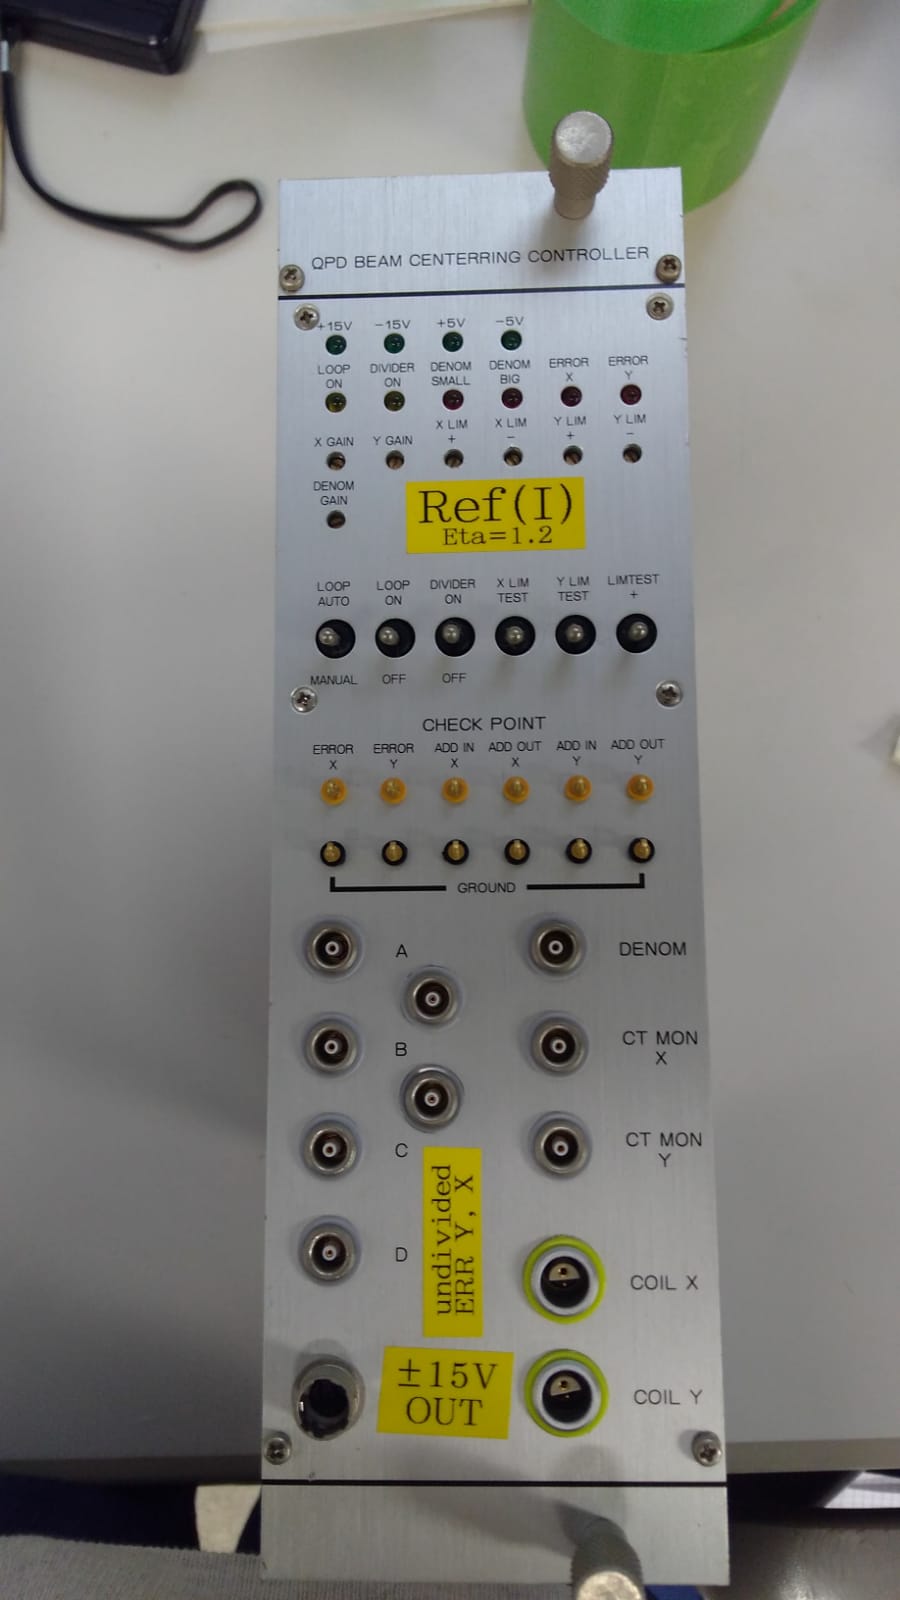
We have also found the NIM modules used to drive them (Pic 4) , which take as input the DC values of the four quadrants sectors.
In the attached pdf files the functiong of the system and the scheme of the board are explained in detail.
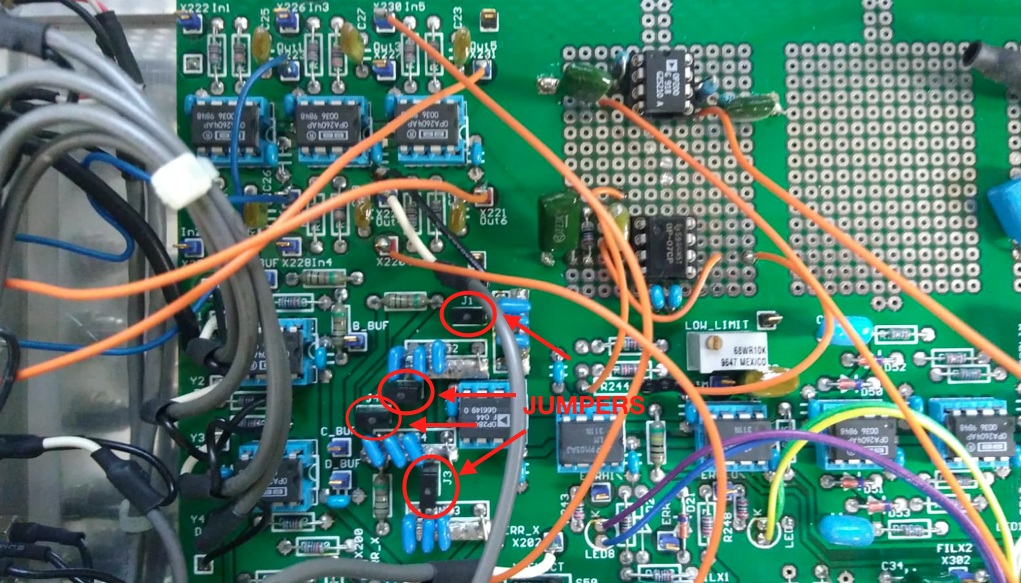
Note that the electronic can be used both for "plus" and "cross" disposition of the quadrant sectors, as both the configurations were used for TAMA quadrants. To switch from one to the other, some jumpers need to be added/removed (PIC 5). More details can be found in the document attached.
The box (pic 3) has been currently stored in the bottom shelf placed near TAMA IMC end chamber.
The electronic modules are on the shelf in the entrance container.
Two galvos are still installed on the TAMA injection bench and still connected to their drivers.
Participants: Marco, Eleonora
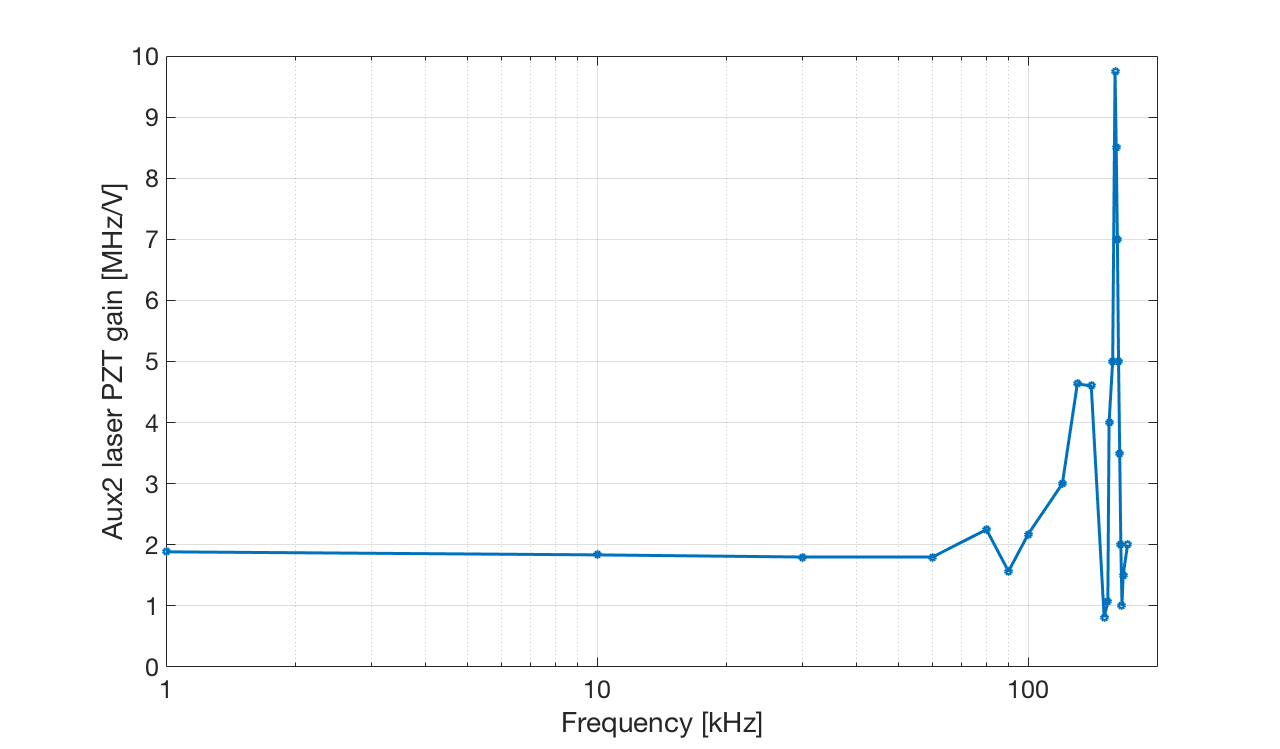
We have characterized the PZT gain of the laser AUX2 as function of the frequency.
The measurement has been done by monitoring (with the spectrum analyzer HP 8563E) the width of the beating note of the two axiliary lasers, when a modulation was sent to the PZT of AUX2.
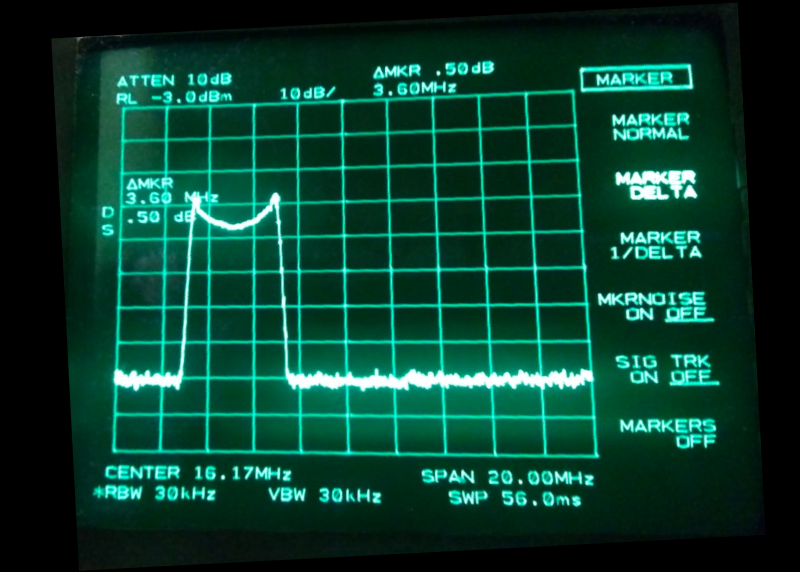
The first attached plot shows the PZT gain as a function of the frequency from 1 kHz to 170 kHz. Its value is almost constant up to100 kHz. After that, the piezo resonanaces start to appear. We remark that the gain at low frequency is about 1.8 MHz/V while from the laser spec we expected 1 MHz/V.
As an exemple, in the second attachment is shown the enlarged beating note observed when sending to AUX2 piezo a modulation at 60 kHz. The width of the beating corresponds to twice the PZT gain at that modulation frequency.