
Faint systematic pattern after bias subtraction
Sep. 3, 2023
When a data cube is integrated over a wavelength range, the faint systematic pattern below is occasionally seen (Fig. 1 and 2).
This results from a wavy pattern in a bias frame of the FOCAS CCDs (Fig.3, and see this WEB page).
To avoid this, the new option "-bo" of bias_overscan.py was implemented. Putting this option, template bias files are not used and instead the bias subtraction is done refering the upper over scan region in the target file (Fig. 4).
When an object signal is as low as a readout noise, this systematic noise is problematic.
For flat frames, this systematic noise is much smaller than the signal, so there is no significant difference whether the "-bo" option is used or not.
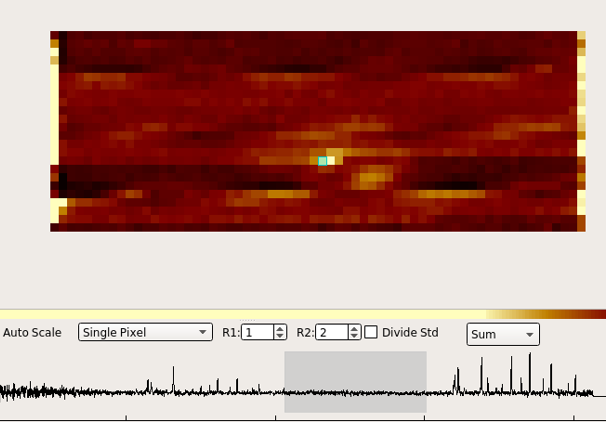
Fig.1 Faint systematic pattern. The wavy pattern is significant at Y=5,6,19,20. The data was provided from
Isobe et al. (2023, ApJ, 951, 102) and
Xu et al. (2023, arXiv:2303.12467)
.
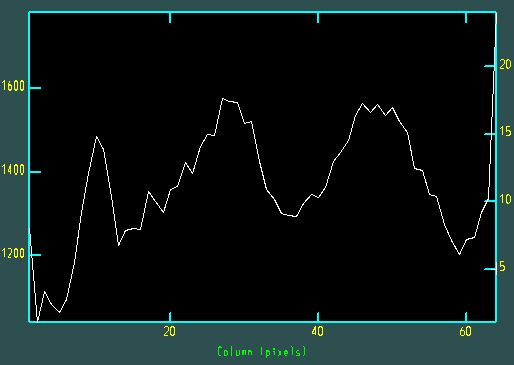
Fig.2 Wavy pattern at Y=6.
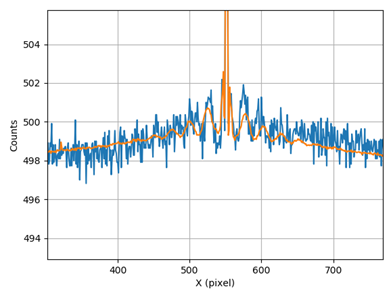
Fig.3 Intesity profiles of the bias template (orange) and the integrated upper overscan region (blue).
The amplitude and frequency are slightly different each other. The maximum difference is about 2 counts ~ 4 electrons.
This causes the wavy pattern.
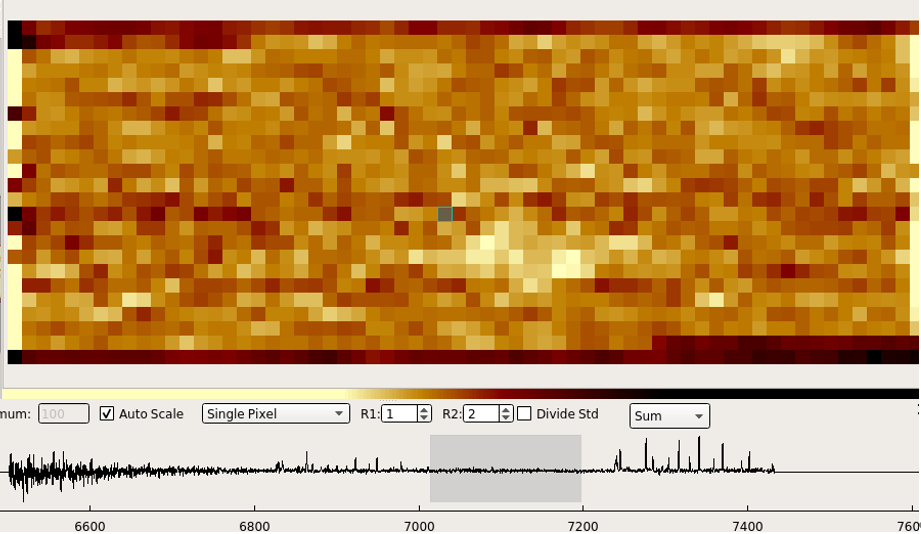
Fig.4 Same as Fig.1 but the upper over scan region is used for making the bias template.
The wavy pattern cannot be seen.