NAOJ GW Elog Logbook 3.2

Manuel, Matteo B, Eleonora.
I recorded a first video of the signal of the photodiodes on the oscilloscope without control loop .
Channel1 (yellow) is the out-of-loop PD (DET10N) with a load of 6kOhm that gives 104mV of DC.
Channel2 (blue) is the in-loop PD (PM100D) analog output. DC = 470mV
The noise is mostly at high frequencies. The PM100D shows some spikes, while the DET10N doesn't.
The loop consists of a subtraction of an offset from a waveform generator, then a low pass (order one) at 100Hz and a Gain of 1000 (using the sr560)
I recorded a second video around the moment of closing the loop. On the oscilloscope there are the signal of the in-loop photodiode (blue channel), and the correction signal (yellow channel).
It shows that the in loop PD increases the noise when closing the loop. This is because the noise is mostly at high frequencies and the noise reduction at low frequencies doesn't show clearly in the time domain.
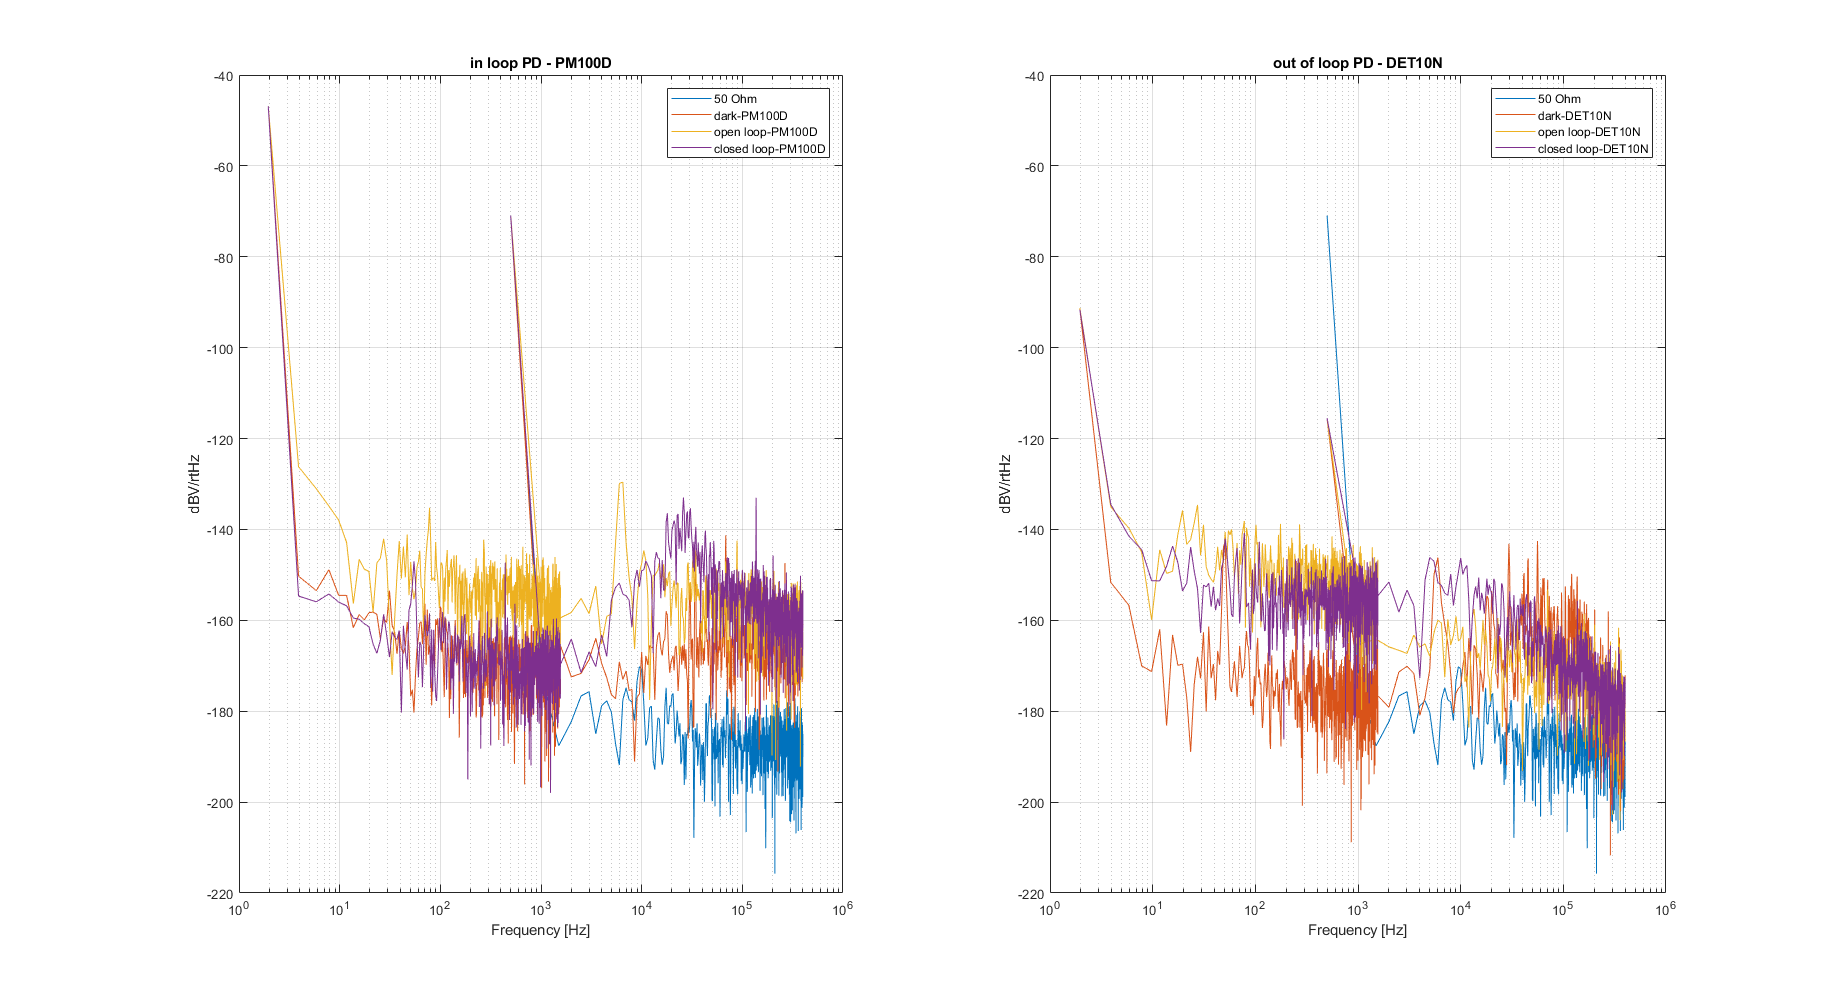
Plot1: I made the spectrum of the 2 PDs in 3 conditions: dark, loop open, loop closed
It shows that the loop works for the inloop PD, but it doesn't for the out of loop PD.
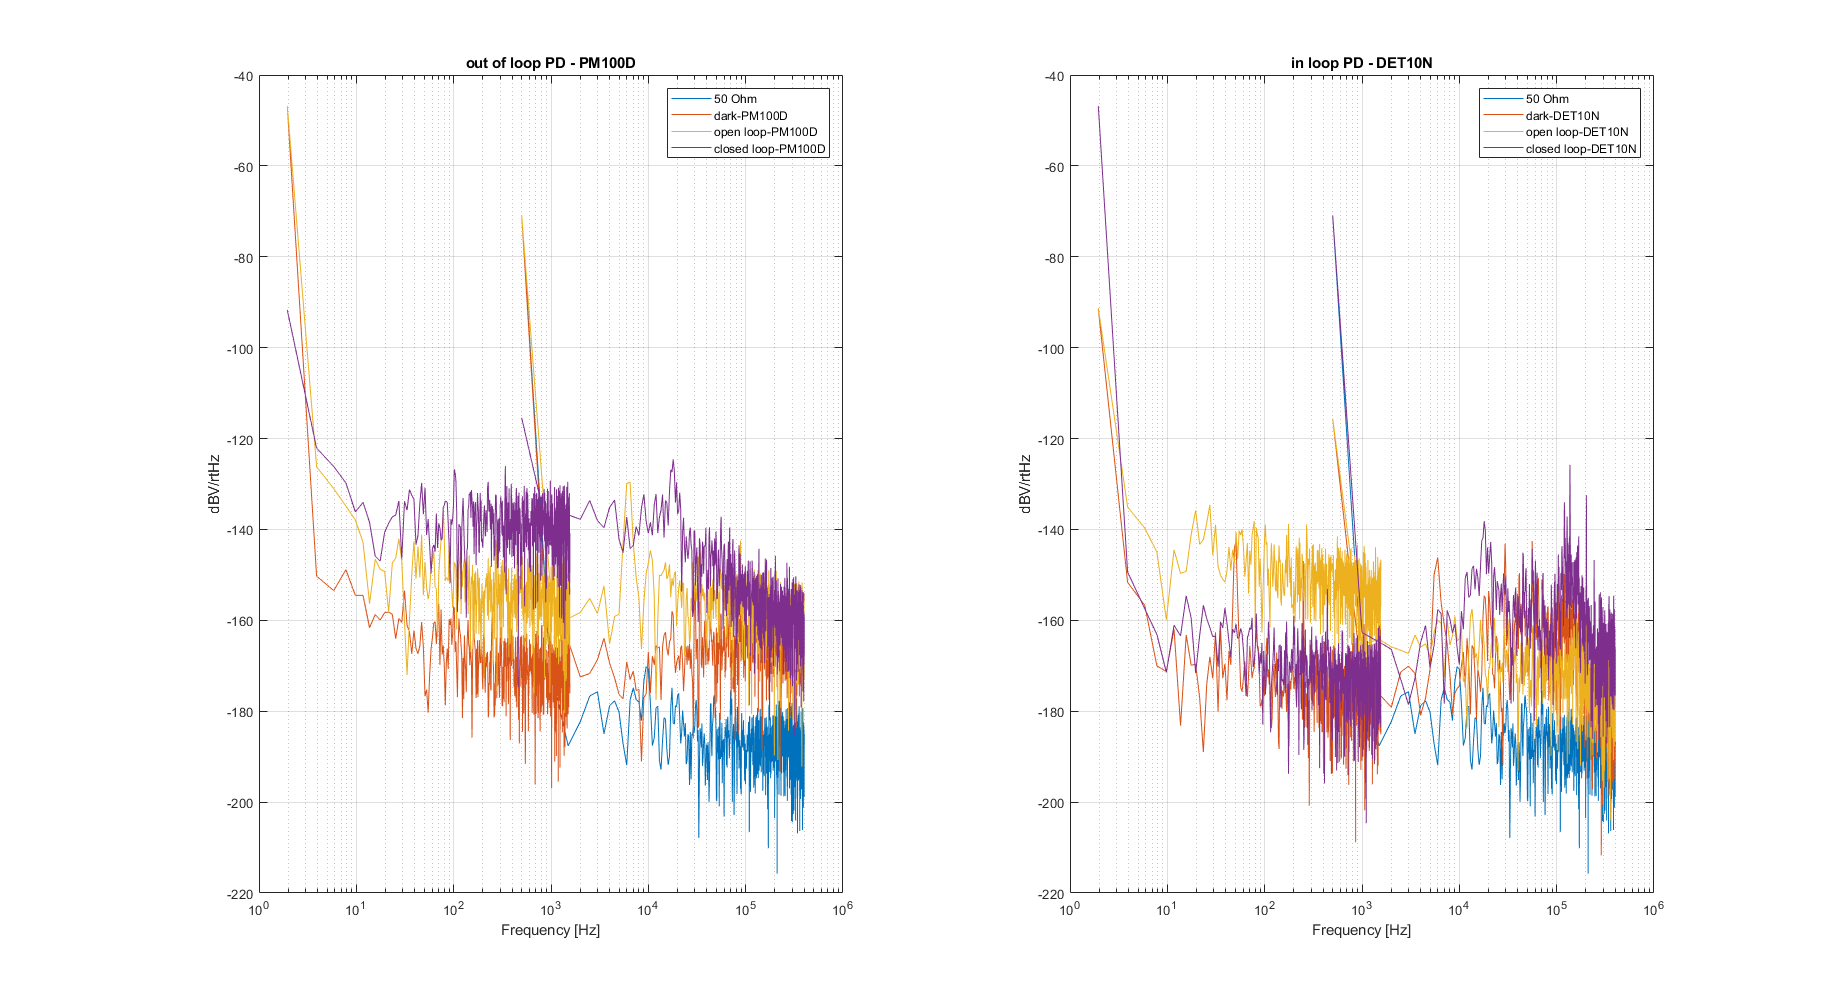
Plot2: I exchanged the two PDs, so in this case the out-of-loop PD is the PM100D and the in-loop PD is the DET10N.
I copied the dark and openloop curves from the plot1 and I updated the closed loop curves. In this case I could increase the gain to 5000.

I repeated the same measurements with another spectrum analyzer, the Agilent35670a
This instrument spectra are much cleaner, I did only 32 averages instead of 256 with the Yokogawa sa2400
First plot: gain 1000 in-loop pd: PM100D
Second plot: gain 1000 in-loop pd: DET10N
Third plot: gain 5000 in-loop pd: DET10N