NAOJ GW Elog Logbook 3.2

Partecipants: Marco, Matteo, Eleonora
Description of the servo loop:
The phase detector was implemented using the ADF4002 chip of Anlog devices.
We start from an ADF4002 evaluation board modified as follows (see pag 13 of Evaluation board manual http://www.analog.com/media/cn/technical-documentation/user-guides/UG-108.pdf):
- a BNC debugging cable was soldered in the position J3
- the output of the charge pump (R1 first pin in the scheme) was connected to an external filter mounting the loop filter and a 2x inverting amplifier see 'pll_scheme.pdf'
| Config 1 | Config 2 | |
| R1 | 27 Ω | 27 Ω |
| C1 | 680 nF | 1 uF |
| C2 | 100 nF | 100 nF |
| C3 | n.c. | n.c |
| R2 | 0 Ω | 0 Ω |
| R3 | 10 kΩ | 10 kΩ |
| R4 | 20 kΩ | 20 kΩ |
The evaluation board and the external board are powered with the same power supply with output set ± 12 V.
The output of the external board is connected directly to the PZT controller of the laser and it provides to it a correction signal in the range [0,-10V].
The two input of the pahse detector are the channel 4 of the DDS1 board (-8dBm at 20 MHz) and the beat note between the two lasers detected with the fiber photodiode and amplified by a factor 15 dB. (The amplified signal was splitted with a 90:10 directional coupler, the 90% of the power was sent to the ADF4002 Evaluation board whereas the 10% is used for monitor and diagnostic).
With this setup we locked the beat note between the AUX1 and AUX2 lasers at 20 MHz acting on the AUX2 PZT.
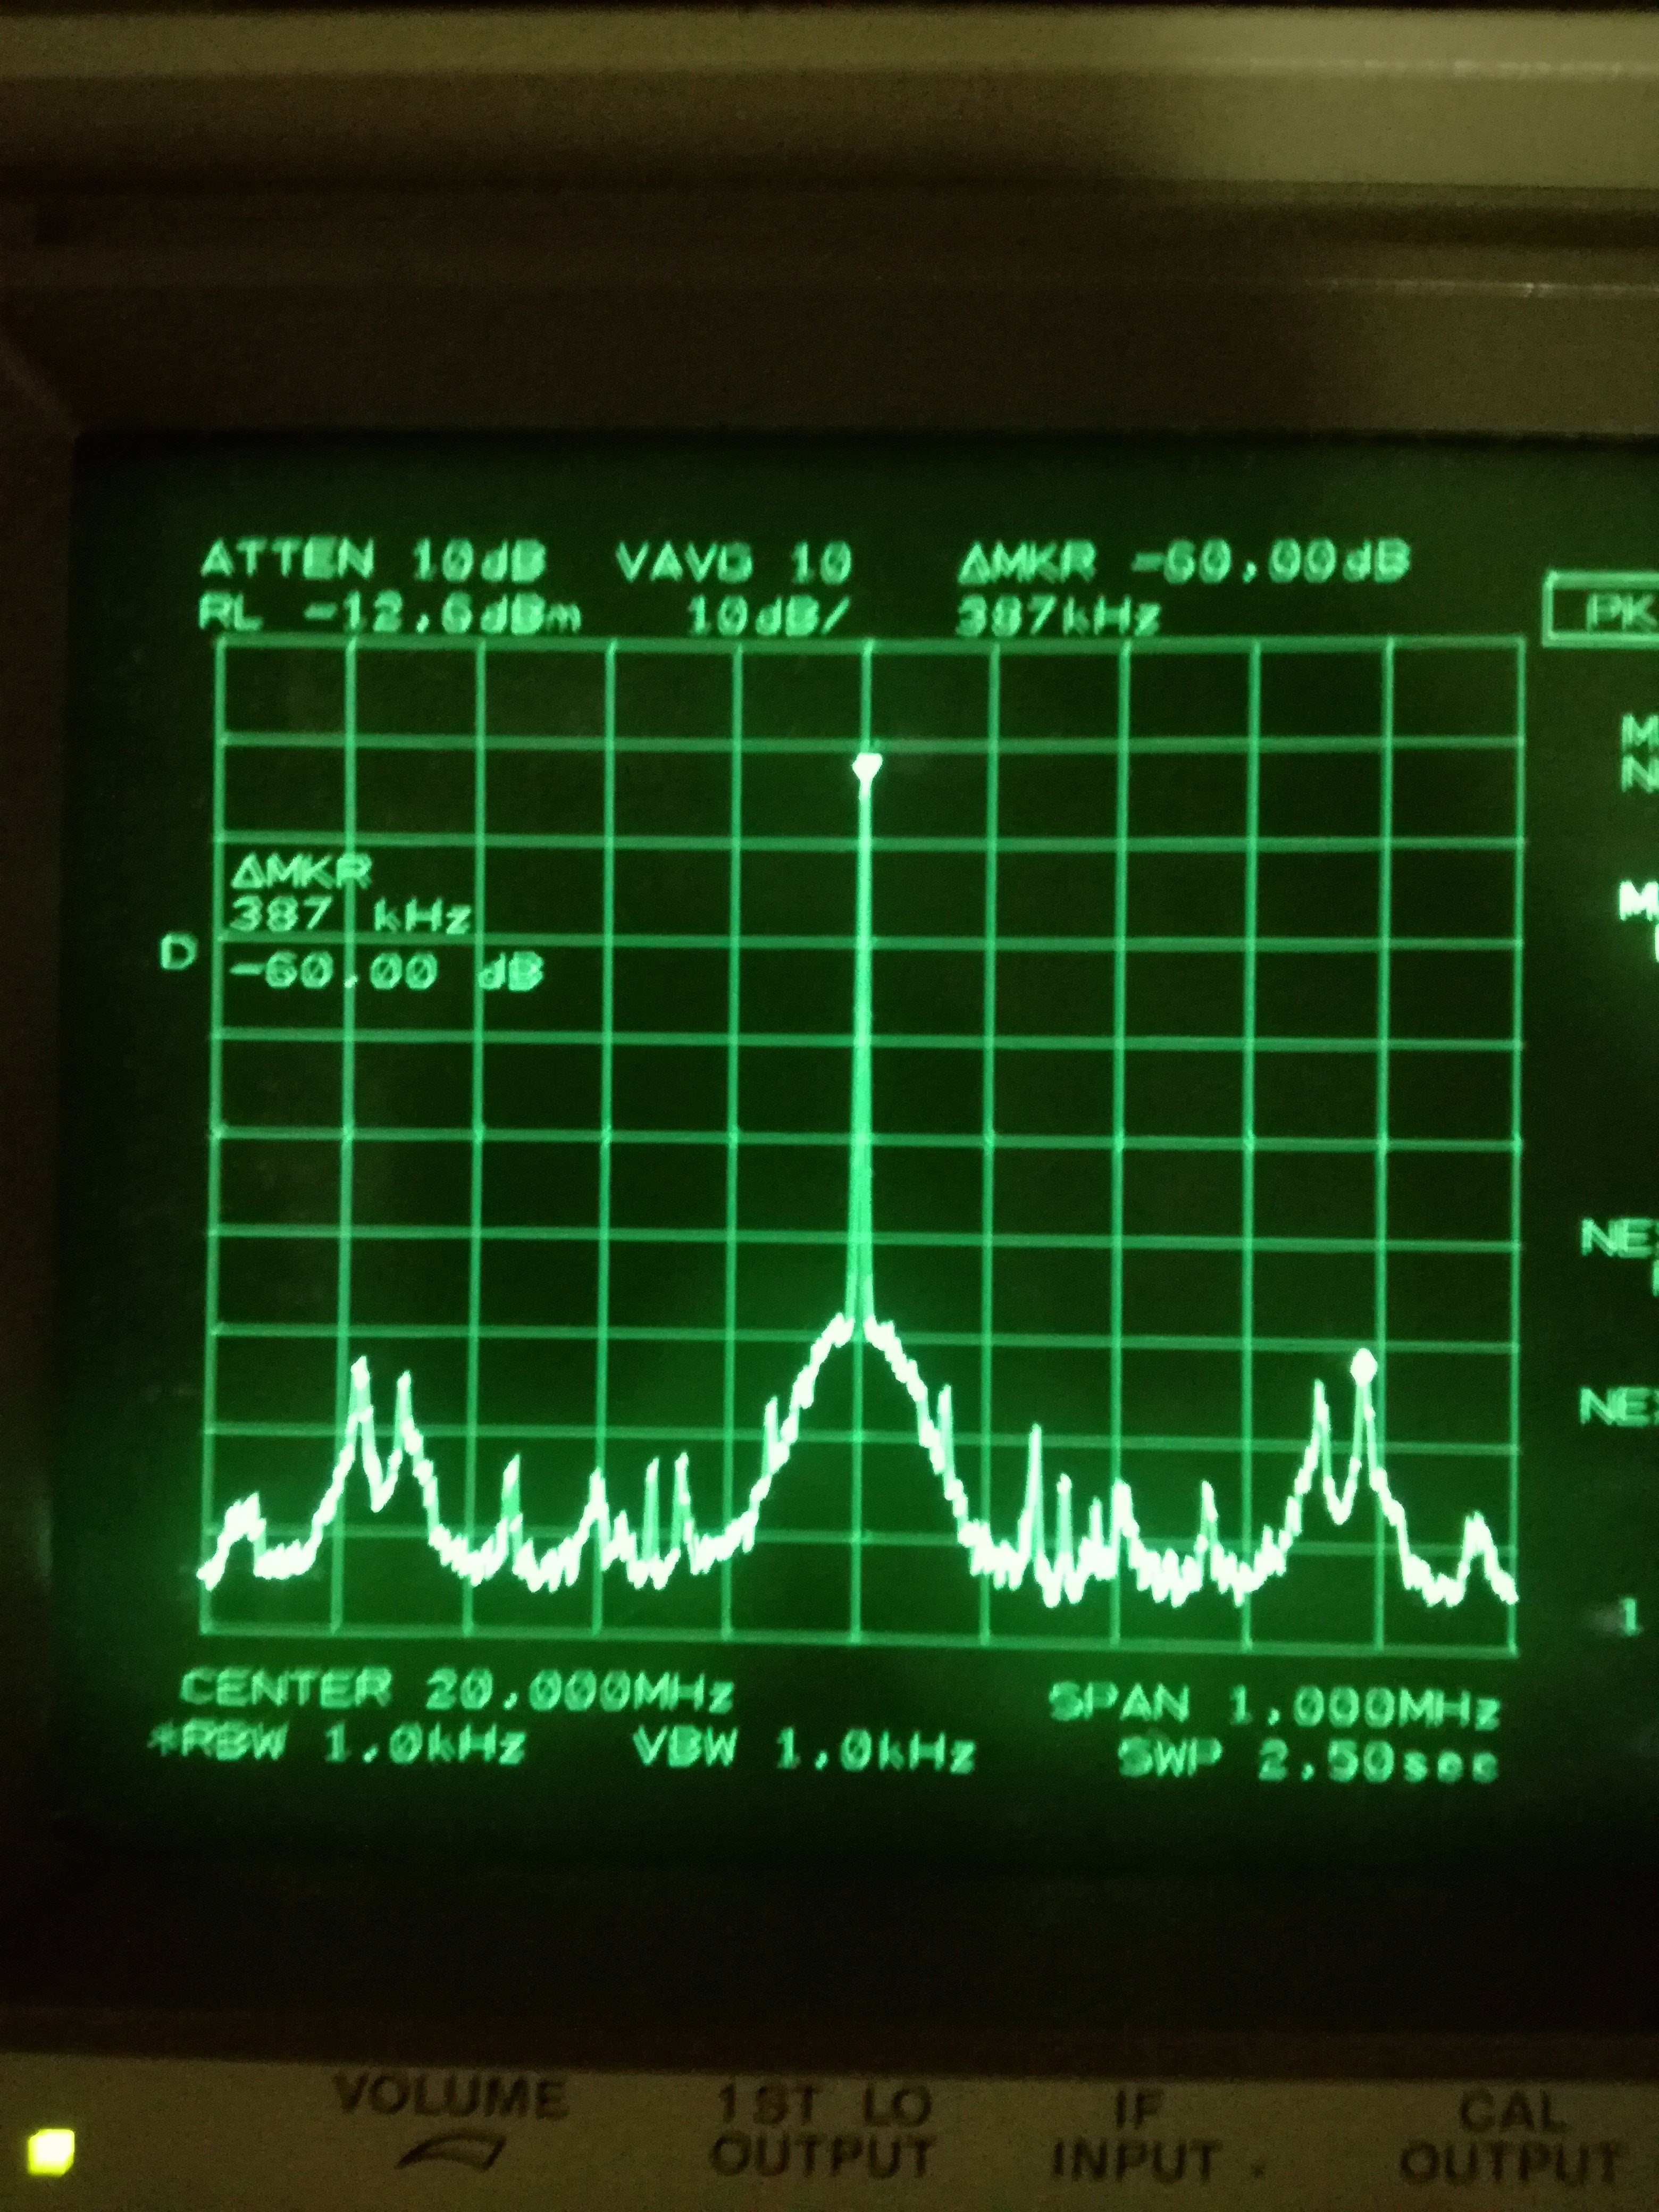
Description of the locked beat note measured with HP 8563E spectrum Analyzer
The attached picture 'pll_20MHz.jpg' shows the shape o the locked beat note, locked in the Config 1 (charge pump current 3.75 mA). The spectrum analyzer settings were SPAN 1 MHz, RBW 1 kHz, VAVG 10. From it we can see the loop bandwidth around 30-40 kHz, the first PZT resonance peaks around 160 kHz and some some structures around 380 kHz.
Phase noise measurement
The phase noise is measured with the demodulation technique. Using a Minicircuit Mixer (Class +7). The mixer channels are connected as follows:
LO: Reference clock at 20 MHz (Channel 3 of the DDS board amplified to have 7dBm output)
RF: 10% of the locked beat note power
OUT: 1.9 MHz low pass filter
1. Mixer V/rad constant measurement:
The LO frequency was set to 20.0001 MHz, in order to have a difference frequency between RF and LO of 100 Hz. The Vpp of this oscillating signal was measured with the oscilloscope input impedance set to 1MΩ. We obtain Vpp= 98 mV => Mixer constant = 49 mV/rad.
2. Phase alignment.
We re-set the LO frequency at 20 MHz and we change it phase offset in order to have the mean value of the demodulated signal around 0V.
3. Phase noise measurement with Agilent 35670A signal analyzer
We connected the output of the mixer to the spectrum analyzer. We set the following parameters: Meas Type PSD, Unit: V^2/Hz, Input coupling: DC, Ground settings: Float
The attached plot pll20mhzpn.pdf' shows the measured and expected phase noise from simulation in the Configuration 1 (CP=3.7mA) and in the Configuration 2 (CP=2.5mA)
The measured RMS phase noise between 120Hz and 102.4 kHz is:
- Config 1: 7.3 mrad
- Config 2: 9.4 mrad