Members: Flaminio, Manuel, Kuroki
After aligning and getting the absorption signal from the reference samples, we investigated the noise in order to determine the sensitivity.
The noise was 70uV without the sample, the probe centered on the detector, the chopper rotating at 380Hz, and pump OFF. Quite higher than the specifications that say it should be 5-25uV.
We tried to find the source of the noise using a spectrum analyzer: replacing the chopper reference with the internal oscillator of the lock-in at 380Hz doesn't change the noise level, even turning off the chopper doesn't work. Noise doesn't change (see plots attached), so this excludes that the noise comes from the chopper vibrations.
(at some point the noise became huge, the order of many mV, like many spikes appearing randomly, it lasted for a couple of hours and then it stopped again, we have no clue where this came from, but it looks like what happened here)
We tried to change the PD power supply with the battery. We tried to shift the chopper frequency and we found a small peak at 384Hz, with this frequency also X and Y signals were not fluctuating around zero. So we decided to change the chopper frequency to 370Hz and that peak didn't shift. So, better not to use modulation frequency 384Hz.
We found out that the noise spectrum shape may depend on the centering of the probe on the detector.
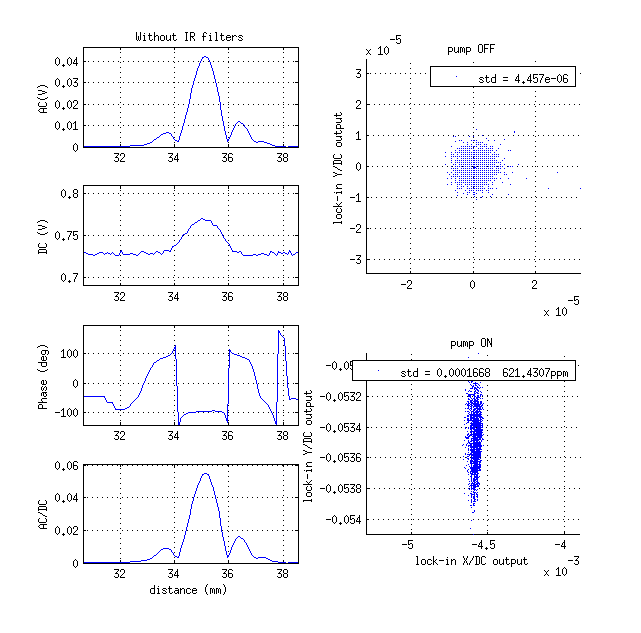
Since the spot size at the detector is comparable with the filters holder in front of it, we decided to remove the filters and check the noise level.
We had the suspect that the PD saturates, so we put a ND filter (OD1) in front of the probe to reduce power and the following happened (without sample):
- The DC signal decreased from 6.5V to 1.1V
- The AC noise signal decreased from 70uV to 6uV
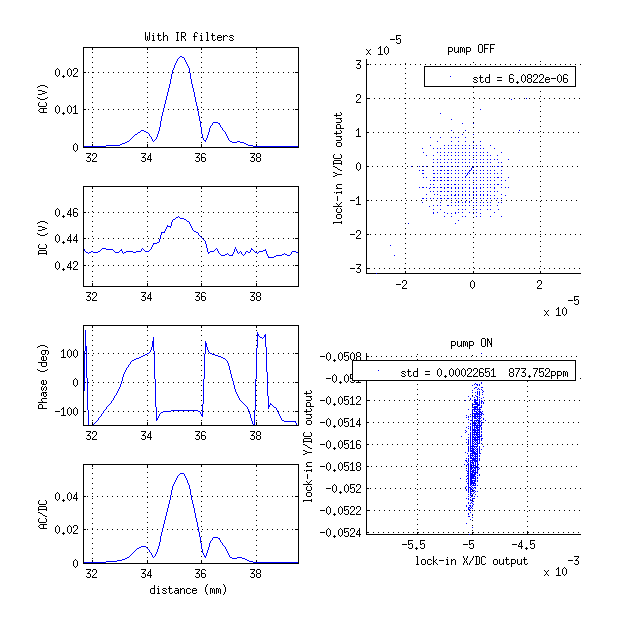
I made a scan of the surface reference sample, I attach the plots in the two cases: with the IR filter in front of the detector and without.
To check the noise I acquired 300s of data at the maximum of the scan absorption signal (z=35.1mm), with pump and without.
The pump power is 34mW
|
case |
std(AC) |
DC |
std(AC/DC) |
AC |
std(AC) |
AC/DC |
std(AC/DC) |
std(ppm) |
std(ppm) |
|
pump |
OFF |
OFF/ON |
OFF |
ON |
ON |
ON |
ON |
OFF |
ON |
|
without IR filter |
3.4uV |
0.77V |
4.4uV |
0.042V |
128uV |
0.0545 |
1.67E-04 |
16 |
621 |
|
with IR filter |
2.7uV |
0.45V |
6.1uV |
0.024V |
99.5uV |
0.053 |
2.26E-04 |
23 |
873 |
We found out that the DC changes from 0.46V to 0.44V when switching off the pump. This happens only when there is the sample, this means that some pump is scattered from the sample.
We tried to put a diafragm in front of the detector just before the IR filters, in order to avoid part of the beam to reach the filters borders.
Placed a diafragm and close it as much as the DC signal doesn't change.
diafragm open: 1070ppm (maybe too early after switching on the pump)
diafragm closed: 800ppm
diafragm open again: 830ppm
diafragm closed again: 915ppm
This tells that clipping the beam with the diafragm doesn't clearly reduce the noise.
After placing the ND filter we checked the noise level with and without sample (case low probe power) and compared with the case without the ND filter (case high probe power). The following table summarizes the results.
|
|
low probe power |
high probe power |
|
signal |
AC |
23mV |
AC |
230mV |
|
DC |
440mV |
DC |
5400mV |
|
AC/DC |
0.052 |
AC/DC |
0.043 |
noise
With sample |
AC_rms |
0.1mV |
AC_rms |
2.8mV |
|
DC |
440mV |
DC |
5400mV |
|
AC_rms/DC |
2.30E-04 |
AC_rms/DC |
4.50E-04 |
|
ppm |
884ppm |
ppm |
2000ppm |
noise
Without sample |
AC_rms |
3μV |
AC_rms |
70μV |
|
DC |
0.65V |
DC |
6.5V |
|
AC_rms/DC |
4.60E-06 |
AC_rms/DC |
1.00E-05 |
|
ppm |
18ppm |
ppm |
46ppm |
Today we checked again the signal level at the above conditions and we found almost the same values of the table above but the AC noise with low probe power and without sample was higher: around 200 μV instead of 70μV.
Then Kuroki suggested to cover the Imaging Unit to protect from wind (as it was in the original setup last year) and the noise became between 50-100μV , then we removed the cover and the noise remained on the same level 50-100μV. We think we should cover better the optical parts, in order to avoid temperature fluctuations which might affect the noise.