NAOJ GW Elog Logbook 3.2

Measured Fast axis orientation of second LC
Issue solved:
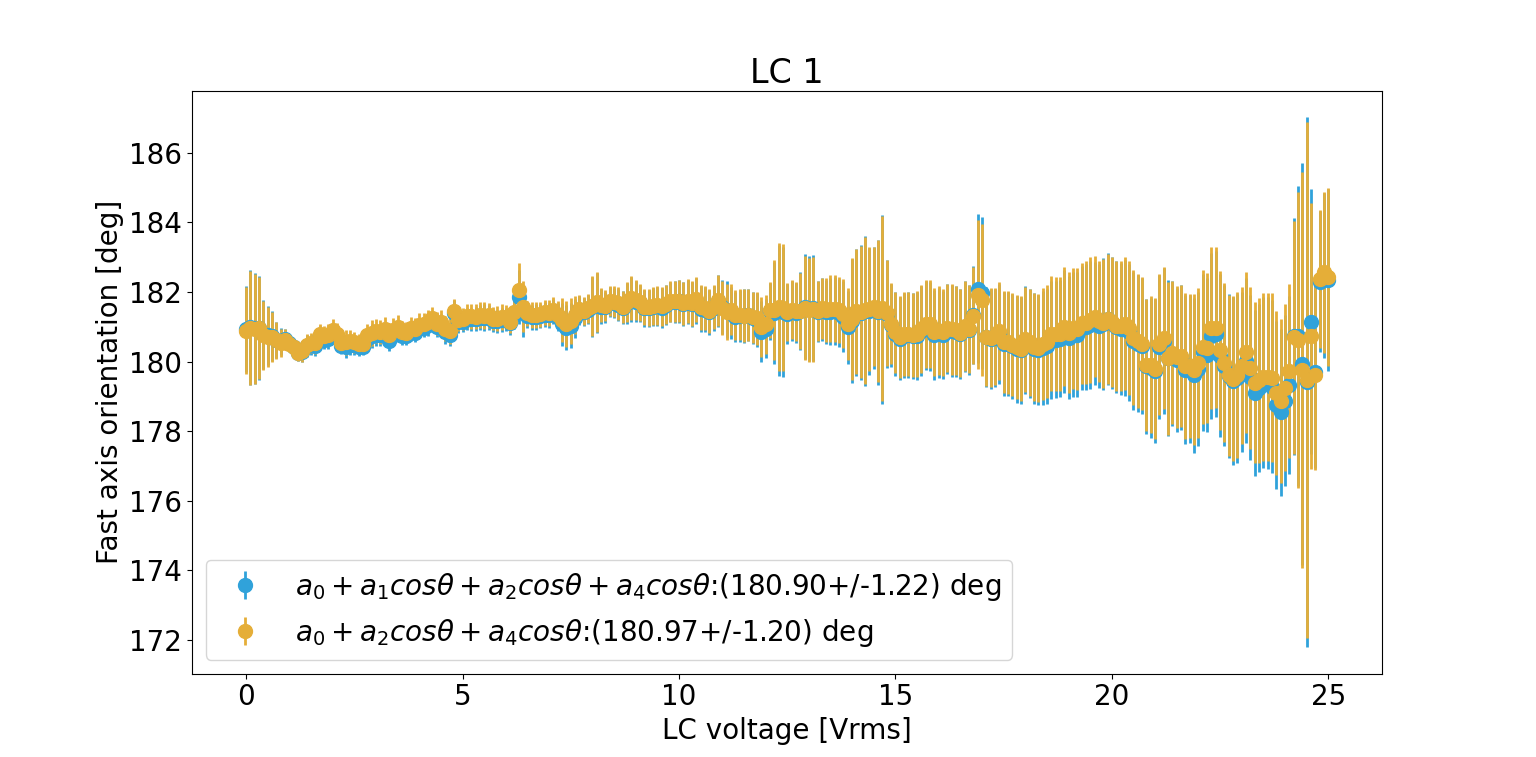
1. see elog 3242 for LC 1 fast axis. It was continuous (done in the PP(Parallel Polarizer) configuration)
2. see elog 3254 for LC 2 fast axis it was discontinuous.
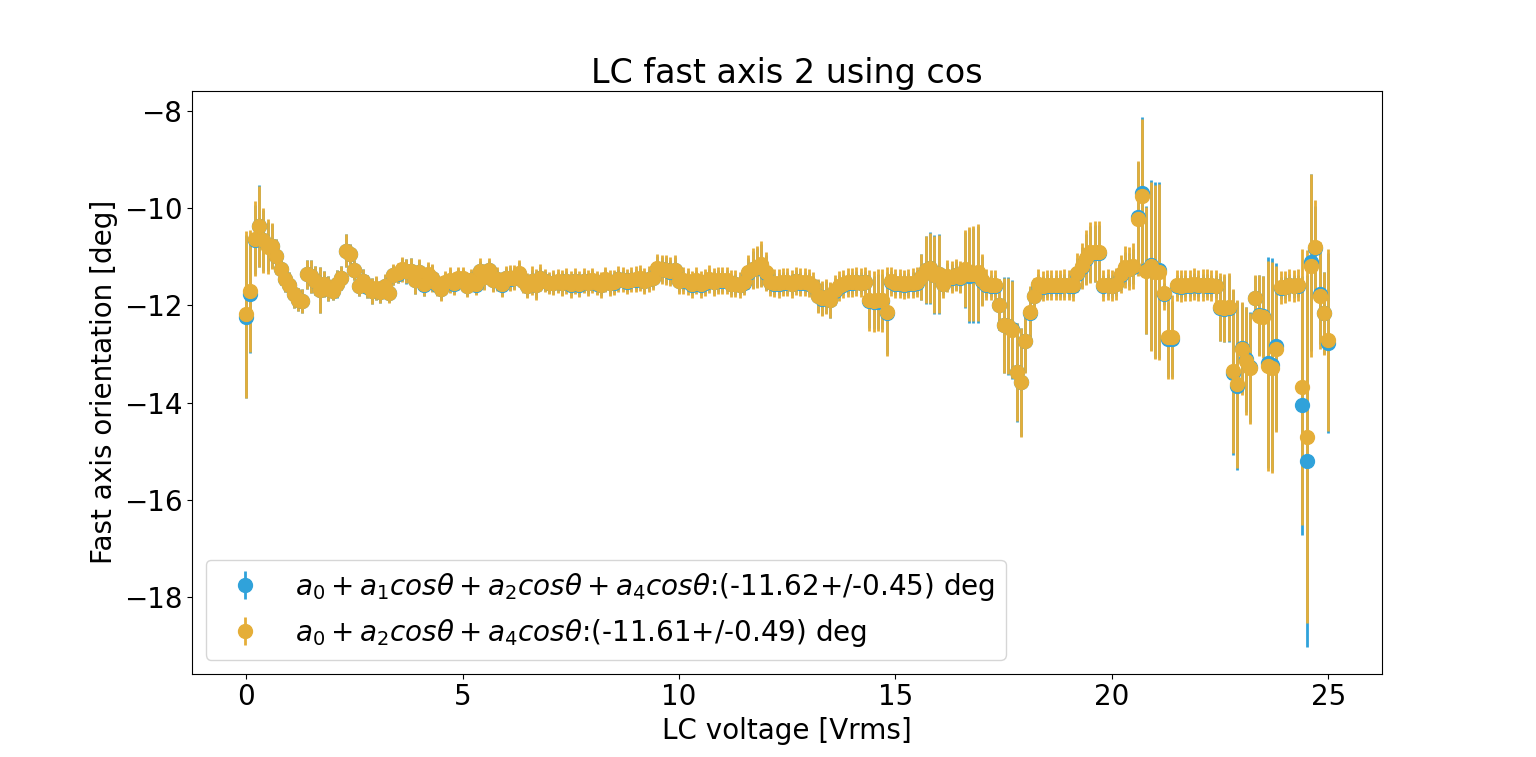
3. We did LC 2 measurements and found Fig 1 and Fig 2 using the CP(Cross Polarizer) technique. But we used the cos function to fit it and other mistakes that are addressed below. We see that even if we moved our LC(by -11.62deg ) it seems that the LC didn't rotate at all.
Mistakes we made

1. When using the fit equation the bounds of phase were given from -4 to 4. I have changed it from 0 to 2*pi.
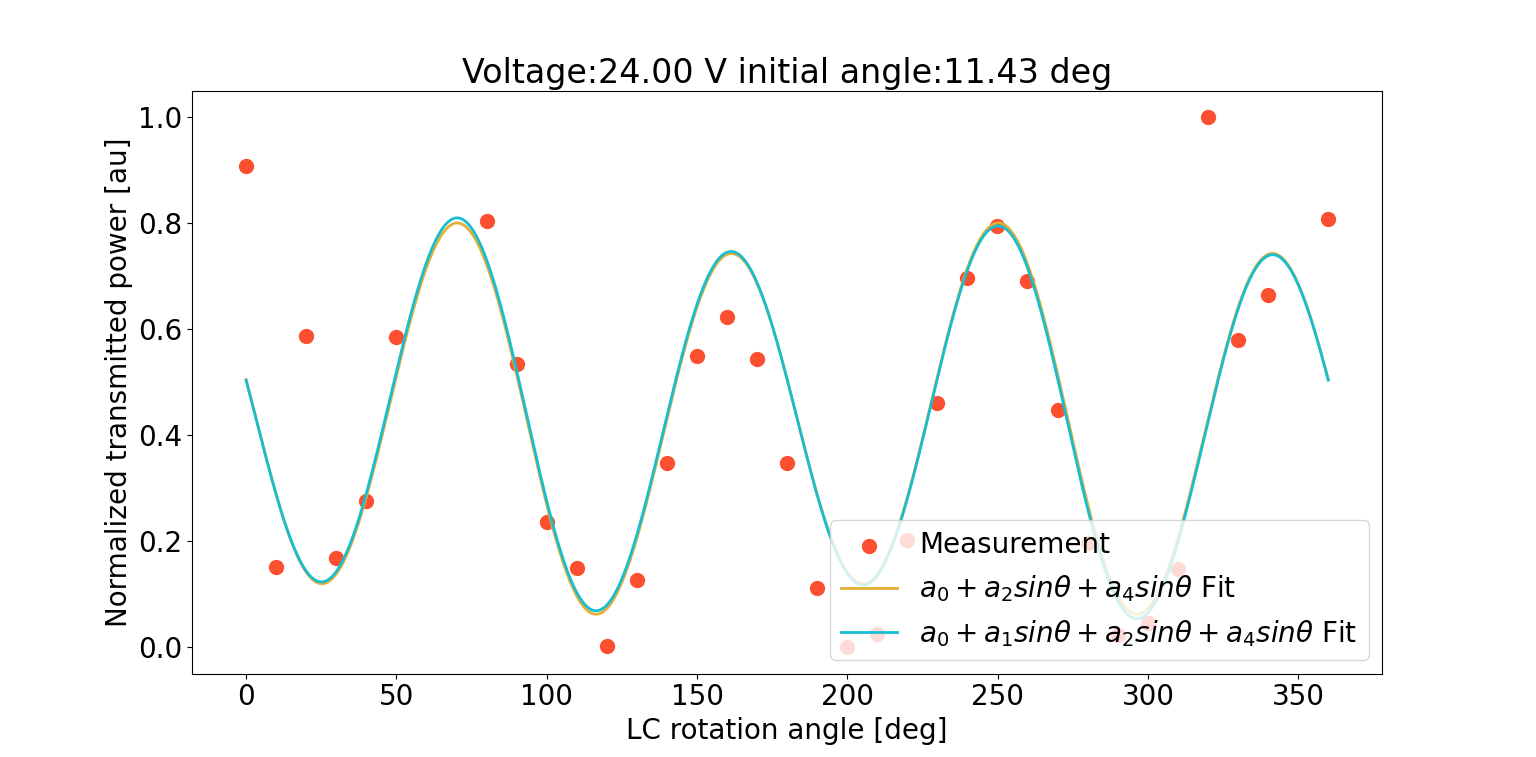
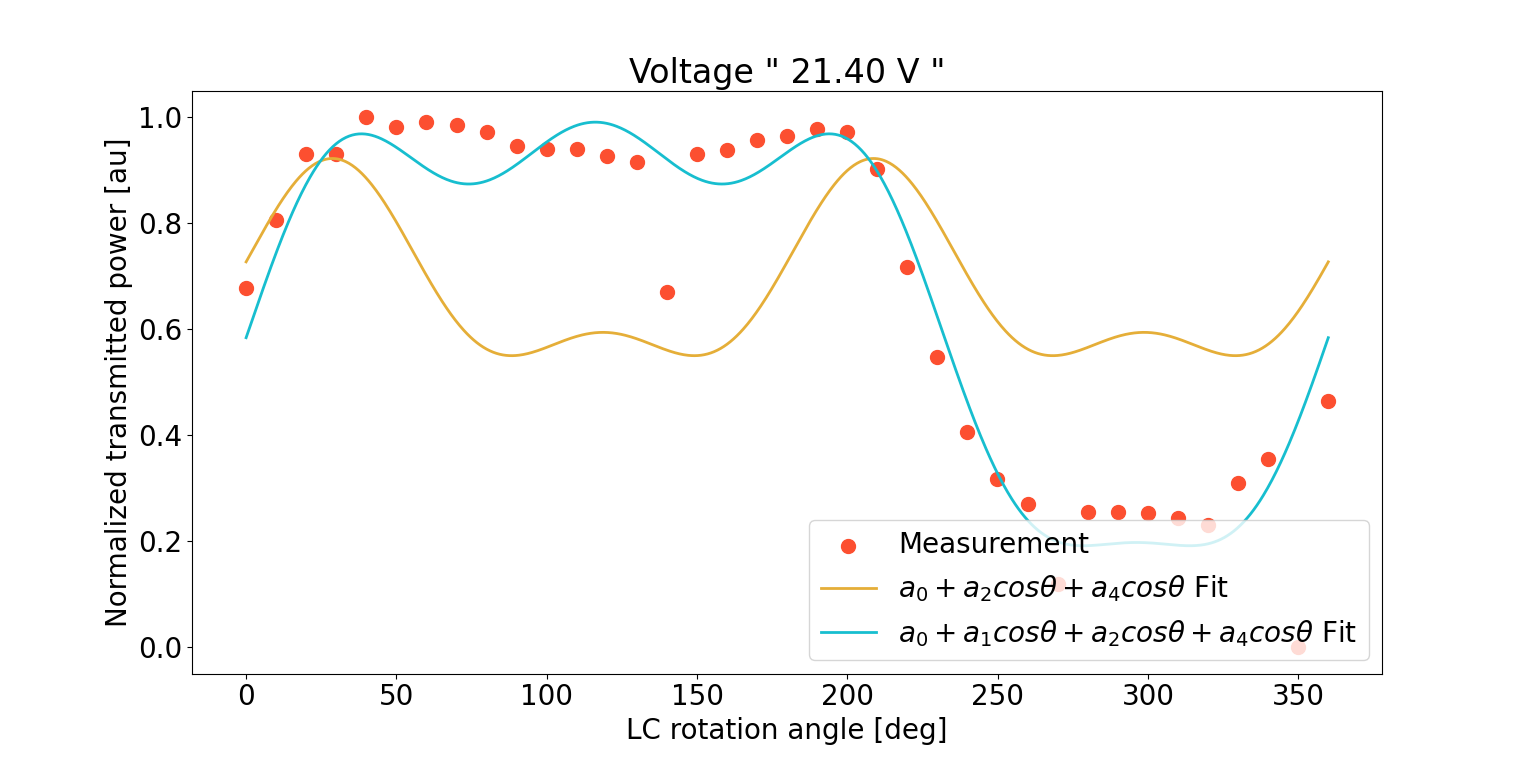
2. We should use the sine function to fit cross-polarizer data and cos for Parallel polarizer. This arises from the fact that we use power to understand the position of the fast axis. So if you observe data from these two techniques like power vs. rotation. It will be shifted.
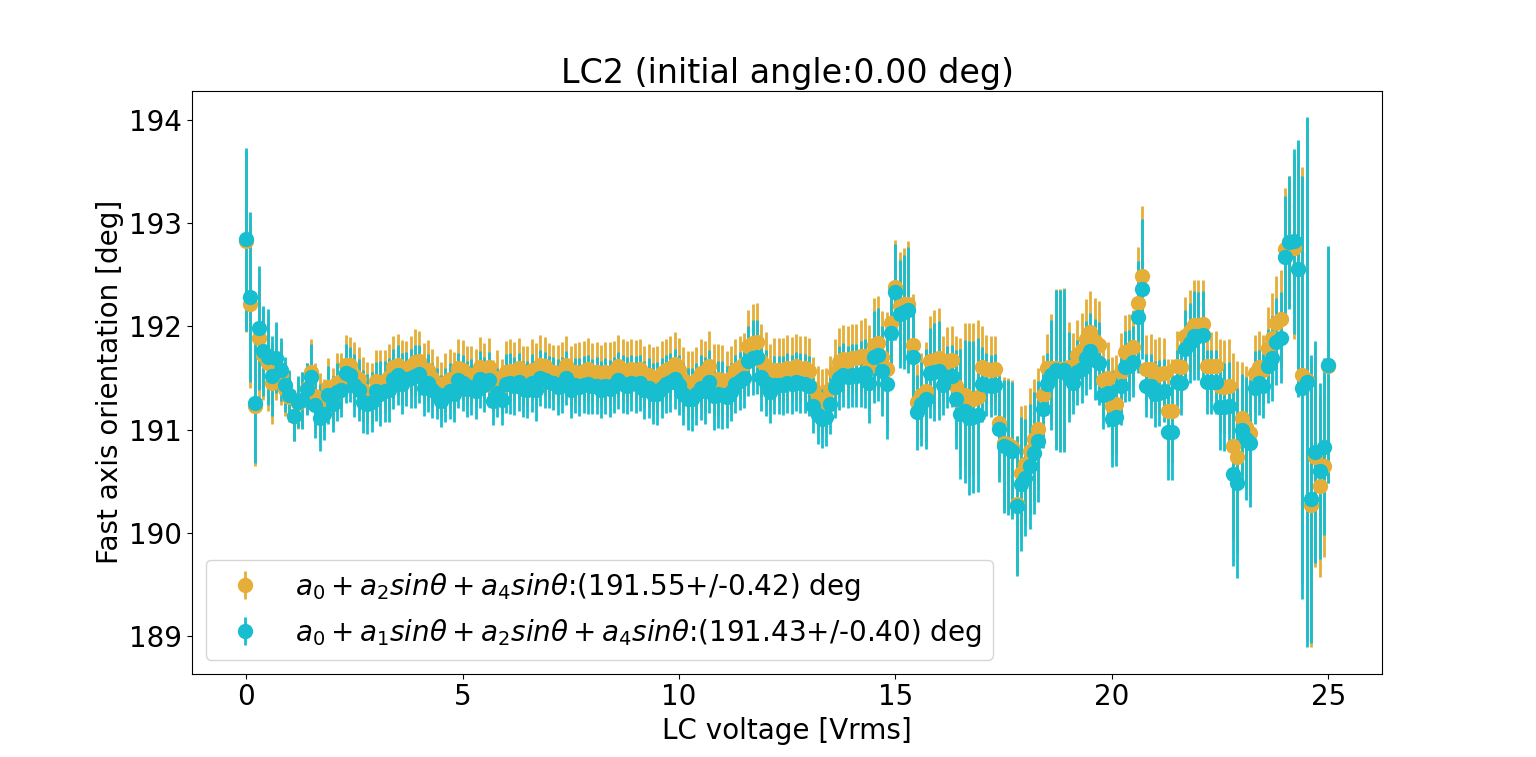
3. Now, let's compare Fig 1 and Fig 3 where CP data was fit using right parameters.
4. we also need to consider the initial angle where we start measurement both when observing power vs rotation and analyzing fast axis orientation. When I incorporated this we could exactly see how much were we rotating the fast axis or if we rotated in the wrong direction
5. So when we first did a measurement with CP (shown in Fig 1) (we had a lot of data points because we did it with a 10-degree resolution). But because we were using the wrong function to fit no matter how many times we did the measurement our data looked strange
6. When we shifted to PP after 4 sets of measurements, we did measure with less resolution and so it looked strange.
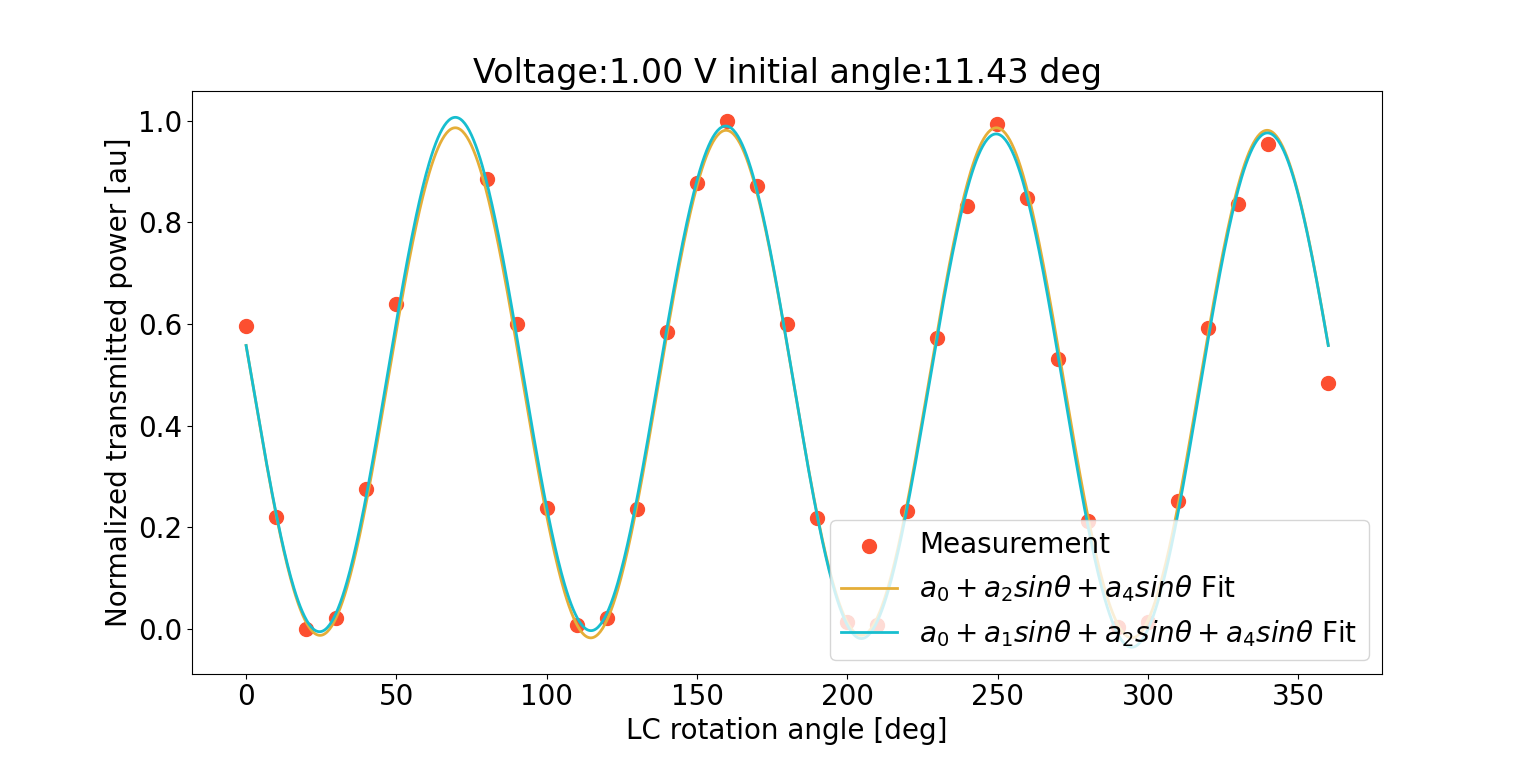
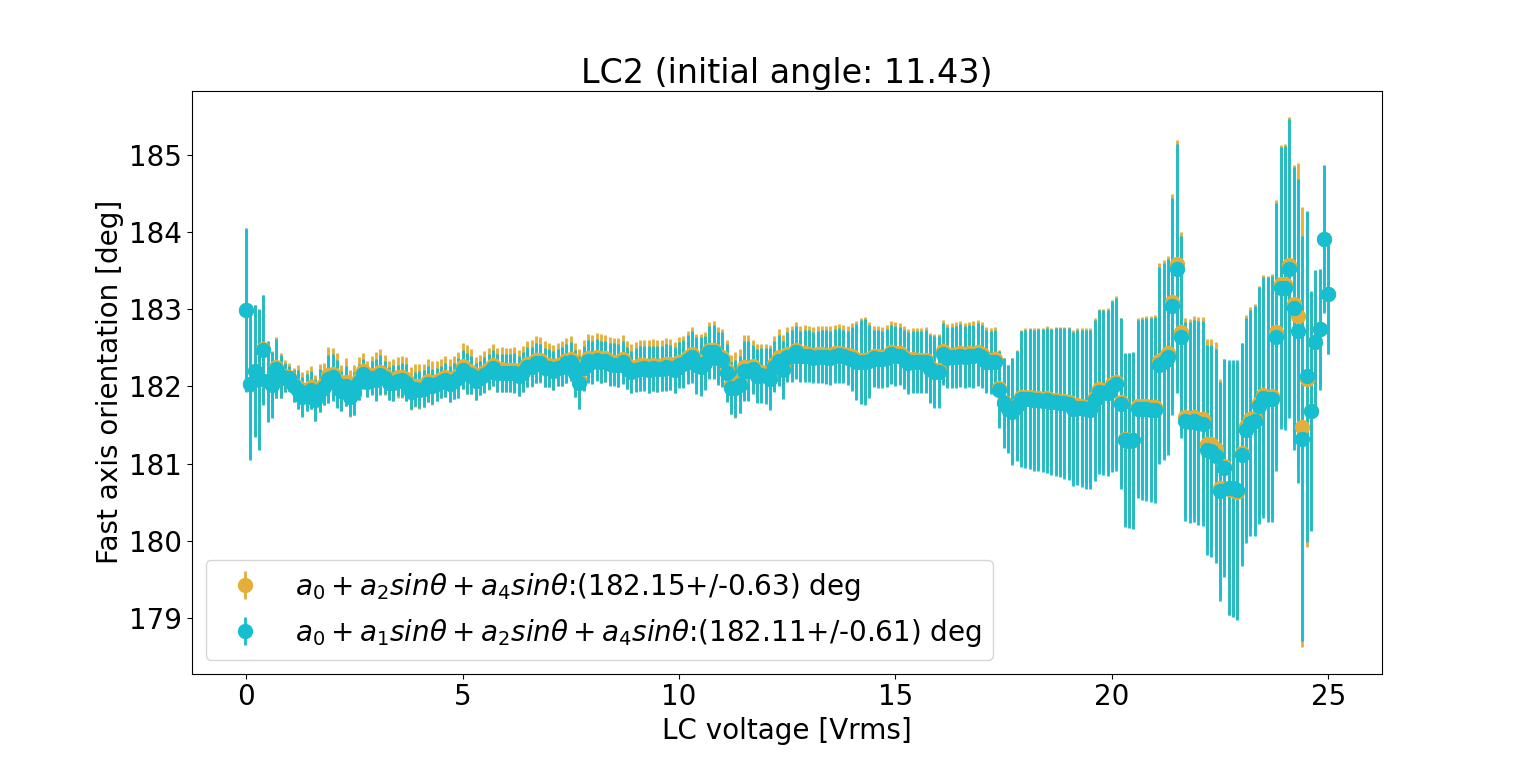
7. We can see from Fig 3 that we are supposed to move LC by 11.43 degree. so I moved LC and measured again to obtain Fig 4, Fig 5 and Fig 6.
8. Just to be sure that our new analysis is correct you can compare Fig 7 from elog 3242 for LC 1's fast axis.
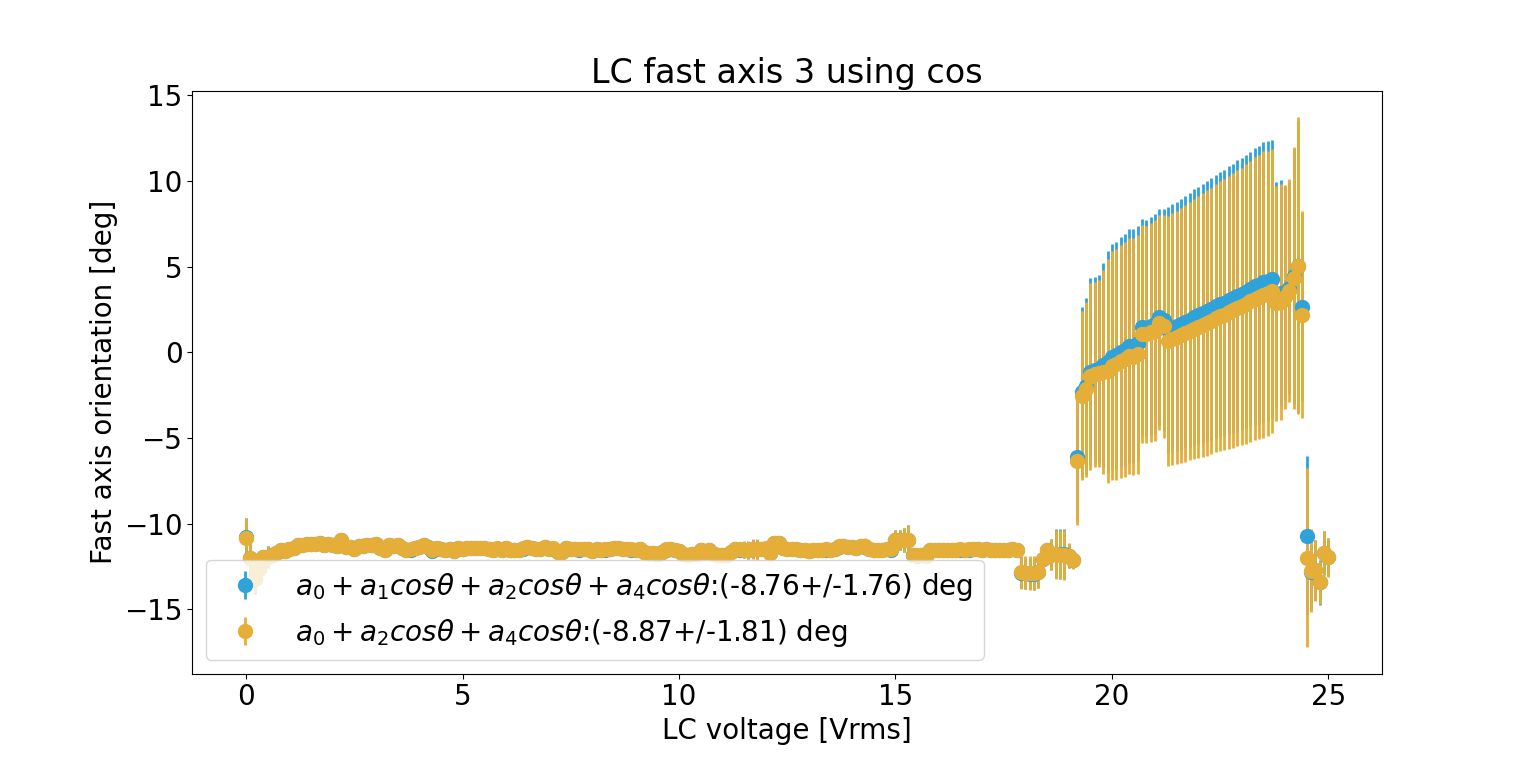
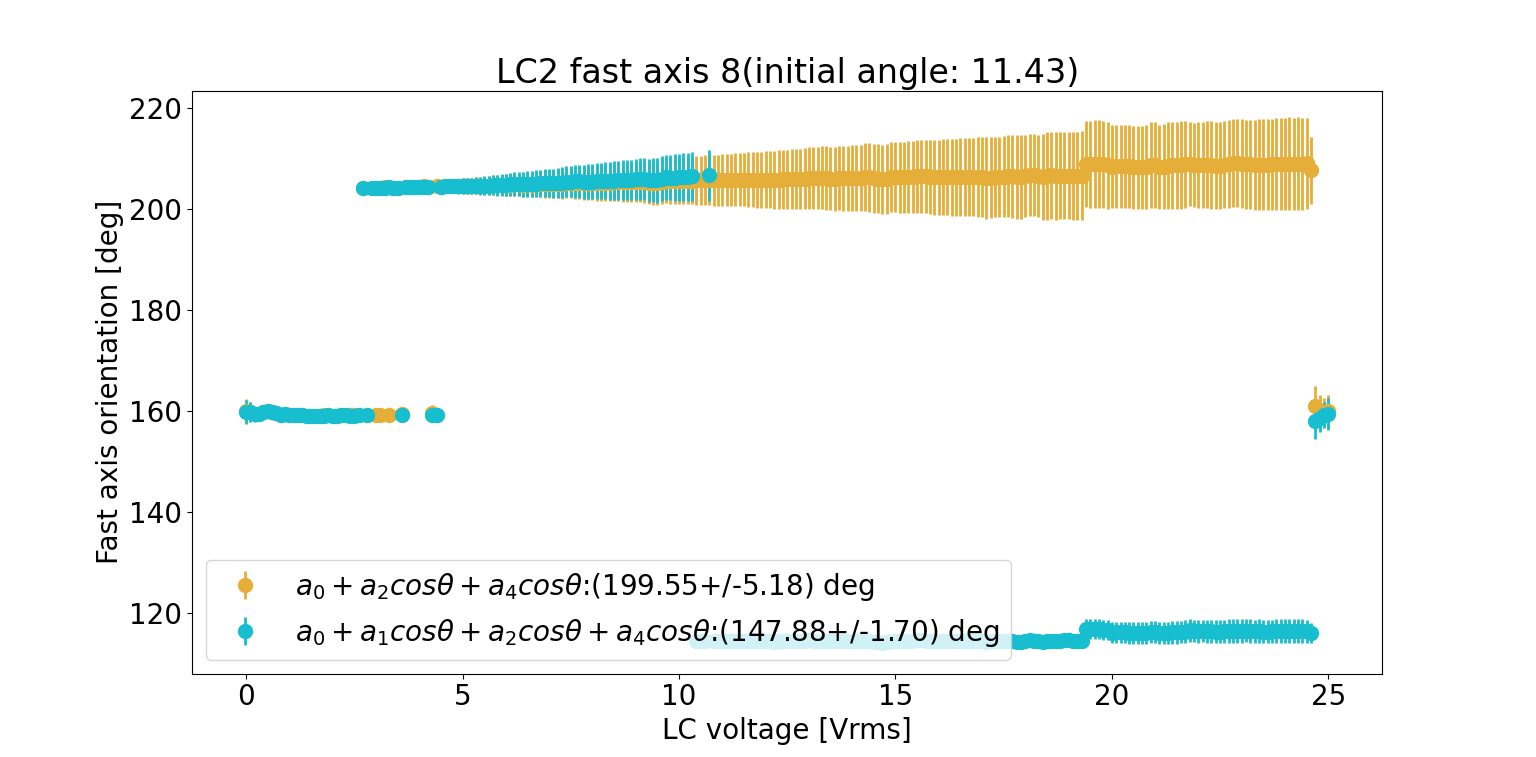
9. As a matter of fact, it's better to use CP for such measurements to see small changes too (because of small retardance range of LC at high voltage). See Fig 8 and Fig 9 for measurement done using PP. Although these measurements entailed the corrections during analysis, the data seemed strange enough to be considered.
Miscellanous:
1. some angles were omitted during analysis (likely because the LC cable caused disruption in beam and hence strange data). Also, this won't matter because we won't use these omitted orientations during characterization. Preferably the LC will be fixed along the fast axis
2. Moving on, the issue of temperature rising in LC was completely unrelated to the box or laser. It was due to us using tape to fix the wire so that it doesn't move and block the beam. This tension caused an elevated temperature of 26 deg even when the laser was off, the temperature controller was off and the box was lifted. The temperature was relieved as soon as I removed the tape!
for PP folder_name = r'C:\Users\atama\OneDrive\LC-Experiment\Measurement Data\LC2_calibration data\fast axis 8'
for CP folder_name = r'C:\Users\atama\OneDrive\LC-Experiment\Measurement Data\LC2_calibration data\fast axis 9'