NAOJ GW Elog Logbook 3.2
Displaying report 1-1 of 1.
YuhangZhao - 16:15, Wednesday 09 March 2022 (2866)
Comment to Test of Minicircuits M3SWA-2-50DRB+ absorptive RF switch (Click here to view original report: 2865)
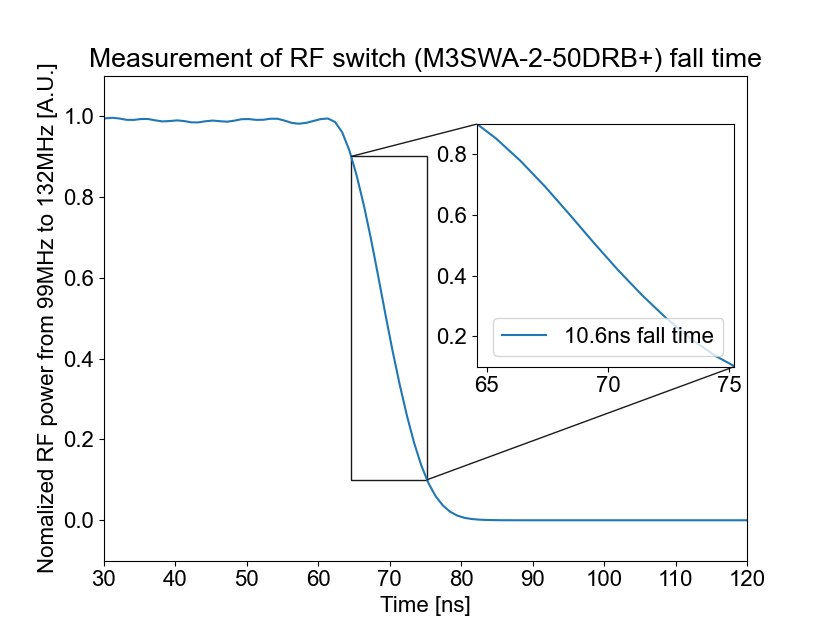
Taking the first 30ns of measurement data, I did a FFT analysis of the data and got a power spectrum density (PSD). Then the time span is shifted by 1ns several times to get the PSD evolution. In total, the 200ns data is shifted by 170 times to get the signal PSD change as a function of time. This is shown in attached figure one.
The FFT has a bandwidth of 33MHz (since I used 30ns to make a FFT). Because the RF signal has a frequency of 110MHz, I took the frequency span of 99-132MHz to check the amplitude of RF switch output.
From this analysis, the fall time, which is the time that signal drops from 90% to 10%, is 10.6ns.
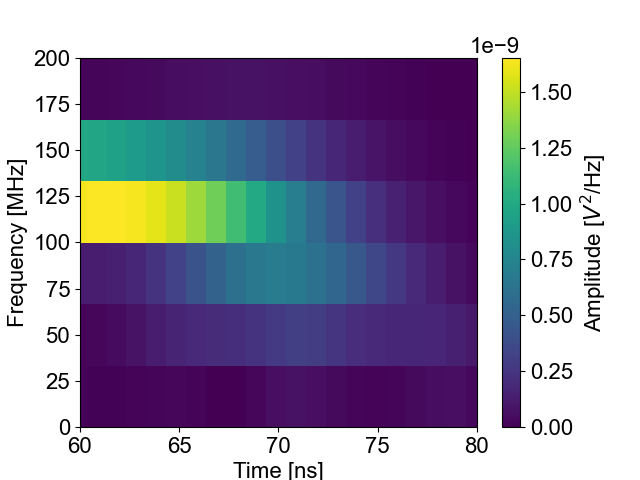
In addition, I also put a time-frequency-amplitude plot of this signal.
Images attached to this comment