NAOJ GW Elog Logbook 3.2

Abe, Marc
On Friday we inspected the spare viewport with a green light.
By eye it is really hard to see remaining stains but we could see few dust particles. We tried to remove them with an air duster but at least one remained quite close to the viewport center.
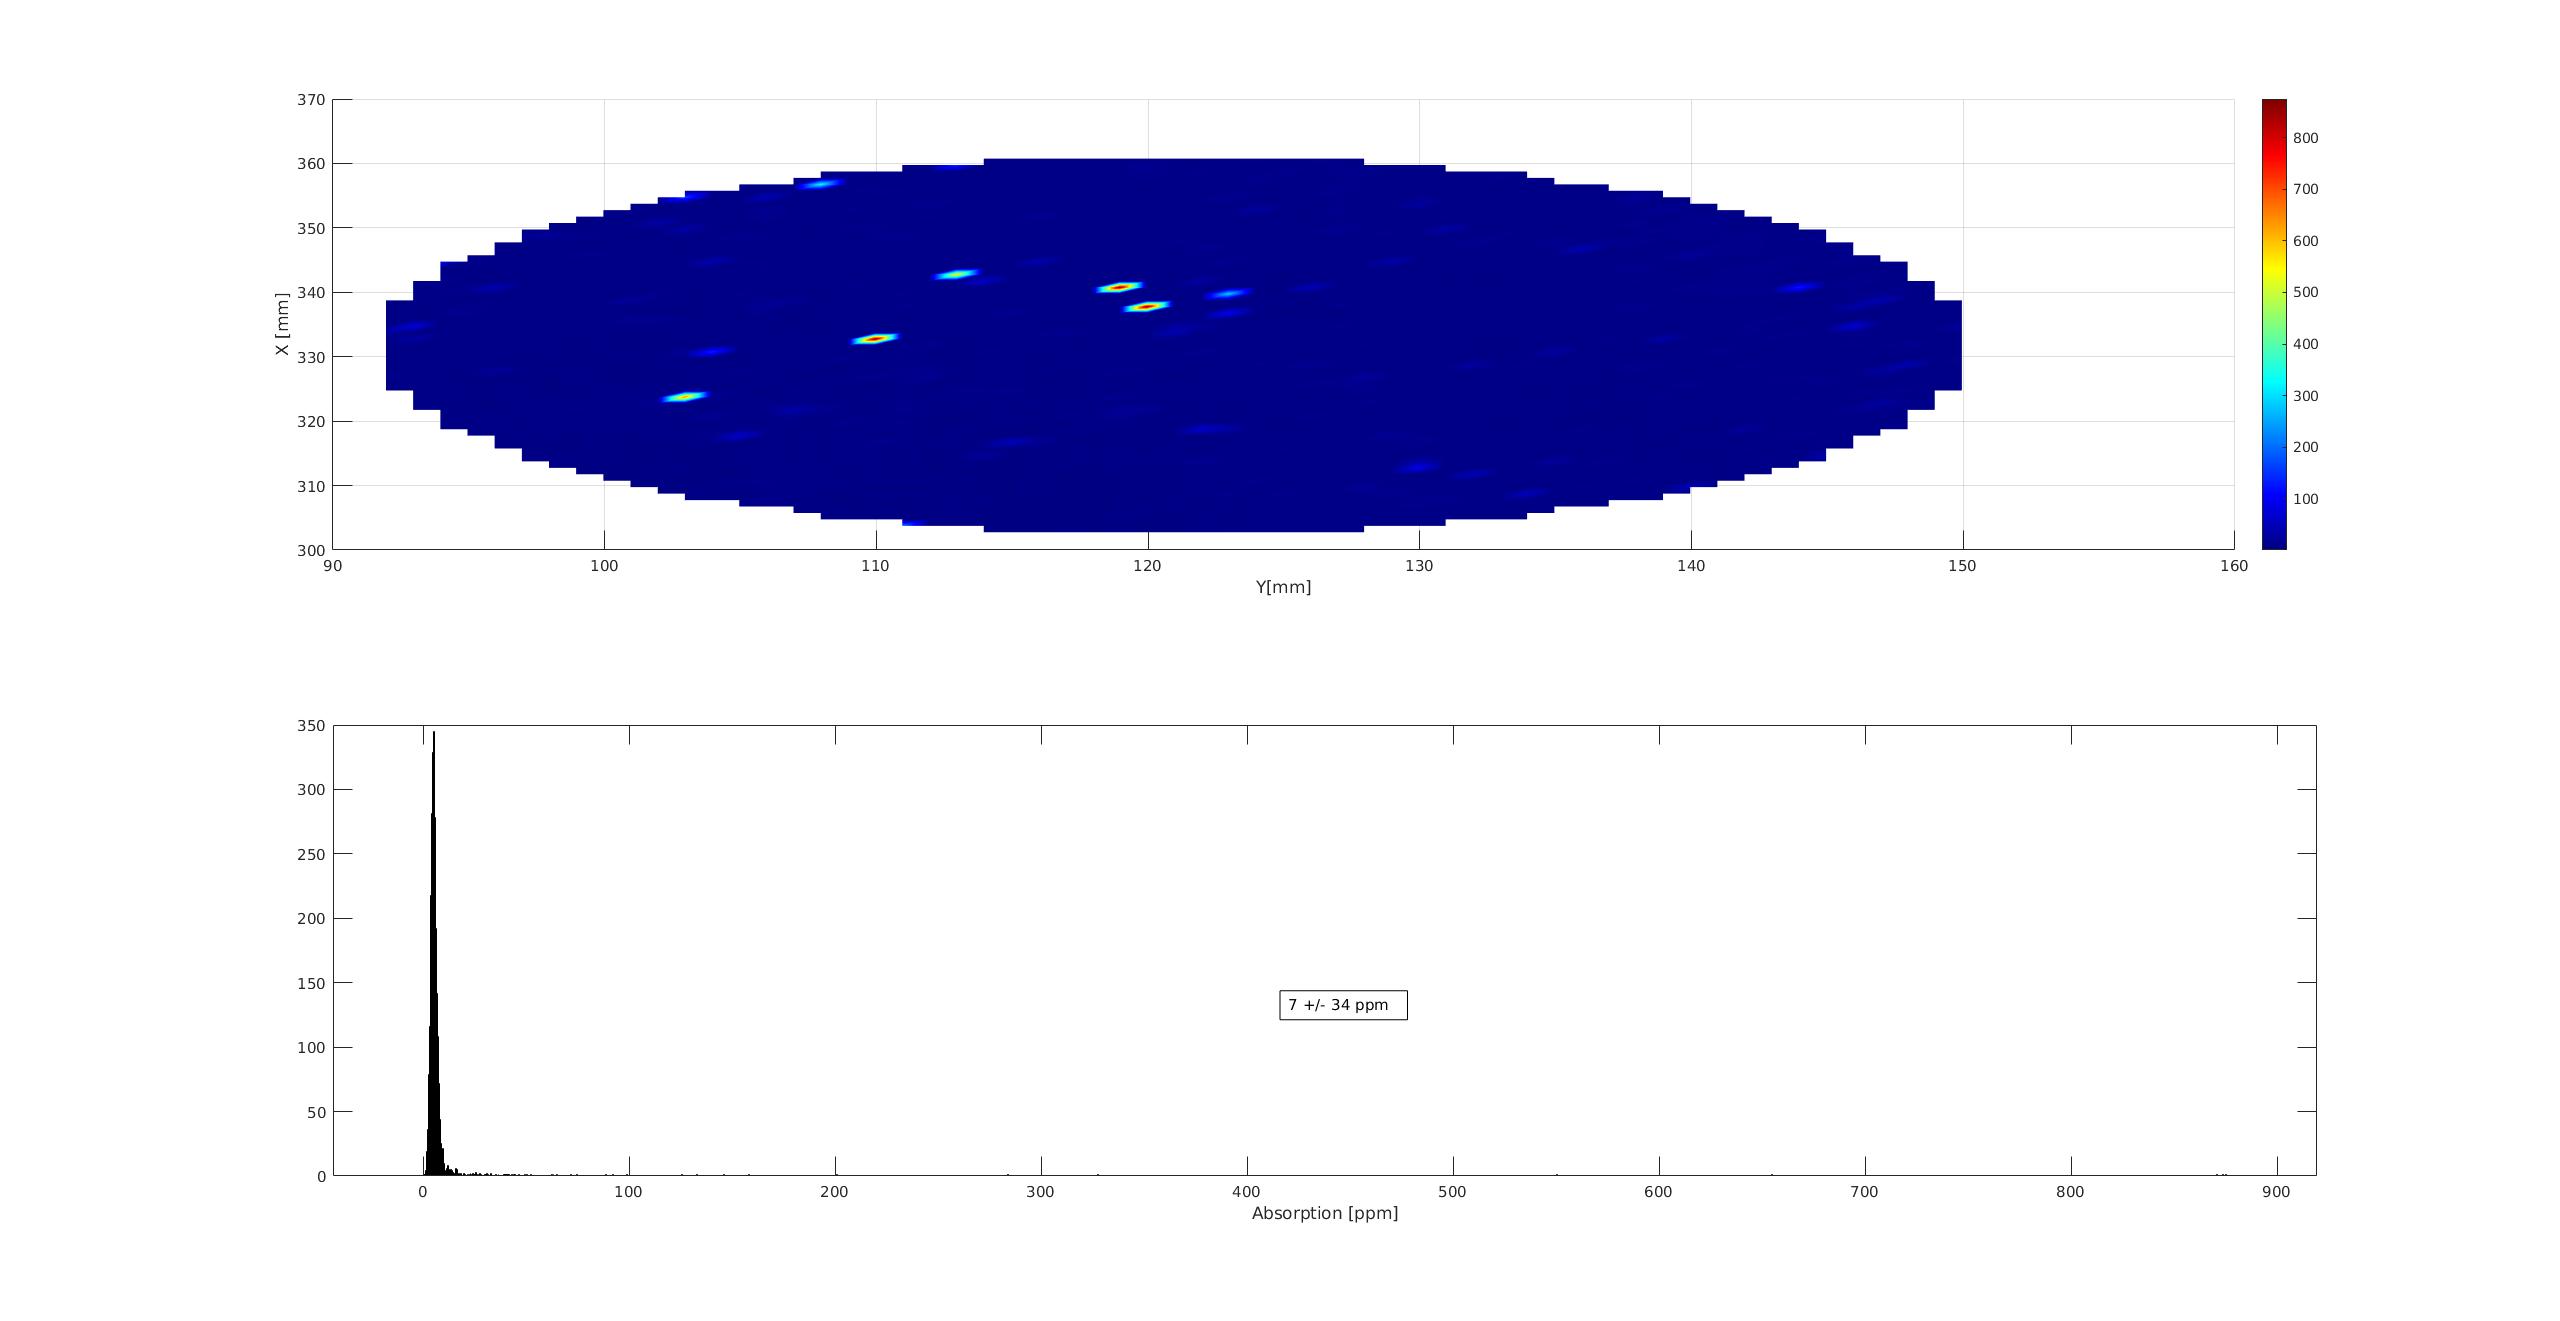
Then we started again absorption measurement (radius 30mm and step size 2 mm) looking carefully at the lockin saturation.
We used Pin = 0.0308 W (ie HWP = 39 degrees) and started with lockin sensitivity of 100 uV.
There was 2 positions with saturation : (X=349.8mm,Y = 125mm) and (X = 315mm,Y = 126.6 mm).
We increased the lockin sensitivity to 500 uV (still saturating) and finally 2mV where no more saturation was visible.
The absorption map with this last setting is reported in figure 1. We can see that the maximal AC value of these two spots is ~ 700 uV which corresponds to absorption of ~ 300 ppm.
With this low power, it is still not possible to see the absorption (except at the 2 dirty spots) so we increased the laser power to Pin = 90.6 mW (HWP = 41 degrees) and sensitivity to 5 mV.
Still no absorption visible.
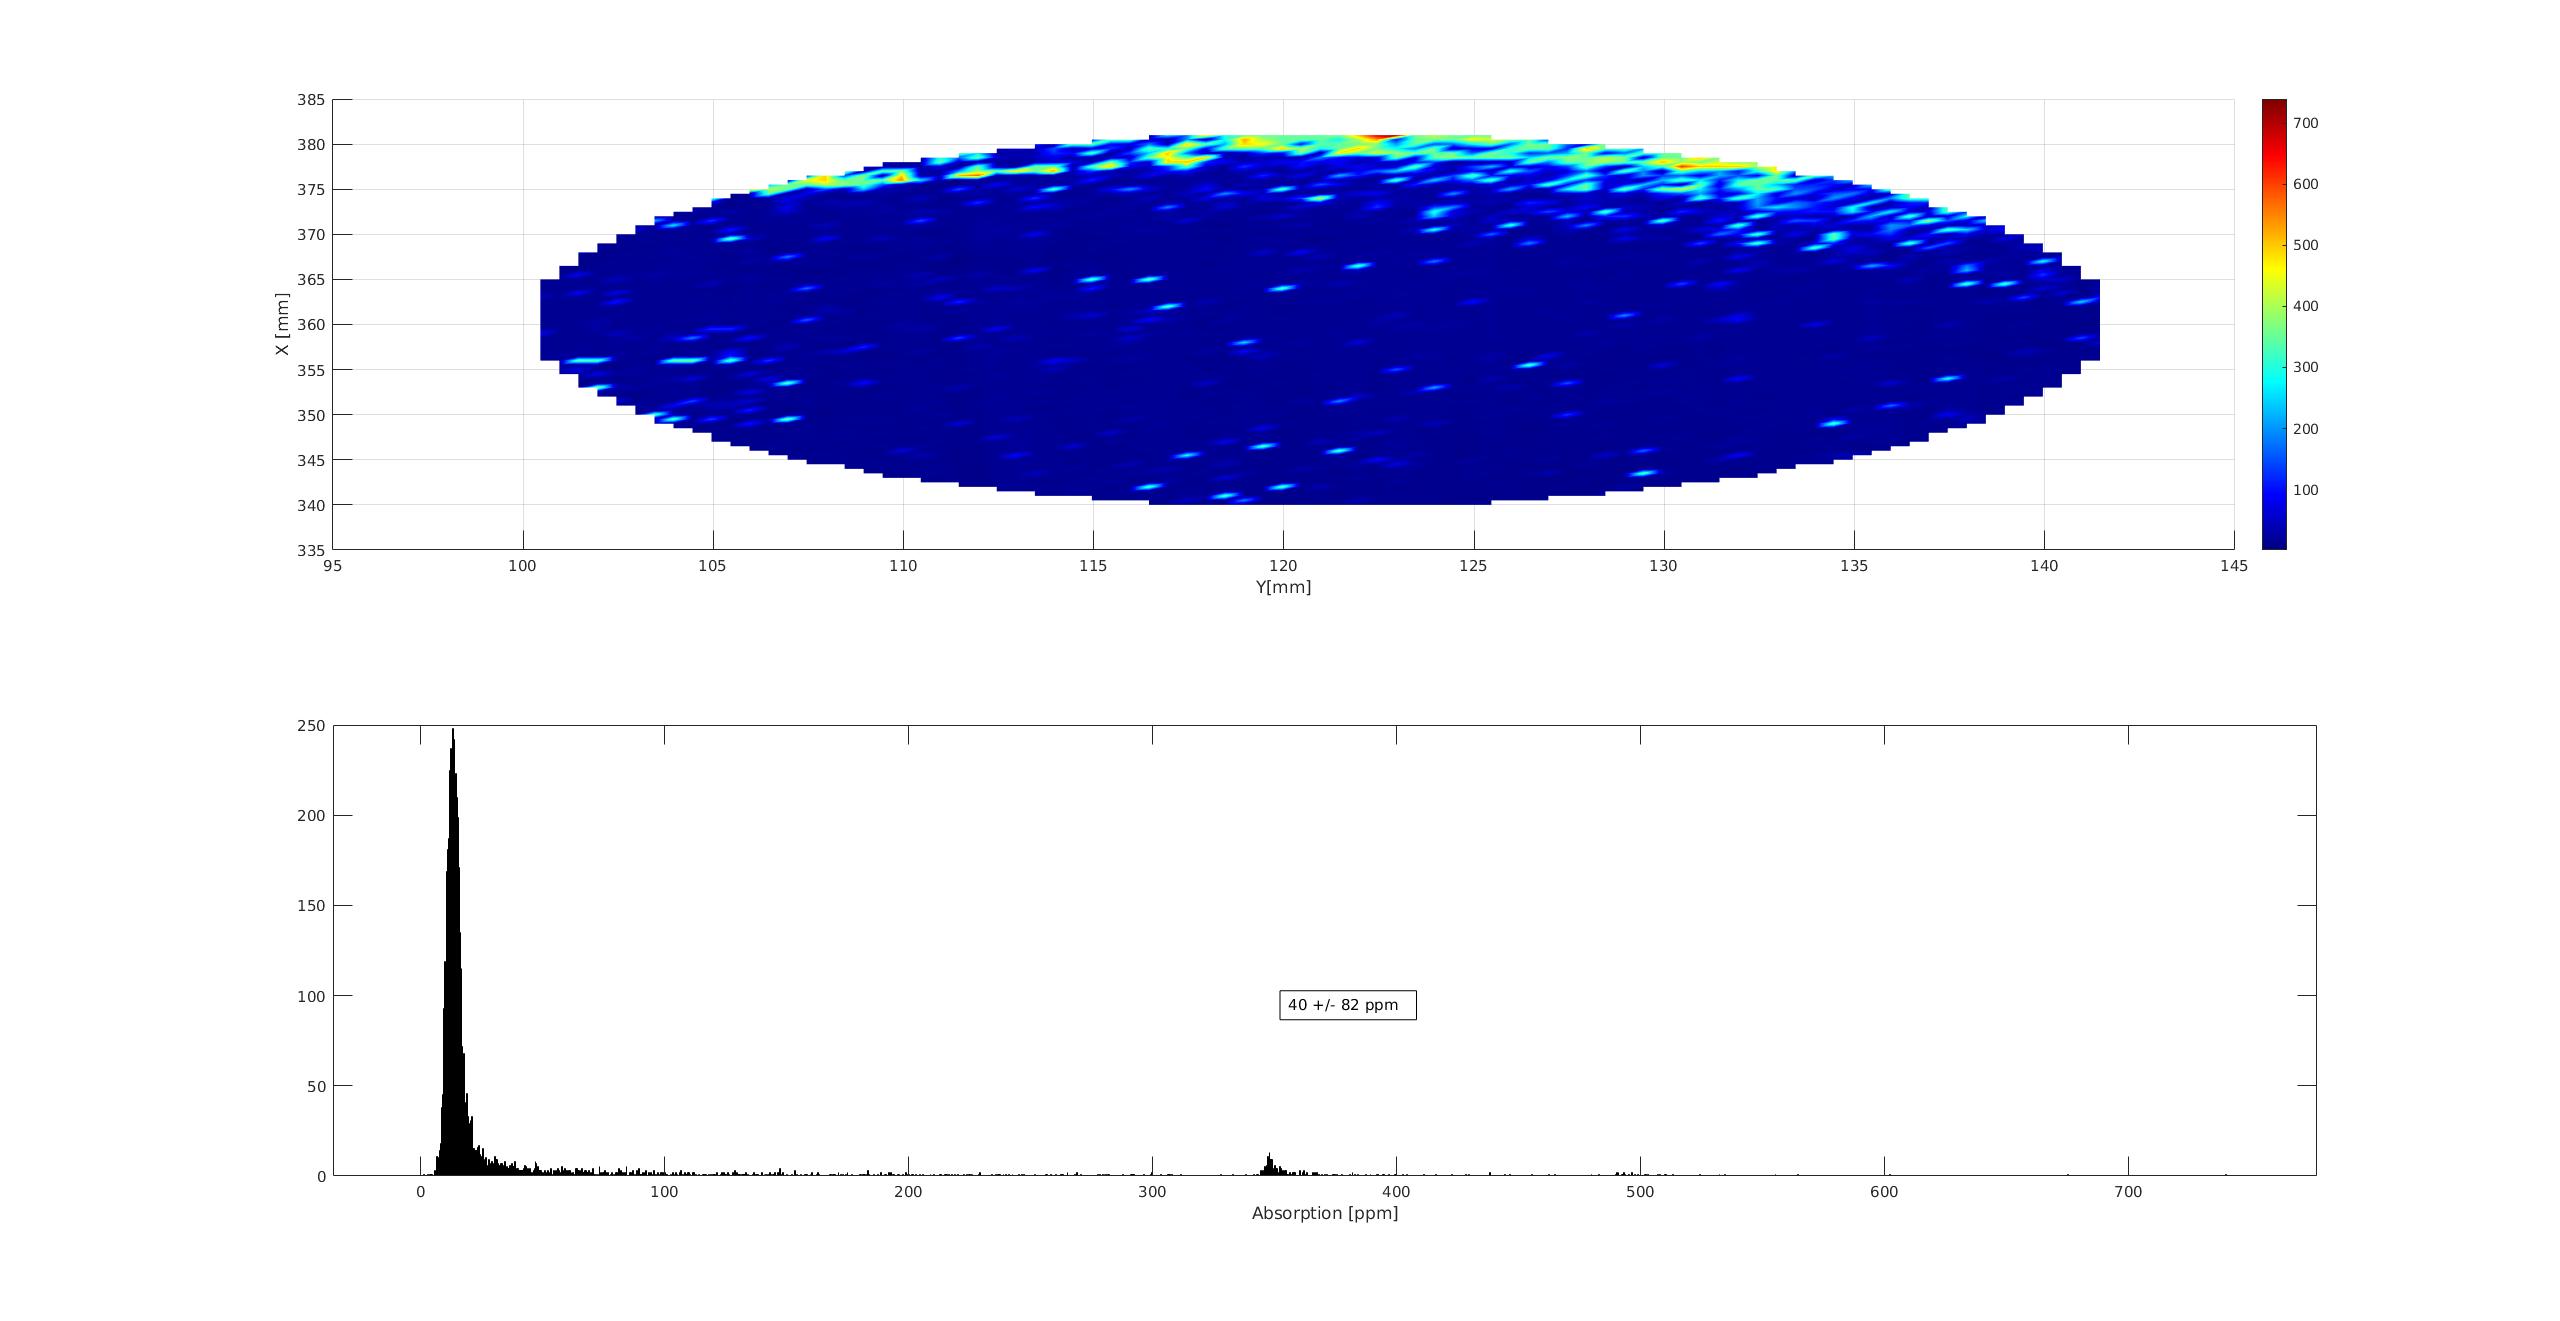
We are not sure how to estimate the 'damage threshold' of this dust so we decided to take absorption measurements slightly shifted (X_center = 360.5 mm) with a smaller radius (21 mm) in order to avoid these dirty spots. We increased the laser power to Pin = 0.2392 W (HWP = 44 degrees) and sensitivity = 20 mV.
This absorption map is reported in figure 2.
We can see higher level of absorption at the edge of the map which corresponds actually roughly to 1 cm of the edge of the viewport.
This is reasonable if the cleaning was not performed at the edge of the viewport.
For further measurement, we would need to reduce further more the map radius to be sure to avoid burning the stains.
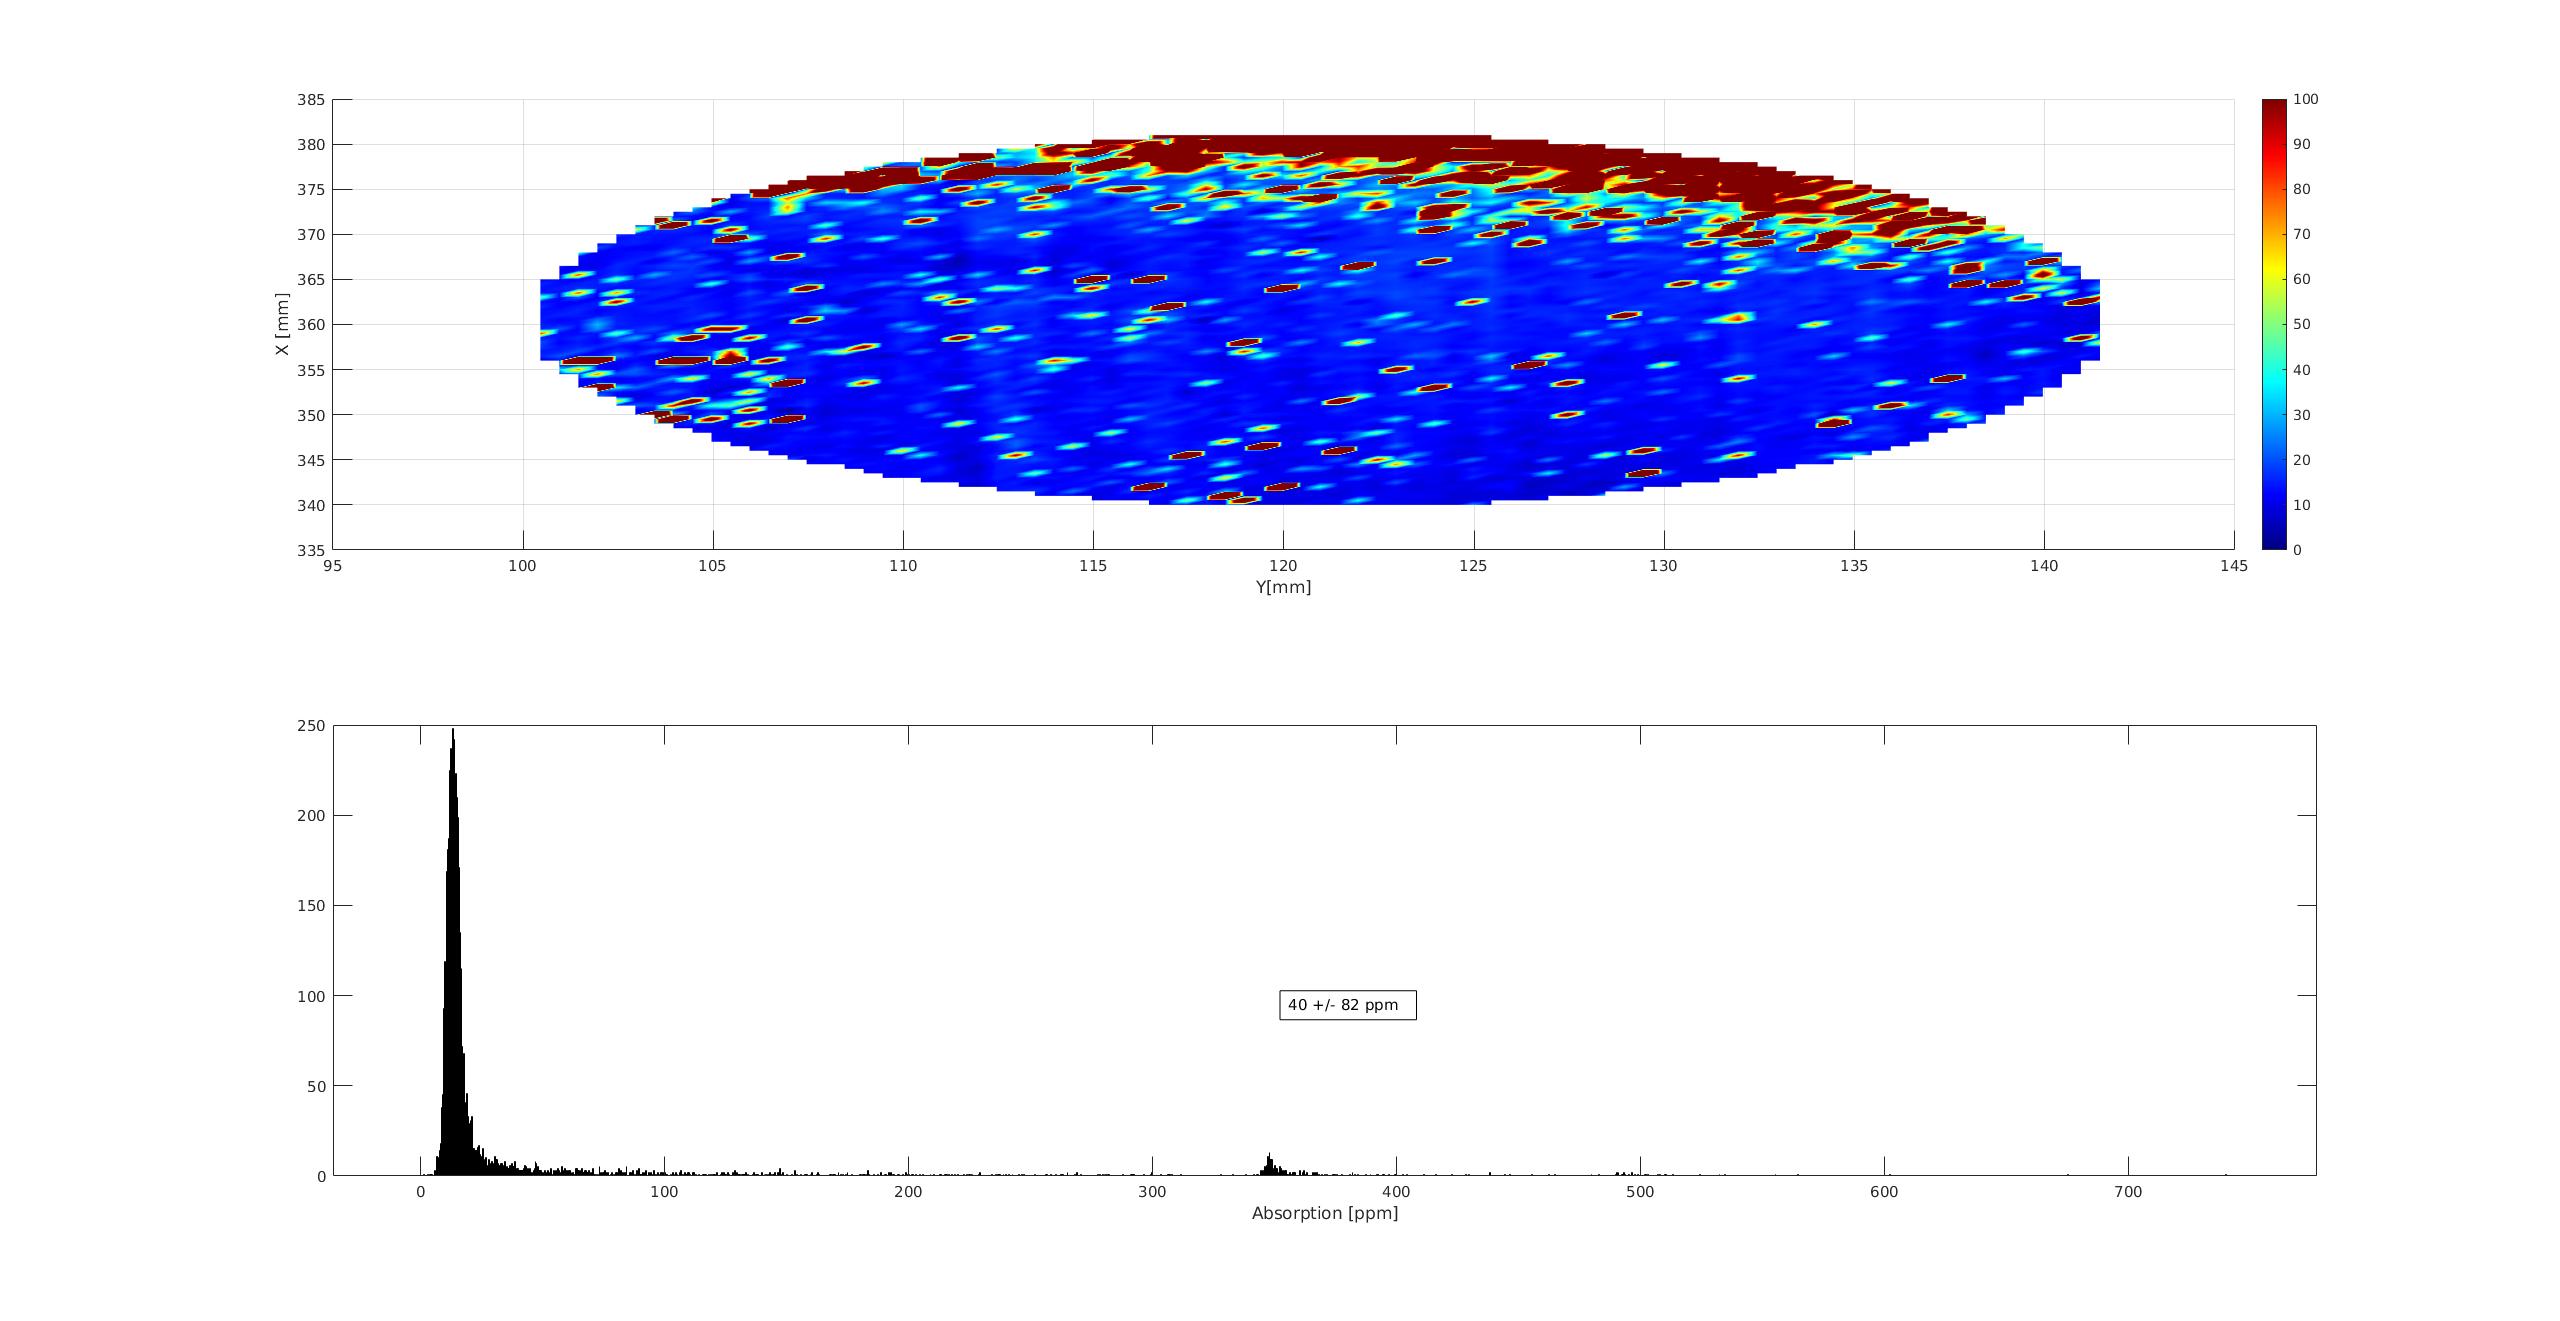
However, as seen in figure 3 (same measurement as in figure 2 but with constrained colorscale limits), there seems to be absorption spots with absorption > 100 ppm appearing in this area..