NAOJ GW Elog Logbook 3.2

Abe, Marc, Matteo
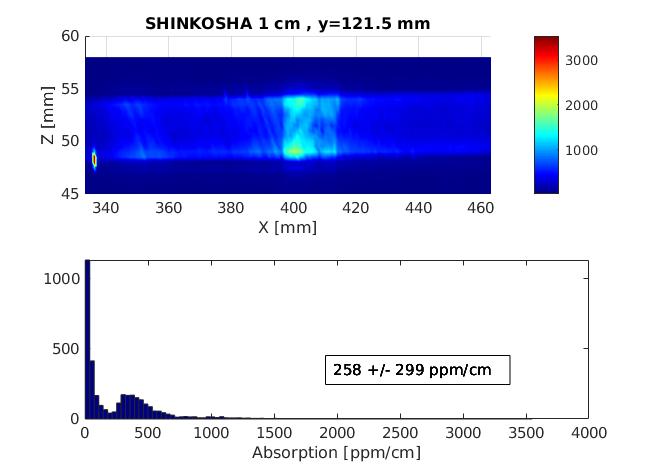
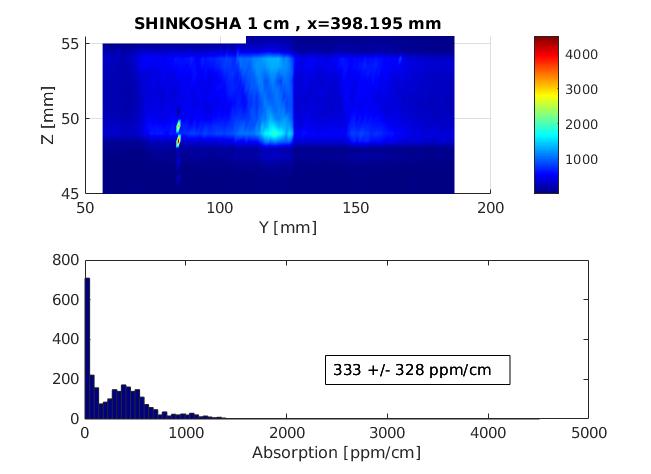
Following the measurement of the absorption map at z=51.4 mm, we performed 2 others map in the XZ and YZ planes.
They correspond respectively to figure 1 and 2.
An important point to notice is that there seems to be a point absorber on the surface that distorts the absorption scale (up to 4000 ).
We decided to turn off the ir laser just in case.
Anyway looking at the histogram, it seems that the nominal absorption is around 400 ppm/cm (more precise analysis to come).
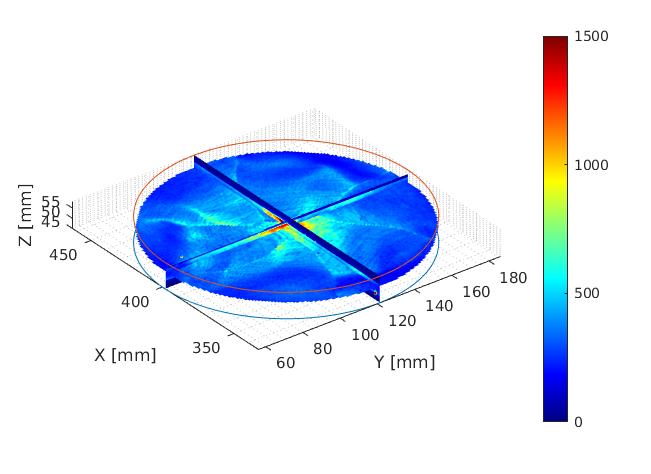
In figure 3 you can see a combination of the 3 maps where the colorbar scale has been limited to the maximum of the circular map (ie 1500 ppm/cm).
Marc, Matteo, Yuhang
We used the green light to check possible dust on the mirror and took a picture after already using the air dust once.
The mirror is really dirty...
We then used again the air dust and could remove most of the large dust particles but not the smallest one (not visible on picture so no 'after picture').
We can still see the ethanol/acetone trace at the mirror edge so the mirror got dirty either during shipping or during the few weeks it stayed inside the clean room without cover.
We will clean it with first contact after the golden week.
Nice results!
It seems that Shinkosha still has its main feature: the prominent spider-web absorption.
But the absorption is really high this time.
Thank you.
I have updated the absorption value using the bulk calibration measured just after removing this sample (see elog 2480) and the corrected absorption is 302 +/- 108 ppm.
Abe, Marc
We modified the analysis to better estimate the mean and standard-deviation of absorption measurements.
The corrected results are attached to this entry.
Today I will remove the first contact that we applied on this sample and cross-checked if it affected the absorption measurement.
I have some questions.
What is the meaning of the fit in the histograms? Do you have a reason to fit with specific distributions/densities or do you want to find a systematic pattern?
The absorption distribution is fitted with 2 normal distributions.
I thought it could be useful for the case of XZ and YZ maps (where there are measurement points outside the sample) because it allows to remove the effects of absorption outside the sample and point defects/dust on the surface.
But I agree that it might not be the most suitable distribution, especially for the shinkosha samples...