NAOJ GW Elog Logbook 3.2

Matteo, Eleonora
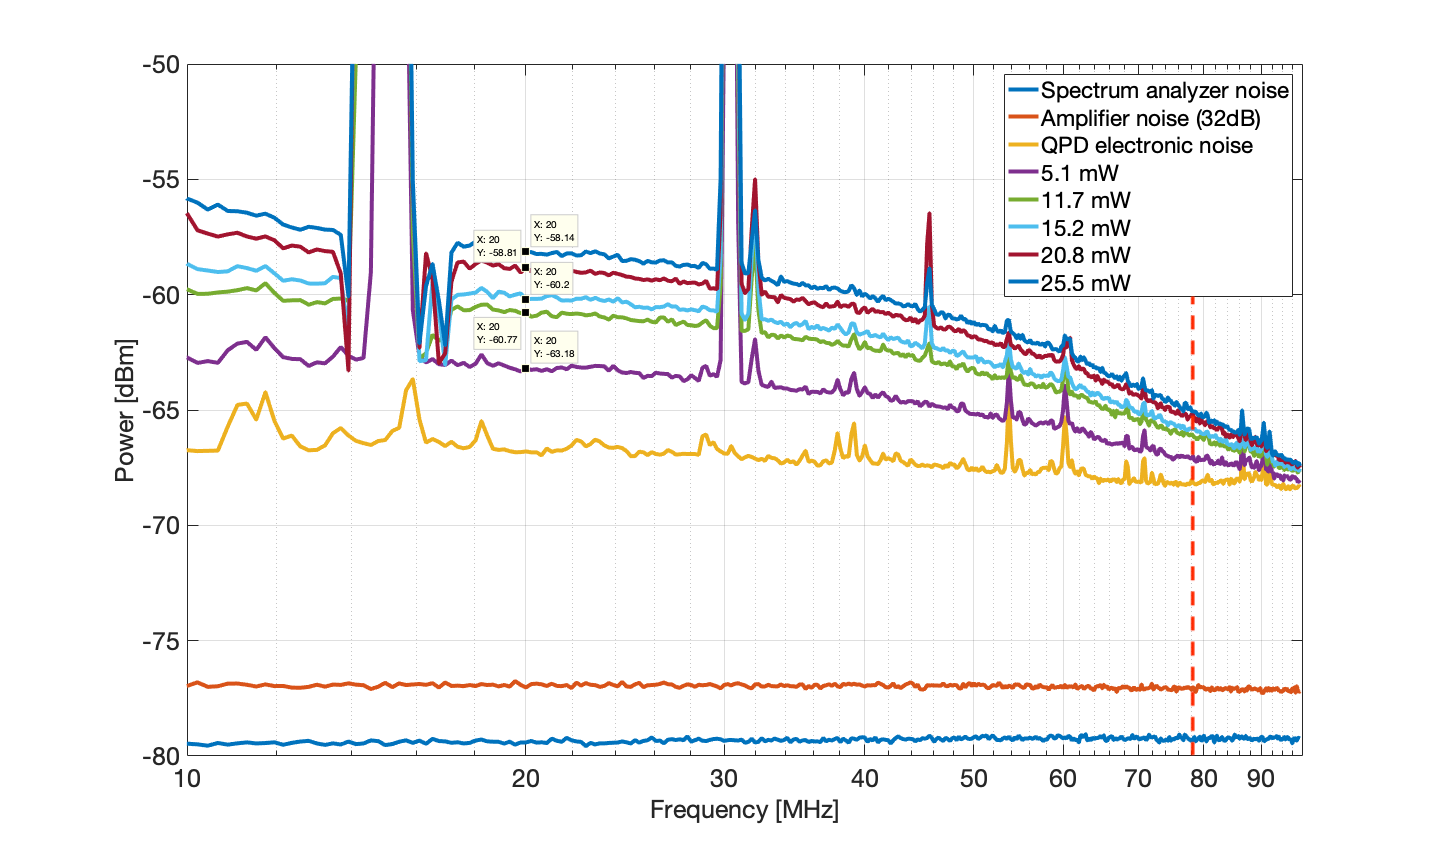
We put a reflective mirror after green FI so that the light is reflected back to the QPD2 using the standard path. The power was changed acting on the AOM modulation amplitude. 78MHz and 87.6 MHz modulation are switched off.
Pic 1: RF output of QPD2 Seg 1 in with different power level.
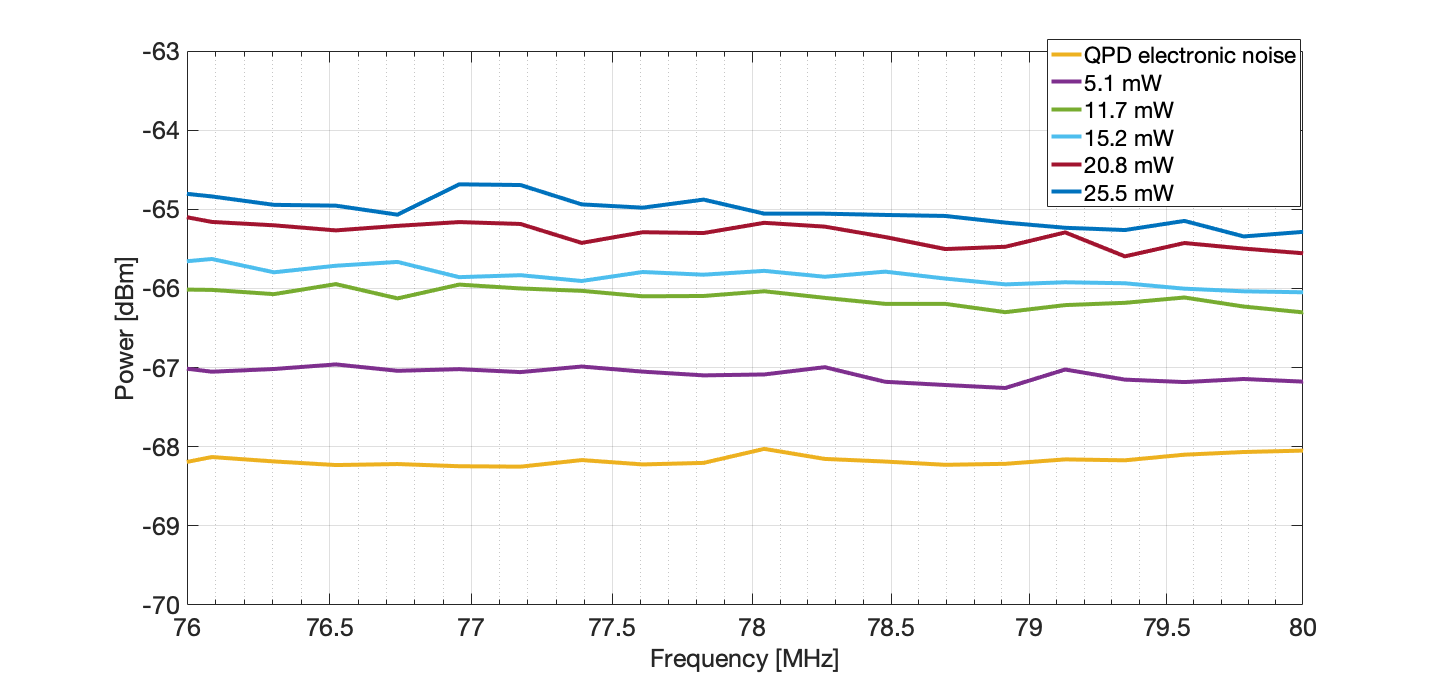
Pic 2: Same of Pic 1 but zoomed around 78 MHz.
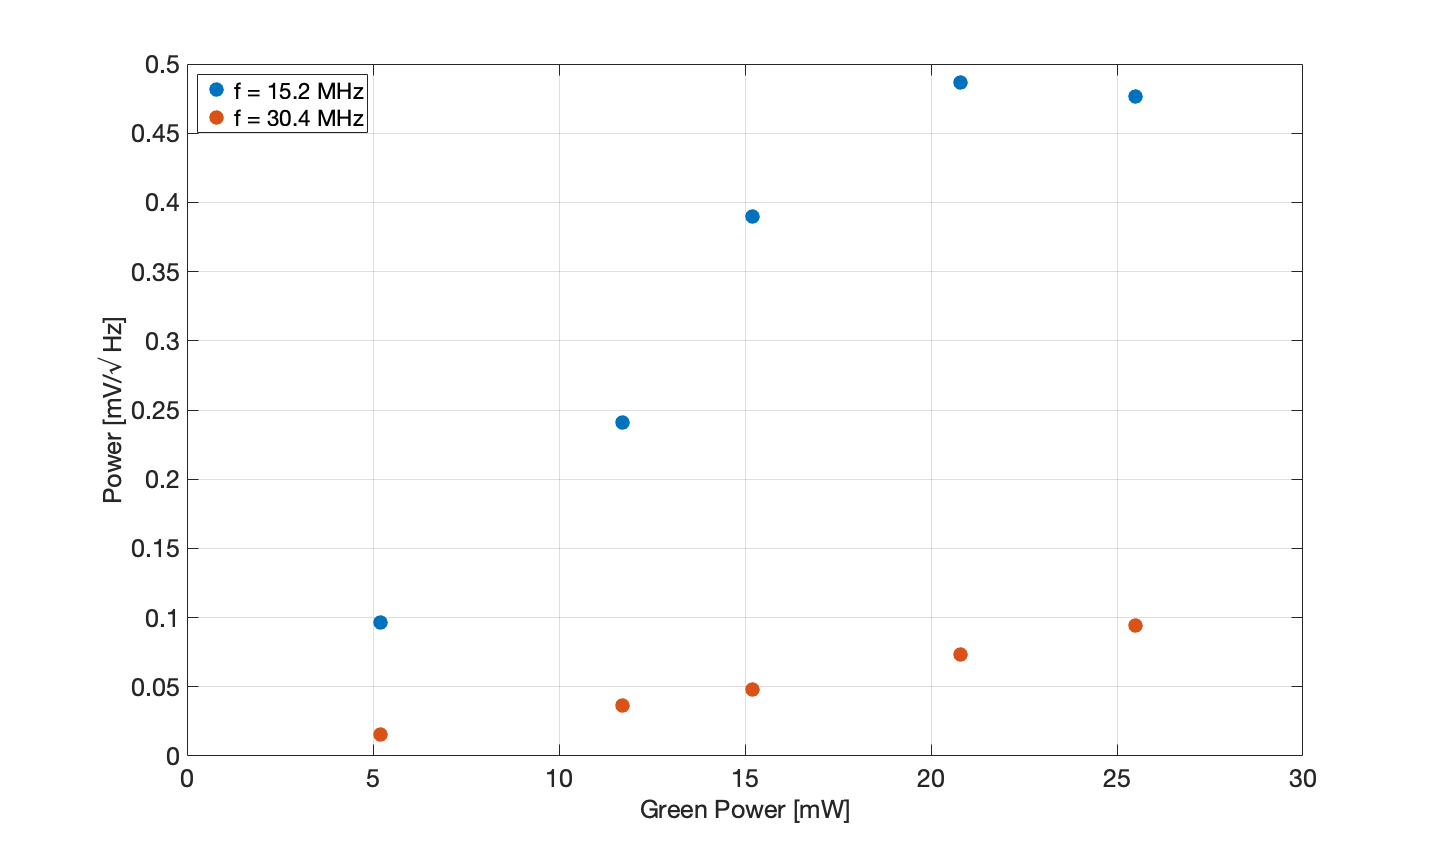
Pic 3: Peak height at 15.2MHz and 30.4 MHz as a function of the green power. (This is a real signals come from PDH of SHG)
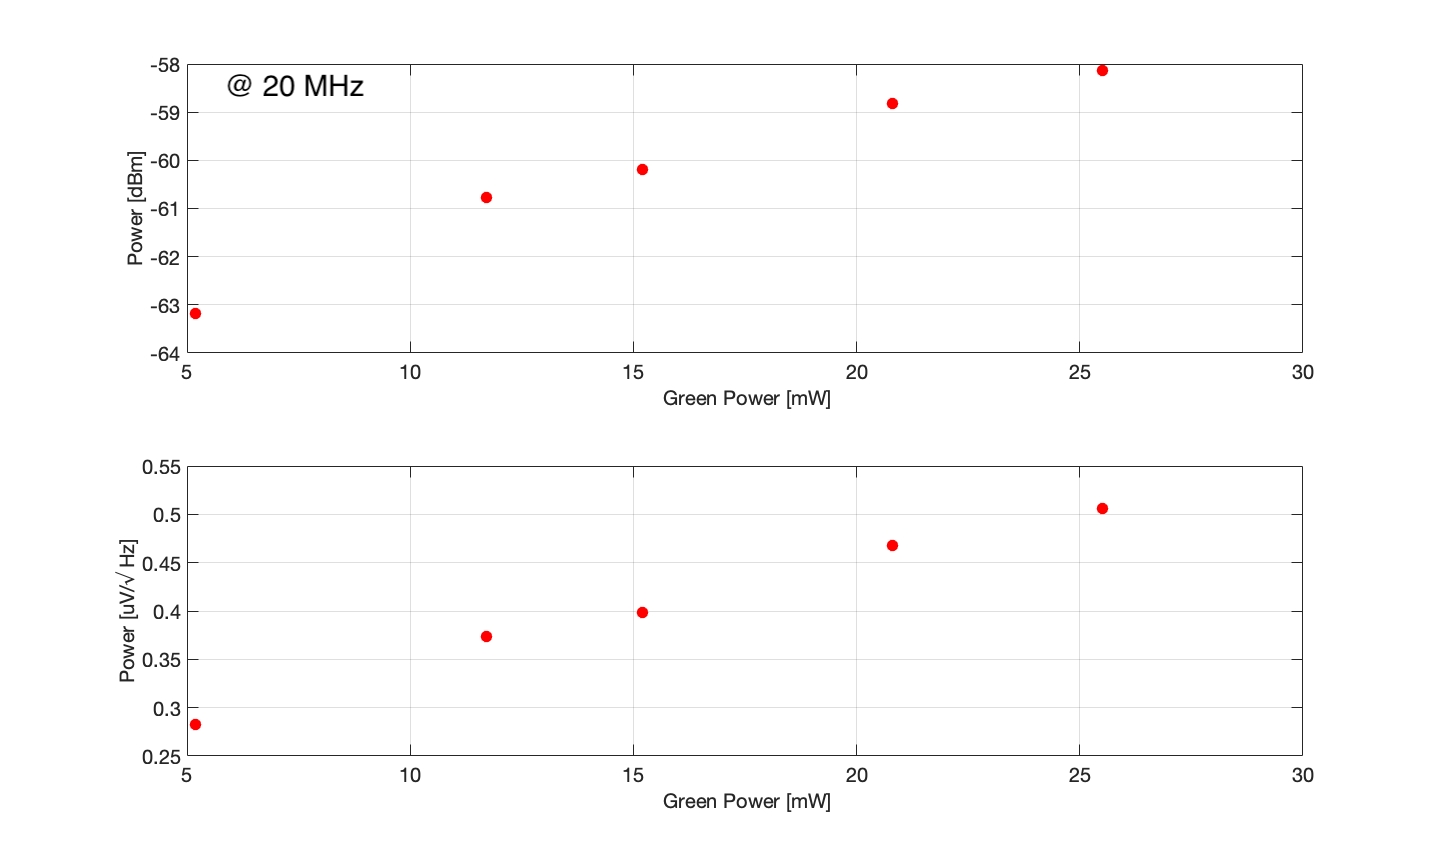
Pic 4: Noise at 20 MHz as function of the green power.
Measured data are reported below:
| Green Power [mW] |
Current [mA] |
Noise @ 20 MHz [dBm] | Noise @ 20 MHz [uV/sqrt Hz] | Peak @15.2 MHz [dBm] | Peak @ 15.2 MHz [mV/sqrt Hz] | Peak @ 30.4 MHz [dBm] | Peak @ 30.4 MHz [mV/sqrt Hz] |
| 5.2 | 0.6 | -63.18 | 0.28 | -12.53 | 0.097 | -28.20 | 0.0159 |
| 11.7 | 1.8 | -60.77 | 0.37 | -4.57 | 0.24 | -21.00 | 0.0364 |
| 15.2 | 15.2 | -60.20 | 0.40 | -0.40 | 0.39 | -18.55 | 0.0482 |
| 20.8 | 20.8 | -58.81 | 0.47 | 1.52 | 0.49 | -14.88 | 0.0736 |
| 25.5 | 25.5 | -58.14 | 0.51 | 1.34 | 0.48 | -12.73 |
0.0943 |
We used the following setting :
RBW: 300kHz. VBW: 10kHz
Average: 10
Internal amplifier: OFF
Spectrum analyzer attenuator: 10 dB
When measuring the peak hight we used different attenuation levels (20/30 dB) to avoid saturation