NAOJ GW Elog Logbook 3.2

I measured some maps of the Surface reference sample.
I order to compare and join different areas of the sample and in order to process datas I wrote a matlab script that read the .txt file the program uses to store measurements datas.
The map is made scanning many lines, the scan direction used here is the X axis. In the plot we can see some fluctuations that are bigger alog the Y axis. My guess is that long time fluctuations of the pump power cause this. We can also recognize the edge of the sample by the lowest signal at (x,y)=(36,30.5)
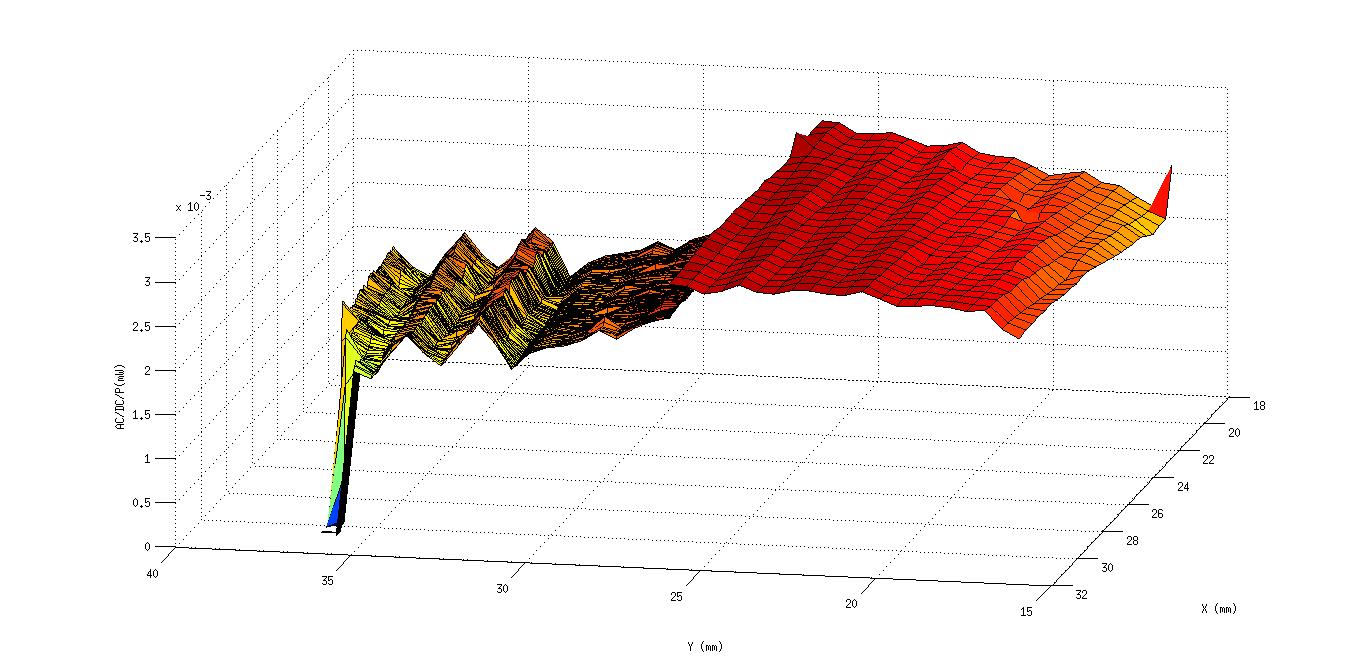
I made two resolved maps of the entire surface of the reference sample (200micron scan step) where the surface is behind the pump (flipped sample). One scanning along X axis (left in the image) and one scanning along Y axis. It shows that there are little fluctuations and they are a bit larger perpendicular to the scan axis. This happens for both maps. This means there are some long time power fluctuations. Maybe it shows more clear in the second attached image where there is only a 2D map.
There is also a relevant difference between the center of the sample and near the edge, the maximum is near the center, and the difference depends on the map. Still to be understood.