After changing the photodiode and the mixer box, we can get a proper error signal now. From this error signal, we can get many useful information.Including:
1. We can use this error signal to tell if our alignment or frequency setting is making the TEM00 on resonance. That means if TEM00 is on resonance, the IR error signal is properly around zero. This is a very good standard to adjust our IR beam.
2. We can also use it to evaluate the locking accuracy.
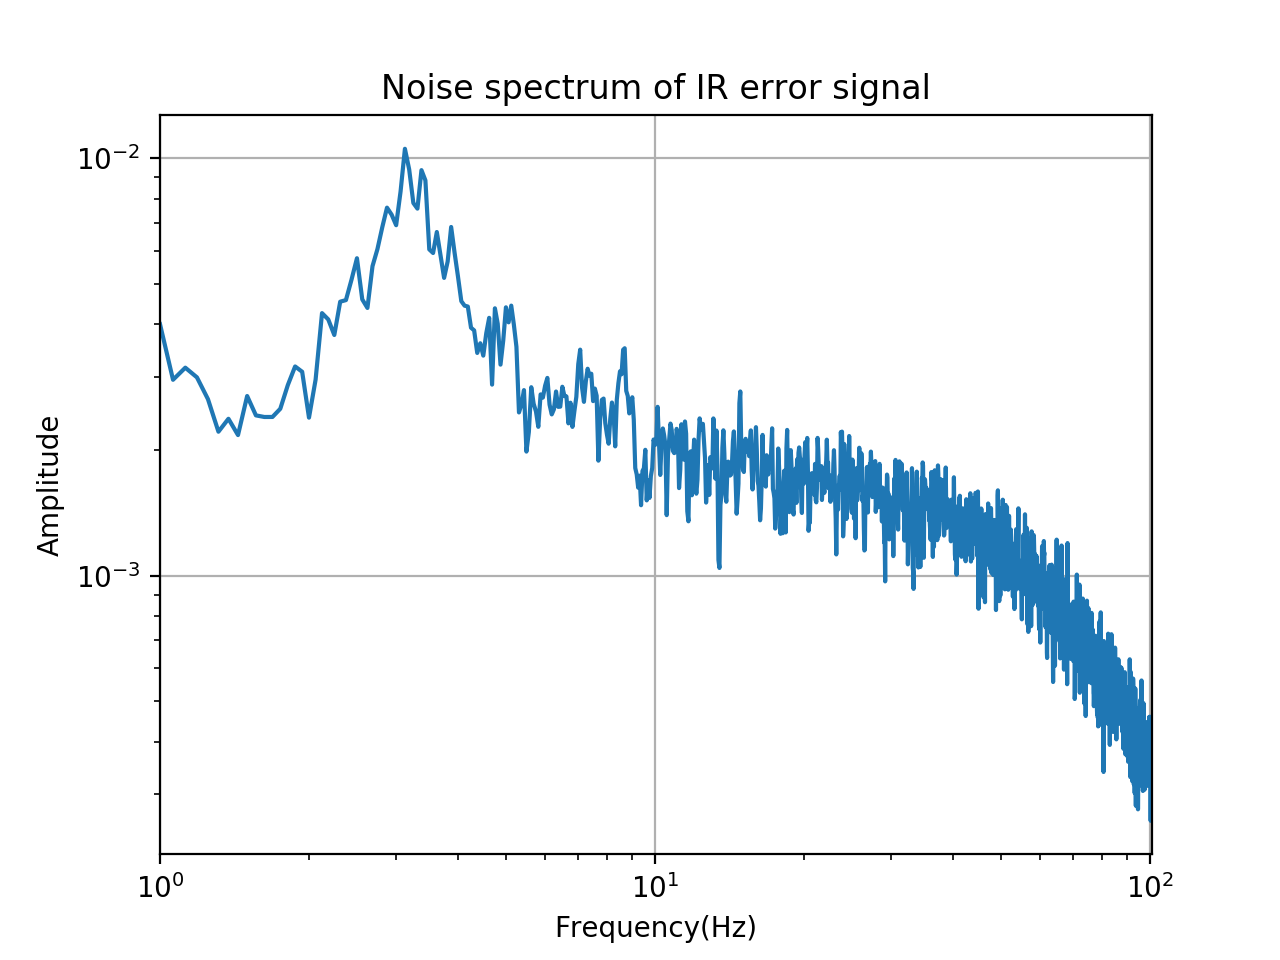
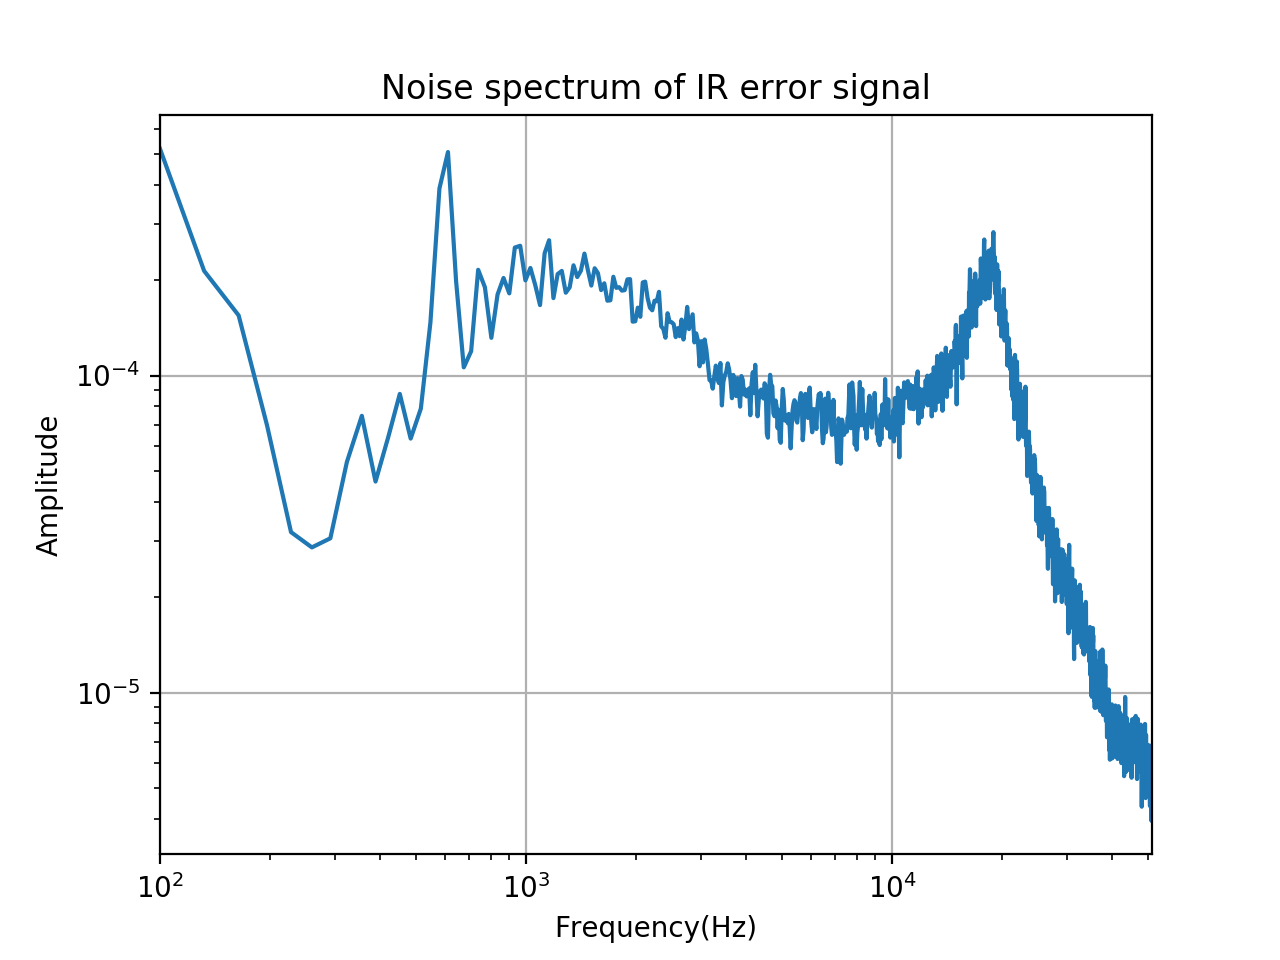
3. By measuring the noise spectrum of this error signal, we can know it is correcting which frequency mostly. I attached this measurement as picture one and two. We can see that 3Hz, 500Hz and 20000Hz are the main three peak frequency.
The data corresponding to this picture you can find here
https://drive.google.com/drive/folders/1J2PmI-GSoQ-BA4gE1VS5wI8wLsPURzoF?usp=sharing
In order to calibrate the IR error signal we have scanned the resonance by adding a modulation to the AOM around the resonance driving frequency.
We choose a triangular wave, with period 50 mHz and amplitude of 2 kHz (which corresponds to 1 kHz for the IR). This means that the resonance is crossed with a constant speed of of 200 Hz/s.
In the first attached picture, the IR transmission and the error signal are shown during a crossing of the resonance. The x axis has been calibrated in Hz using the computation reported before.
The FWHM of the trasmission is about 116 +/- 4 Hz, corresponding to a finesse of 4310 +/- 150, which is comparable with the design and the previous measurements.
The correspondig PDH has been used to calibrate the IR error signal, finding a value of about 170 +/- 20 Hz/V
The second plot shows the calibrated IR error signal, when the cavity is on resonance. The RMS is about 4.4 +/- 0.5 Hz.
In the third plot, I have merged and calibrated the spectra of the error signal recorded with the spectrum analyzer in two different frequency regions (from 1Hz to 100 Hz and from 100 to 51kHz) and I have computed and plotted the rms. As expected it is in agreement with that found from the time series.
According to the plot, the high frequency (above 100 Hz) seems to contribute with 3.5 Hz to the total rms. The remaing (about 1 Hz) is accumulated below. The contribution of the suspension resonances in the region from 1 to 10 Hz is visible and seems to be about 0.5 Hz.
The origin of the peak at 12 kHz and the quite complex shape of the signal are not very clear to me.
Next step will be to comprare this spectrum with that of the green error signal in order to investigate the role played by the IR pole.