I characterized the absorption of the central part of the tama-sized sapphire substrate sample#2
Pump power 10W (after the chopper). Max laser current: 7.5A
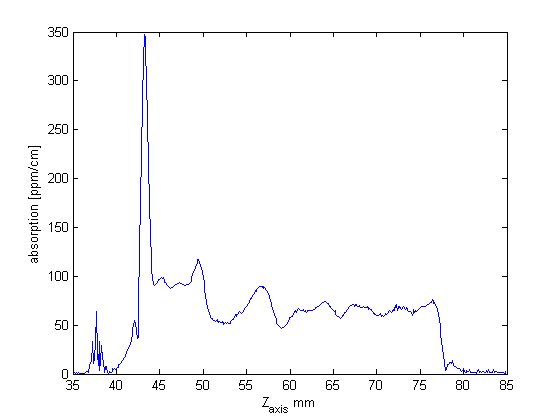
After aligning the system with the surface reference sample, and scanning the bulk reference sample for calibration (with power=30mW), I made a scan of the sapphire substrate.
Changing from the 3.6mm thick reference sample to the 60mm thick sapphire substrate we have to move backward the imaging unit by 24.9mm. Then recenter the probe on the PD maximizing the DC.
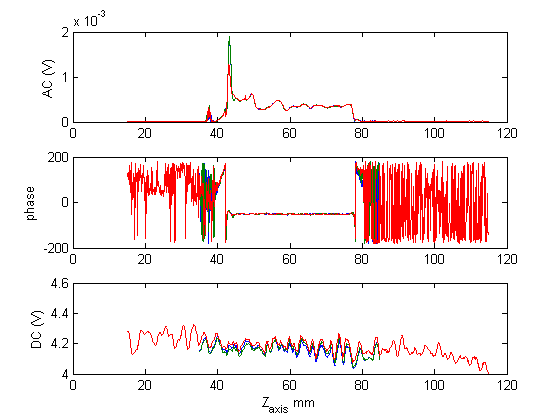
From the scan plot we can recognize the 2 surfaces of the sample (when the absorption signal drops to 0) and associate the translation stage Z coordinate to the sample coordinates. Indeed the apparent depth of the sample is different from the real one as explained in entry 242 , Since the sample is 60mm thick, it is convenient to define the sample Z coordinate to be 0 at the first surface and 60 at the second surface. On the translation stage reference system the first surface is at 44mm and the second surface is at 77.5mm. In other words, during a scan, the crossing point pump-probe travels in the sample about 1.8 times faster than the translation stage that mpoves the sample.
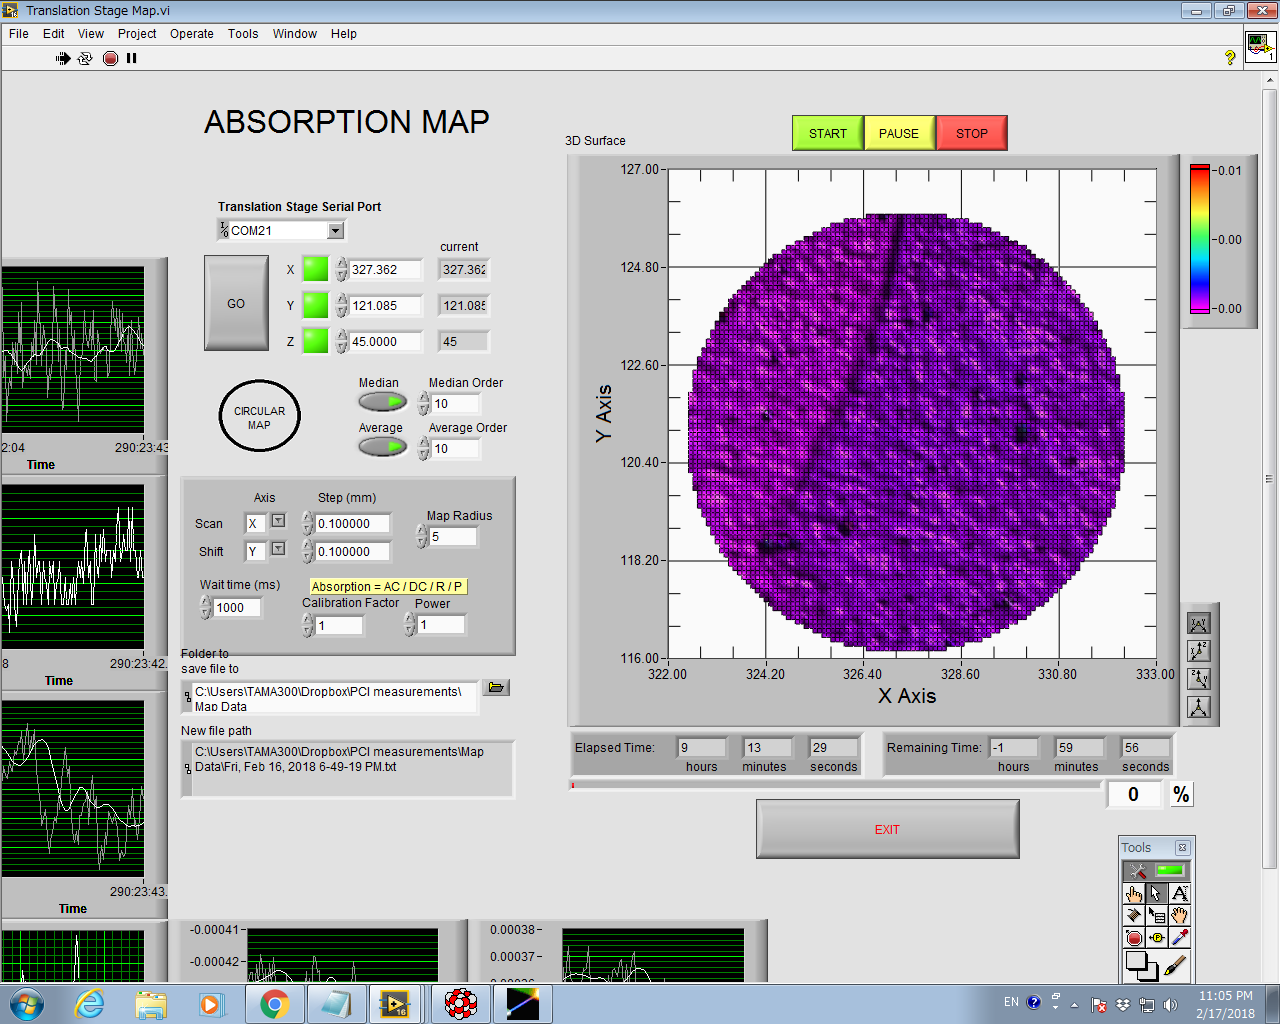
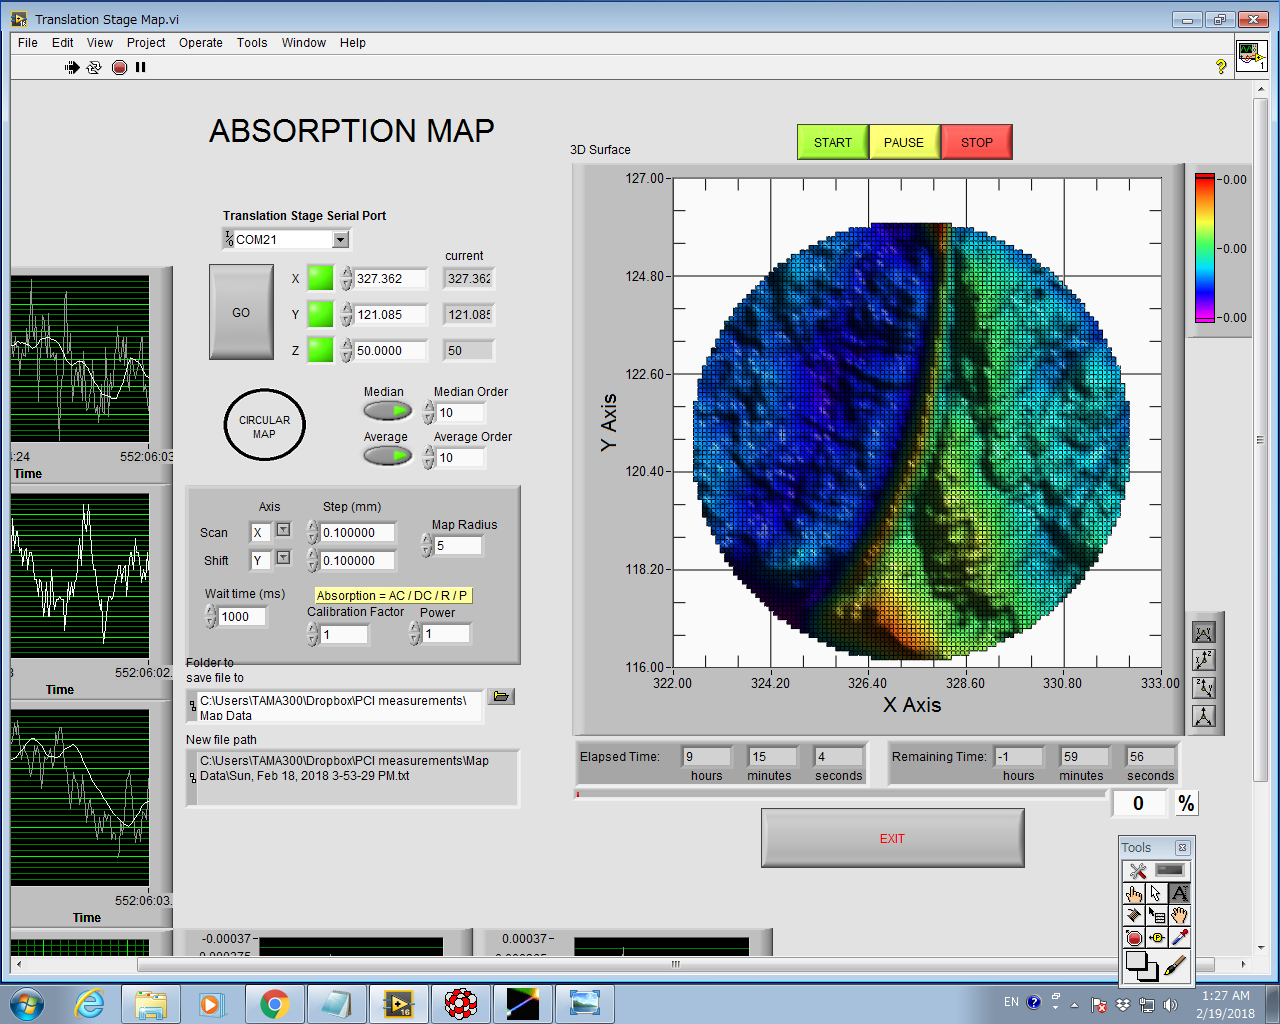
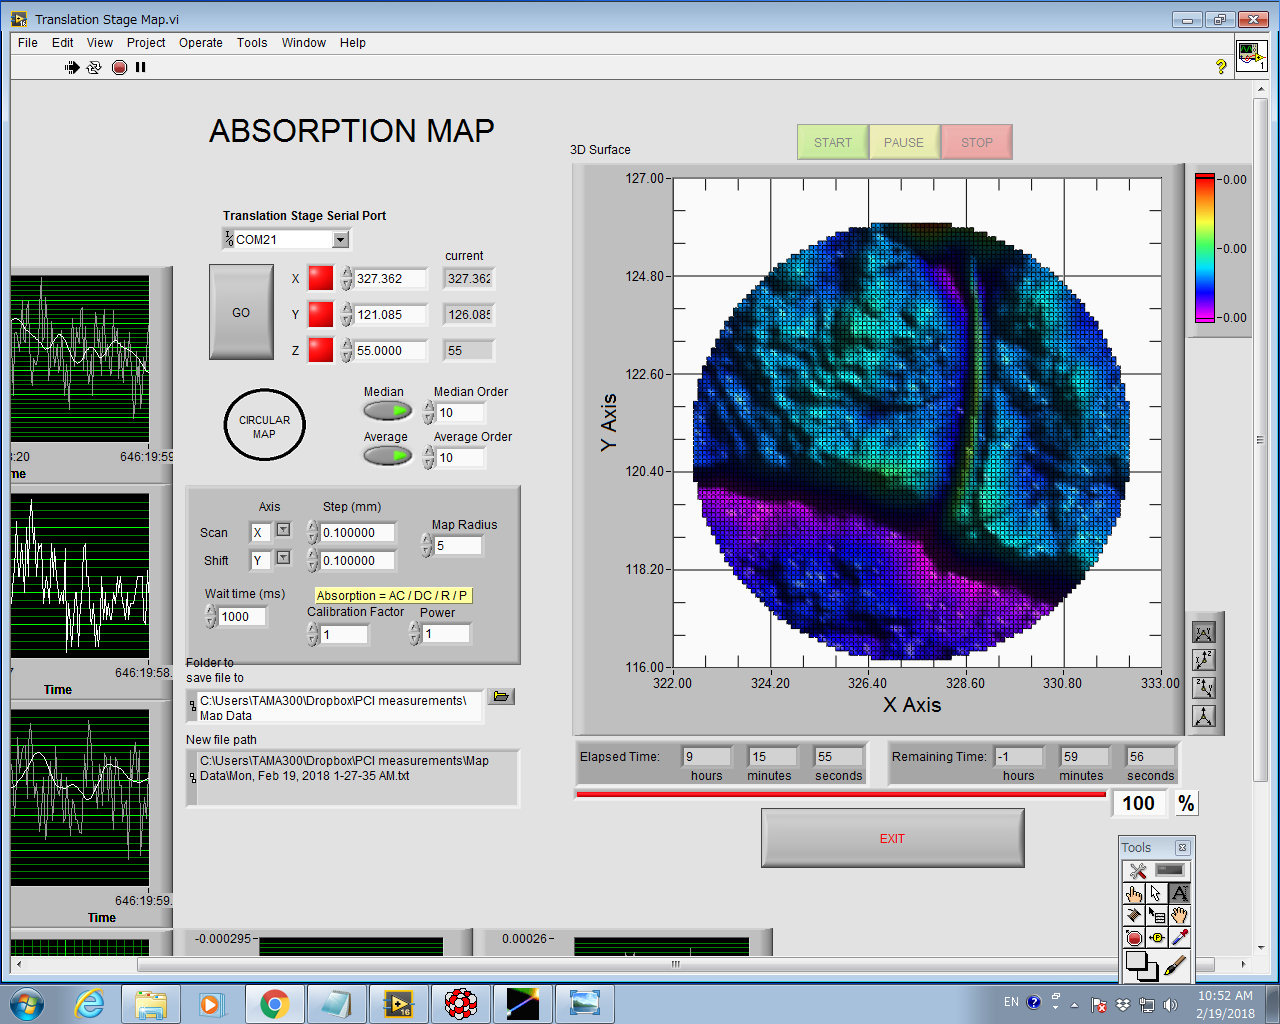
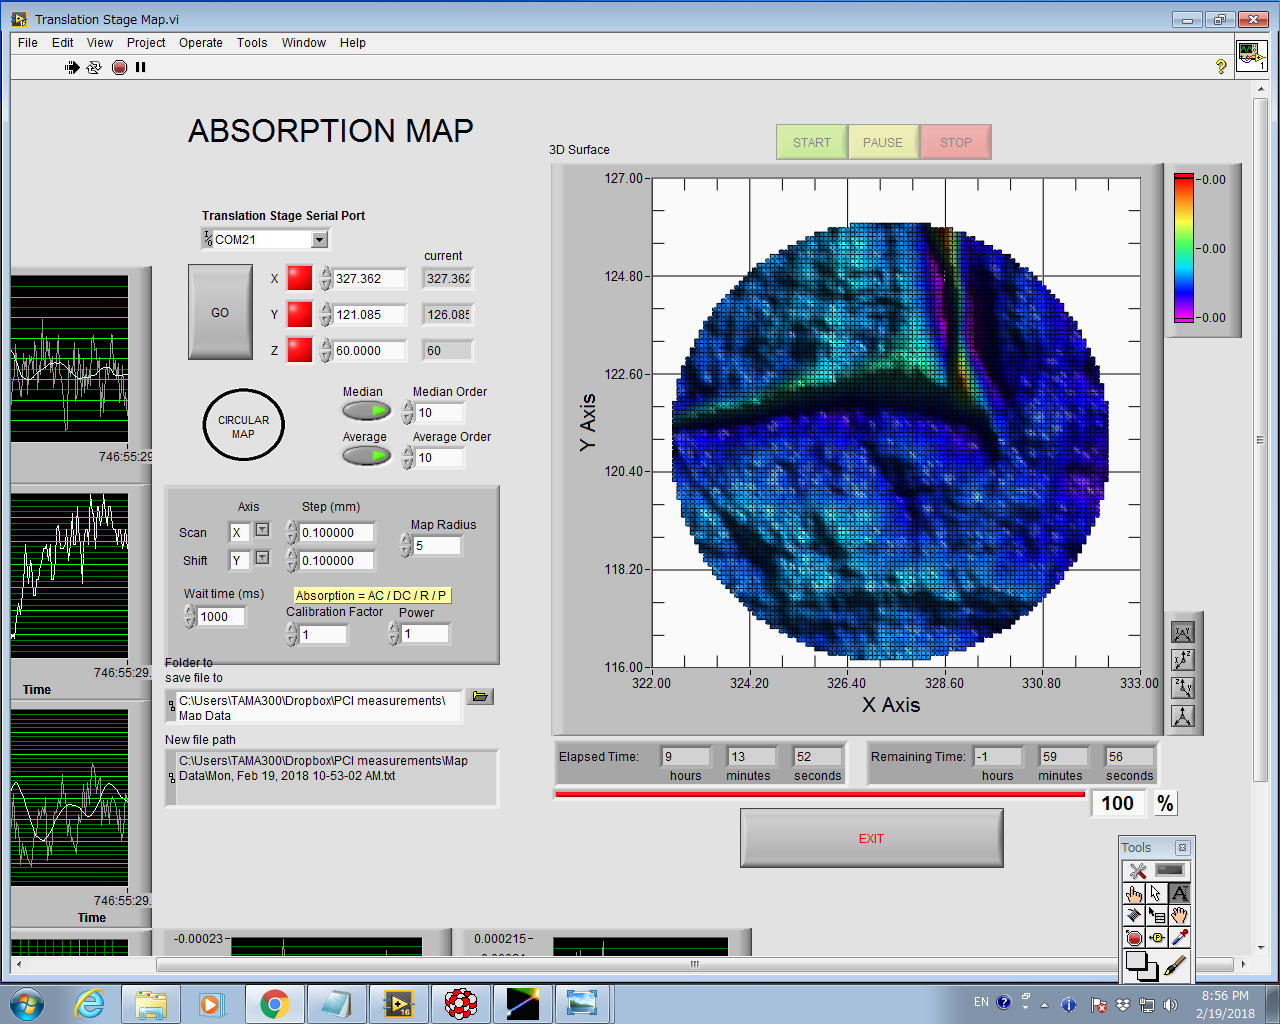
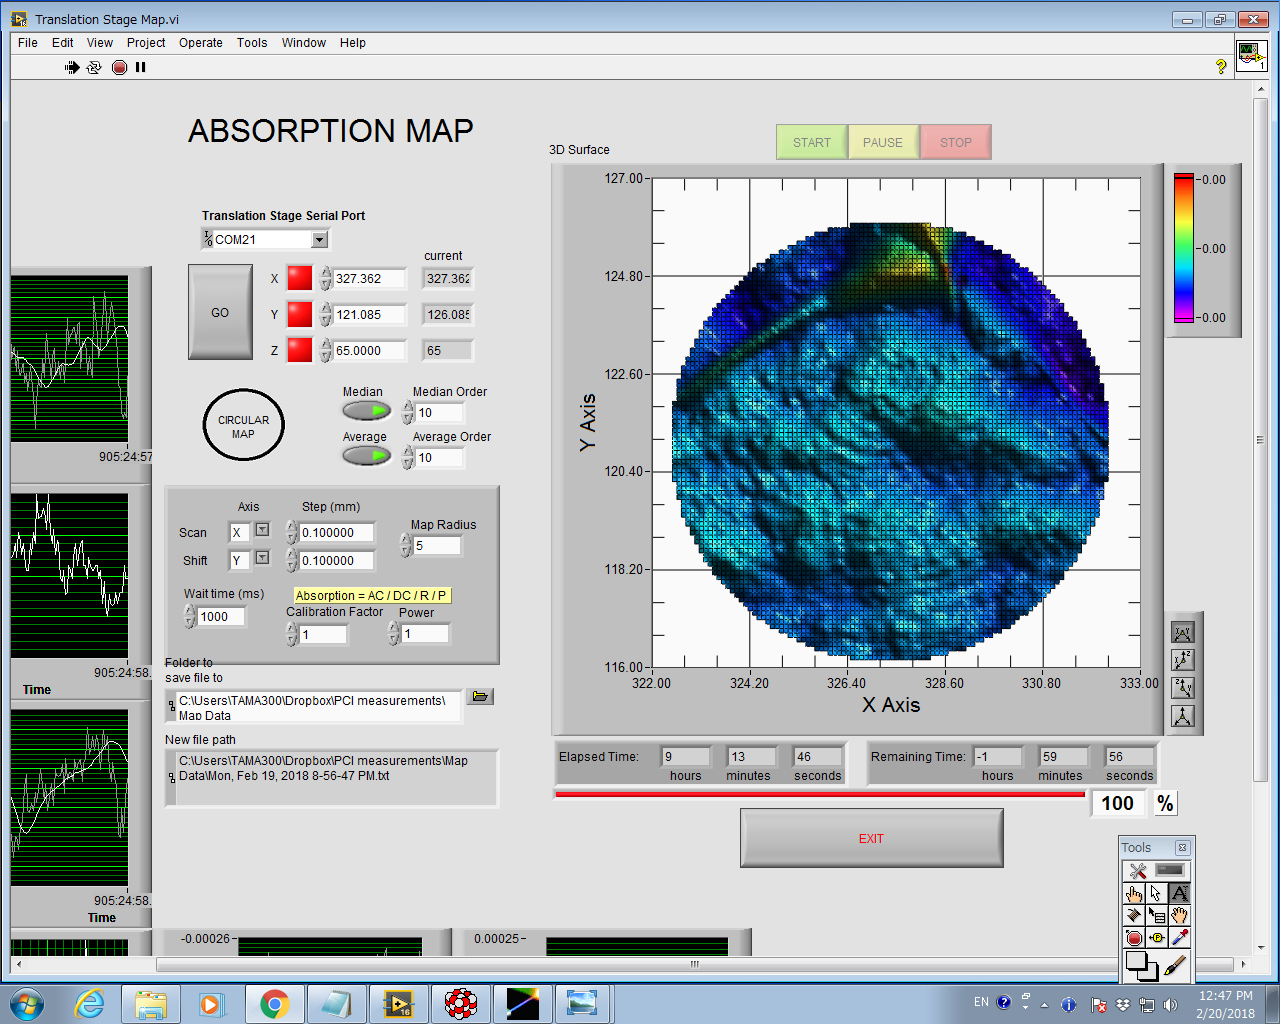
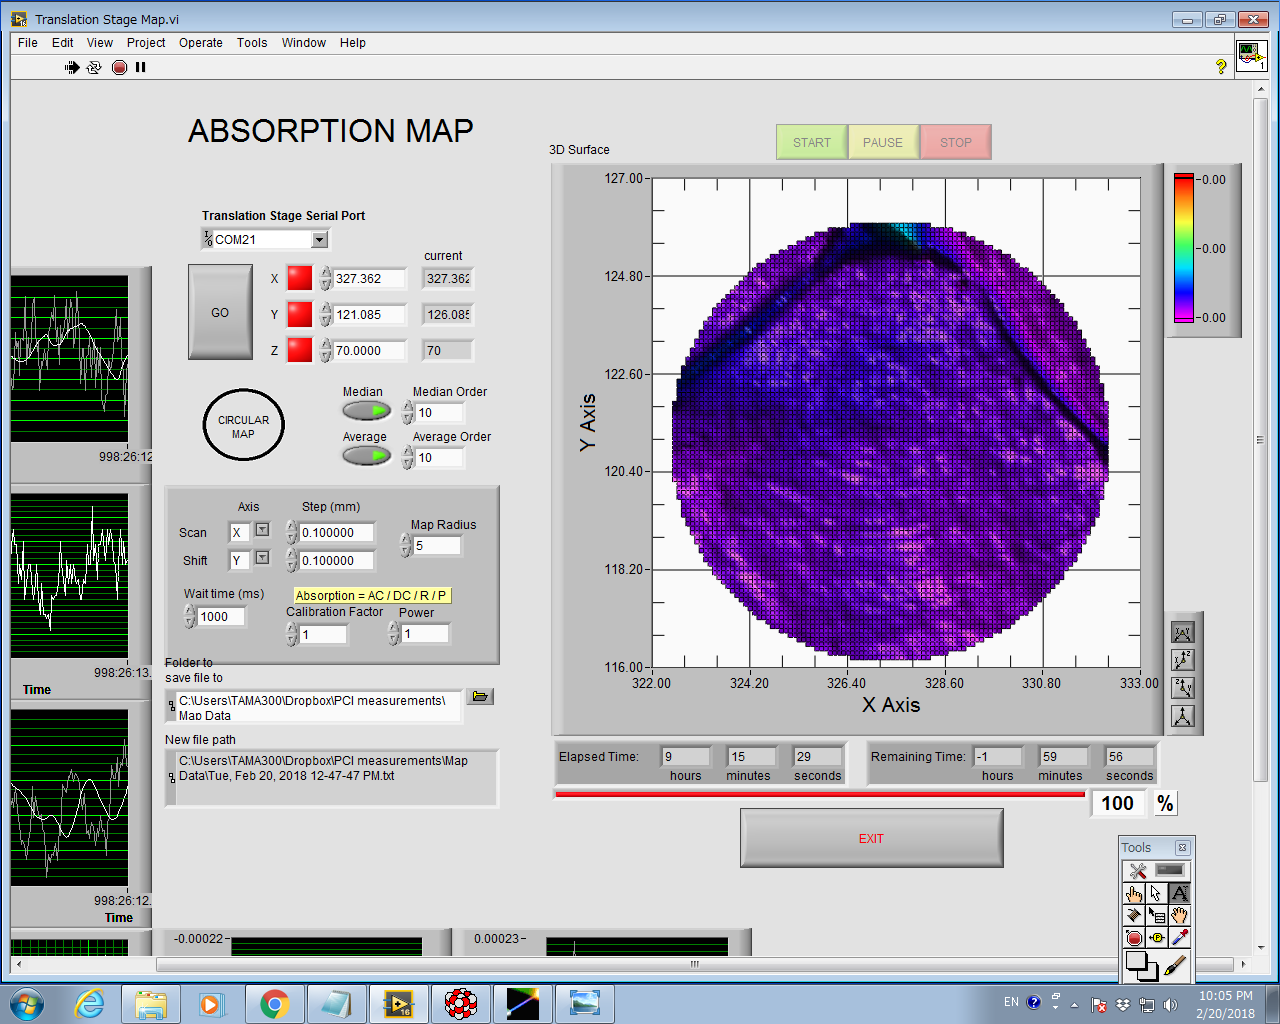
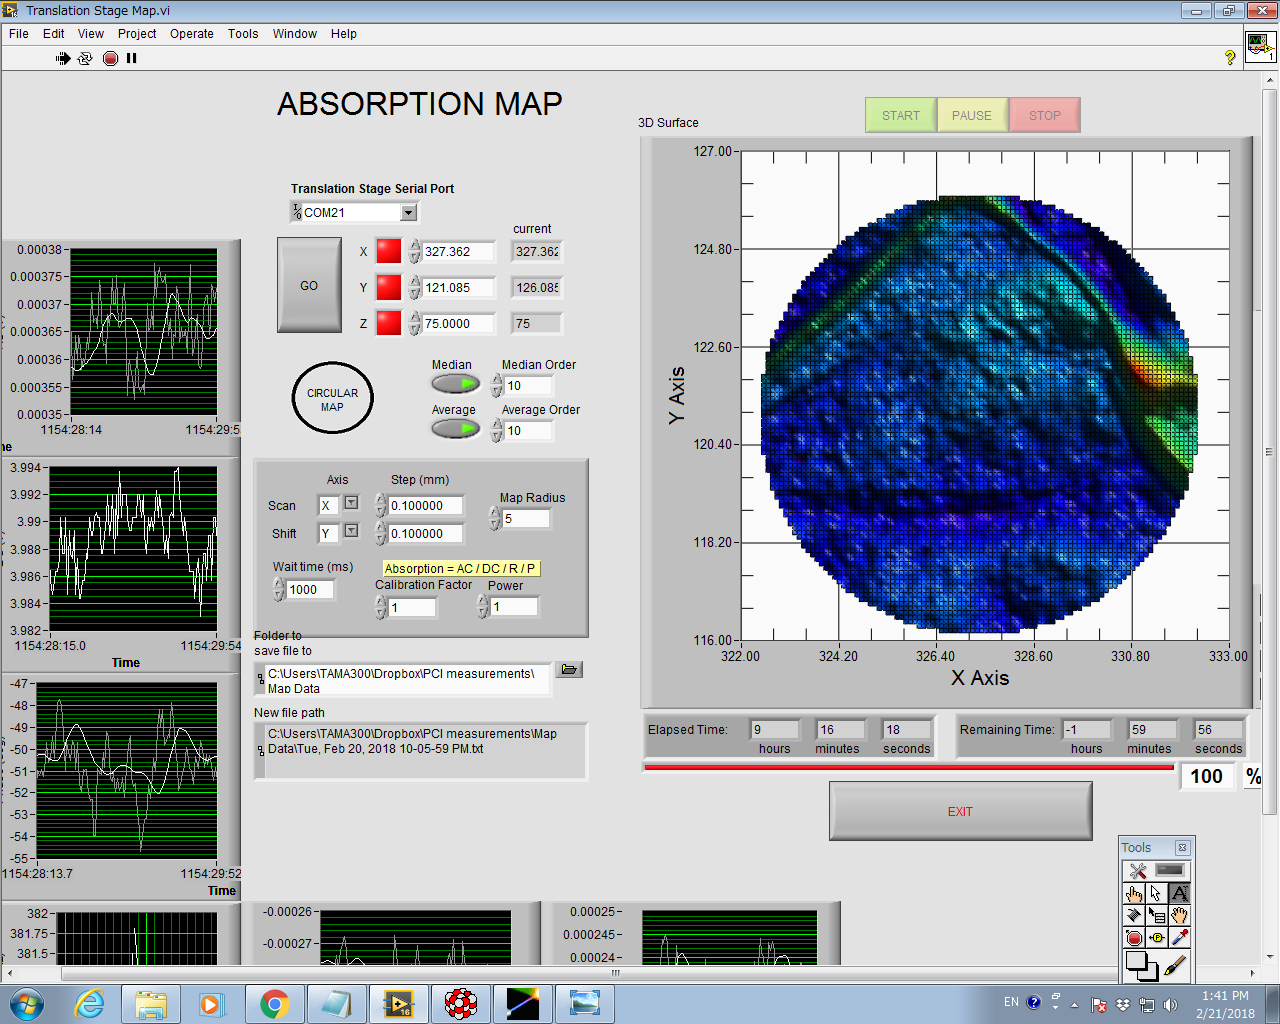
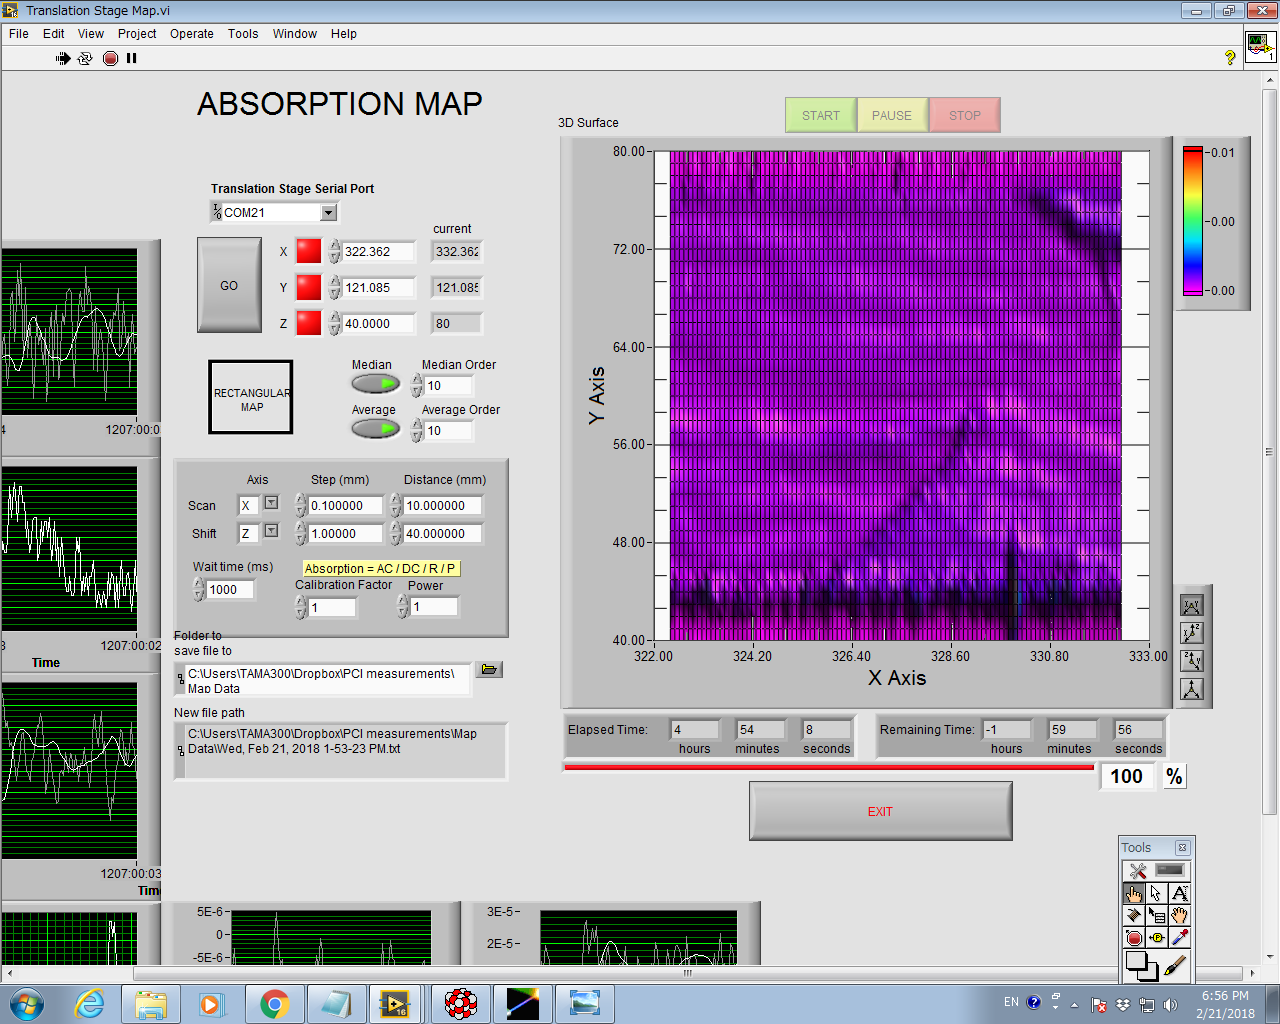
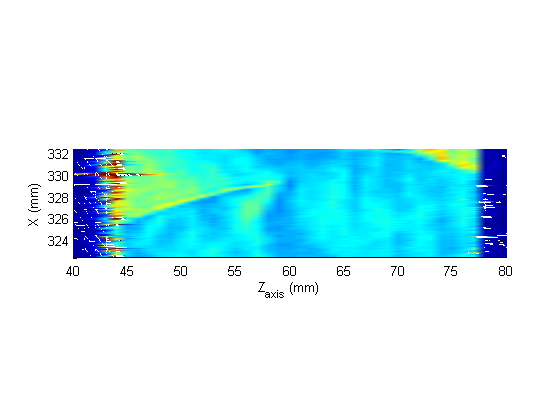
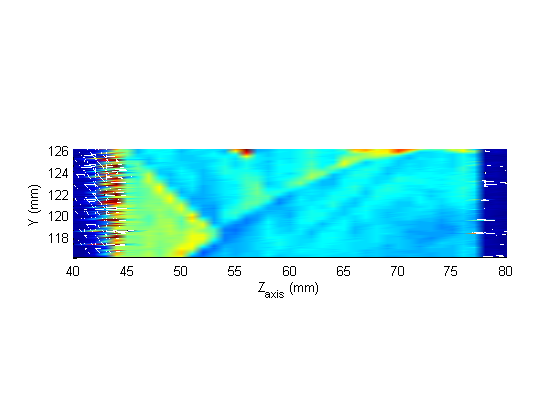
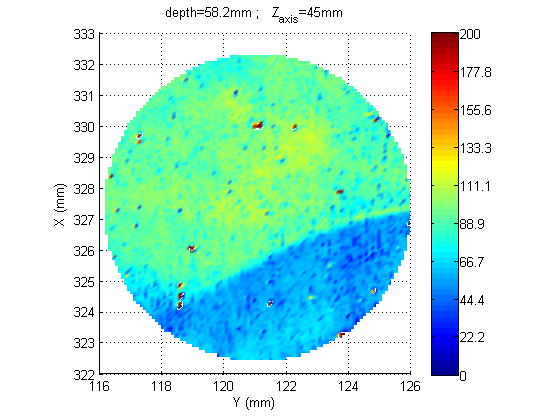
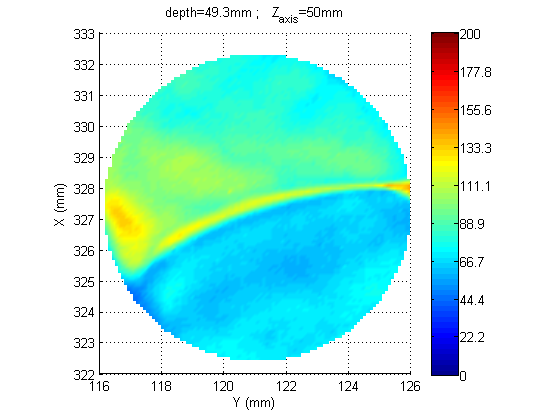
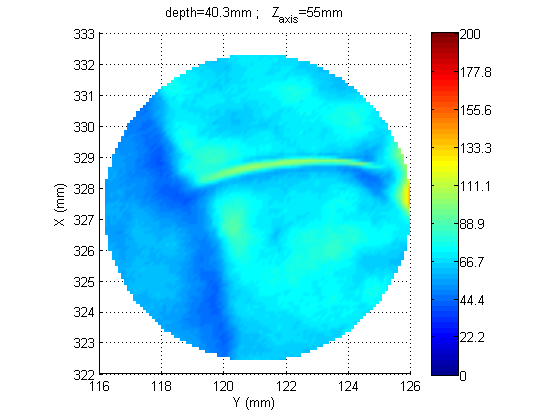
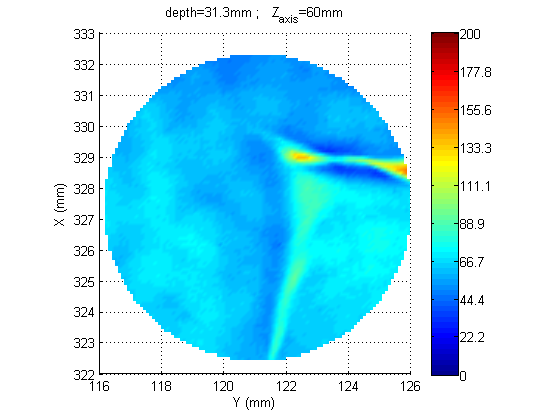
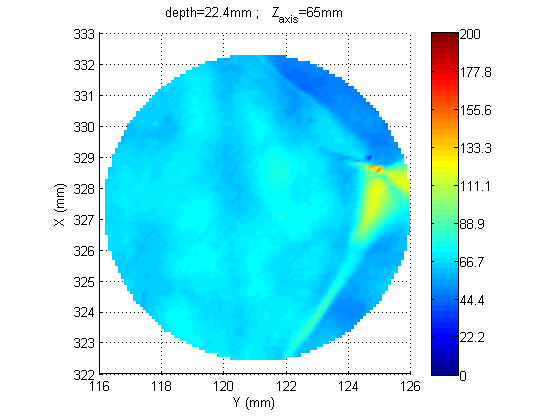
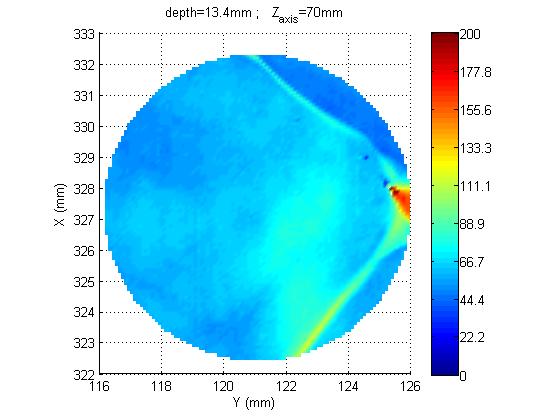
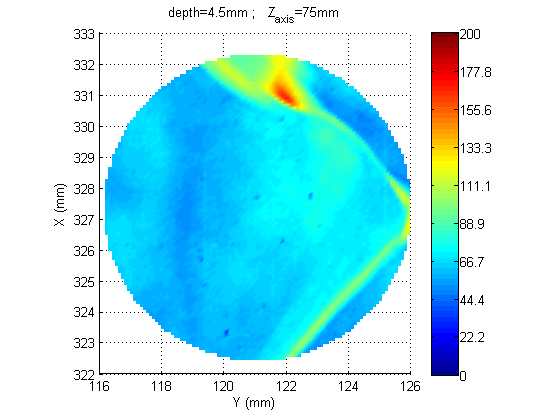
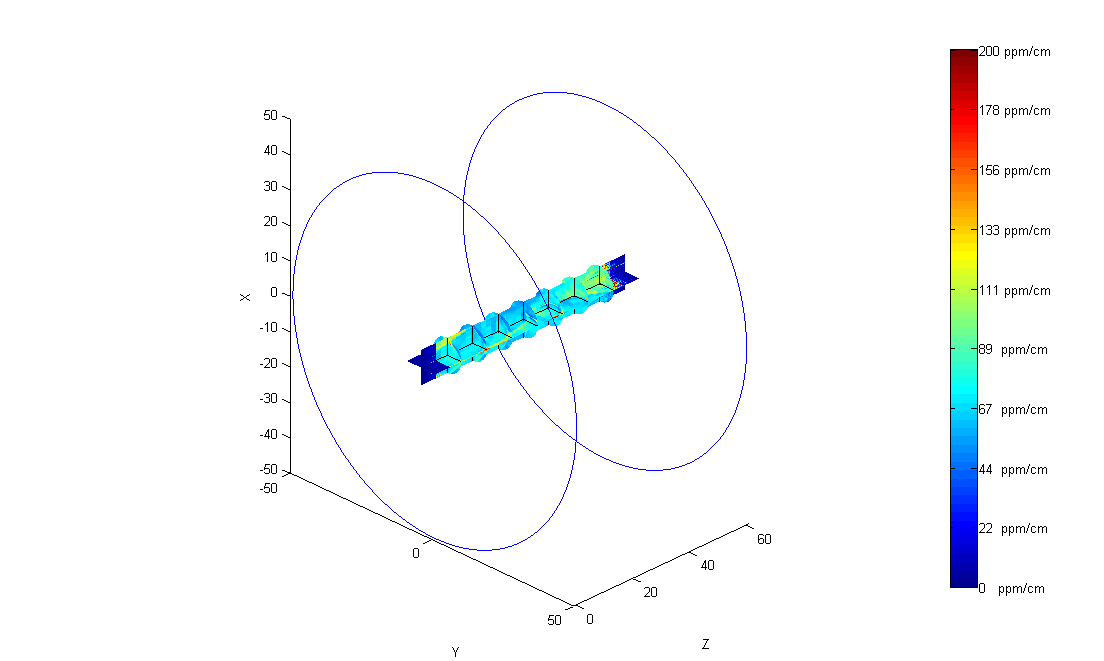
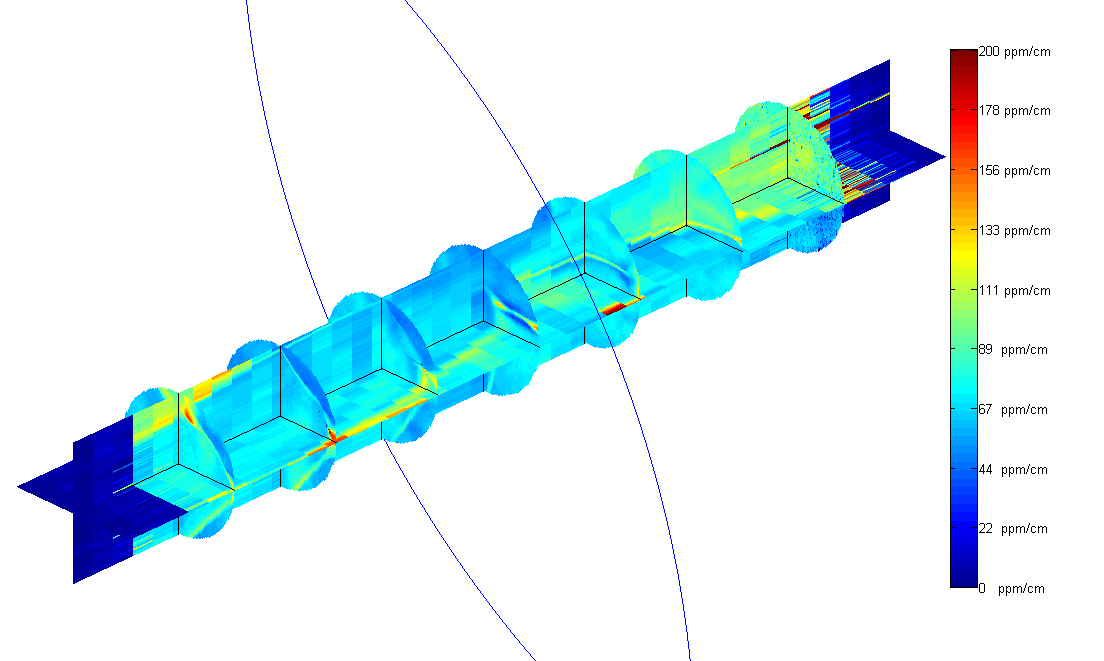
I made circular maps on the XY plane at several depths in the sample. Then 2 rectangular maps on the XZ and YZ planes. A 3d overview can summarize all the maps together in comparison with the sample size (drawn as 2 circles for the surfaces boundaries)
The circular maps resolution is 100um x 100um
The rectangular maps resolution is 100um x 1mm
the waiting time from one point to the next one is 1s, according to the average and median filters of order 10.
the color scale is up to 200ppm/cm to make the maps more readable and cover most of the color range. However, on the second surface of the sample, there are some absorption peaks up to 1400 ppm/cm which are probably due to some dirt on the surface or some polishing defects