YuhangZhao - 19:04, Thursday 22 February 2018 (672)
revisit angular perturbation
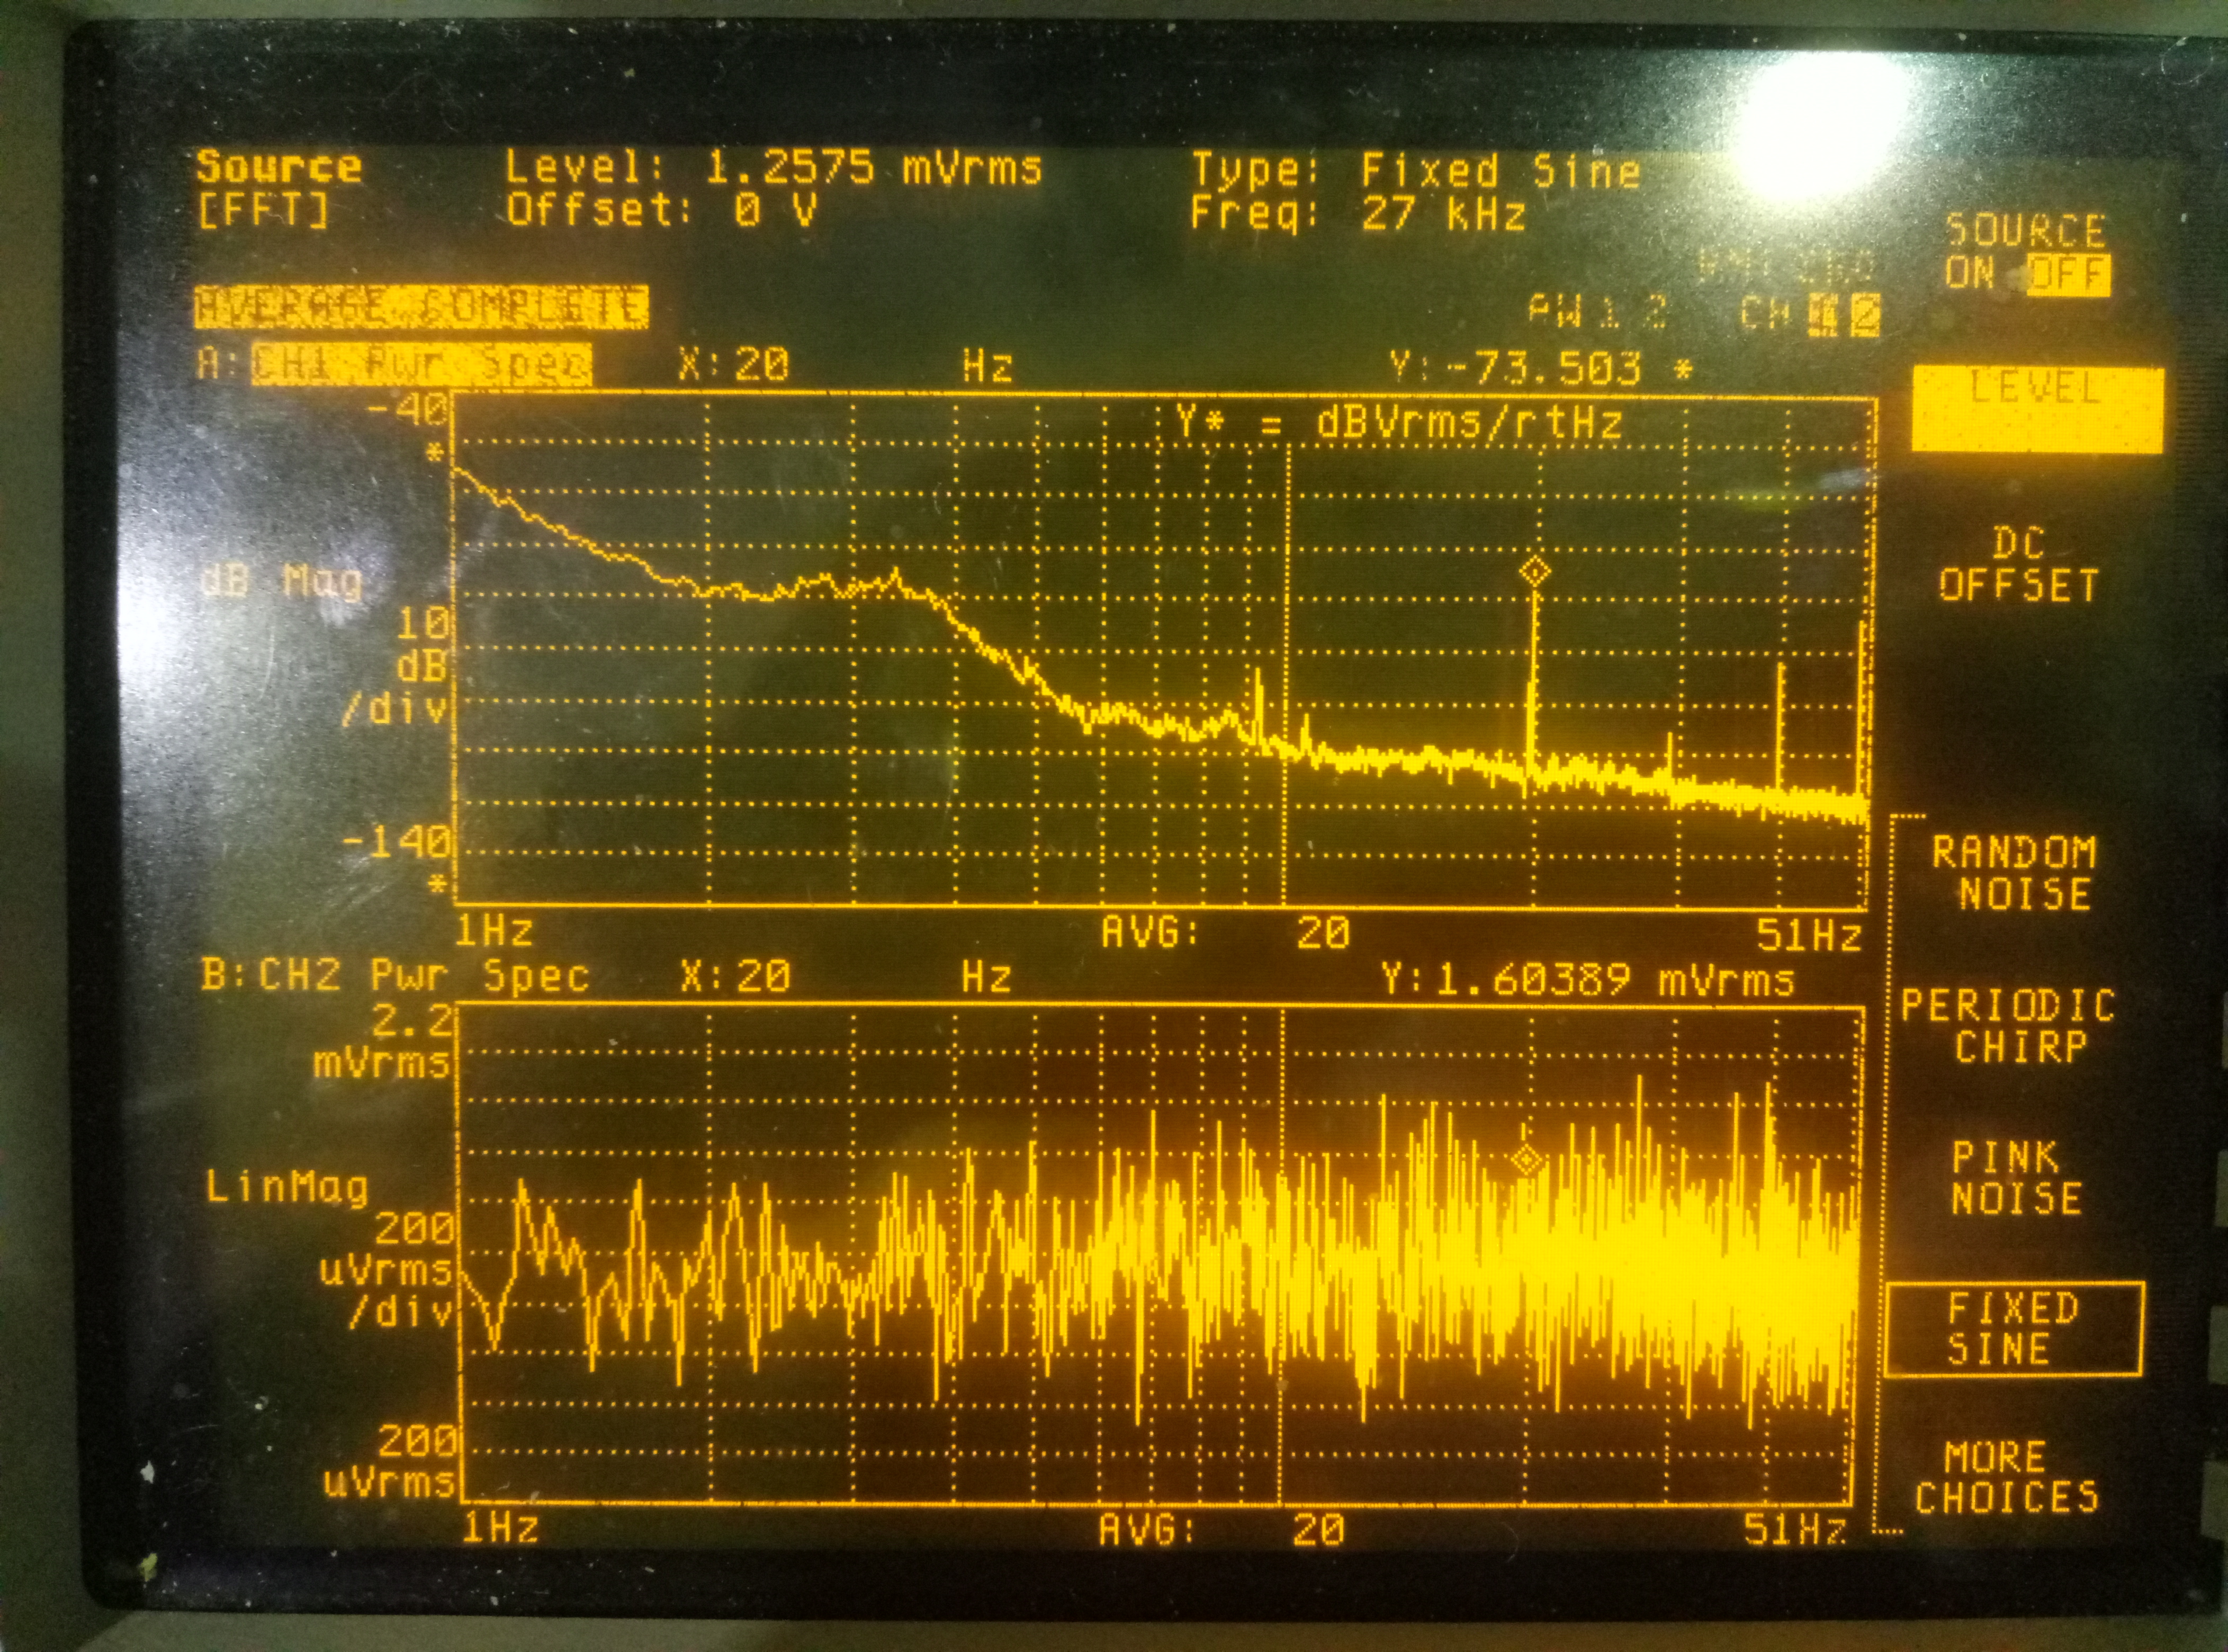
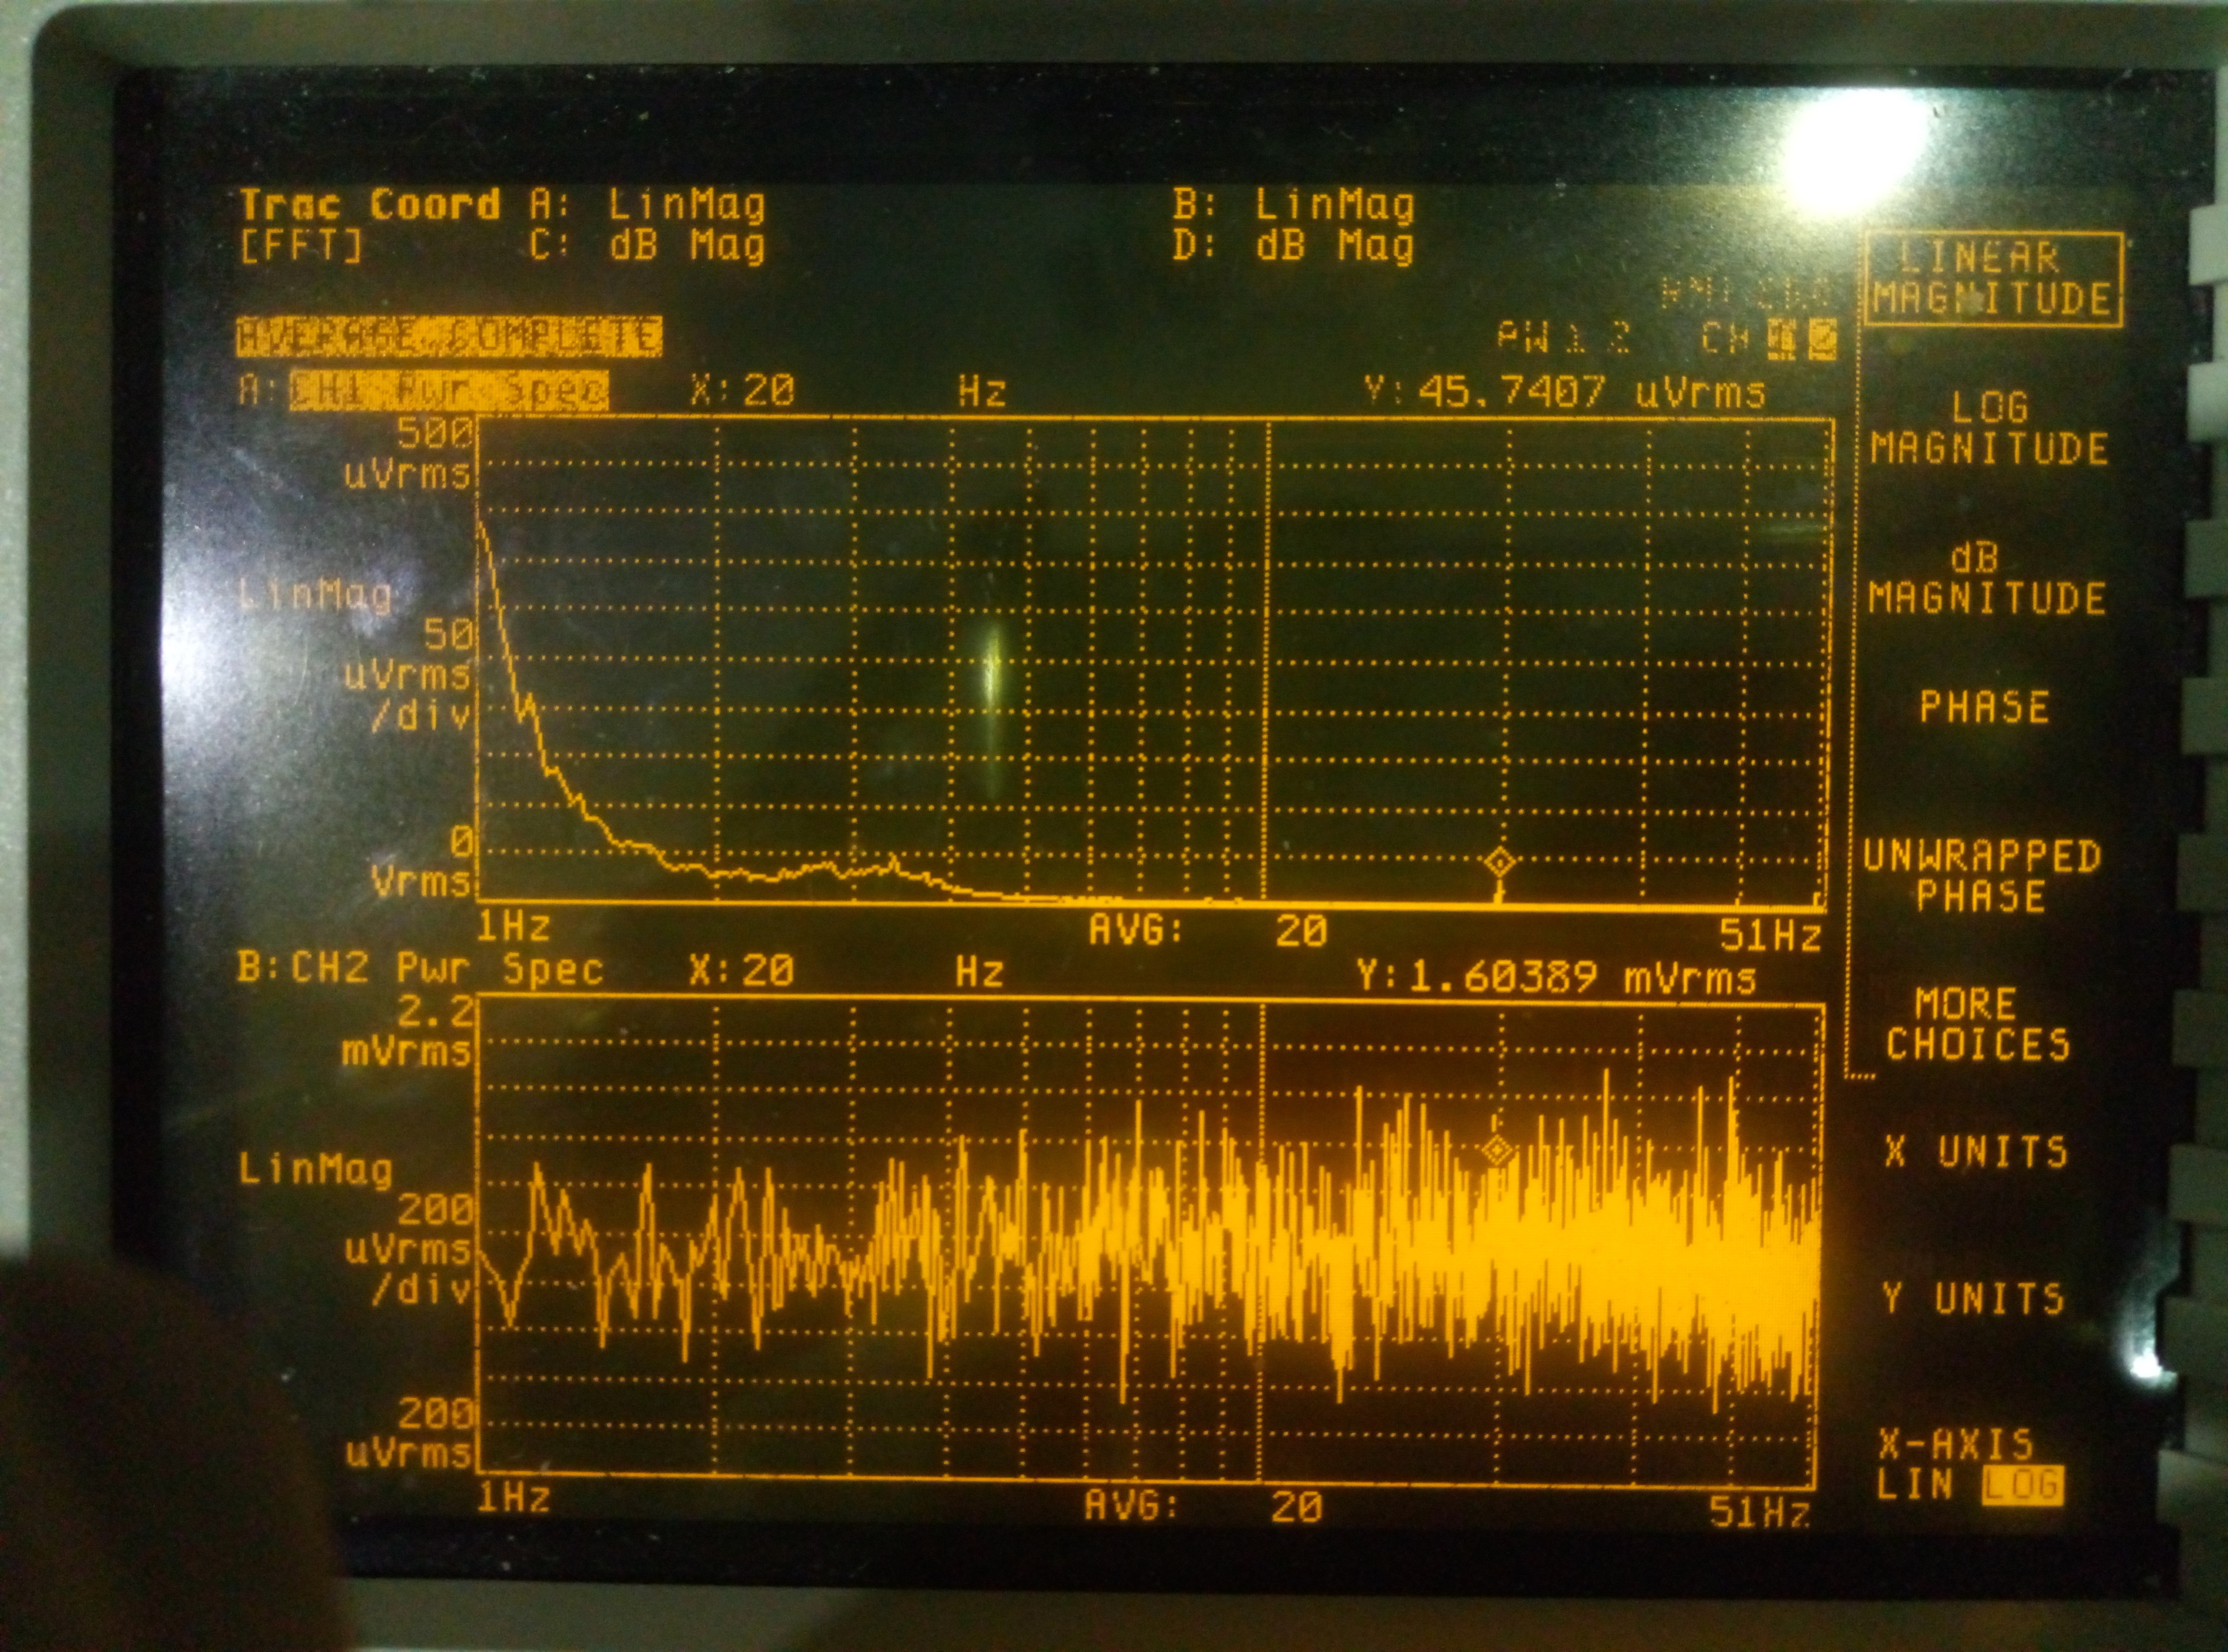
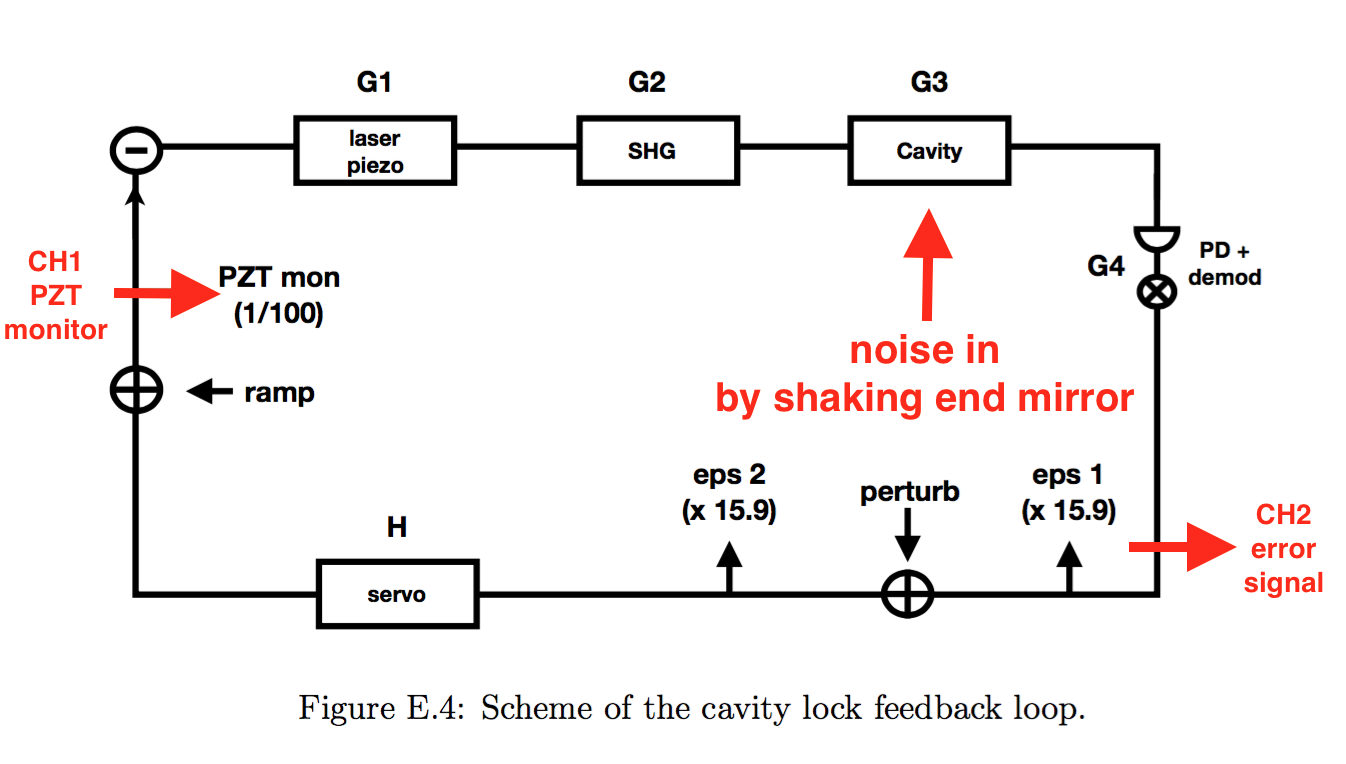
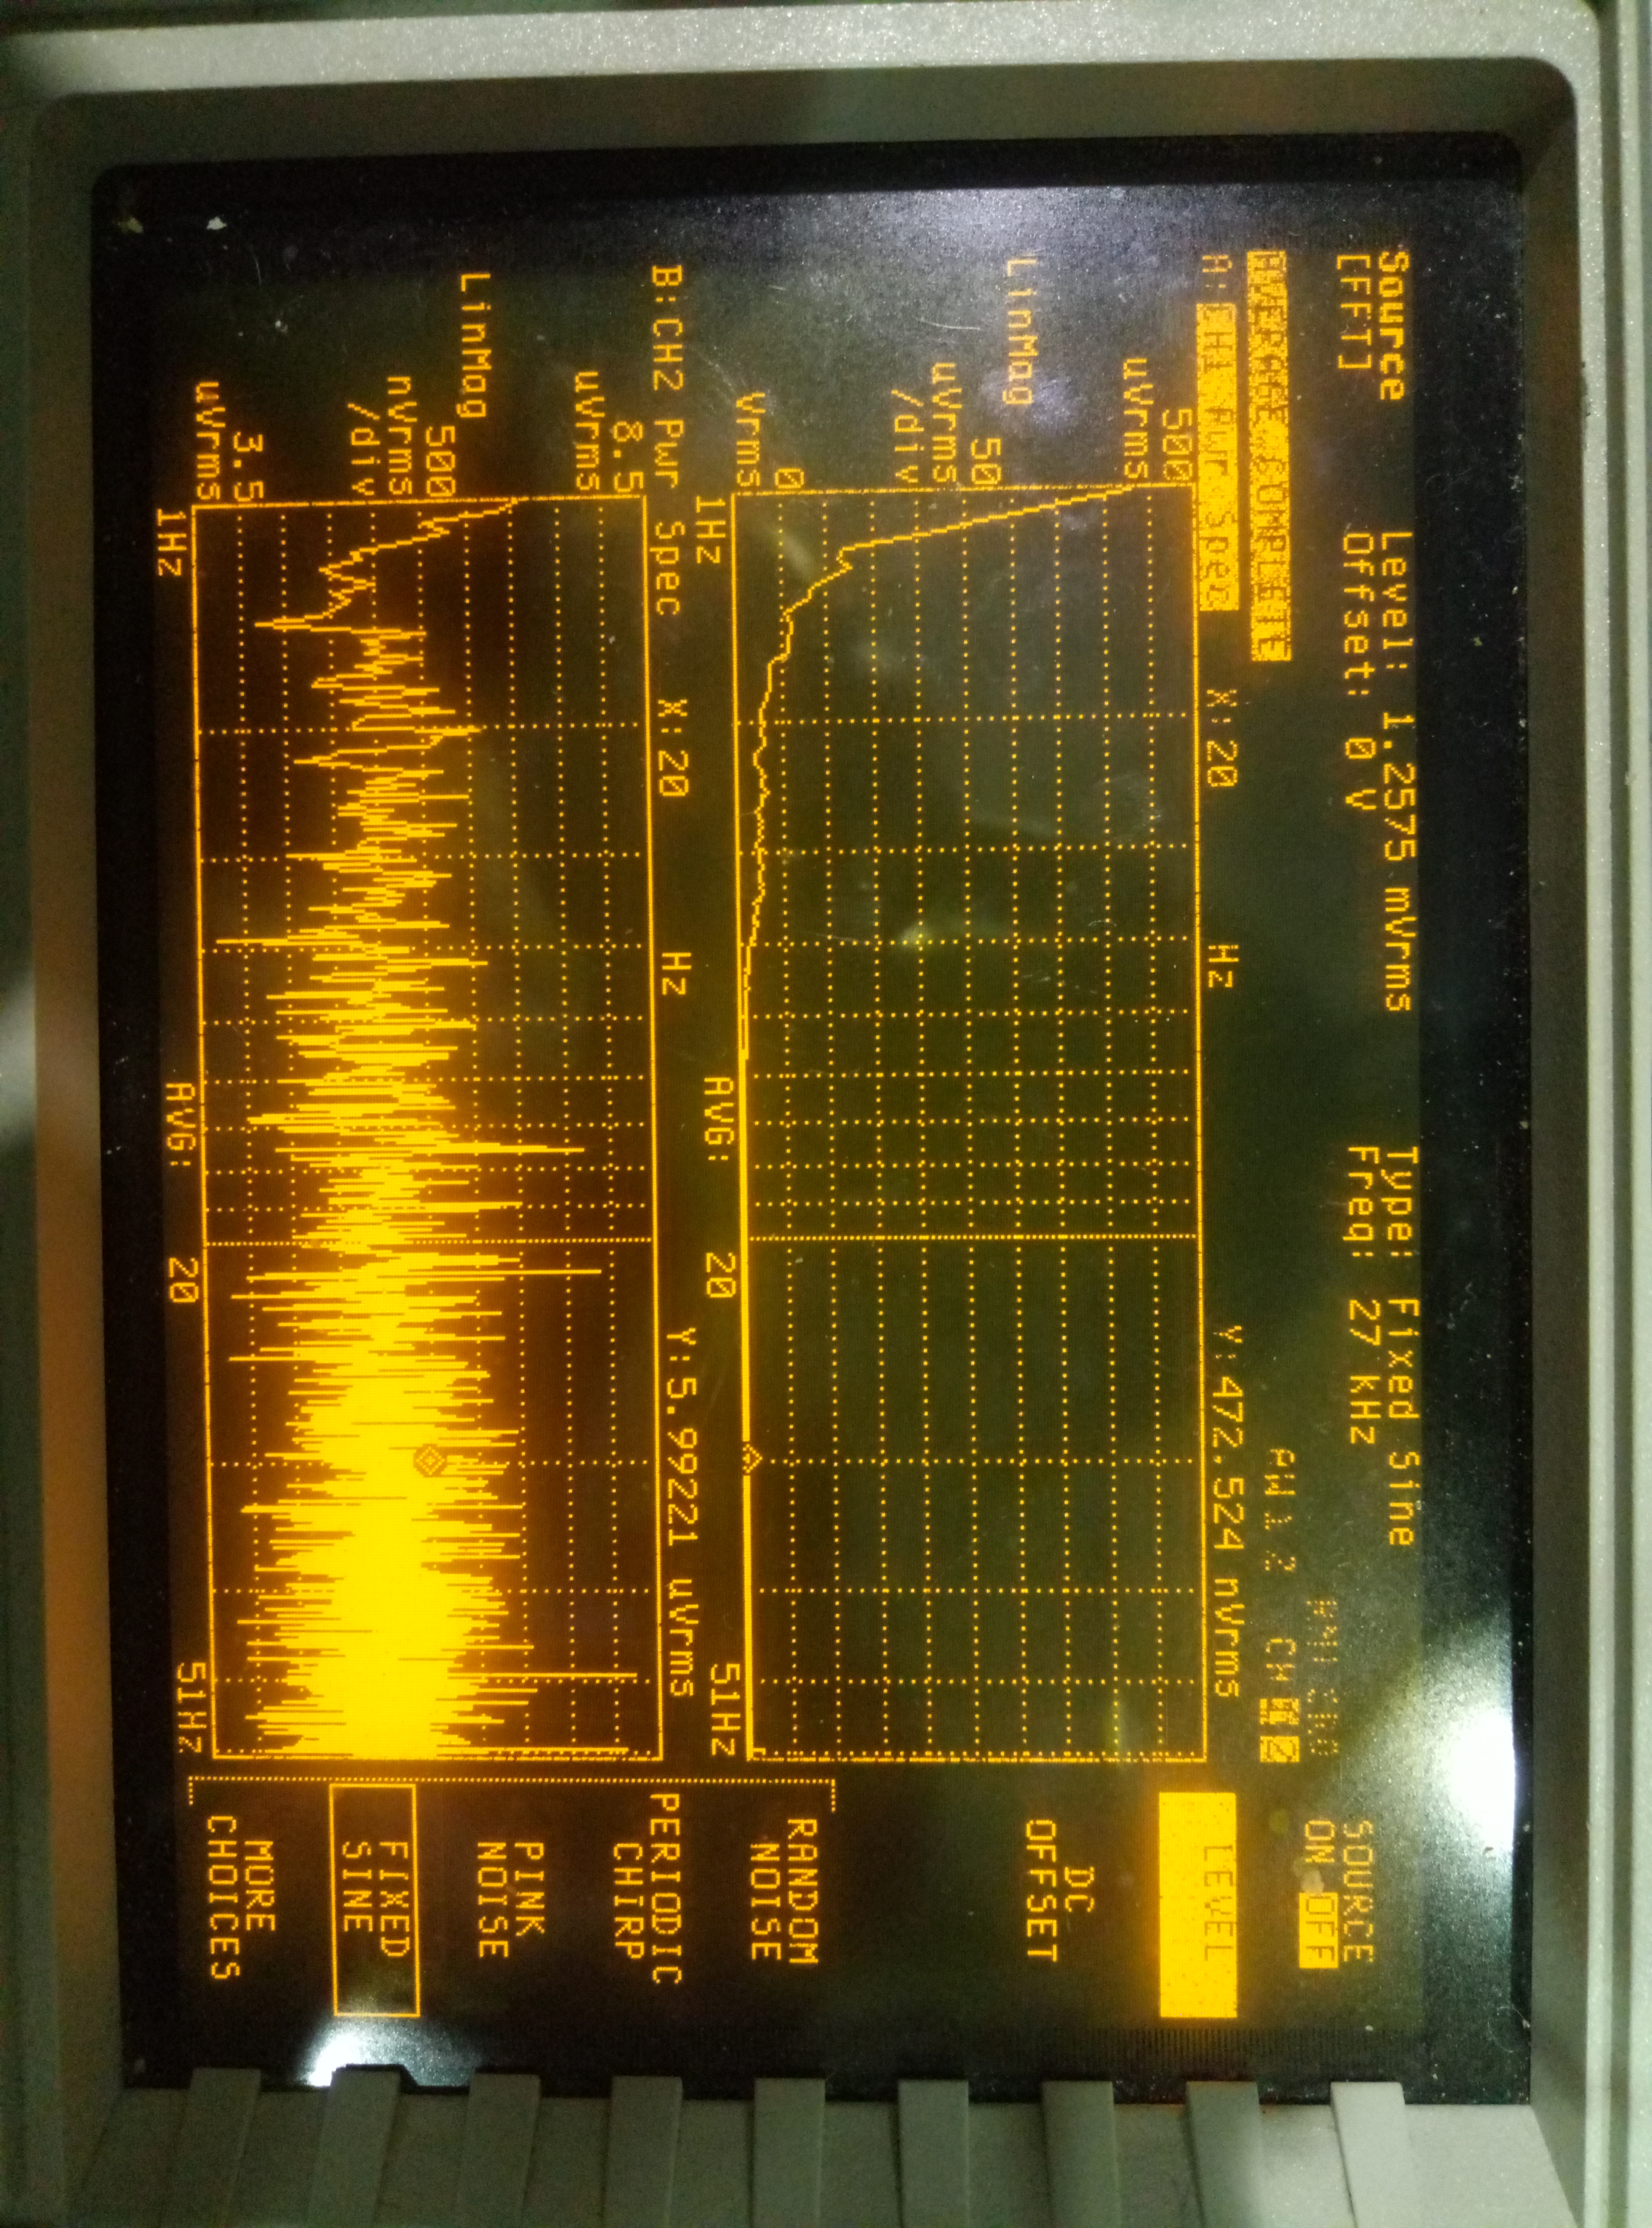
I did this angular to length perturbation test again. This time I also took the spectrum of PZT monitor. Now I found this 20Hz peak on PZT monitor's spectrum, but still not on error signal spectrum. See attached picture 1 and 2.
From the picture 2, we can read the peak value of this noise. It is 45.7407uVrms. And according to the block flow, we can calibrate this value to error signal. The formula is Err_V = K(V/Hz) * S_Hz/(1- (f/f_0)^2).
K is 3.1e-3, S_Hz is V_RMS (V) * 100 * sqrt(2) * 2e6 Hz/V=12937Hz, f_0=1.45kHz. In this case Err_V=38.8Vrms. However we read from the spectrum, it is 1.6mVrms.
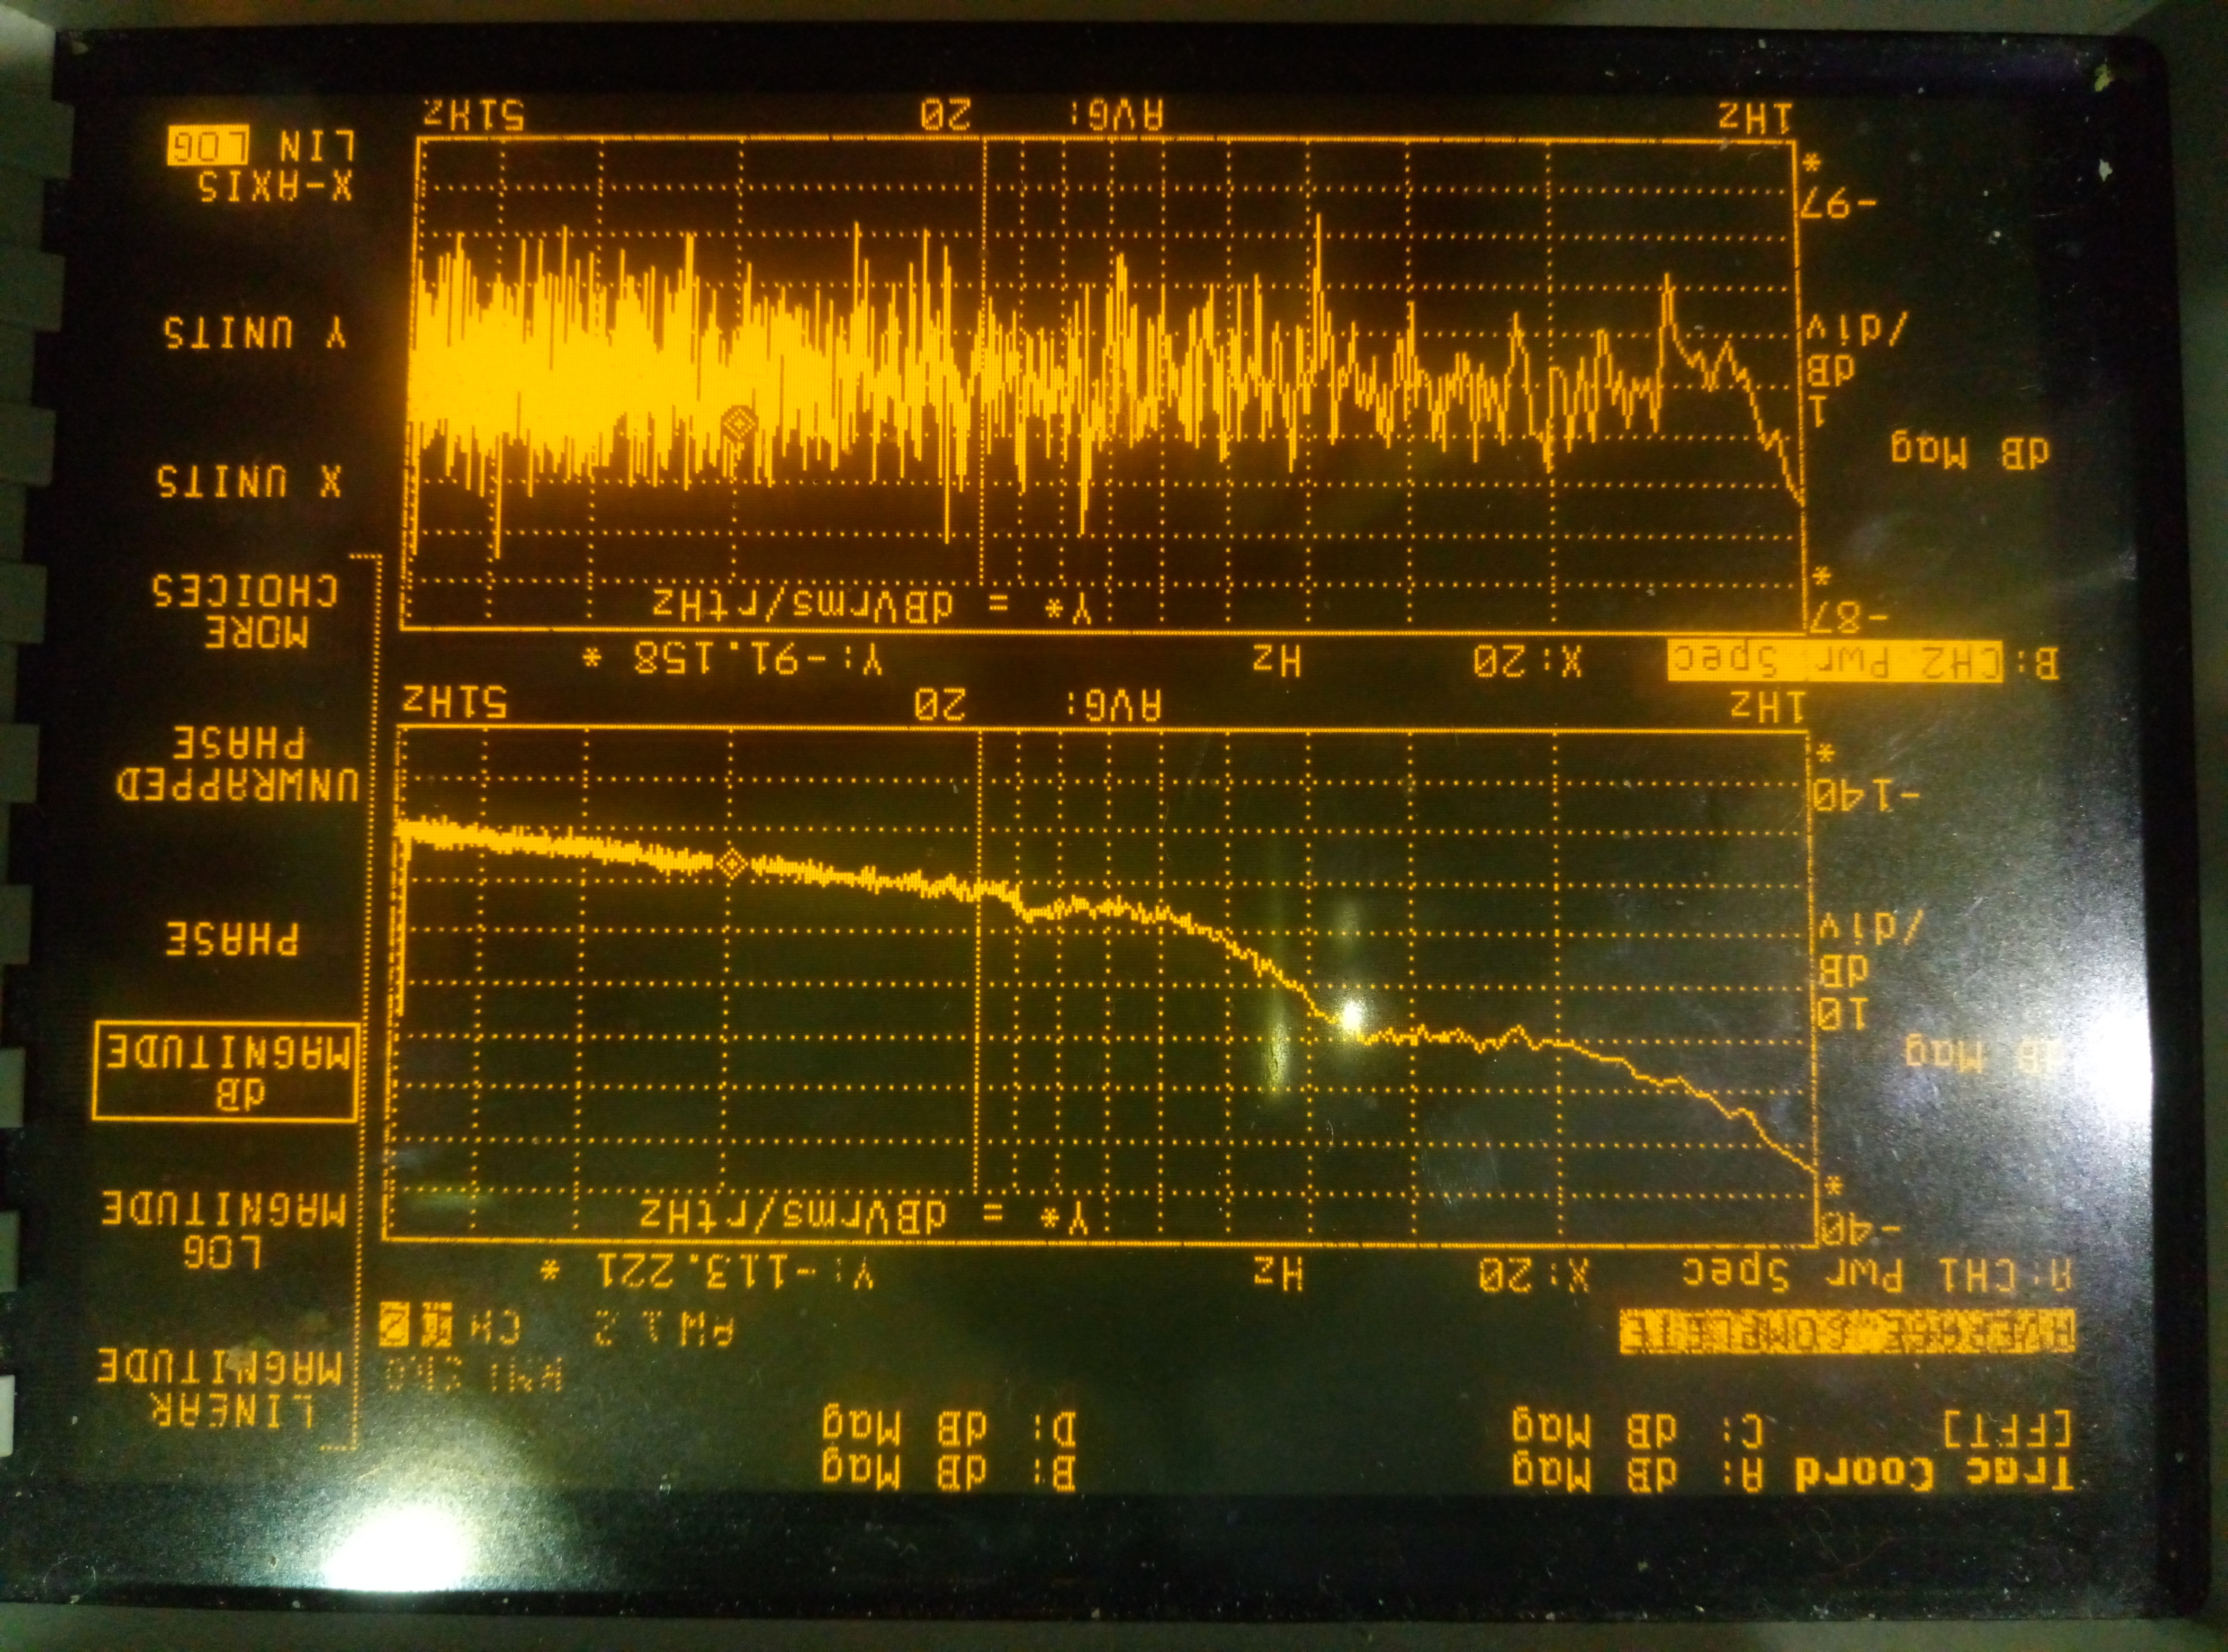
We also checked the situation if there is not noise injecting to the end mirror. It is shown in picture 4 and 5. By comparing them, I found the 20Hz disappear. But the noise level for the whole frequency band(from 1Hz to 50Hz) has decreased.
Conclusion:
1. The shaking of EM can cause precisely the same frequency noise in PZT. And also the harmonic peak.
2. In the aspect of error signal, the shaking of EM noise will be distributed from one frequency to the whole band. This distribution may come from filter.
3. By using the transfer function we created before, we cannot predict the behavior of error signal in the low-frequency band.
Next step:
To solve the problem of transfer function for low-frequency.
From the picture 2, we can read the peak value of this noise. It is 45.7407uVrms. And according to the block flow, we can calibrate this value to error signal. The formula is Err_V = K(V/Hz) * S_Hz/(1- (f/f_0)^2).
K is 3.1e-3, S_Hz is V_RMS (V) * 100 * sqrt(2) * 2e6 Hz/V=12937Hz, f_0=1.45kHz. In this case Err_V=38.8Vrms. However we read from the spectrum, it is 1.6mVrms.
We also checked the situation if there is not noise injecting to the end mirror. It is shown in picture 4 and 5. By comparing them, I found the 20Hz disappear. But the noise level for the whole frequency band(from 1Hz to 50Hz) has decreased.
Conclusion:
1. The shaking of EM can cause precisely the same frequency noise in PZT. And also the harmonic peak.
2. In the aspect of error signal, the shaking of EM noise will be distributed from one frequency to the whole band. This distribution may come from filter.
3. By using the transfer function we created before, we cannot predict the behavior of error signal in the low-frequency band.
Next step:
To solve the problem of transfer function for low-frequency.
Images attached to this report