In the past days we tried to characterize the locking loop of the filter.
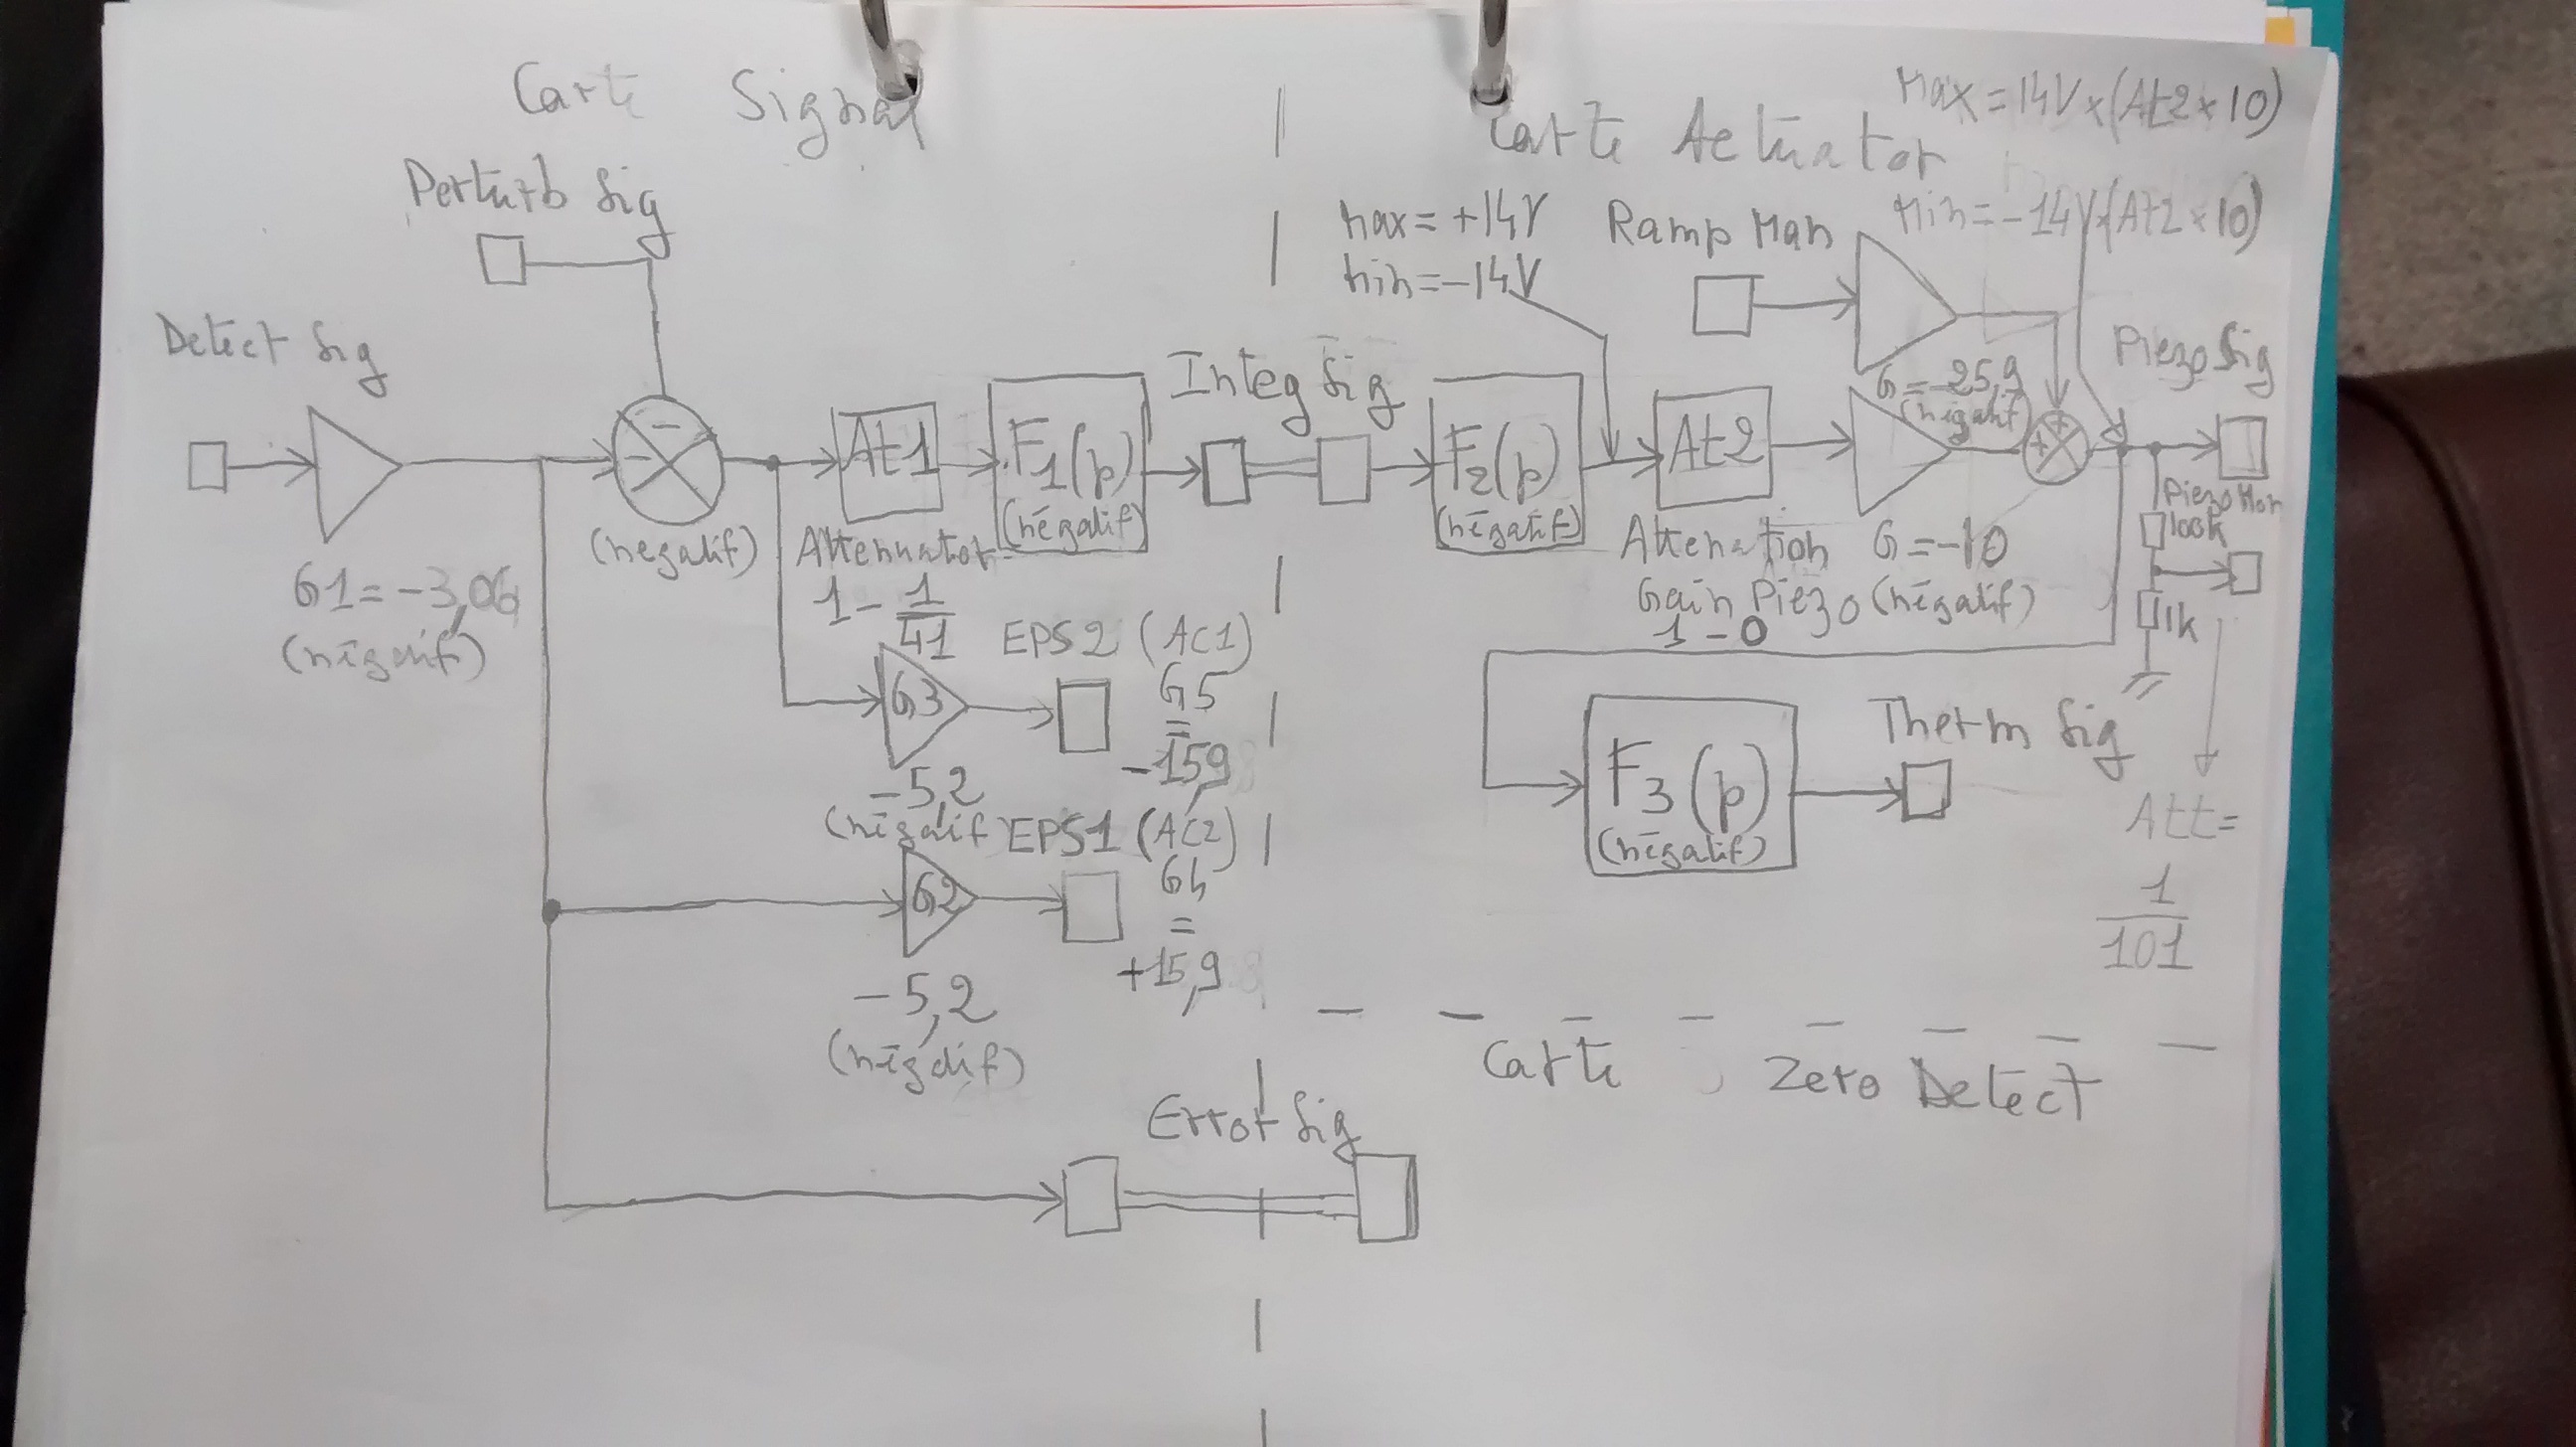
The loop transfer function for the filter cavity (sketched in figure1) is compose by different blocks
-
G1 [Hz/V] = piezo actuator
-
G2 [Hz/Hz] = SHG
-
G3 [Hz/W] = cavity
-
G4 [W/V] = photodiode + demodulation
-
H [V/V]= servo
if we define G = G1*G2*G3*G4 the open loop trasfer function is simply H*G
In the loop scheme are shown the points where we can read the signal and the points when we can inject noise. By choosing the appropriate combination of observation and injection points we have tried to measure different parts of the loop transfer function. In particular
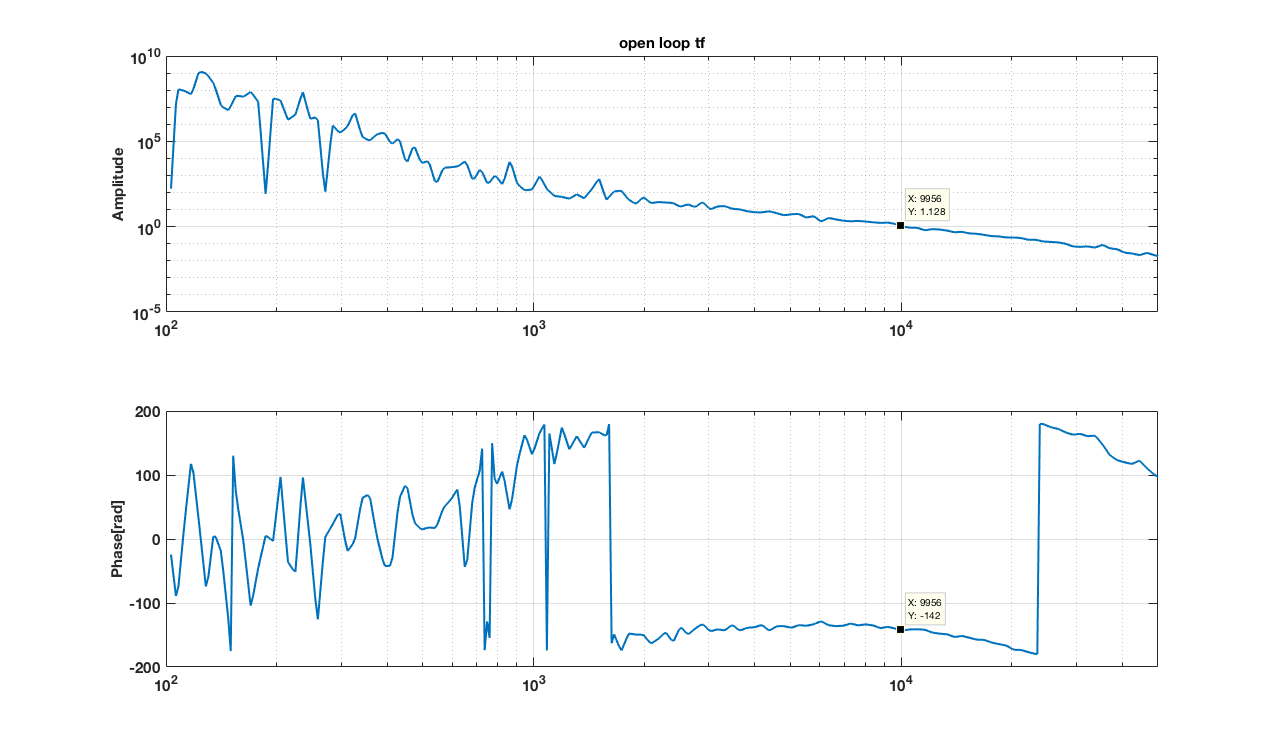
1) H*G -> OPEN LOOP TF
-
inject noise on perturb
-
measure EPS1/EPS2
NOTE: We perform this measurement with a swept sign. (See picture 2) It allows to measure the UGF and the phase margin. The measure is not good at low frequency where the gain on the loop is higher. Unfortunately at these frequency where are not able to inject enough noise to dominate the error signal without unlocking.
2) H -> ELECTRONIC TF
-
inject noise on perturb
-
measure piezo mon/EPS2
NOTE: We performed the measure with a swept sine (See picture 3). Unfortunately I was not able to find a way to monitor the coherence between the two channels while performing a swept sine, so I don't know how much we can trust the measurement. It seems to be flat after the cavity pole (1.5 kHz) as it should be.
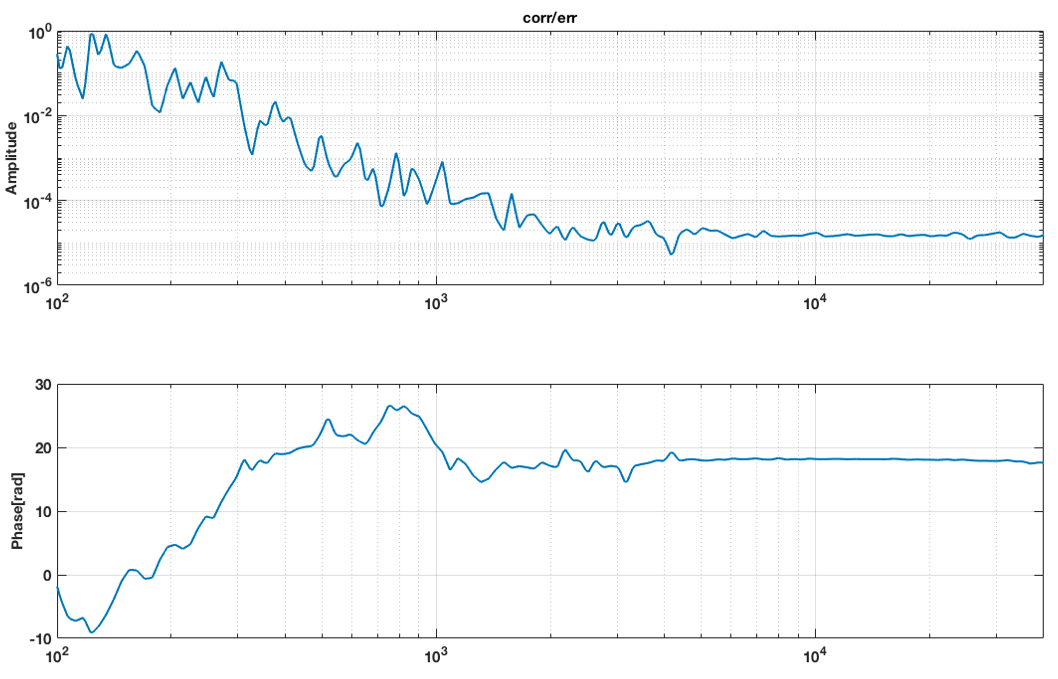
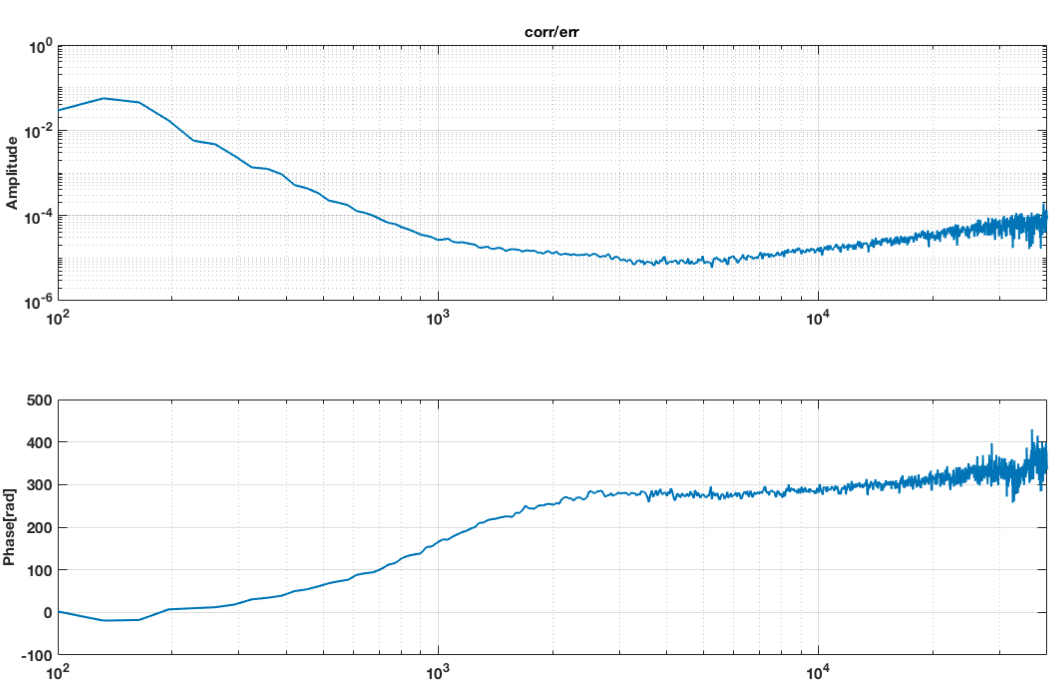
We have also perform the TF without injecting additional noise and assuming that the laser was sufficiently high. A result of the measure is plot in figure 4. I have also measures the coherence between the two channels ( shown in picture 5) which shoud tell in which regions the measuremts is more reliable.
3) G
-
inject noise on RAMP
-
measure EPS2/piezo mon
NOTE: The blocks composing G are basically frequency independent up to few tens of KHz except for the cavity which should have a pole at 1.45 KHz.
Being able to fit the pole frequency would allow a measurement of the cavity finesse [ f_p = c/( 4*L*F)]
Also in this case, the amount of noise we could inject without unlocking was not high enough to provide a clear measurement ( we tried with with noise and swept sign). The obtained TF is shown in picture 6. it is not possible to extrapolate a value for the cavity pole.
In the last picture there is a scheme of the rampeauto done by Pierre prat with a summary of the gain of each channel.