Yuhang and Marc
As reported in logbook3064, the noise coupling from 532nm pump relative intensity noise (RIN) to anti-squeezing was characterized. In this logbook, we report the same noise coupling way, but it's from RIN to squeezing.
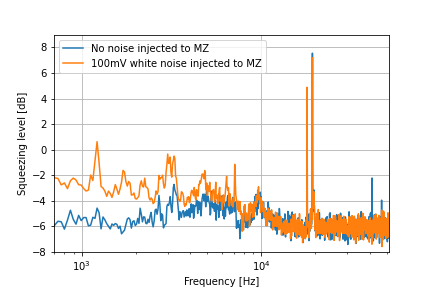
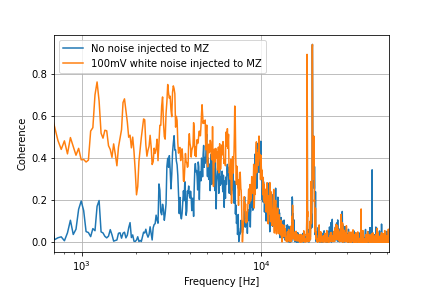
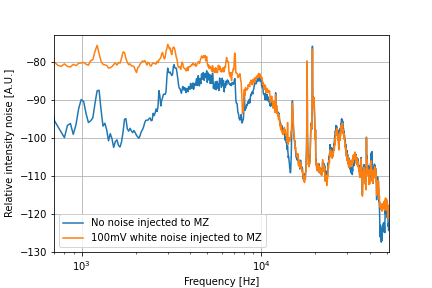
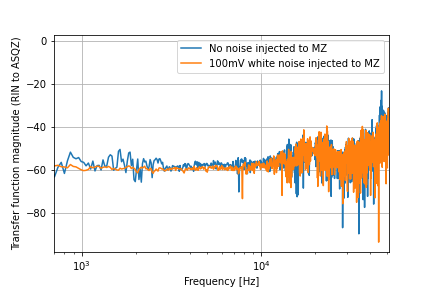
For two situations of no noise sent to MZ and 100mV sent to MZ, we measured four spectra, including RIN spectrum, squeezing spectrum, transfer function spectrum (from RIN to squeezing), coherence spectrum. The comparison of each spectrum in the two situations is shown in attached figure 1 to 4.
We can see that the noise injection is coherent below about 10kHz. So the transfer function measurement should be reliable below this frequency. Therefore, we take the measured transfer function when 100mV is sent to MZ for calculation in the next step.
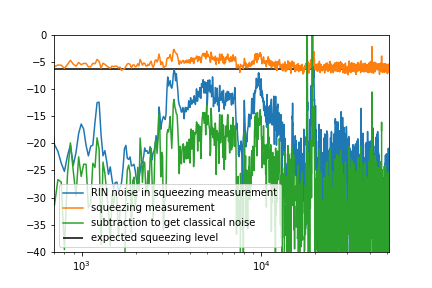
The next step calculation is firstly a subtraction of measured squeezing spectrum (orange in Fig. 5) and expected squeezing level (black in Fig. 5). This expected squeezing level is an estimation of a constant value of 6.4 dB since squeezing is frequency independent, considering the flat region of measured squeezing spectrum above 20kHz. The result of the subtraction is the green curve in Fig. 5, which should represent all the calssical noise, such as homodyne electronic noise, pump amplitude/phase noise, and LO amplitude/phase noise. On the other hand, we use the transfer function to transfer the RIN, measured when no noise is sent to MZ, to squeezing measurement. Thus we get the blue curve in Fig. 5, which should represent the classical noise coming from the pump amplitude noise (RIN). However, we see in Fig. 5 that the green curve is even lower than the blue curve, which seems not very reasonable for me since total noise (green) should not be smaller than a signle noise component (blue).
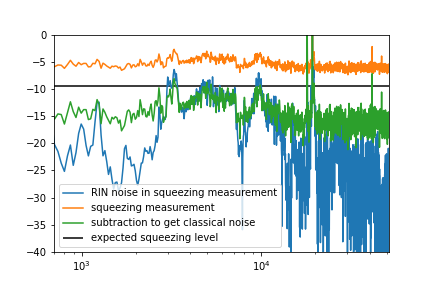
To solve the mismatch of green and blue curves issue in Fig. 5, we adjusted the expected squeezing level by hand to 9.4 dB. Then we get Fig. 6 which makes the derived total noise (green curve) overlap with a single RIN noise (blue curve) at peaks around 10kHz. We should note that this is just a guess of squeezing level of 9.4dB, but it could explain better the classical noise coupling to squeezing. The green curve has some frequency regions higher than the blue curve, which could be also reasonable if the pump phase noise, LO amplitude/phase noise can contribute to that. However, the noise contribution from these other noise sources needs to be verified.