Marc, Yuhang
The past trials to measure the AA sensing matrix taking into account possible coupling between pitch and yaw of both input and end mirrors were all based on injecting 2 Hz lines on each degree of freedom (dof).
This gave us strange results, especially visible in the TF phase between each excitation and sensing QPDs (ie far from +/-180 or 0 degrees).
As suggested by Raffaele in last FC meeting, this could arise because 2Hz is too close to the mechanical resonance of the mirror.
Therefore, we decided to use 15 Hz lines to measure the TFs.
We also tried to measure the demodulation phase between I and Q of each QPD segment using a 15 Hz line but this was not so much conclusive ( the line amplitude might have been too low and also hard to distinguish in the time series from the natural 11 Hz pitch resonance). So we used 2 Hz line to tune this demodulation phases.
They are now :
| segment | QPD1 1 | QPD1 2 | QPD1 3 | QPD1 4 | QPD2 1 | QPD2 2 | QPD2 3 | QPD2 4 |
| phase [deg] | 130 | 120 | 120 | 120 | -10 | 0 | 0 | 0 |
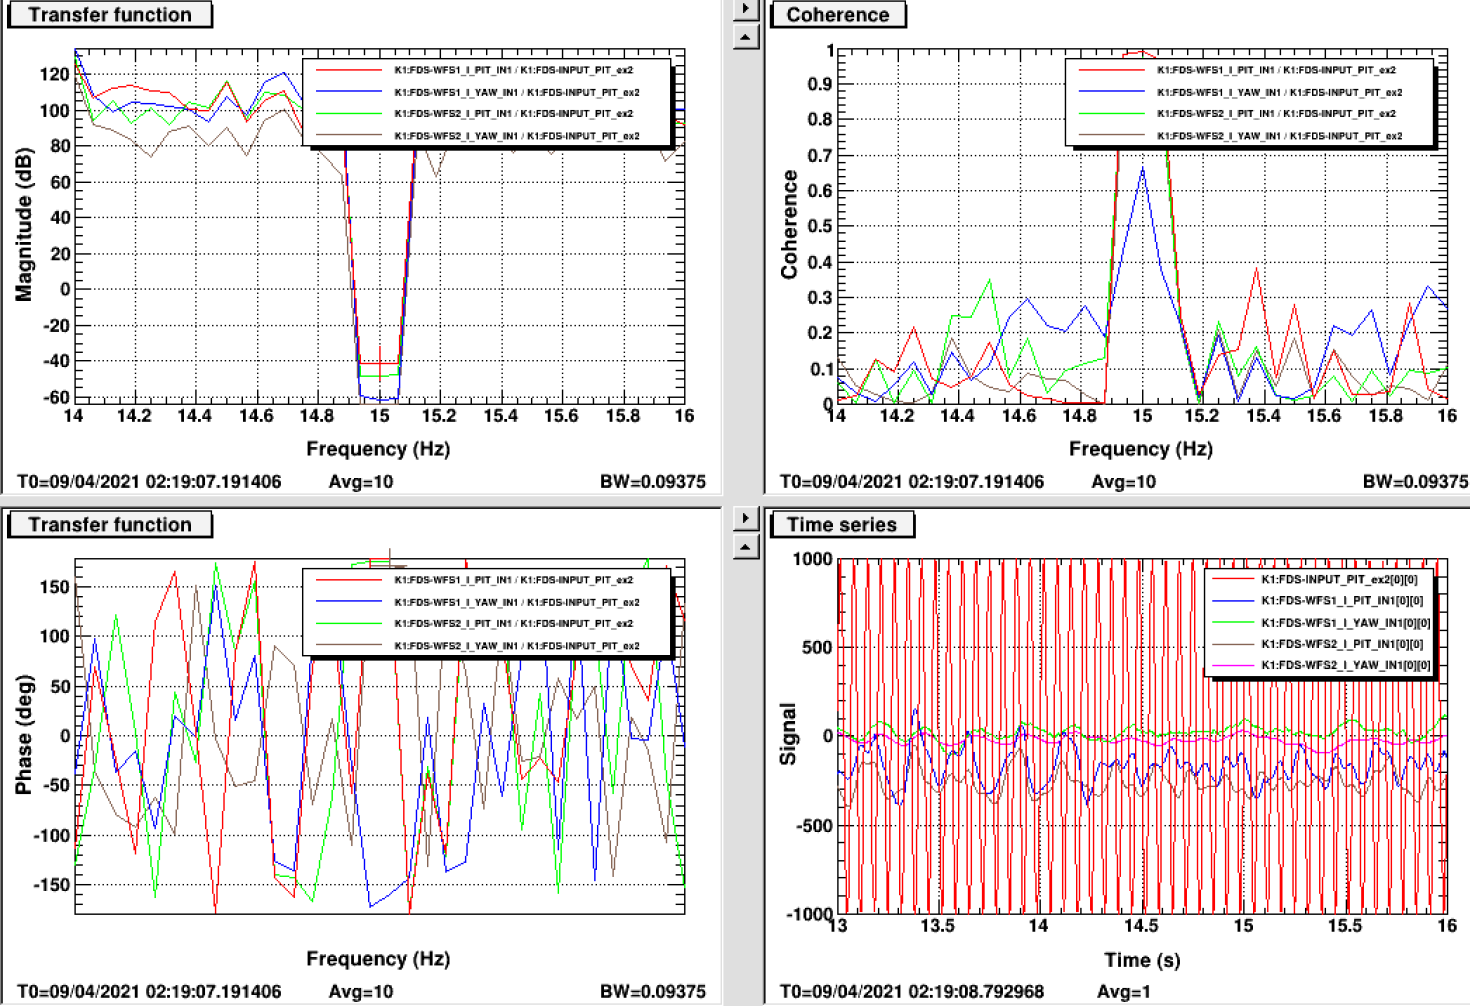
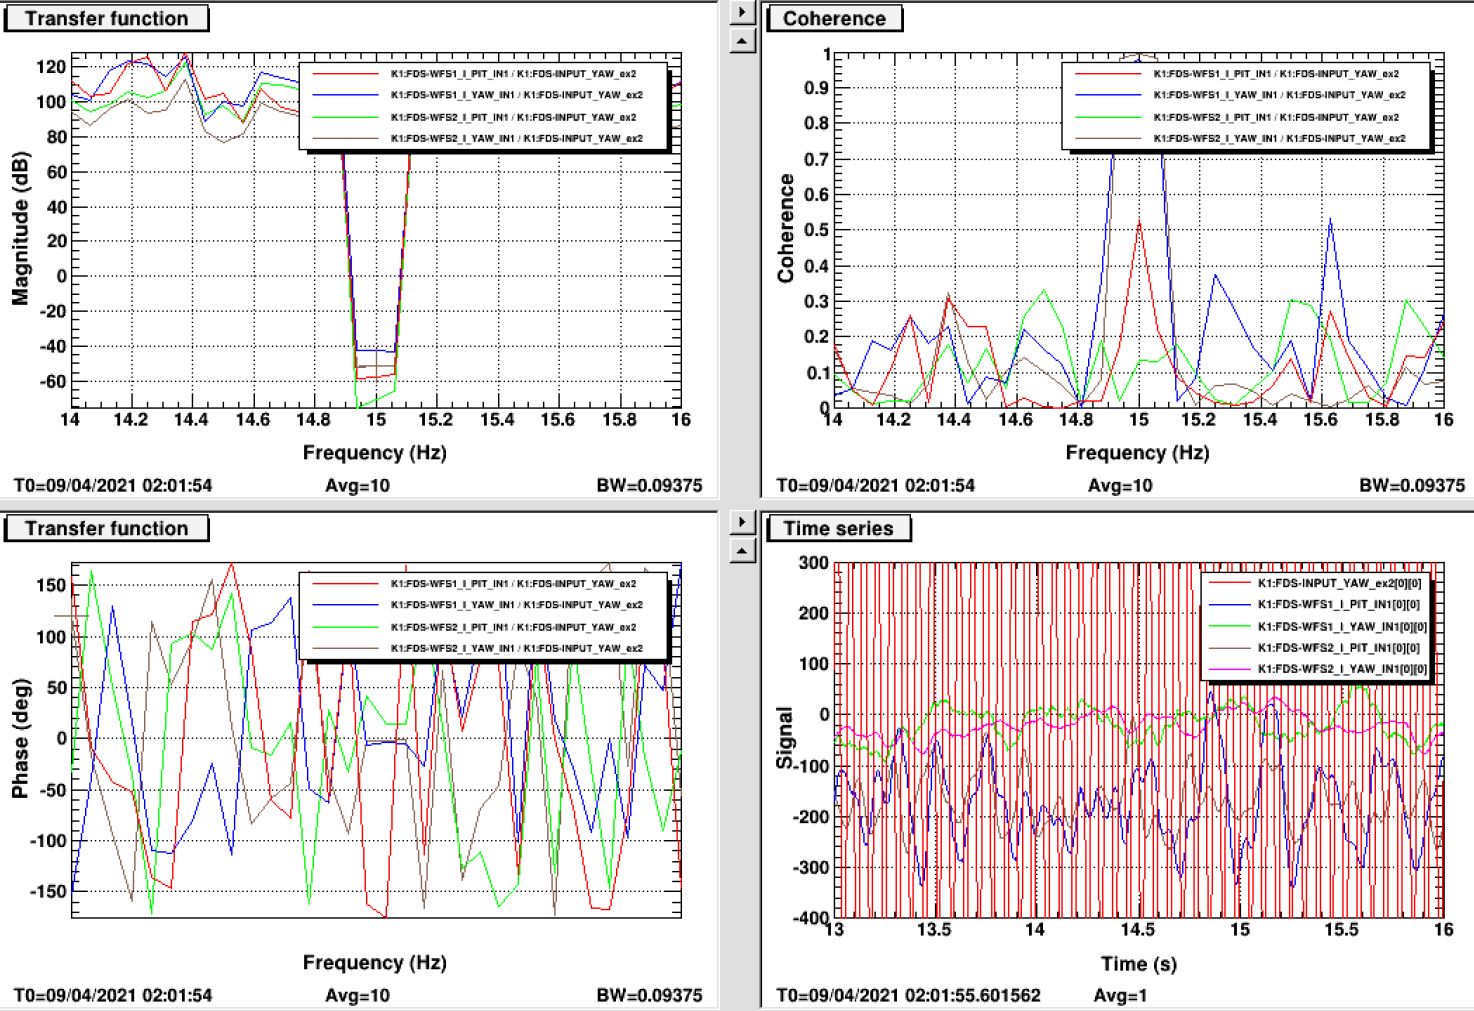
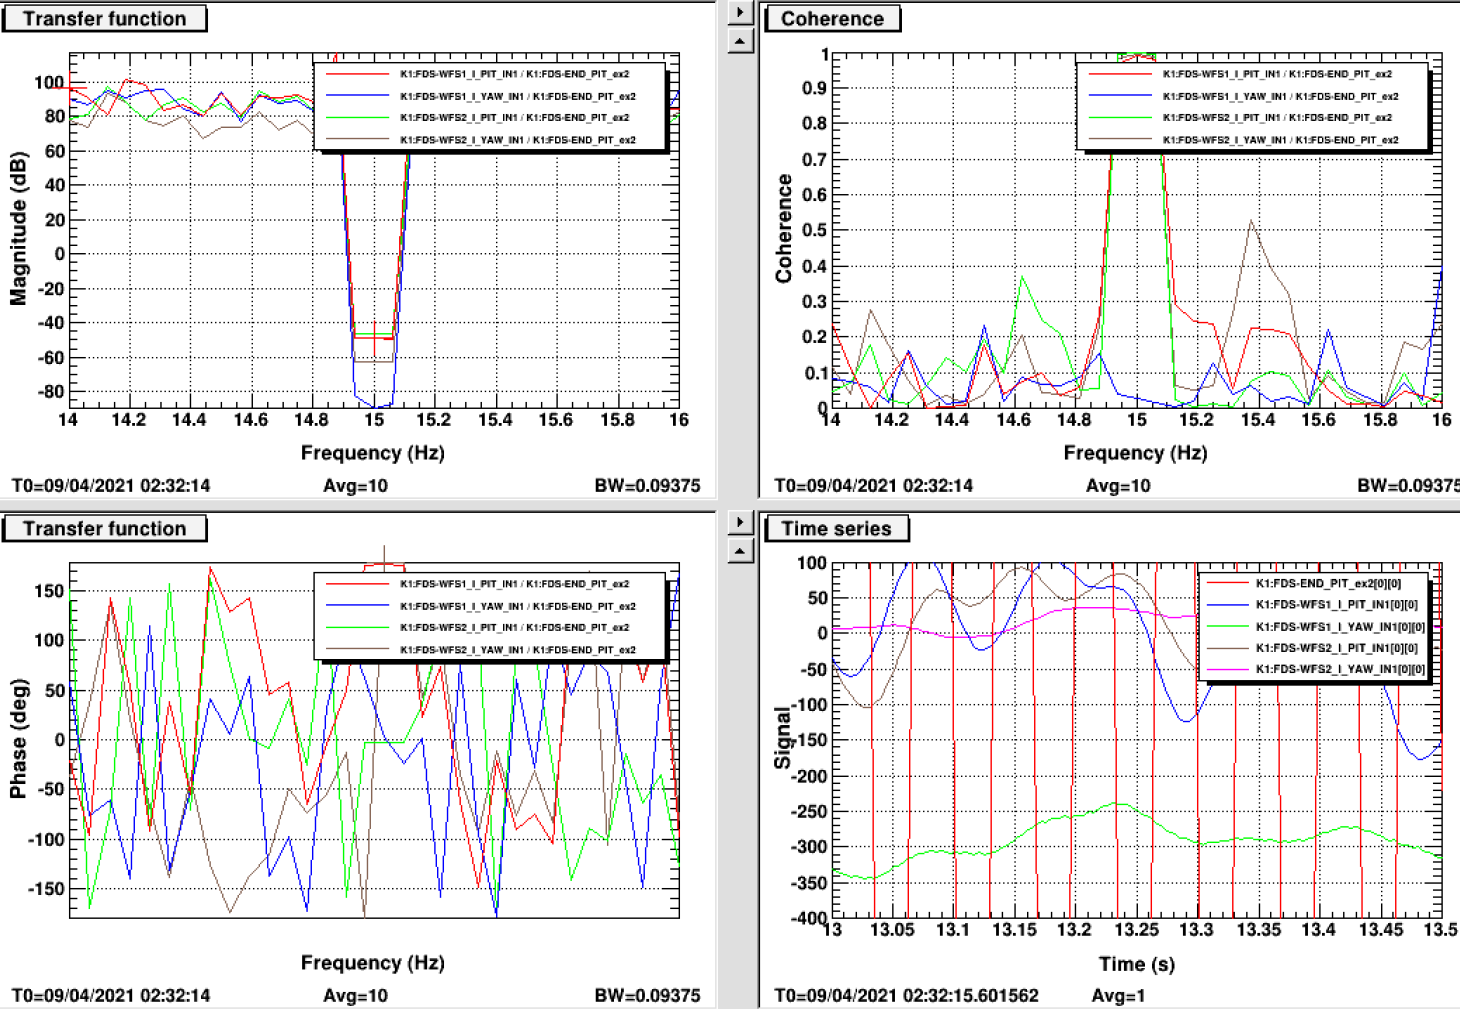
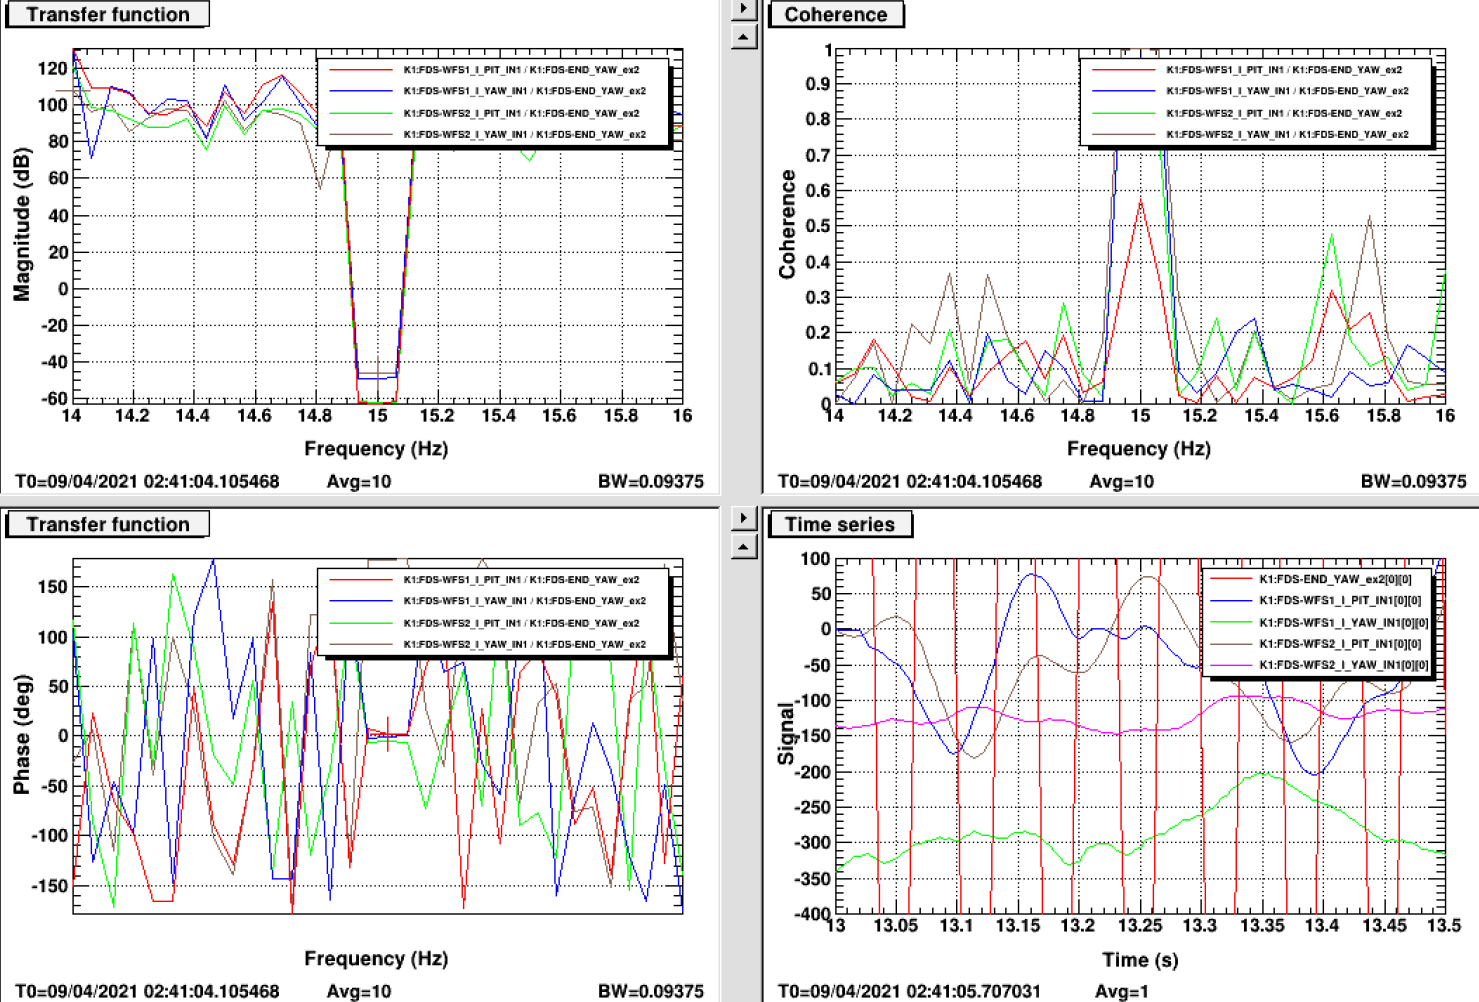
Then we injected a line at 15 Hz on each mirror dof with amplitude 1000 except for end pitch which was 1500 (without particular reason...)
Figure 1 to 4 present the TF magnitude (top left) phase (bottom left), coherence (top right) and time serie (bottom right) for respectively input pitch excitation, input yaw, end pitch and end yaw.
The TFs magnitudes give the sensing matrix absolute value while the phase the sign of each element. We used only TF when the coherence was above ~0.4. From this all phases was +/-180 or 0 deg within less than 10 degrees.
This gave the following driving matrix :
| QPD1 pitch | QPD2 pitch | QPD1 yaw | QPD2 yaw | |
| 8.6 | 6.5 | 0.3 | 2.6 | In pitch |
| 7.1 | -15.2 | 1.2 | -0.6 | End pitch |
| 1.6 | 0 | -10.8 | -7.7 | In yaw |
| -1.4 | 1.4 | -5.5 | 16.6 | End yaw |
Note that the actual sign of the computed matrix is the opposite but we used a negative gain.
Using gain of -0.05 for in and end pitch and -0.05 for in and end yaw we could close the AA loop.
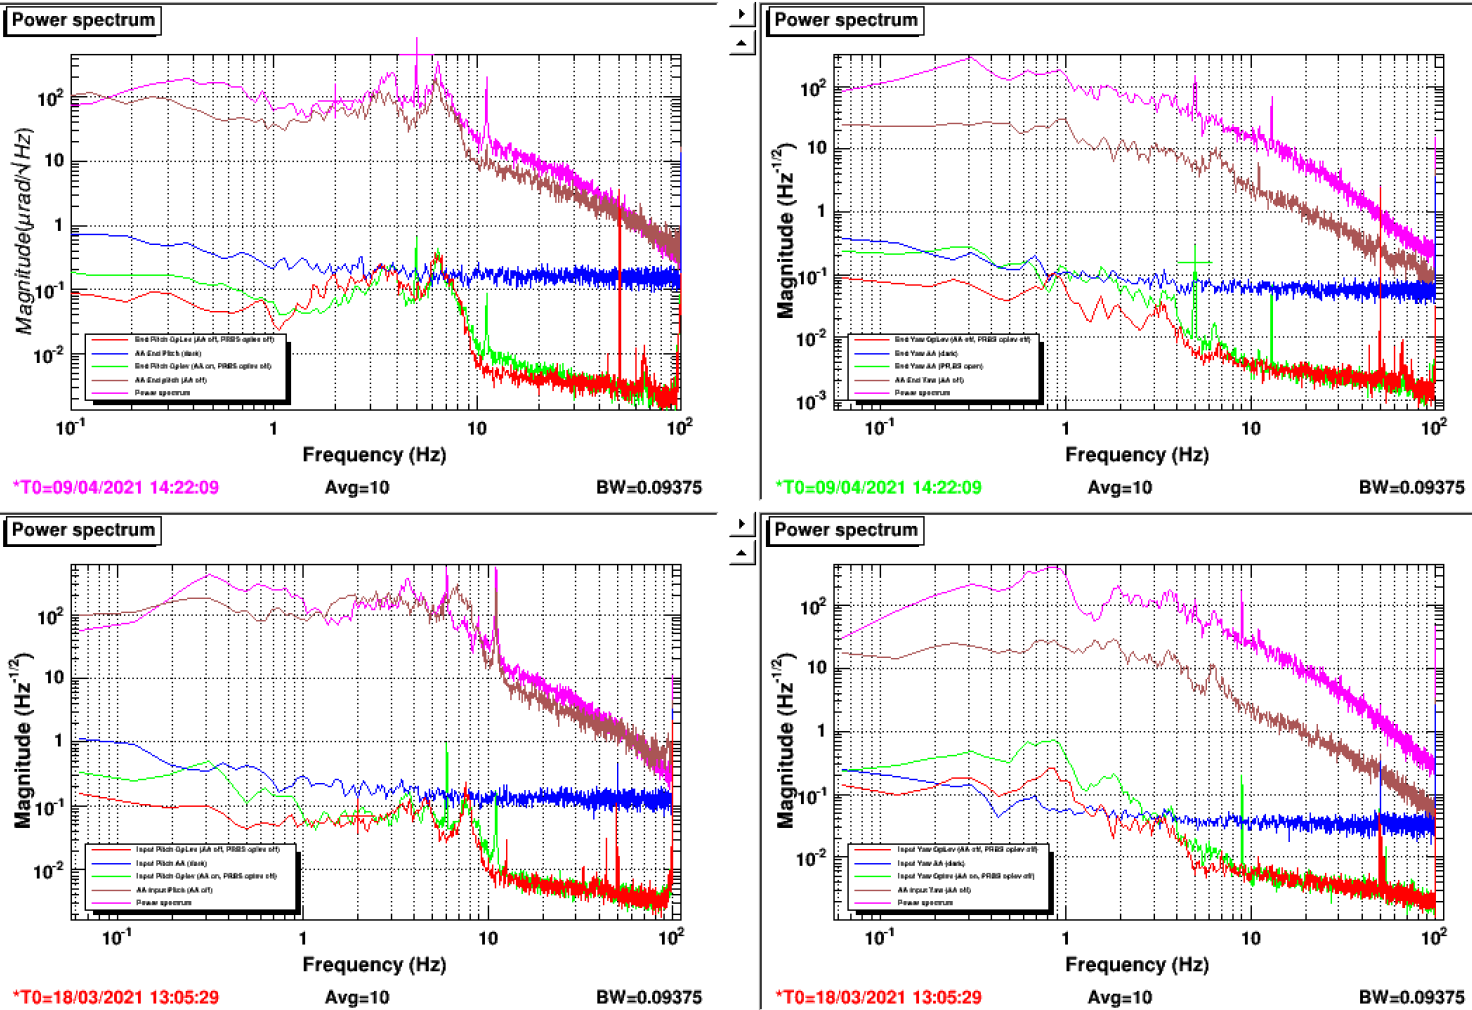
The comparison between the QPD and OpLev signals are presented in figure 5 (pink is live QPD, green is live OpLev).
We can see that there is almost no coupling between the various dof !
However, the AA loop gain needs to be reduced a bit more as we can see that it introduces noise (eg comparing the green with the brown := OpLev reference)