We did the same measurement as in logbook entry 1875, the QPD response to different size of the green beam
The measurement was done by using the green beam reflected by the green mode cleaner of the Virgo squeezer(1500W).
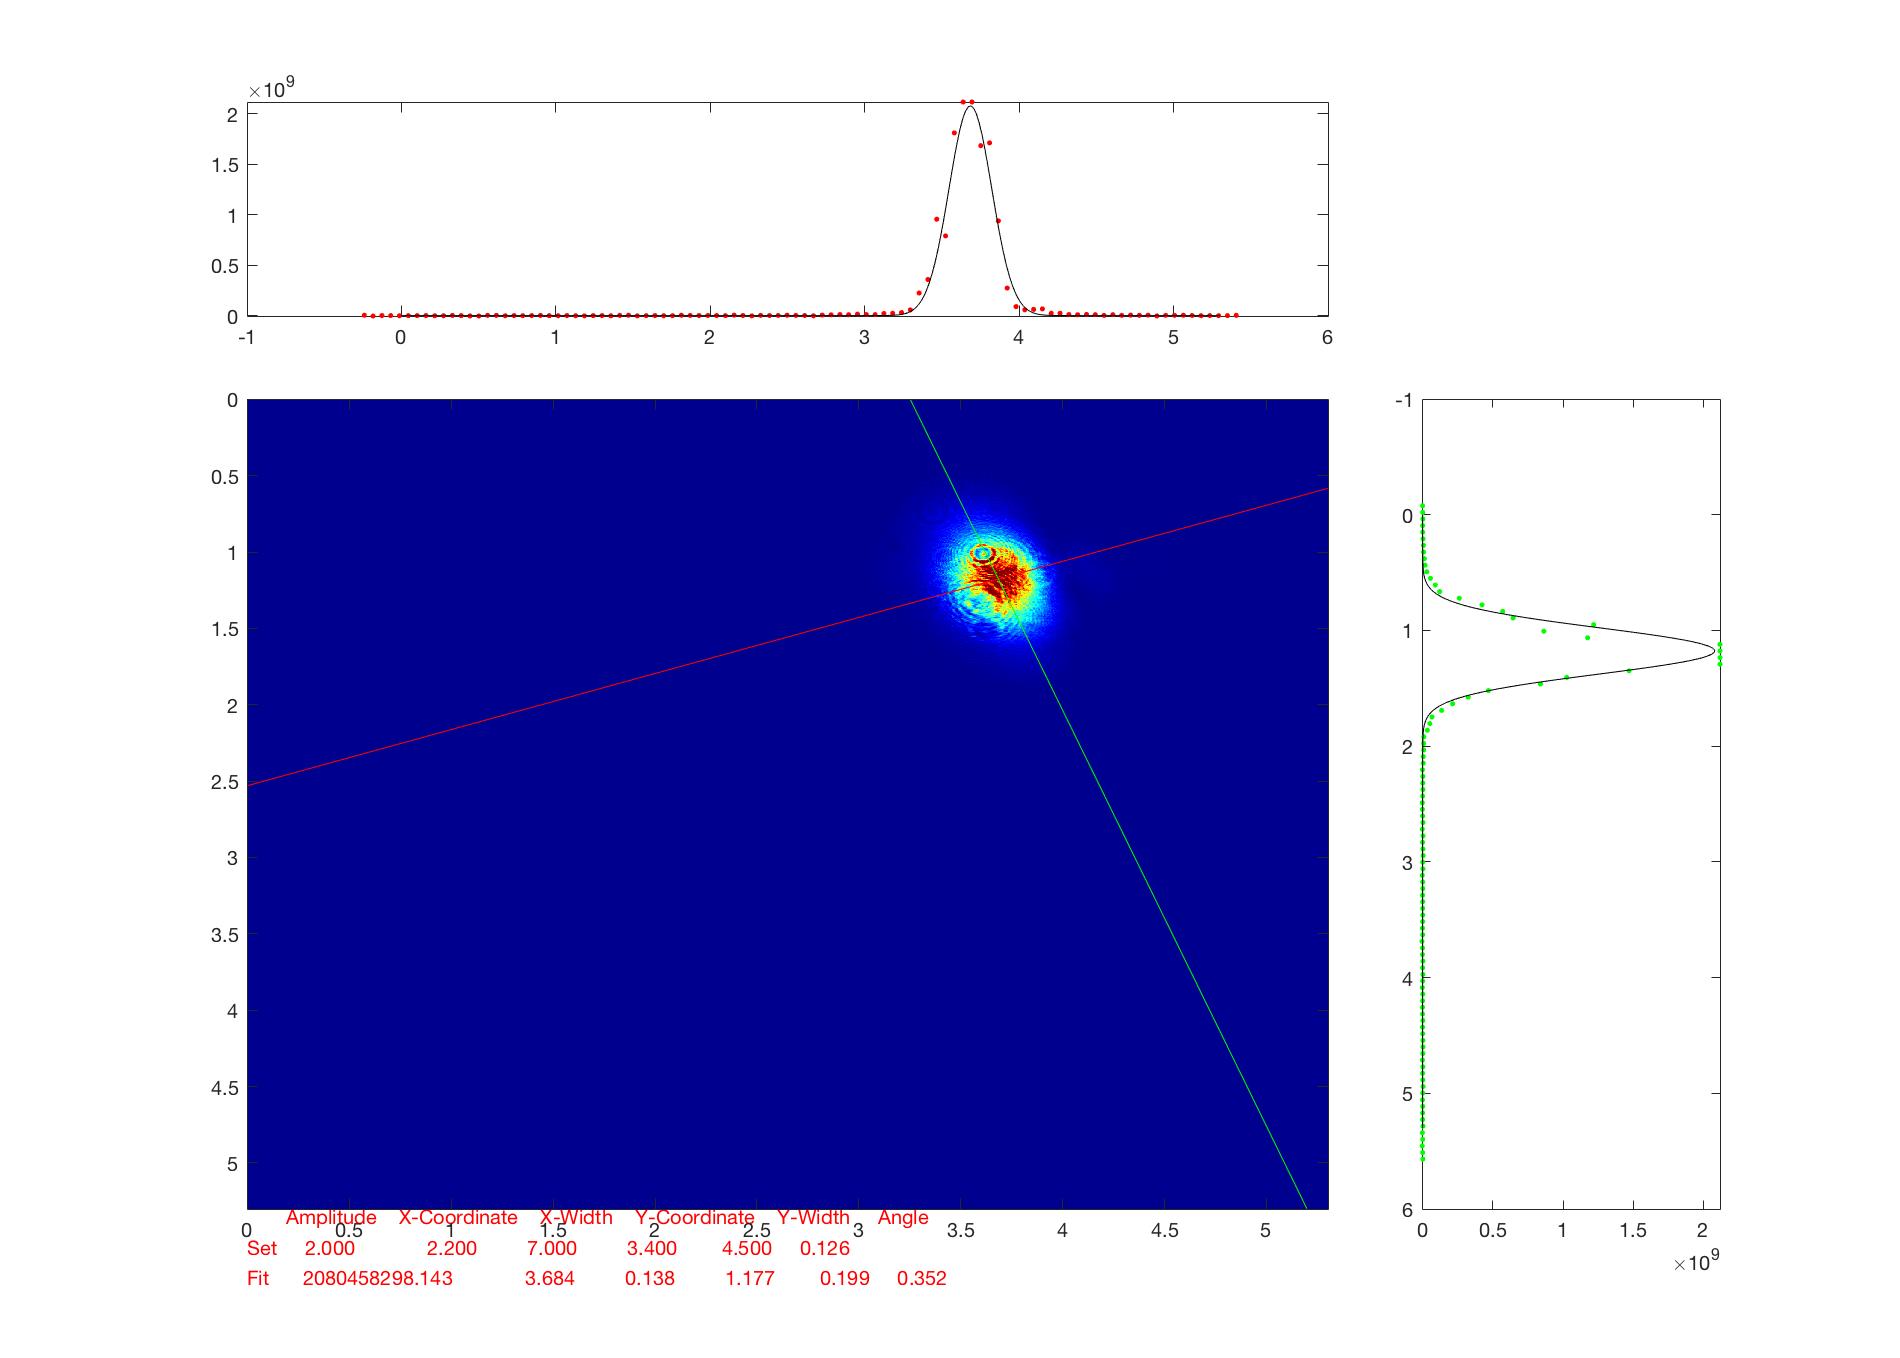
First, we measured the green beam size without any lenses and saved the data file from the beam profiler. The beam profiler has 1928*1448 pixels corresponding to active are of 7.1mm*5.3mm, we got power value at each data point, and we did a 2-d Gaussian fit to these data points. One of the fit shows in figure 1. From the beam plotted in this figure, it is clear that the beam has astigmatism, so the final beam waist size and position are quite different in two axes. Below is the number (position zero is just a random point we chose easy for the measurement)
|
|
Beam waist size |
Beam waist position |
|
X |
242um |
0.0924m |
|
Y |
367.6um |
0.6262m |
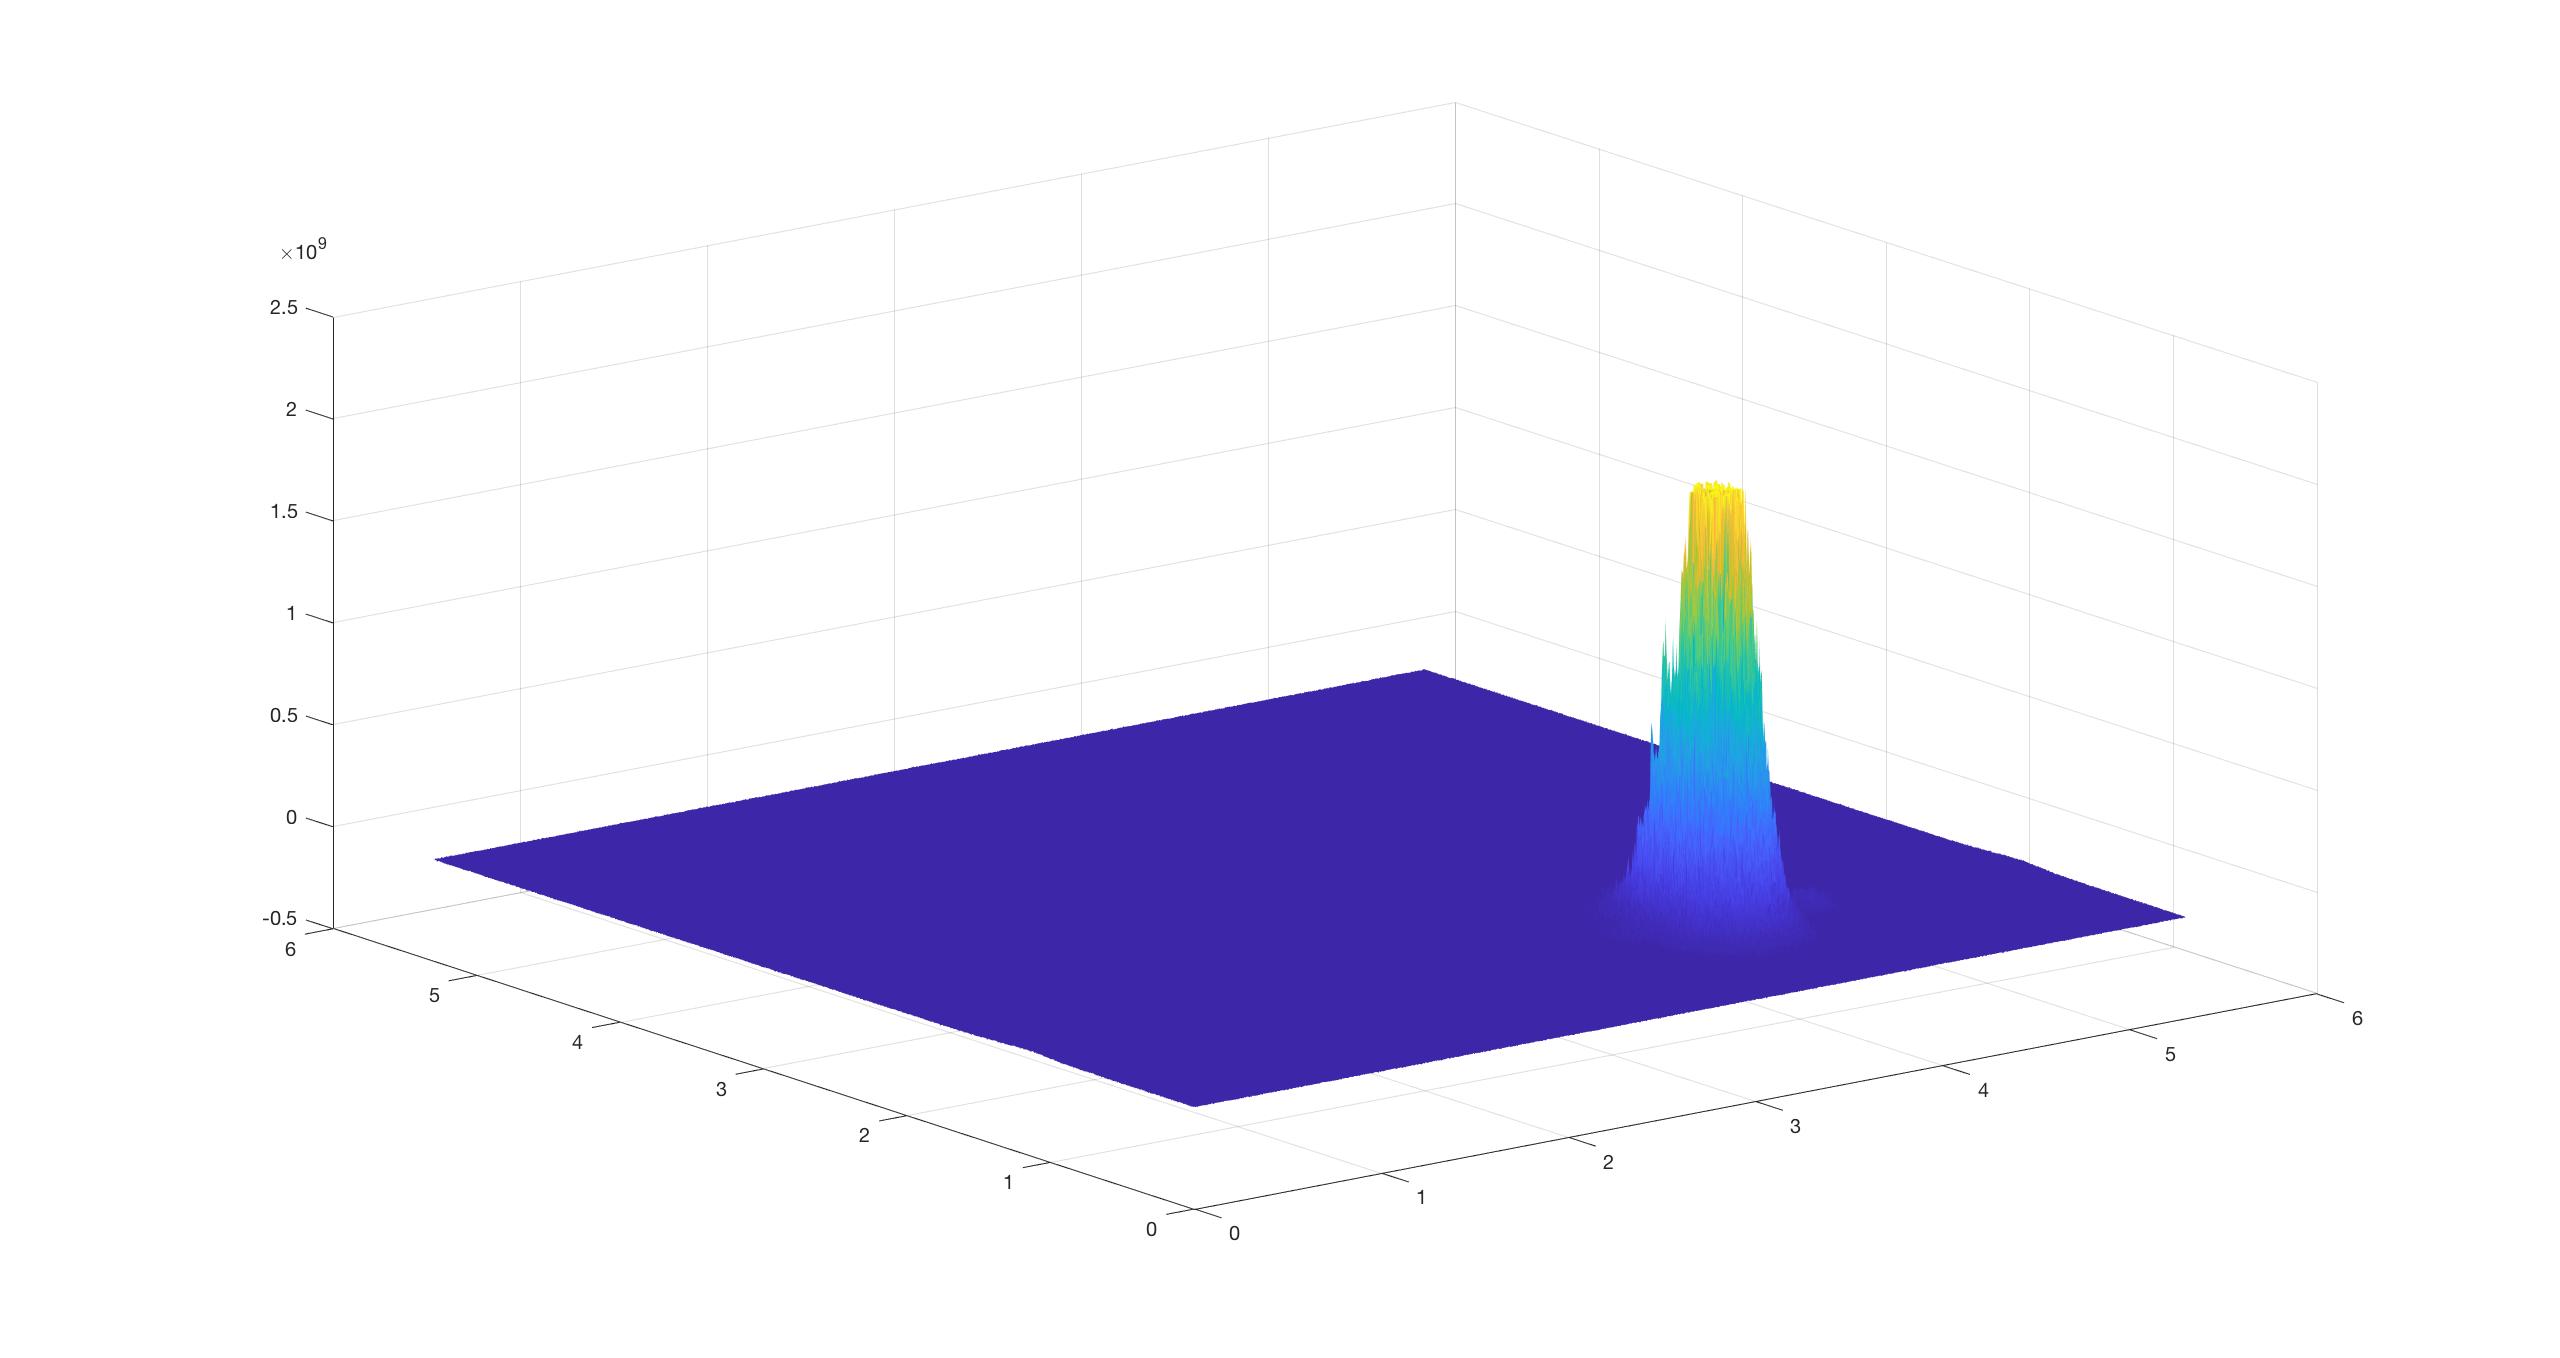
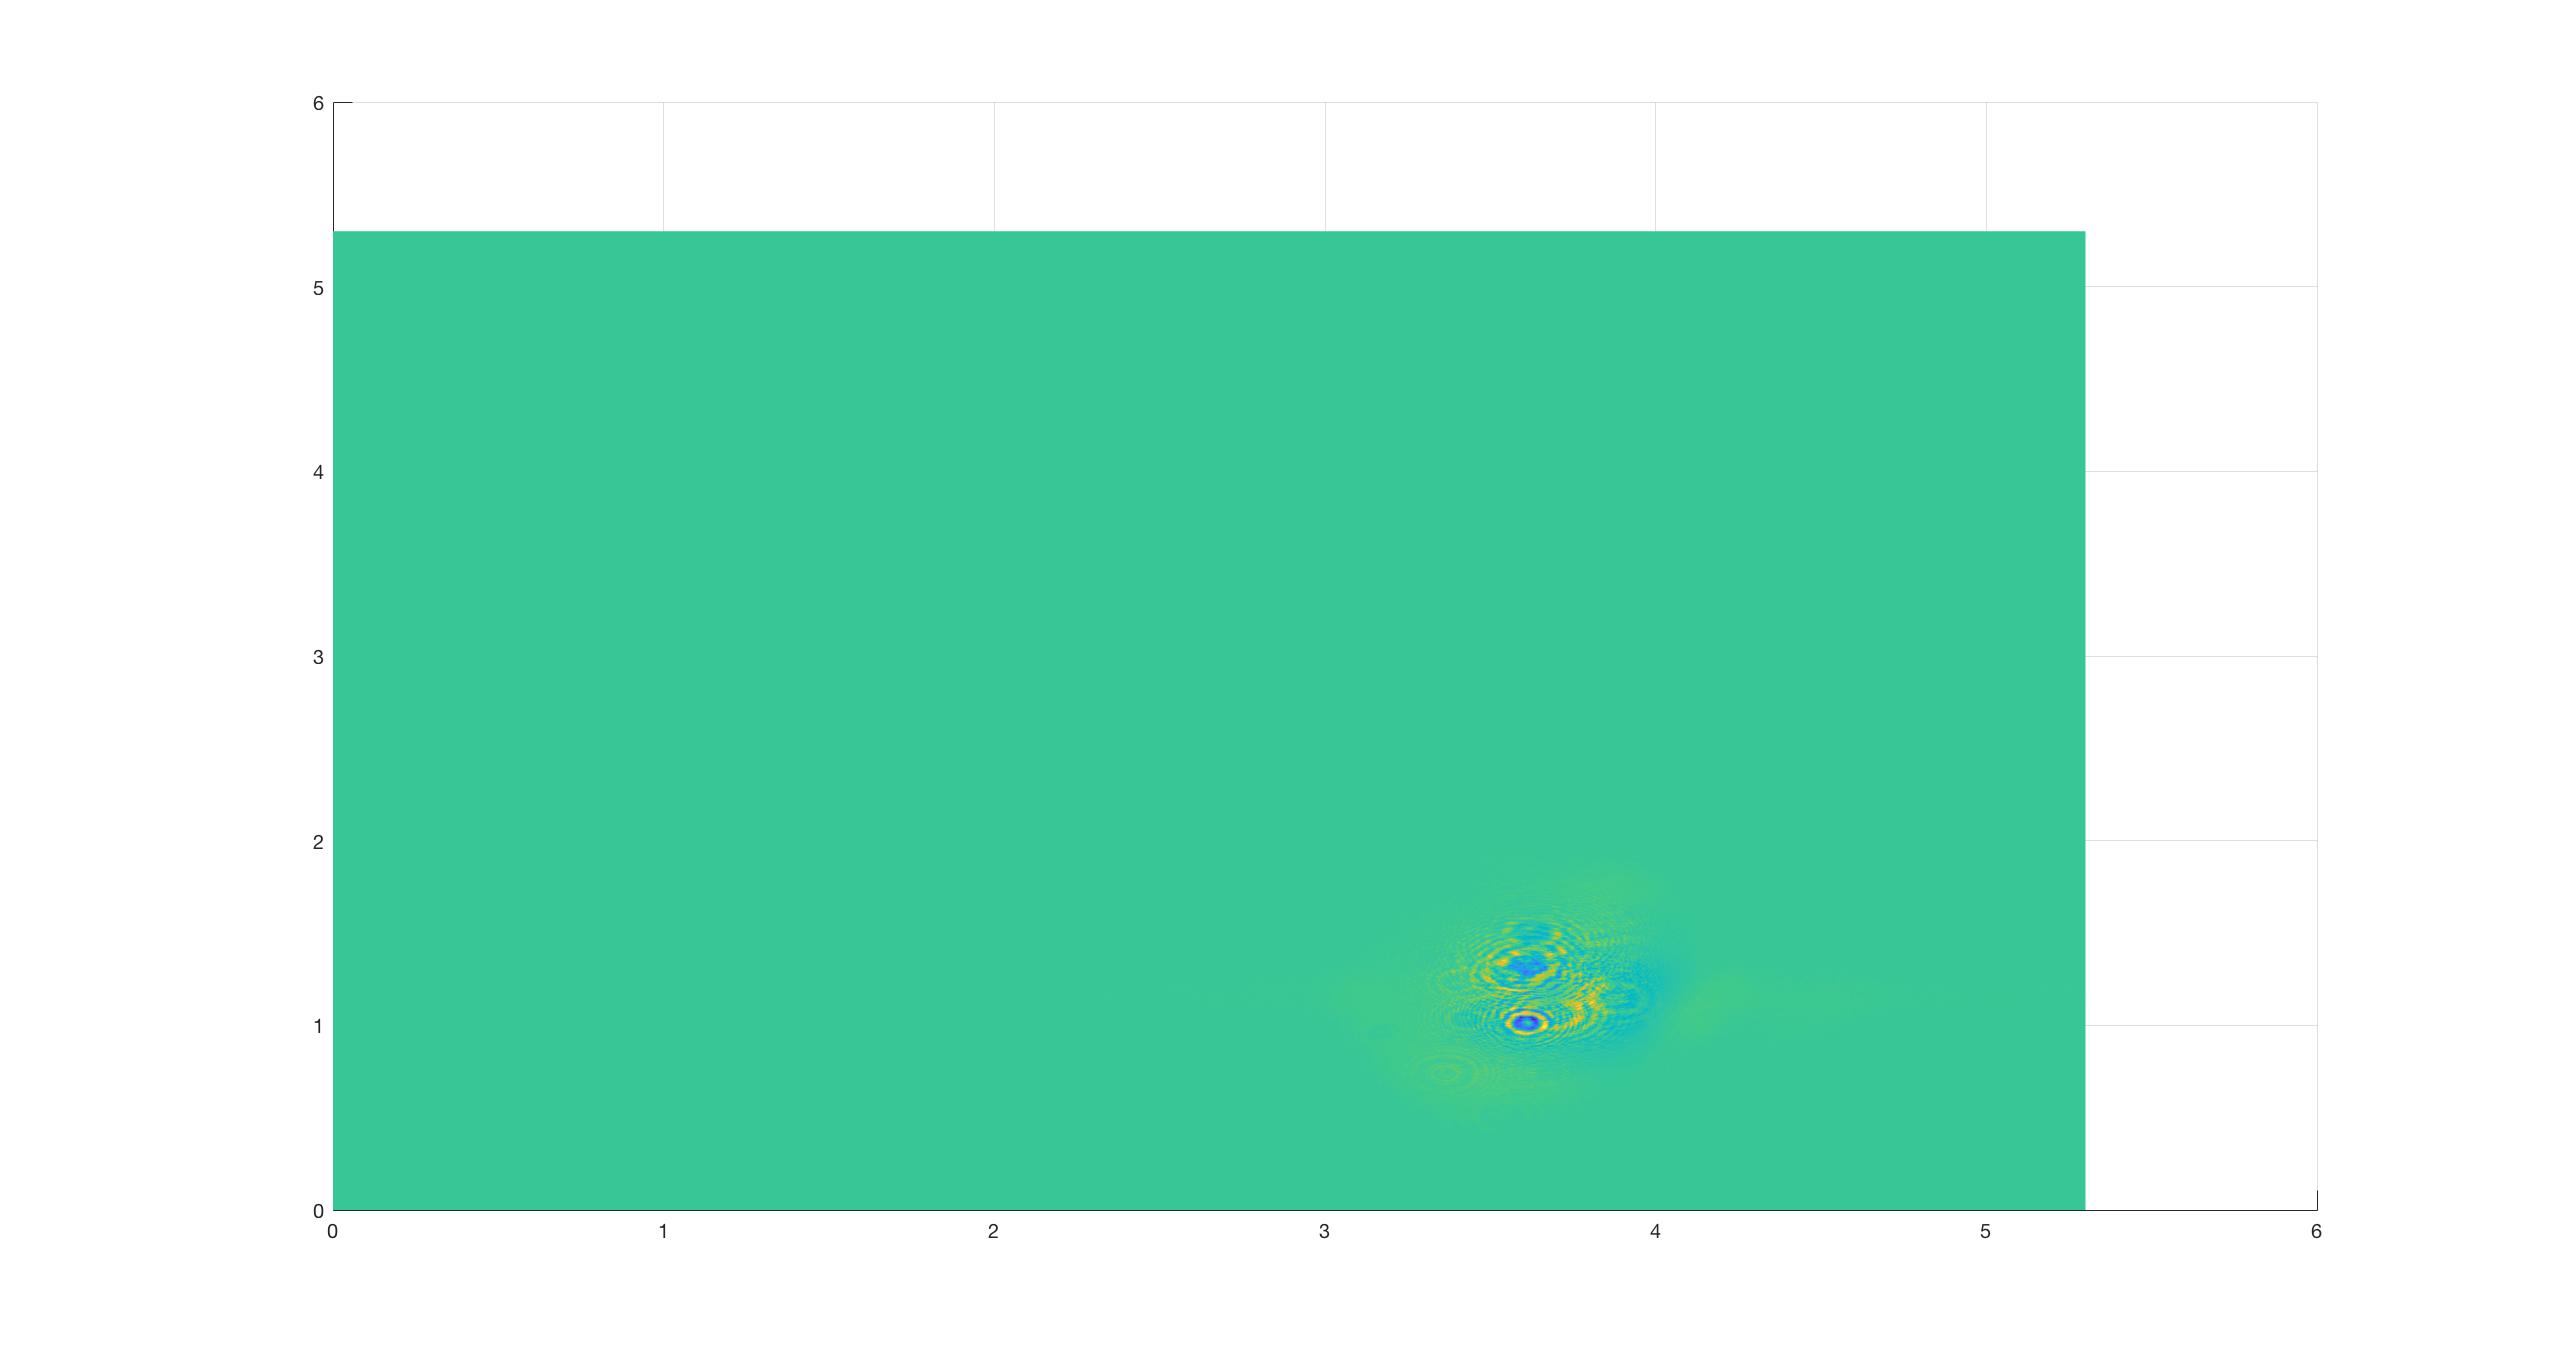
By checking the 2d plot of the raw data, we found out the beam profiler is saturated (fig 2 shows the top cut shape). But in the 2d fit, we were not able to remove these points by substituting them into 'NaN' while using 'lsqcurvefit' function in Matlab, because this function needs 'double' format input. Then to check the quality of the fit, we plot the difference between the fit the original data, result shows in figure 3. It seems the fit is fine. Since the data is very noisy, I was guessing maybe we actually got the peak of the Gaussian, and the saturation part is just the noise.
Anyway, after measuring the beam size, we put a 50mm lens and measured the beam with the QPD in different positions. We did two groups of measurements with different power by changing the density. the results show below.
|
Beam size |
Group 1 |
Group 2 |
|||
|
X direction (um) |
Y direction(um) |
DC (V) |
RBW/VBW/MHz (dBm) |
DC (V) |
RBW/VBW/MHz (dBm) |
|
35 |
23 |
1.35 |
-150.5 |
2.344 |
-150.6 |
|
148 |
256 |
1.35 |
-148.4 |
2.46 |
-148.7 |
|
277 |
496 |
1.309 |
-146.9 |
2.401 |
—145.6 |
|
407 |
738 |
1.307 |
-146.5 |
2.390 |
-144.8 |
|
538 |
979 |
1.307 |
-146.7 |
2.383 |
-144.7 |
|
668 |
1220 |
1.3 |
-146.6 |
2.360 |
-144.6 |