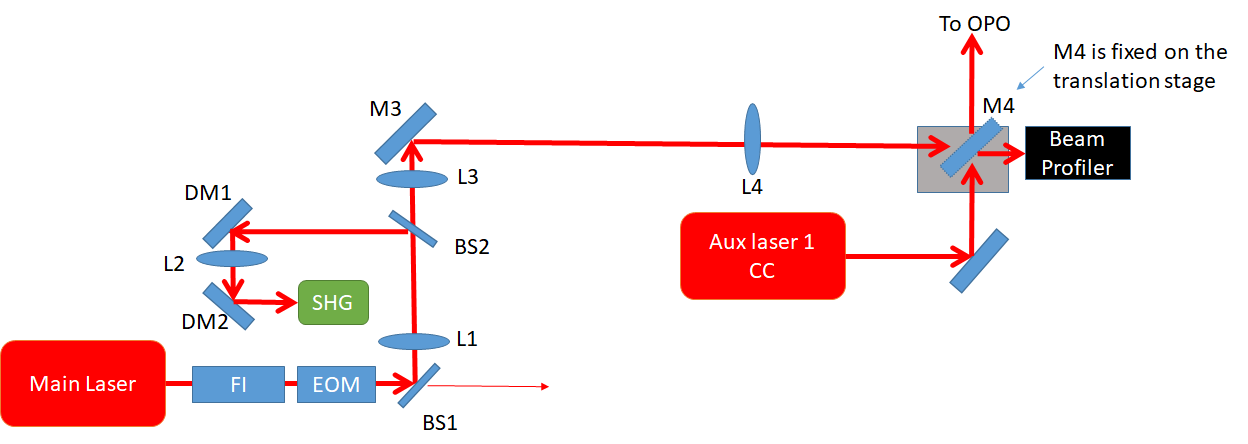
11/14 Participants: Chien-Ming, Shu-Rong, and Yuhang This morning we set up a telescope for the bright alignment beam. (see Fig. 1)
The focal length of M3 is 150mm. It is located at 65 mm from BS2.
The focal length of M4 is 200mm. It is located at 337.5 mm from M3.
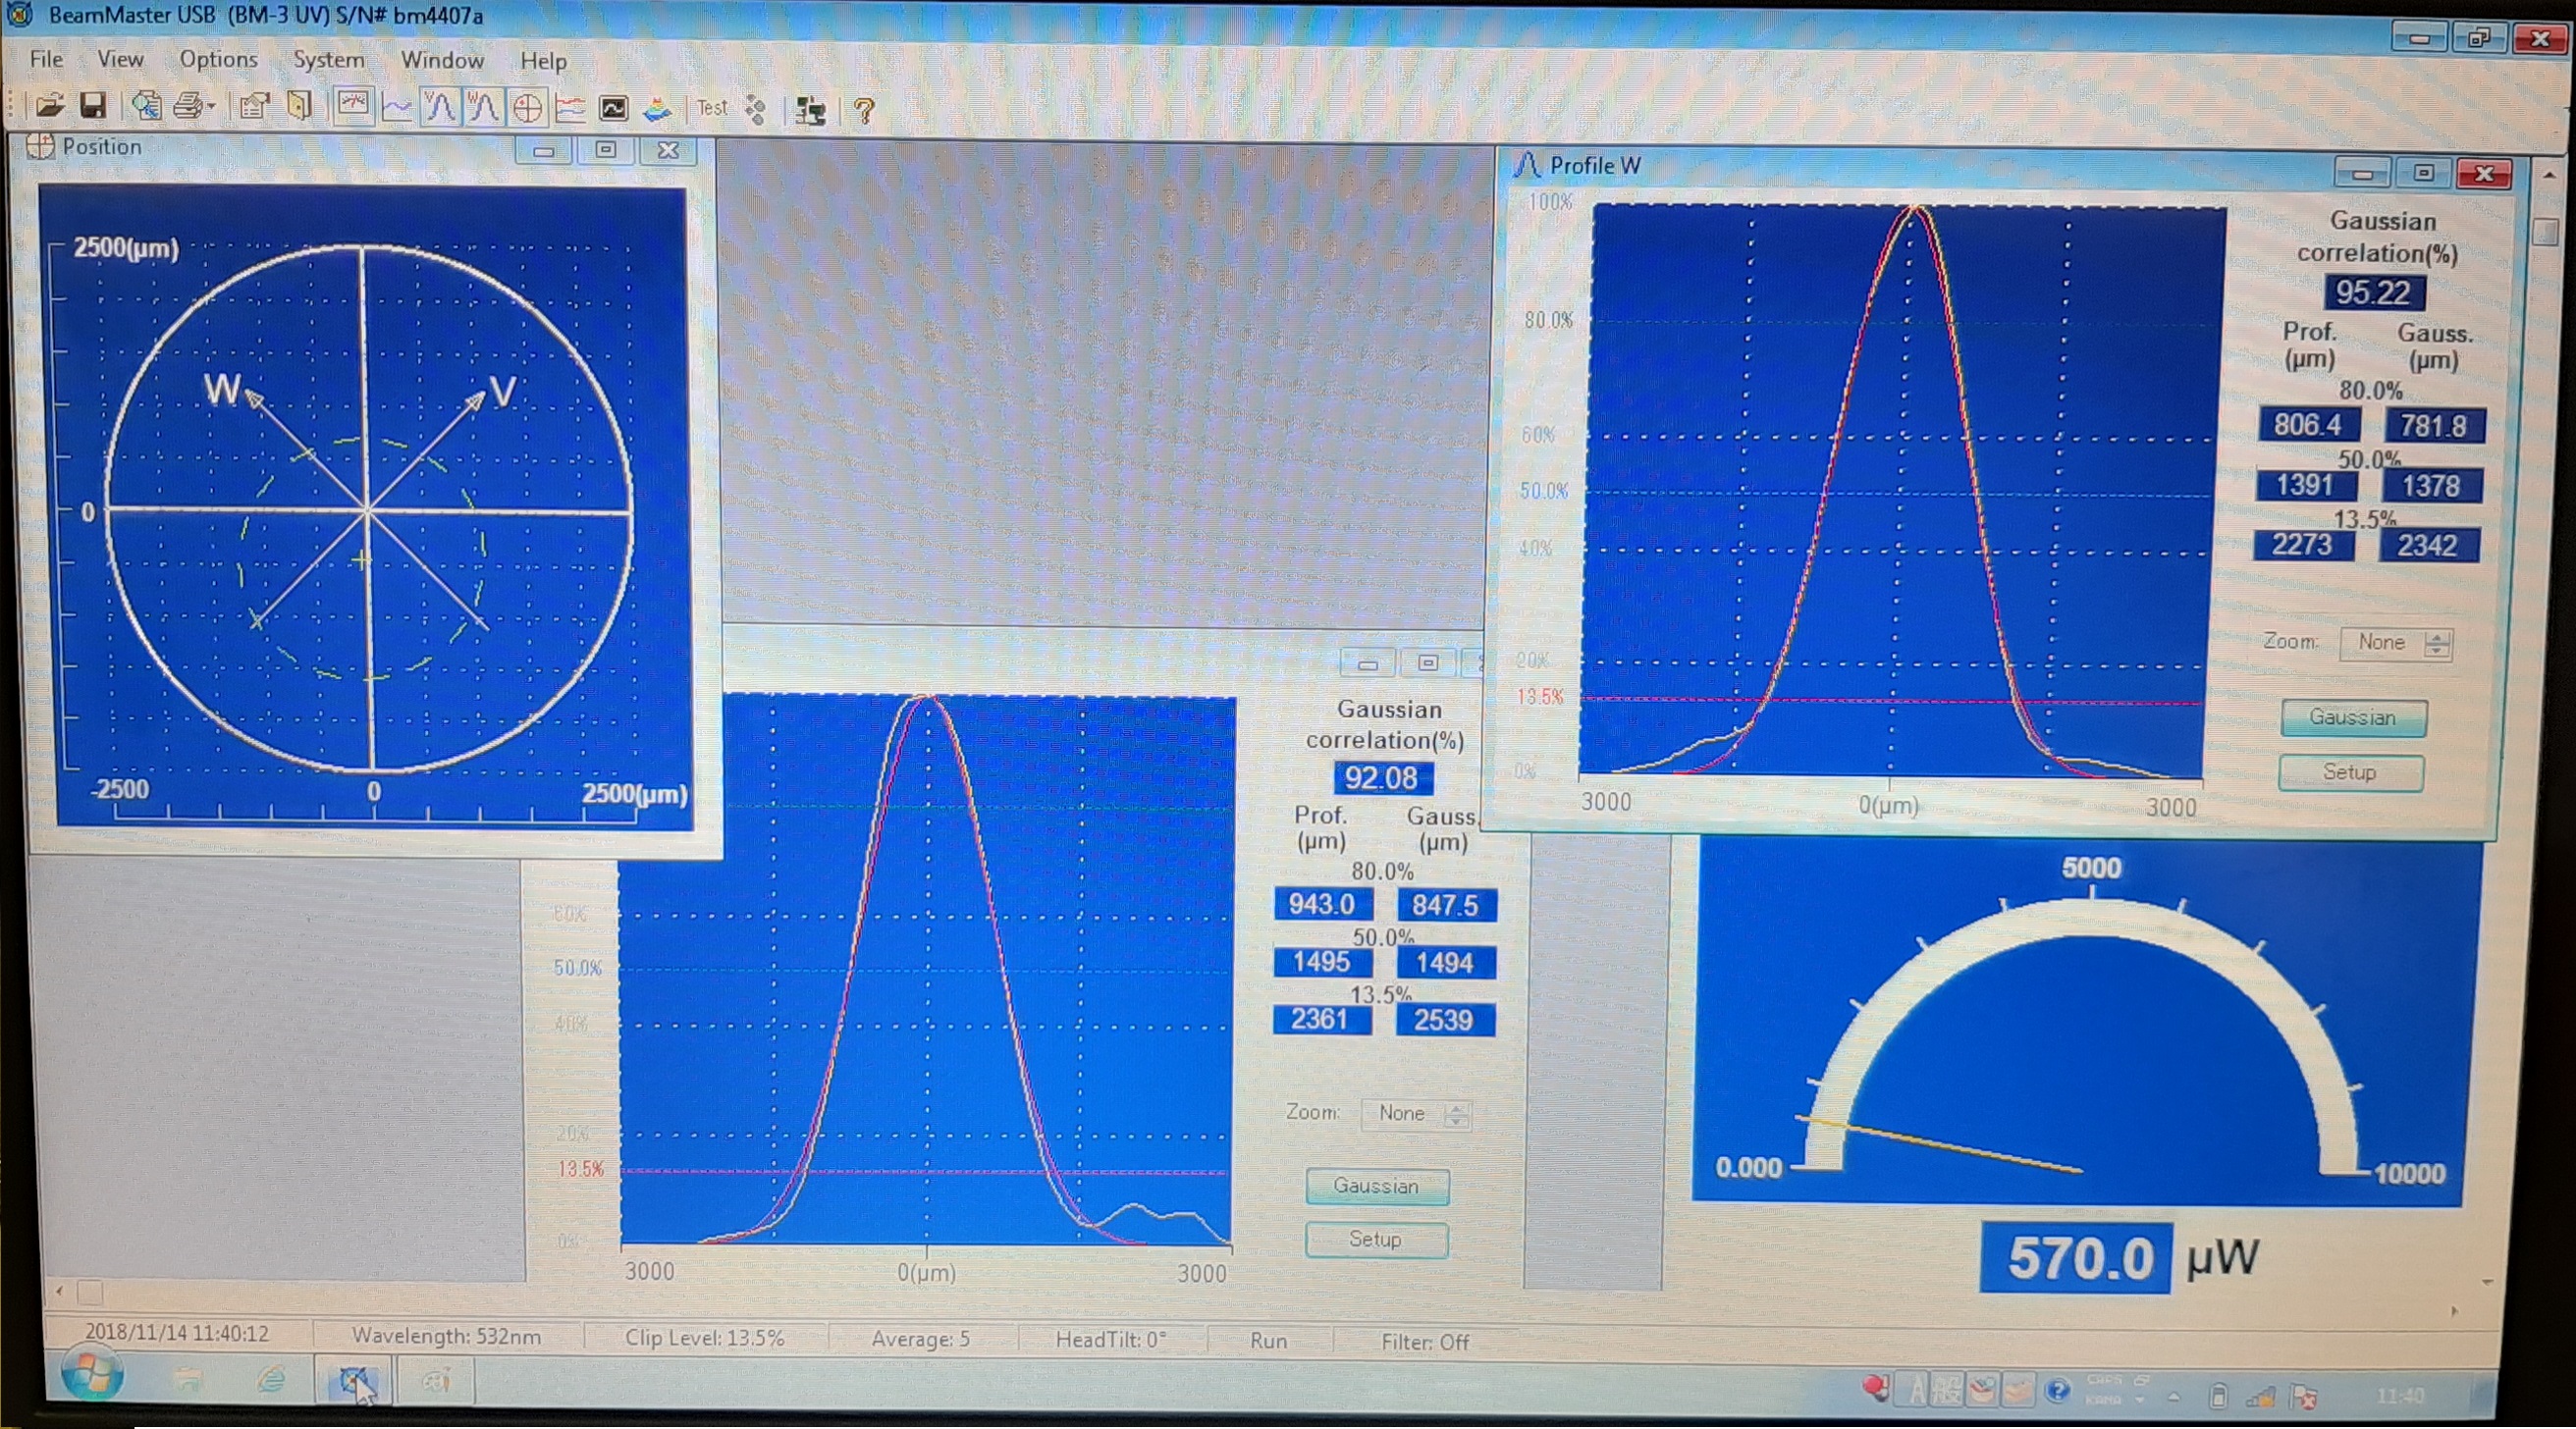
By using the Beam Profiler (Placed on the edge of the optical table), we measure the beam size of the bright alignment beam. (See Fig. 2, a clearer picture will be added soon)
The beam shape is close to circular symmetry and beam size is 2539 um on W-plane and 2342 um on V-plane.
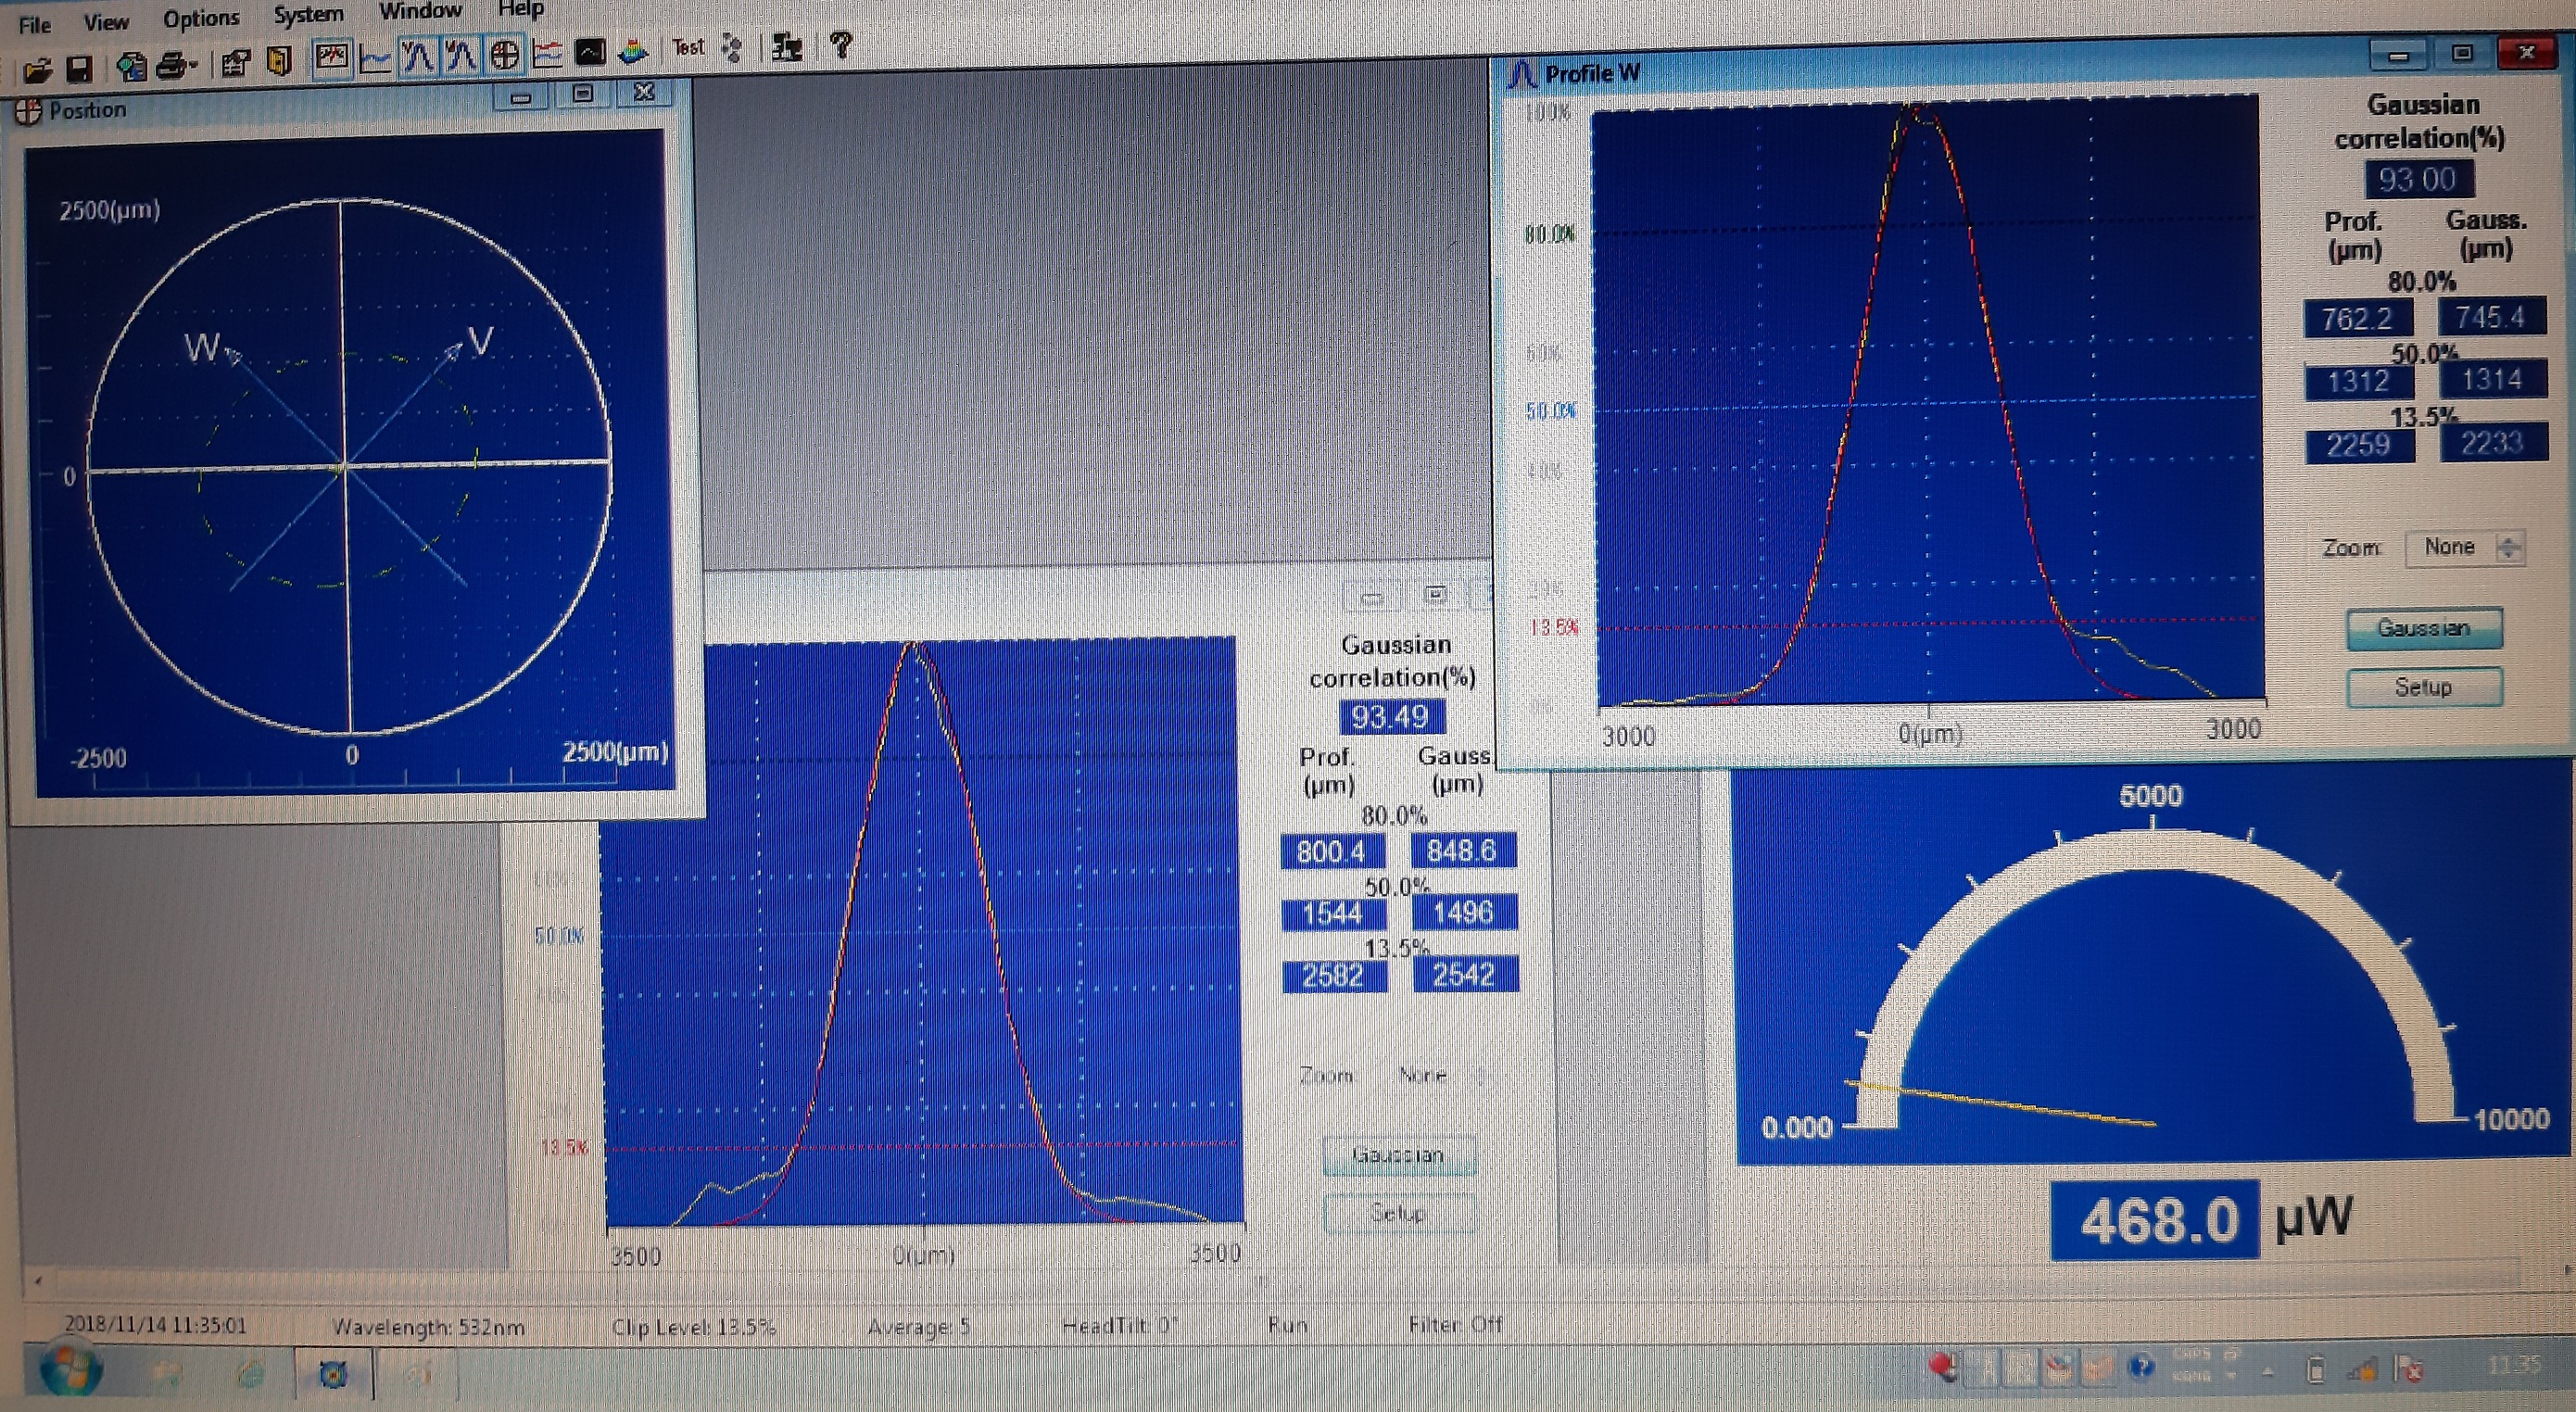
We also check the beam size of Aux laser 1 (CC) by inserting the Mirror M4 placed on the translation stage. (see Fig. 3)
Its shape is ellipse and beam size is 2542 um on W-plane and 2233 um on V-plane.
The size of these two beams is similar.
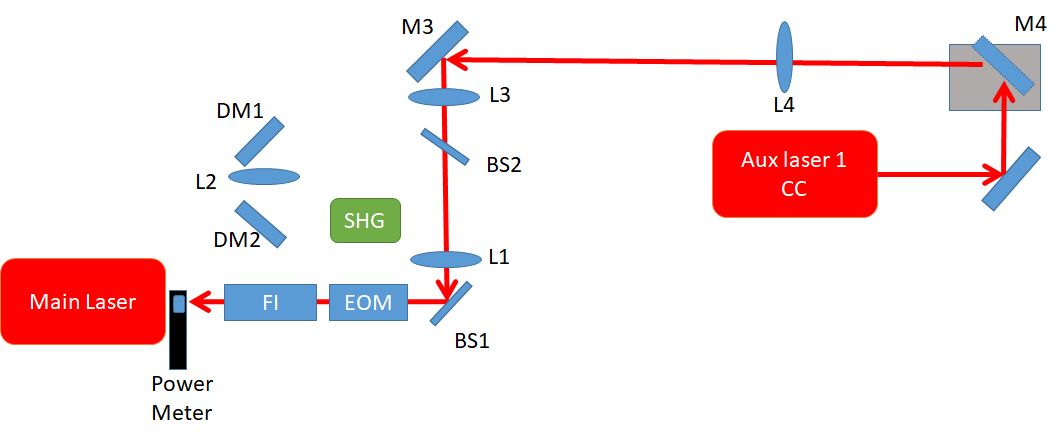
In order to check the isolation of the Faraday Isolator (FI: IO-5-1064-HP), We introduce the light from Aux laser 1 to FI. (See Fig. 4)
By using the power meter, we measure and optimize the isolation of FI is 39.4dB which is confirmed to the spec. (38 ~ 44dB) on Thorlabs website.
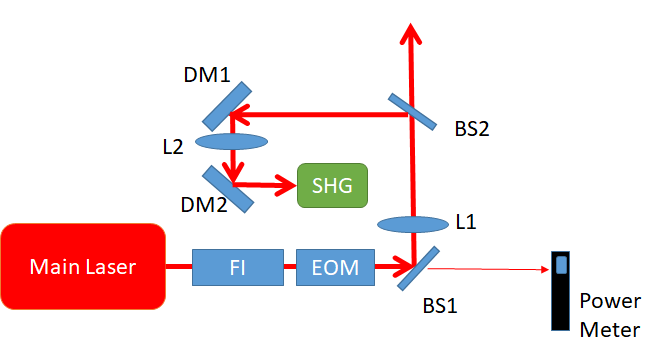
After optimizing the FI, we block the Aux 1 beam and reinstate the main laser beam to the SHG. (see Fig. 5)
By placing the power meter behind the BS1, we can measure the power fluctuation of the main laser beam.
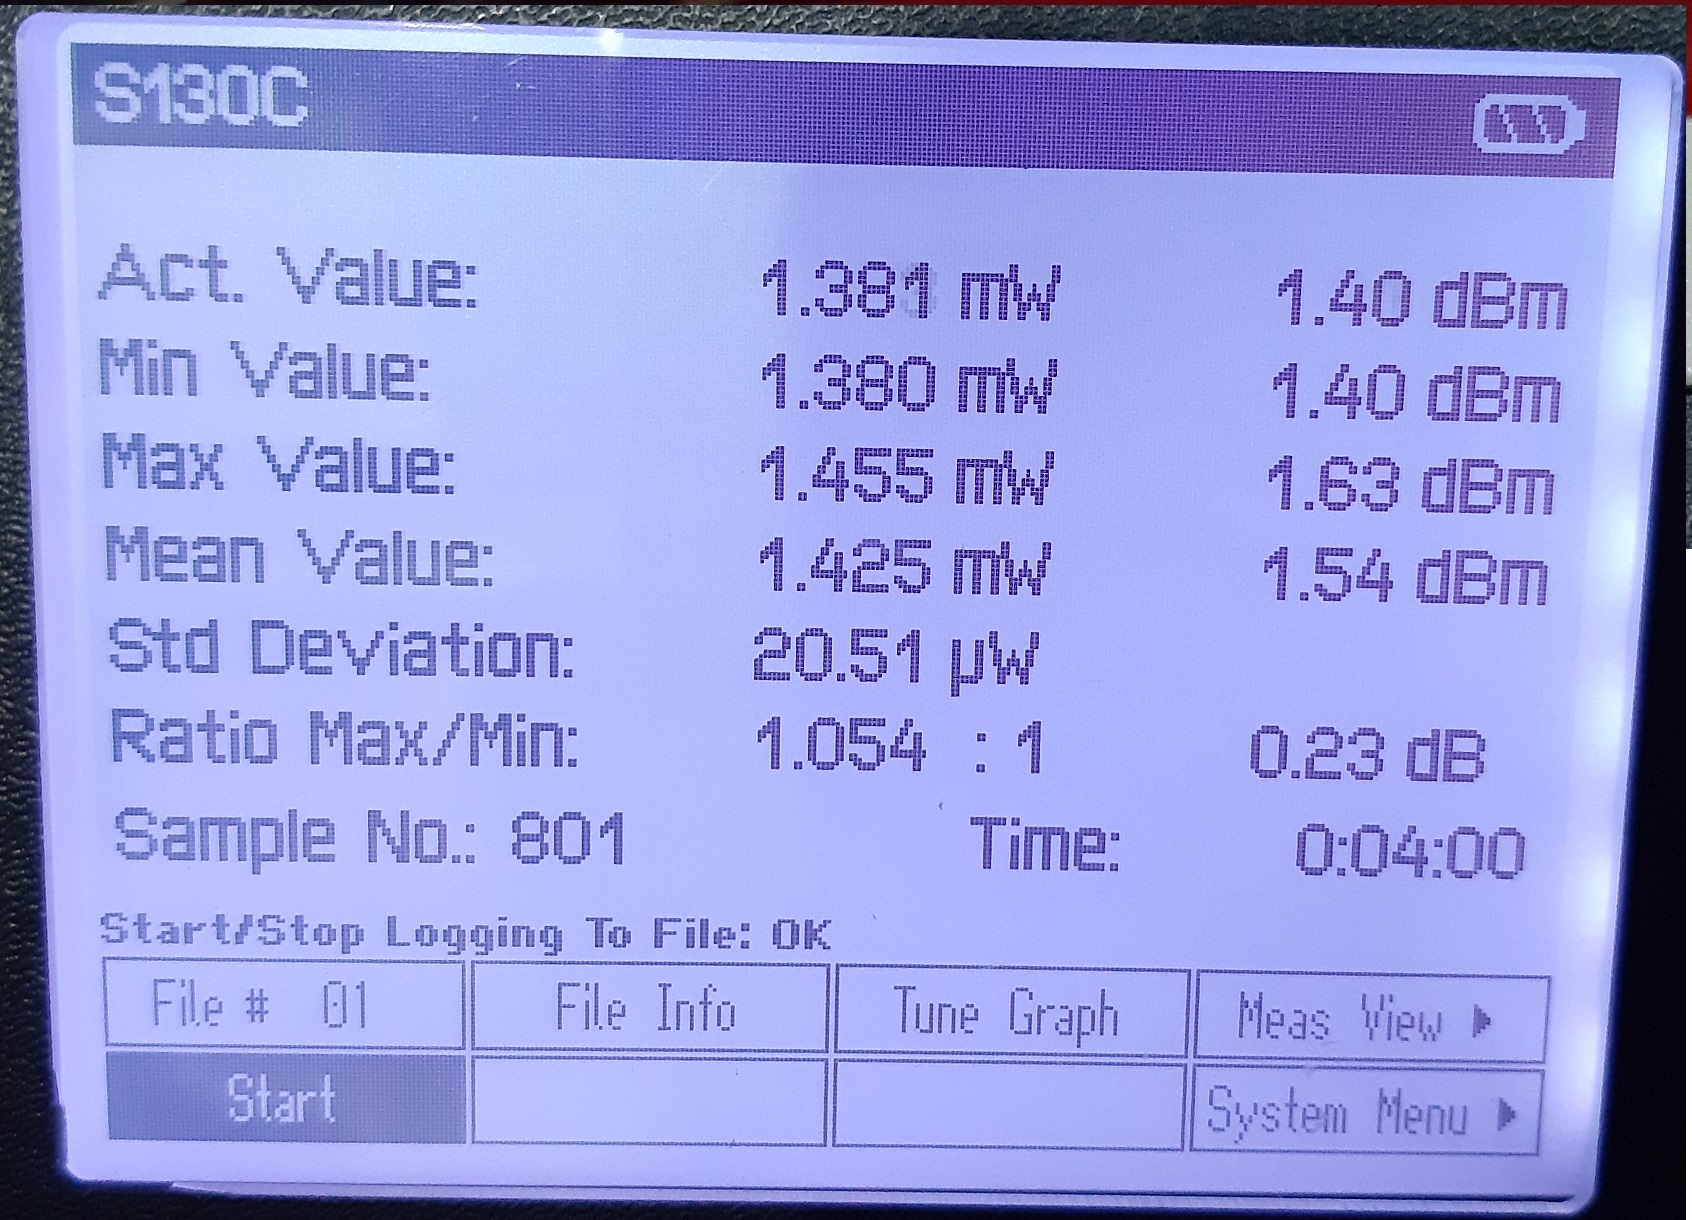
First, we tune the PZT of the SHG to non-resonance state and obtain the ratio Max/Min is 1.054:1 (see Fig. 6)
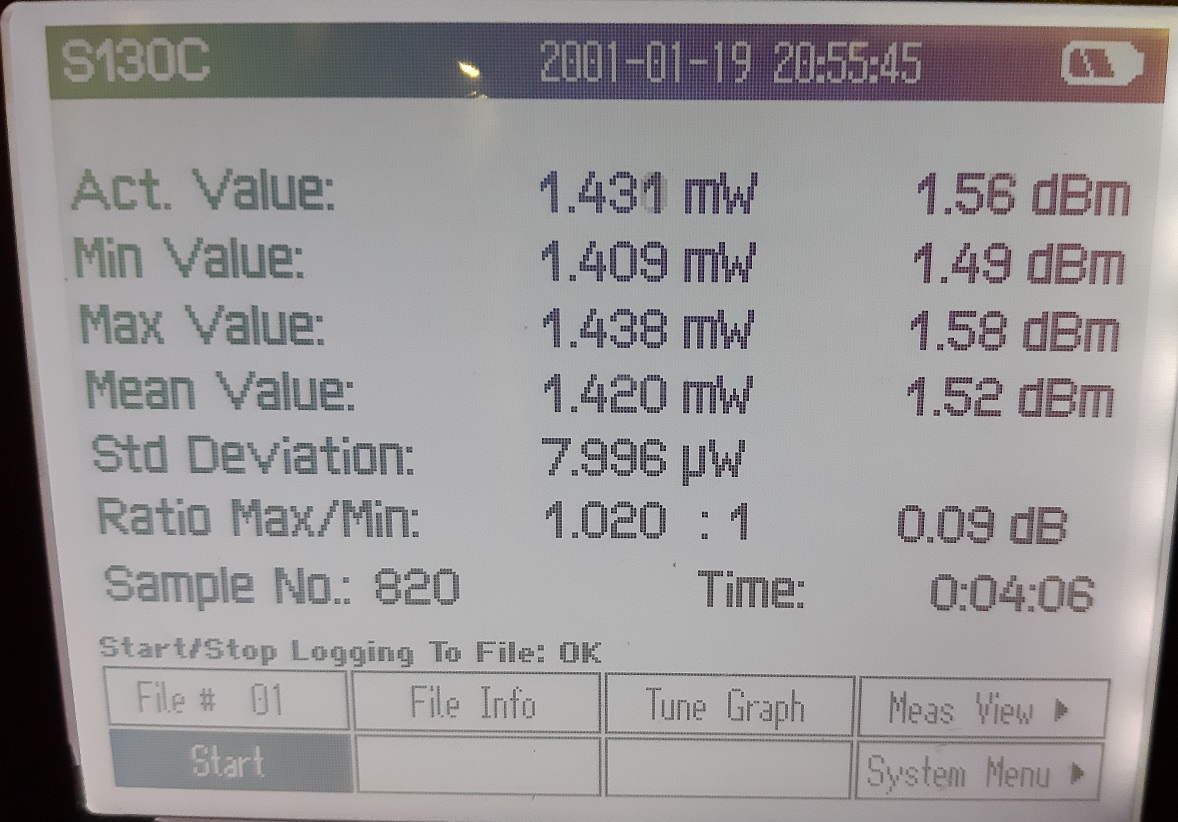
which is larger than the ratio of 1.020:1 when SHG is on-resonance (see Fig. 7).
According to this result, we suspect that the power instability is mostly caused by the 1064 nm feedback light from the SHG cavity.
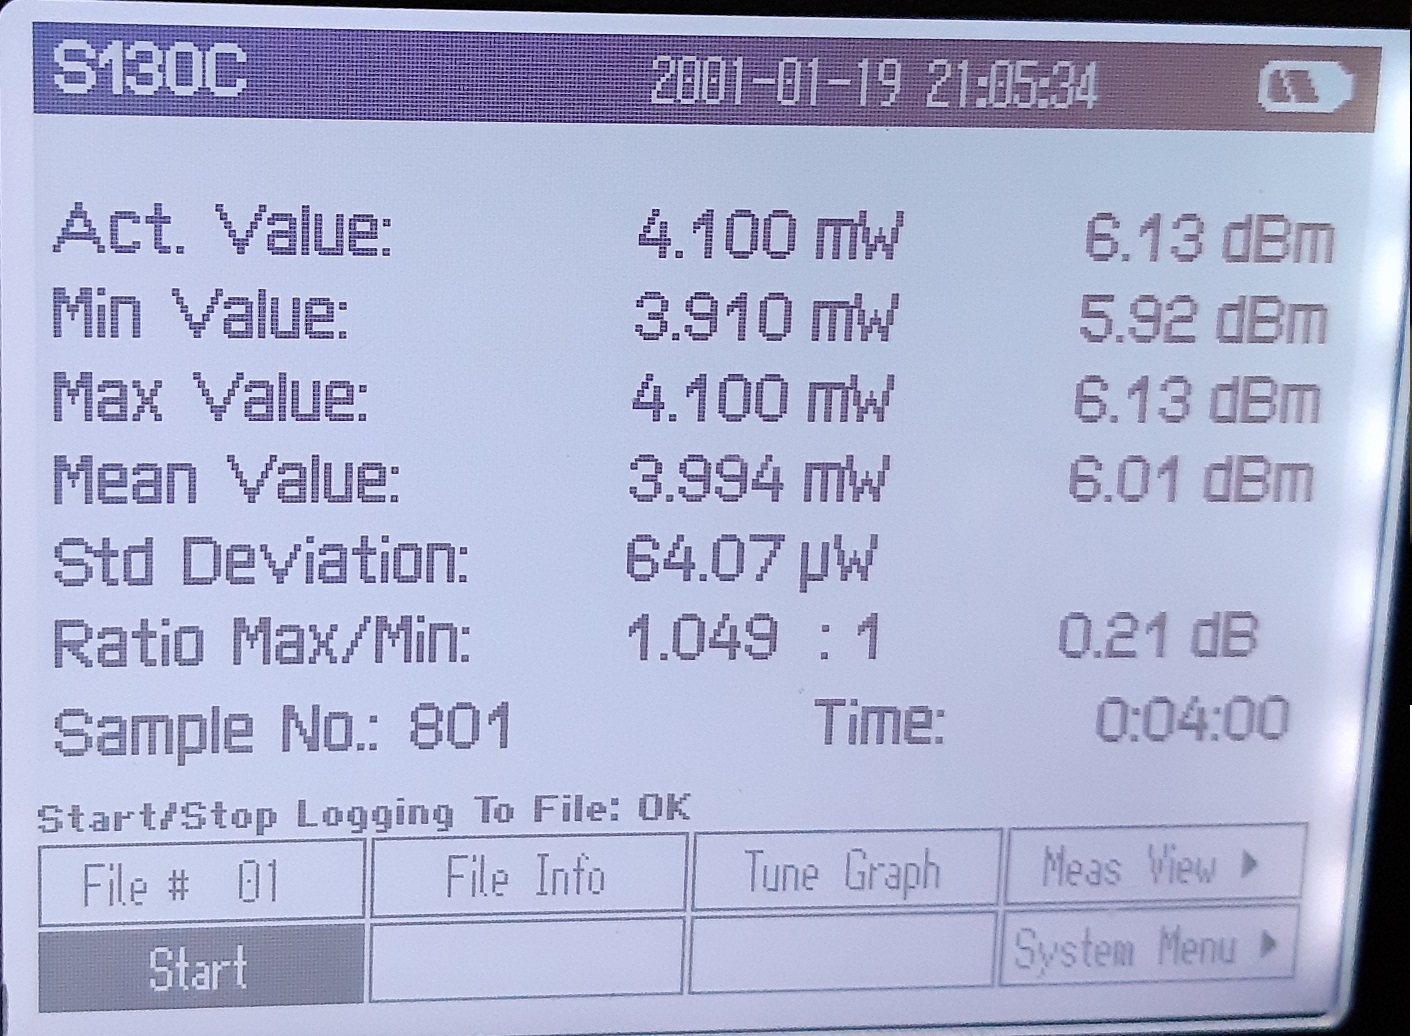
We also measure the ratio of 1.049:1 when increasing the input IR power by 2.8 times ( about 200mW) to SHG. (see Fig. 8).
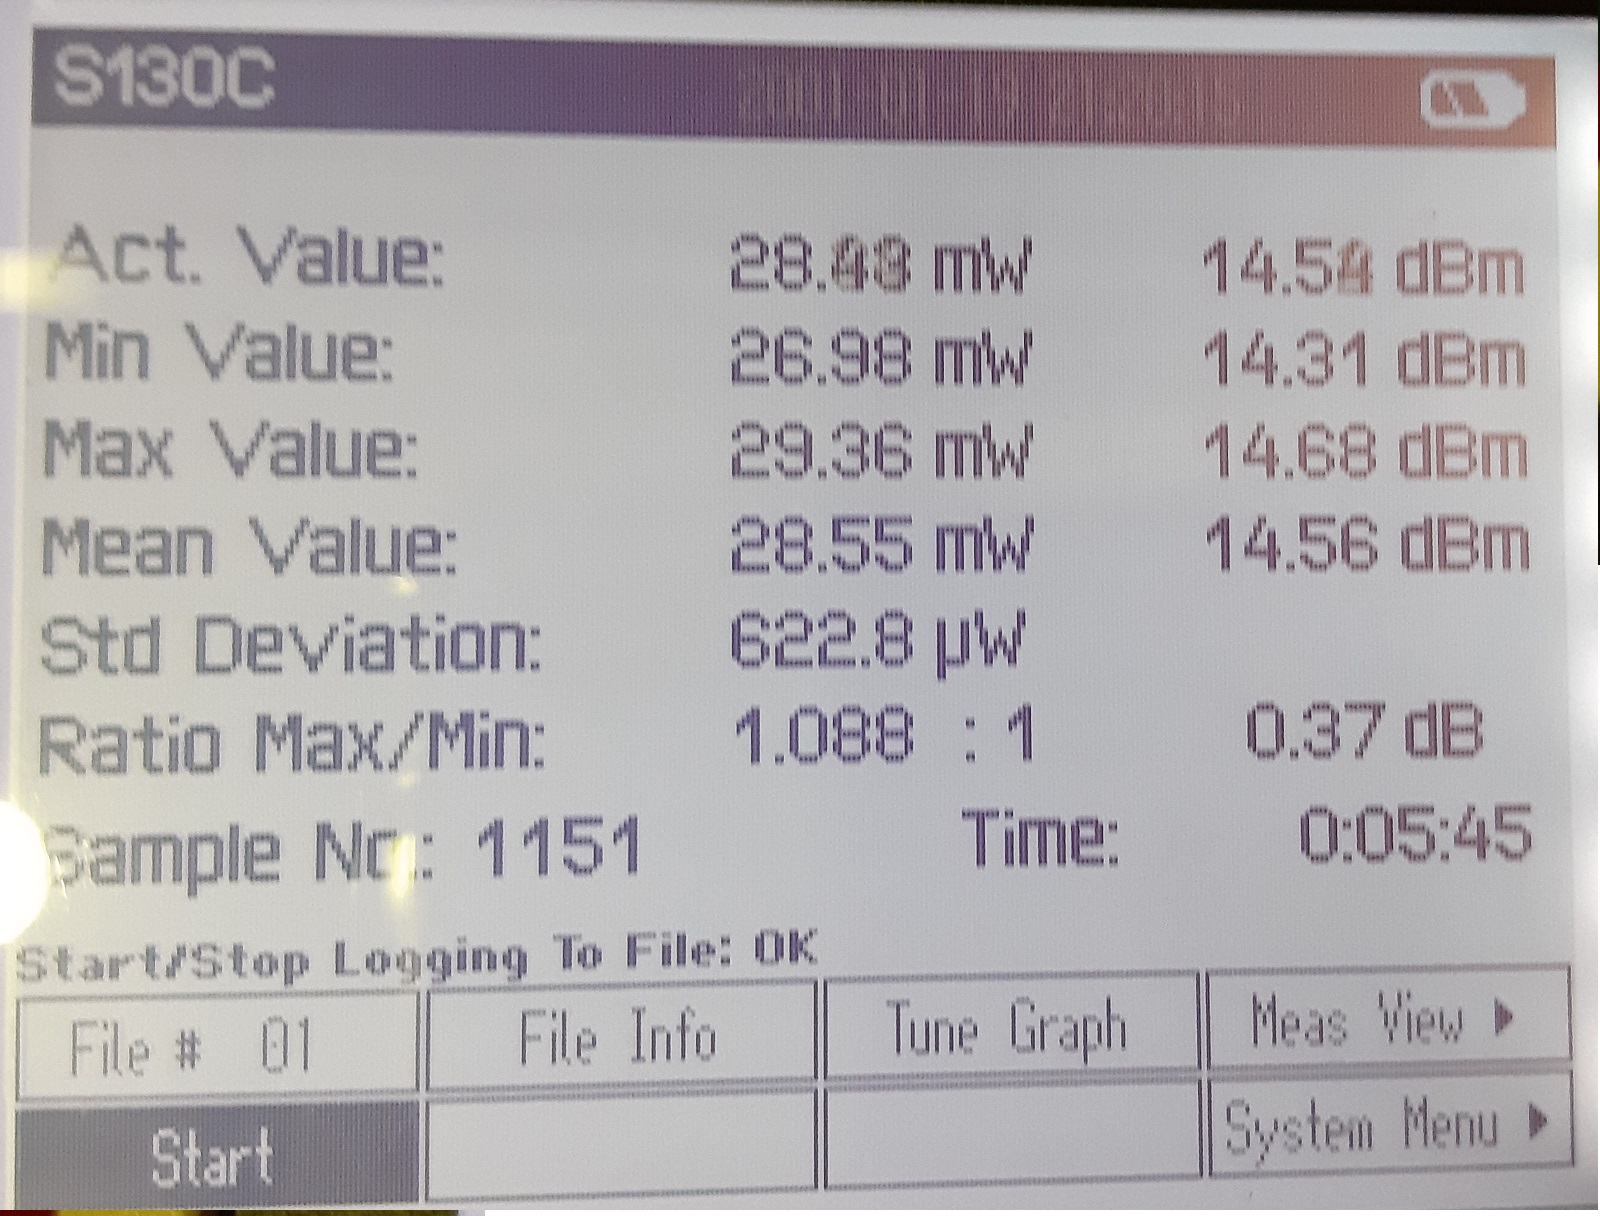
The generated power of 532 nm is 28.4 mW and the ratio Max/Min is 1.088:1 which is the most serious. (see Fig. 9)
Since we have roughly determined that the interference is coming from the 1064 feedback light, we plan to insert another isolator to the main laser light path.
Fortunately, we found another isolator (IO-2-YAG made by OFR) that is not in use. However, the aperture of this isolator is less than or equal to 2 mm while it can work in high power 750 W/cm².
This means that it can bear the case of the input power is 1 w at 1064 nm with the waist of 250 um inside the isolator where the laser fluence is 509.3 W/cm².
Fig. 1 A schematic of the telescope for the bright alignment beam.
Fig. 2 Beam measurement of bright alignment beam.
Fig. 3 Beam measurement of Aux laser 1 beam.
Fig. 4 A schematic of measuring the isolation of FI
Fig. 5 A schematic of measuring the laser power fluctuation.
Fig. 6 Laser Power fluctuation: after optimizing the FI, the SHG cavity is off-resonance
Fig. 7 Laser Power fluctuation: the SHG cavity is on-resonance
Fig. 8 Laser Power fluctuation: the SHG cavity is on-resonance and increasing 1064 nm laser power
Fig. 9 Laser power fluctuation of the SHG 532 nm output