NAOJ GW Elog Logbook 3.2

Simon
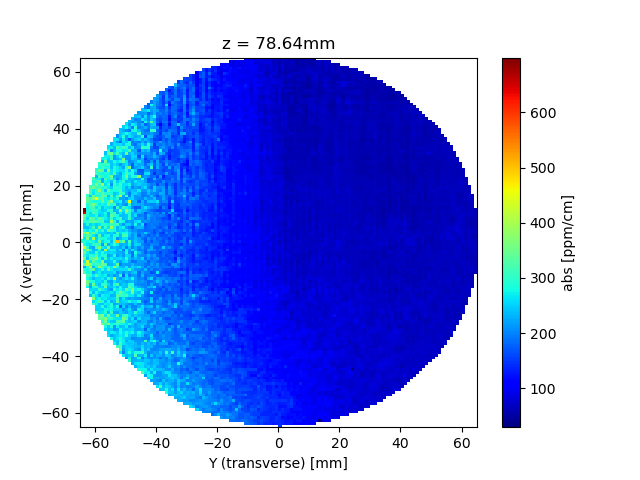
With the recent recalibration of the PCI, I took another XY-map at the center in longitudinal direction. The results are attached as png pictures.
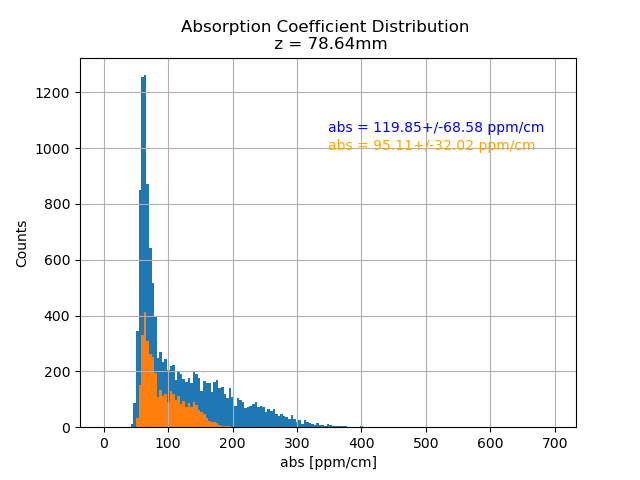
Compared with the results of the measurements before, we can see that the mean value of the absorption coefficient is much lower now (all given in ppm/cm):
| Center + 33mm | Center | Center - 33mm | |
| Measurement on Aug. 15-20 | 159 ± 77 | 195 ± 102 | 342 ± 189 |
| Measurement on Aug. 29 | (107) | 120 ± 69 | (231) |
| Measurements from Caltech | 83 ± 31 | 99 ± 50 | 216 ± 108 |
The numbers in parentheses are those for the older measurements but with the recalibrated bulk-reference value. Note that for the "Center" value of the most recent measurement the absorption coefficient would increase to 177 if using the old reference value.
It would be of course better to see the measured mean-values also for the other Z-positions but I don't know whether there is time.
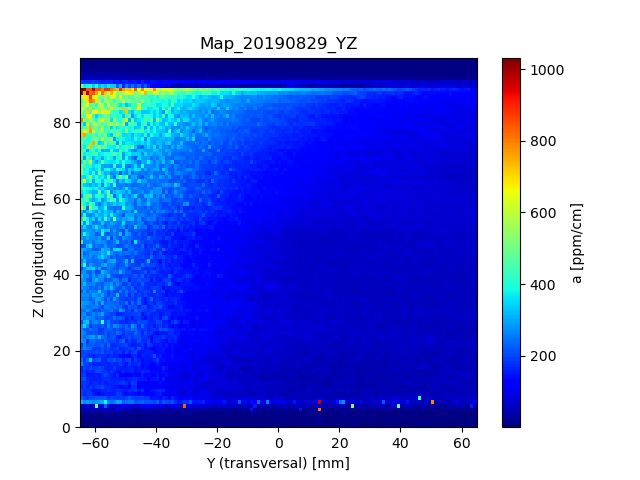
Attached is also a map in YZ-direction, taken at X = 398 (also the center). It clearly shows an increase in absorption toward the outgoing surface (smaller Z) and oriented on the left-hand side (the map shows the situation as seen from above the test-mass with the incoming surface on the bottom).
The mean value within the relevant region (the substrate without the surface) is 148 ± 115 ppm/cm.